Attached files
| file | filename |
|---|---|
| EX-10.26 - CEO RSU AWARD AGREEMENT - Aptiv PLC | d299912dex1026.htm |
| EX-10.25 - FORM OF OFFICER RSU AWARD AGREEMENT - Aptiv PLC | d299912dex1025.htm |
| EX-21.1 - SUBSIDIARIES OF THE REGISTRANT - Aptiv PLC | d299912dex211.htm |
| EX-32.2 - SECTION 906 CERTIFICATION BY CHIEF FINANCIAL OFFICER - Aptiv PLC | d299912dex322.htm |
| EX-23.1 - CONSENT OF ERNST & YOUNG LLP - Aptiv PLC | d299912dex231.htm |
| EX-12.1 - COMPUTATION OF RATIO OF EARNINGS TO FIXED CHARGES - Aptiv PLC | d299912dex121.htm |
| EX-31.2 - RULE 13A-14(A)/15D-14(A) CERTIFICATION OF PRINCIPAL FINANCIAL OFFICER - Aptiv PLC | d299912dex312.htm |
| EX-31.1 - RULE 13A-14(A)/15D-14(A) CERTIFICATION OF PRINCIPAL EXECUTIVE OFFICER - Aptiv PLC | d299912dex311.htm |
| EX-32.1 - SECTION 906 CERTIFICATION BY CHIEF EXECUTIVE OFFICER - Aptiv PLC | d299912dex321.htm |
| EX-10.27 - FORM OF OFFICER RSU AWARD AGREEMENT - Aptiv PLC | d299912dex1027.htm |
Table of Contents
UNITED STATES
SECURITIES AND EXCHANGE COMMISSION
Washington, D.C. 20549
FORM 10-K
| x | ANNUAL REPORT PURSUANT TO SECTION 13 OR 15(d) OF THE SECURITIES EXCHANGE ACT OF 1934 |
For the fiscal year ended December 31, 2011
OR
| ¨ | TRANSITION REPORT PURSUANT TO SECTION 13 OR 15(d) OF THE SECURITIES EXCHANGE ACT OF 1934 |
For the transition period from to .
Commission file number: 001-35346
DELPHI AUTOMOTIVE PLC
(Exact name of registrant as specified in its charter)
| Jersey | Not Applicable | |
| (State or other jurisdiction of incorporation or organization) |
(I.R.S. Employer Identification No.) |
Courtney Road
Hoath Way
Gillingham, Kent ME8 0RU
United Kingdom
(Address of principal executive offices)
011-44-163-423-4422
(Registrant’s telephone number, including area code)
Securities registered pursuant to Section 12(b) of the Act:
| Title of class |
Name of Each Exchange on which Registered | |
| Ordinary Shares, $0.01 par value per share | New York Stock Exchange |
Securities registered pursuant to Section 12(g) of the Act: None
Indicate by check mark if the registrant is a well-known seasoned issuer, as defined in Rule 405 of the Securities Act. Yes ¨. No x
Indicate by check mark if the registrant is not required to file reports pursuant to Section 13 or Section 15(d) of the Act. Yes ¨. No x
Indicate by check mark whether the registrant (1) has filed all reports required to be filed by Section 13 or 15(d) of the Securities Exchange Act of 1934 during the preceding 12 months (or for such shorter period that the registrant was required to file such reports), and (2) has been subject to such filing requirements for the past 90 days. Yes x. No ¨.
Indicate by check mark whether the registrant has submitted electronically and posted on its corporate Web site, if any, every Interactive Data File required to be submitted and posted pursuant to Rule 405 S-T during the preceding 12 months (or for such shorter period that the registrant was required to submit and post such files). Yes ¨. No x.
Indicate by check mark if disclosure of delinquent filers pursuant to Item 405 of Regulation S-K is not contained herein, and will not be contained, to the best of registrant’s knowledge, in definitive proxy or information statements incorporated by reference in Part III of this Form 10-K or any amendment to this Form 10-K. ¨.
Indicate by check mark whether the registrant is a large accelerated filer, an accelerated filer, a non-accelerated filer, or a smaller reporting company. See the definitions of “large accelerated filer,” “accelerated filer” and “smaller reporting company” in Rule 12b-2 of the Exchange Act. (Check one):
| Large accelerated filer ¨. | Accelerated filer ¨. | Non-accelerated filer x. | Smaller reporting company ¨. | |||
| (Do not check if a smaller reporting company) | ||||||
Indicate by check mark whether the registrant is a shell company (as defined in Rule 12b-2 of the Exchange Act). Yes ¨. No x.
The registrant completed the initial public offering of its ordinary shares, $0.01 par value per share, on November 22, 2011, Accordingly, as of June 30, 2011, the aggregate market value of the registrant’s ordinary shares held by non-affiliates of the registrant, was $0 million.
The number of the registrant’s ordinary shares outstanding, $0.01 par value per share as of February 15, 2012, was 328,244,510.
DOCUMENTS INCORPORATED BY REFERENCE
Portions of the registrant’s definitive Proxy Statement related to the 2012 Annual Shareholders Meeting to be filed subsequently are incorporated by reference into Part III of this Form 10-K.
Table of Contents
DELPHI AUTOMOTIVE PLC
2
Table of Contents
CAUTIONARY STATEMENT REGARDING FORWARD-LOOKING INFORMATION
This Annual Report on Form 10-K, including the exhibits being filed as part of this report, as well as other statements made by Delphi Automotive PLC (“Delphi,” the “Company,” “we,” “us” and “our”), contain forward-looking statements that reflect, when made, the Company’s current views with respect to current events and financial performance. Such forward-looking statements are subject to many risks, uncertainties and factors relating to the Company’s operations and business environment, which may cause the actual results of the Company to be materially different from any future results, express or implied, by such forward-looking statements. All statements that address future operating, financial or business performance or the Company’s strategies or expectations are forward-looking statements. In some cases, you can identify these statements by forward-looking words such as “may,” “might,” “will,” “should,” “expects,” “plans,” “intends,” “anticipates,” “believes,” “estimates,” “predicts,” “projects,” “potential,” “outlook” or “continue,” and other comparable terminology. Factors that could cause actual results to differ materially from these forward-looking statements include, but are not limited to, the following: global economic conditions, including conditions affecting the credit market; the cyclical nature of automotive sales and production; the potential disruptions in the supply of and changes in the competitive environment for raw material integral to the Company’s products; the Company’s ability to maintain contracts that are critical to its operations; the ability of the Company to attract, motivate and/or retain key executives; the ability of the Company to avoid or continue to operate during a strike, or partial work stoppage or slow down by any of its unionized employees or those of its principal customers, and the ability of the Company to attract and retain customers. Additional factors are discussed under the captions “Risk Factors” and “Management’s Discussion and Analysis of Financial Condition and Results of Operations” in the Company’s filings with the Securities and Exchange Commission. New risks and uncertainties arise from time to time, and it is impossible for us to predict these events or how they may affect the Company. It should be remembered that the price of the ordinary shares and any income from them can go down as well as up. Delphi disclaims any intention or obligation to update or revise any forward-looking statements, whether as a result of new information, future events and/or otherwise, except as may be required by law.
3
Table of Contents
PART I
“Delphi,” the “Company,” the “Successor,” “we,” “us” and “our” refer to Delphi Automotive PLC, a public limited company which was formed under the laws of Jersey on May 19, 2011, together with its subsidiaries, including Delphi Automotive LLP, a limited liability partnership incorporated under the laws of England and Wales which was formed on August 19, 2009 for the purpose of acquiring certain assets of the former Delphi Corporation, and became a subsidiary of Delphi Automotive PLC in connection with the completion of the Company’s initial public offering on November 22, 2011. The former Delphi Corporation and, as the context may require, its subsidiaries and affiliates, are referred to herein as the “Predecessor” or “Old Delphi”.
We are a leading global vehicle components manufacturer and provide electrical and electronic, powertrain, safety and thermal technology solutions to the global automotive and commercial vehicle markets. We are one of the largest vehicle component manufacturers, and our customers include 24 of the 25 largest automotive original equipment manufacturers (“OEMs”) in the world. We operate 114 major manufacturing facilities and 15 major technical centers utilizing a regional service model that enables us to efficiently and effectively serve our global customers from low cost countries. We have a presence in 30 countries and have over 17,000 scientists, engineers and technicians focused on developing market relevant product solutions for our customers. In line with the growth in emerging markets, we have been increasing our focus on these markets, particularly China, where we have a major manufacturing base and strong customer relationships.
Website Access to Company’s Reports
Delphi’s internet website address is www.delphi.com. Our Annual Reports on Form 10-K, quarterly reports on Form 10-Q, current reports on Form 8-K, and amendments to those reports filed or furnished pursuant to section 13(a) or 15(d) of the Exchange Act are available free of charge through our website as soon as reasonably practicable after they are electronically filed with, or furnished to, the Securities and Exchange Commission.
Our History
In October 2005, the Predecessor and certain of its United States (“U.S.”) subsidiaries (collectively, the “Debtors”) filed voluntary petitions for reorganization relief under Chapter 11 of the United States Bankruptcy Code (the “Bankruptcy Code”) in the United States Bankruptcy Court for the Southern District of New York (the “Bankruptcy Court”). Collectively, the Debtors’ October 2005 filings are herein referred to as the “Chapter 11 Filings.” On July 30, 2009, the Bankruptcy Court approved modifications to the First Amended Joint Plan Of Reorganization Of Delphi Corporation And Certain Affiliates, Debtors And Debtors-In-Possession (As Modified) (the “Modified Plan”), which incorporated the master disposition agreement among the Predecessor, GM Component Holdings LLC, Motors Liquidation Company (“Old GM”), General Motors Company (“GM”) and DIP Holdco 3, LLC, for the sale and purchase of substantially all of the Predecessor’s businesses. On October 6, 2009 (the “Acquisition Date”) the Predecessor emerged from chapter 11 in accordance with the Modified Plan. Through the Acquisition Date, the Debtors operated their businesses as “debtors-in-possession” under the jurisdiction of the Bankruptcy Court and in accordance with the applicable provisions of the Bankruptcy Code and orders of the Bankruptcy Court. The Predecessor’s non-U.S. subsidiaries were not included in the Chapter 11 Filings, continued their business operations without supervision from the Bankruptcy Court and were not subject to the requirements of the Bankruptcy Code.
On August 19, 2009, Delphi Automotive LLP, a limited liability partnership organized under the laws of England and Wales, was formed for the purpose of acquiring certain assets and subsidiaries of the Predecessor, as discussed below.
On the Acquisition Date, the Predecessor (i) consummated the transactions contemplated by the Modified Plan and (ii) exited chapter 11 as DPH Holdings Corp. and its subsidiaries and affiliates (“DPHH”), except that
4
Table of Contents
two of the Predecessor’s debtor subsidiaries became subsidiaries of Delphi Automotive LLP. As a result of the Acquisition, Delphi Automotive LLP acquired the major portion of the business of the Predecessor and this business constituted the entirety of the operations of the Successor, as defined below.
On March 31, 2011, all of the outstanding Class A and Class C membership interests held by GM and the Pension Benefit Guaranty Corporation (“PBGC”) were redeemed, respectively, for approximately $4.4 billion. The redemption transaction was funded by a $3.0 billion credit facility entered into on March 31, 2011 (the “Credit Facility”) and existing cash.
On May 19, 2011, Delphi Automotive PLC was formed as a Jersey public limited company, and had nominal assets, no liabilities and had conducted no operations prior to its initial public offering. On November 22, 2011, in conjunction with the completion of its initial public offering by the selling shareholders, all of the outstanding equity of Delphi Automotive LLP was exchanged for ordinary shares in Delphi Automotive PLC. As a result, Delphi Automotive LLP became a wholly-owned subsidiary of Delphi Automotive PLC.
Our Company
We believe the automotive industry is being shaped by increasing government regulations for vehicle safety, fuel efficiency and emissions control, as well as rapidly increasing consumer demand for connectivity. These industry mega trends, which we refer to as “Safe,” “Green” and “Connected,” are driving higher growth in products that address these trends than growth in the automotive industry overall. We have organized our business into four diversified segments, which enable us to develop solutions and manufacture highly-engineered products that enable our customers to respond to these mega trends:
| • | Electrical / Electronic Architecture—This segment provides complete design of the vehicle’s electrical architecture, including connectors, wiring assemblies and harnesses, electrical centers and hybrid high voltage and safety distribution systems. Our products provide the critical electrical and electronics backbone that supports increased vehicle content and electrification, reduced emissions and higher fuel economy through weight savings. |
| • | Powertrain Systems—This segment provides systems integration of full end-to-end gasoline and diesel engine management systems including fuel handling, fuel injection, combustion, electronic controls, test and validation capabilities, diesel and automotive aftermarket, and original equipment services. We design solutions to optimize powertrain power and performance while helping our customers meet new emissions and fuel economy regulations. |
| • | Electronics and Safety—This segment provides critical components, systems and advanced software for passenger safety, security, comfort and infotainment, as well as vehicle operation, including body controls, reception systems, infotainment and connectivity systems, hybrid vehicle power electronics, passive and active safety electronics, displays and mechatronics. Our products integrate and optimize electronic content, which improves fuel economy, reduces emissions, increases safety and provides occupant infotainment and connectivity. |
| • | Thermal Systems—This segment provides powertrain cooling and heating, ventilating and air conditioning (“HVAC”) systems, such as compressors, systems and controls, and heat exchangers for the vehicle markets. Our products improve the efficiency by which the powertrain and cabin temperatures are managed, which are critical factors in achieving increased fuel economy and reduced emissions. |
Financial Information about Business Segments
We operate our core business along four operating segments, which are grouped on the basis of similar product, market, and operating factors.
5
Table of Contents
Net Sales by Segment
| Successor | Predecessor | |||||||||||||||||||||||||||||||||
| Year Ended December 31, 2011 | Year Ended December 31, 2010 | Period from August 19 to December 31, 2009 |
Period from January 1 to October 6, 2009 |
|||||||||||||||||||||||||||||||
| Net sales | % of Total | Net sales | % of Total | Net sales | % of Total | Net sales | % of Total | |||||||||||||||||||||||||||
| (in millions excluding percentages) | (in millions excluding percentages) |
|||||||||||||||||||||||||||||||||
| Electrical/Electronic Architecture |
$ | 6,642 | 41 | % | $ | 5,620 | 41 | % | $ | 1,325 | 39 | % | $ | 2,970 | 36% | |||||||||||||||||||
| Powertrain Systems |
4,970 | 31 | % | 4,086 | 29 | % | 957 | 28 | % | 2,667 | 32% | |||||||||||||||||||||||
| Electronics and Safety |
2,931 | 18 | % | 2,721 | 20 | % | 761 | 22 | % | 1,801 | 21% | |||||||||||||||||||||||
| Thermal Systems |
1,755 | 11 | % | 1,603 | 12 | % | 365 | 11 | % | 1,008 | 12% | |||||||||||||||||||||||
| Eliminations and Other |
(257) | (1 | )% | (213) | (2 | )% | 13 | 0 | % | (112) | (1)% | |||||||||||||||||||||||
|
|
|
|
|
|
|
|
|
|||||||||||||||||||||||||||
| Total |
$ | 16,041 | $ | 13,817 | $ | 3,421 | $ | 8,334 | ||||||||||||||||||||||||||
|
|
|
|
|
|
|
|
|
|||||||||||||||||||||||||||
Refer to Results of Operations by Segment in Item 7. Management’s Discussion and Analysis and Note 23. Segment Reporting of the notes to the consolidated financial statements, included in Item 8. Financial Statements and Supplementary Data of this Annual Report for further financial information about business segments.
Our business is diversified across end-markets, regions, customers, vehicle platforms and products. Our customer base includes 24 of the 25 largest automotive OEMs in the world, and, in 2011, 23% of our net sales came from emerging markets (Asia Pacific and South America). Our six largest platforms in 2011 were with six different OEMs. In addition, in 2011 our products were found in 17 of the 20 top-selling vehicle models in the United States, in all of the 20 top-selling vehicle models in Europe and in 13 of the 20 top-selling vehicle models in China. We have further diversified our business by increasing our sales in the commercial vehicle market, which is typically on a different business cycle than the light vehicle market and has grown to 8% of our 2011 net sales. In addition, approximately 7% of our 2011 net sales were to the aftermarket, which meets the ongoing need for replacement parts required for vehicle servicing.
We have established a worldwide design and manufacturing footprint with a regional service model that enables us to efficiently and effectively serve our global customers from low cost countries. This regional model is structured primarily to service the North American market from Mexico, the South American market from Brazil, the European market from Eastern Europe and North Africa, and the Asia Pacific market from China. Our global scale and regional service model enables us to engineer globally and execute regionally to serve the largest OEMs, which are seeking suppliers that can serve them on a worldwide basis. Our footprint also enables us to adapt to the regional design variations the global OEMs require and serve the emerging market OEMs.
Our Industry
The automotive parts industry provides components, systems, subsystems and modules to OEMs for the manufacture of new vehicles, as well as to the aftermarket for use as replacement parts for current production and older vehicles. Overall, we expect long-term growth of vehicle sales and production in the OEM market. In 2010 and 2011, the industry has seen increased customer sales and production schedules, and an improved sales mix with greater per vehicle content. However, current OEM production volumes in North America and Western Europe remain substantially lower than OEM production volumes prior to the disruptions that the economic and credit markets experienced in 2008 and 2009. Demand for automotive parts in the OEM market is generally a function of the number of new vehicles produced, which is primarily driven by macro-economic factors such as credit availability, interest rates, fuel prices, consumer confidence, employment and other trends. Although OEM demand is tied to actual vehicle production, participants in the automotive parts industry also have the opportunity to grow through increasing product content per vehicle by further penetrating business with existing customers and in existing markets, gaining new customers and increasing their presence in global markets. We believe that as a company with a global presence and advanced technology, engineering, manufacturing and customer support capabilities, we are well-positioned to benefit from these opportunities.
6
Table of Contents
We believe that continuously increasing demands of society have created the emergence of three “mega trends” that will serve as the basis for the next wave of market-driven technology advancement. Our challenge is to continue developing leading edge technology focused on addressing these mega trends, and apply that technology toward products with sustainable margins that enable our customers, both OEMs and others, to produce distinctive market-leading products. We have identified a core portfolio of products that draw on our technical strengths and align with these “mega trends” where we believe we can provide differentiation to our automotive, commercial vehicle and aftermarket customers.
Safe. The first mega-trend, “Safe,” represents technologies aimed not just at protecting vehicle occupants when a crash occurs, but those that actually proactively reduce the risk of a crash occurring. OEMs continue to focus on improving occupant and pedestrian safety in order to meet increasingly stringent regulatory requirements in various markets, such as the recent proposal by the U.S. National Highway Traffic Safety Administration to mandate rear view cameras in all vehicles by 2014. As a result, suppliers are focused on developing technologies aimed at protecting vehicle occupants when a crash occurs, as well as those that proactively mitigate the risk of a crash occurring. Examples of new and alternative technologies are lane departure warning systems and collision avoidance technologies, which incorporate sophisticated electronics and advanced software.
Green. The second mega-trend, “Green,” represents technologies designed to help reduce emissions, increase fuel economy and minimize the environmental impact of vehicles. Green is a key mega-trend today because of the convergence of several issues: climate change, higher oil prices, increased concern about oil dependence and recent and pending legislation in the U.S. and overseas regarding fuel economy and carbon dioxide emissions. OEMs continue to focus on improving fuel efficiency and reducing emissions in order to meet increasingly stringent regulatory requirements in various markets. On a worldwide basis, the relevant authorities in the European Union, the United States, China, India, Japan, Brazil, South Korea and Argentina have already instituted regulations requiring further reductions in emissions and/or increased fuel economy through 2016. In many cases, the same authorities have initiated legislation that would further tighten the standards through 2020 and beyond. Based on proposed European legislation, we believe OEMs may be required to reduce fleet average CO2 emissions for passenger cars by approximately 20% from 120 grams/kilometer, or approximately 194 grams/mile, in 2012 to 95 grams/kilometer, or approximately 153 grams/mile, by 2020. Based on the current regulatory environment, we believe that OEMs in other parts of the world, including the U.S. and China, will be subject to even greater reductions in CO2 emissions from their current levels over the next ten years. These standards will require meaningful innovation as OEMs and suppliers are forced to find ways to improve thermal management, engine management, electrical power consumption, vehicle weight and integration of alternative powertrains (e.g., electric/hybrid engines). As a result, suppliers are developing innovations that result in significant improvements in fuel economy, emissions and performance from gasoline and diesel internal combustion engines. At the same time, suppliers are also developing and marketing new and alternative technologies that support hybrid vehicles, electric vehicles and fuel cell products to improve fuel economy and emissions.
Connected. The third mega-trend, “Connected,” represents technologies designed to seamlessly integrate the highly complex electronic world in which automotive consumers live into the cars they drive, so that time in a vehicle is more productive and enjoyable. The technology content of vehicles continues to increase as consumers demand greater safety, personalization, infotainment, productivity and convenience while driving. Advanced technologies offering mobile voice and data communication, while minimizing driver distraction such as those used in our mobile electronics products coupled with global positioning systems and in-vehicle infotainment will continue to grow in importance and be key products in the transportation industry.
We expect these mega trends to create growth and opportunity for us. We believe we are well-positioned to provide solutions and products to OEMs to expand the electronic and technological content of their vehicles. We
7
Table of Contents
believe electronics integration, which generally refers to products that combine integrated circuits, software algorithms, sensor technologies and mechanical components within the vehicle will allow OEMs to achieve substantial reductions in weight and mechanical complexity, resulting in easier assembly, enhanced fuel economy, improved emissions control and better vehicle performance.
Standardization of Sourcing by OEMs
Many OEMs are adopting global vehicle platforms to increase standardization, reduce per unit cost and increase capital efficiency and profitability. As a result, OEMs are selecting suppliers that have the capability to manufacture products on a worldwide basis as well as the flexibility to adapt to regional variations. Suppliers with global scale and strong design, engineering and manufacturing capabilities, are best positioned to benefit from this trend. OEMs are also increasingly looking to their suppliers to simplify vehicle design and assembly processes to reduce costs. As a result, suppliers that sell vehicle components directly to manufacturers (Tier I suppliers) have assumed many of the design, engineering, research and development and assembly functions traditionally performed by vehicle manufacturers. Suppliers that can provide fully-engineered solutions, systems and pre-assembled combinations of component parts are positioned to leverage the trend toward system sourcing.
Shorter Product Development Cycles
As a result of government regulations and customer preferences, OEMs are requiring suppliers to respond faster with new designs and product innovations. While these trends are more prevalent in mature markets, the emerging markets are advancing rapidly towards the regulatory standards and consumer preferences of the more mature markets. Suppliers with strong technologies, robust global engineering and development capabilities will be best positioned to meet the OEM demands for rapid innovation.
Products
Our organizational structure and management reporting support the management of these core product lines:
Electrical/Electronic Architecture. This segment offers complete electrical and electronic architectures for our customer-specific needs that help reduce production cost, weight and mass, and improve reliability and ease of assembly.
| • | High quality connectors are engineered primarily for use in the automotive and related markets, but also have applications in the aerospace, military and telematics sectors. |
| • | Electrical centers provide centralized electrical power and signal distribution and all of the associated circuit protection and switching devices, thereby optimizing the overall vehicle electrical system. |
| • | Distribution systems, including hybrid high voltage and safety systems, are integrated into one optimized vehicle electrical system that can utilize smaller cable and gauge sizes and ultra-thin wall insulation (which product line makes up approximately 35% of our total revenue for the year ended December 31, 2011). |
Powertrain Systems. This segment offers high quality products for complete engine management systems (“EMS”) and other products to help optimize performance, emissions and fuel economy.
| • | The gasoline EMS portfolio features fuel injection and air/fuel control, valvetrain, ignition, sensors and actuators, transmission control products, and powertrain electronic control modules with software, algorithms and calibration. |
8
Table of Contents
| • | The diesel EMS product line offers high quality common rail fuel and air injection system technologies. |
| • | The Powertrain Systems segment also supplies integrated fuel handling systems for gasoline, diesel, flexfuel and biofuel configurations, and innovative evaporative emissions systems that are recognized as industry-leading technologies. |
We also include diesel and automotive aftermarket and original equipment service in the Powertrain Systems segment.
Electronics and Safety. This segment offers a wide range of electronic and safety equipment in the areas of controls, security, infotainment, communications, safety systems and power electronics.
| • | Electronic controls products primarily consist of body computers and security systems. |
| • | Infotainment and driver interface portfolio primarily consists of receivers, advanced reception systems, digital receivers, satellite audio receivers, navigation systems, displays and mechatronics. |
| • | Passive and active safety electronics primarily includes occupant detection systems, collision warning systems, advanced cruise control technologies and collision sensing. |
| • | Electric and hybrid electric vehicle power electronics comprises power modules, inverters and converters and battery packs. |
Thermal Systems. This segment offers energy efficient thermal system and component solutions for the automotive market and continues to develop applications for the non-automotive market. Our Automotive Thermal Products are designed to meet customers’ needs for powertrain thermal management and cabin thermal comfort (climate control).
| • | Main powertrain cooling products include condenser, radiator, fan module and charge air cooling heat exchangers assemblies. |
| • | Climate control portfolio includes HVAC modules, with evaporator and heater core components, air conditioning compressors and controls. |
Competition
Although the overall number of our top competitors has decreased due to ongoing industry consolidation, the automotive parts industry remains extremely competitive. OEMs rigorously evaluate suppliers on the basis of product quality, price, reliability and timeliness of delivery, product design capability, technical expertise and development capability, new product innovation, financial viability, application of lean principles, operational flexibility, customer service and overall management. In addition, our customers generally require that we demonstrate improved efficiencies, through cost reductions and/or price improvement, on a year-over-year basis.
9
Table of Contents
Our competitors in each of our operating segments are as follows:
| Segment |
Competitors | |
| Electrical/Electronic Architecture |
• FCI SA
• Lear Corporation
• Leoni AG
• Molex Inc.
• TE Connectivity, Ltd. (formerly Tyco International, Ltd.)
• Sumitomo Corporation
• Yazaki Corporation | |
| Powertrain Systems |
• BorgWarner Inc.
• Bosch Group
• Continental AG
• Denso Corporation
• Hitachi, Ltd.
• Magneti Marelli S.p.A. | |
| Electronics and Safety |
• Aisin Seiki Co., Ltd.
• Autoliv AB
• Bosch Group
• Continental AG
• Denso Corporation
• Harman International Industries
• Panasonic Corporation | |
| Thermal Systems |
• Denso Corporation
• MAHLE Behr Industry
• Sanden Corporation
• Valeo Inc.
• Visteon Corporation | |
Customers
We sell our products and services to the major global OEMs in every region of the world. We also sell our products to the worldwide aftermarket for replacement parts, including the aftermarket operations of our OEM customers and to other distributors and retailers. The following table provides the percentage of net sales to our largest customers for the year ended December 31, 2011:
| Customer |
% of our revenue | |
| General Motors Company |
19% | |
| Volkswagen Group (“VW”) |
9% | |
| Ford Motor Company (“Ford”) |
7% | |
| Daimler AG (“Daimler”) |
7% | |
| PSA Peugeot Citroën (“PSA”) |
5% | |
| Shanghai General Motors Company Limited |
5% | |
| Renault S.A. |
5% | |
| Fiat Group Automobiles S.p.A. |
3% | |
| Toyota Motor Corporation |
3% | |
| Geely Automobile Holdings Limited |
2% |
10
Table of Contents
Supply Relationships with Our Customers
We typically supply products to our OEM customers through purchase orders, which are generally governed by general terms and conditions established by each OEM. Although the terms and conditions vary from customer to customer, they typically contemplate a relationship under which our customers place orders for their requirements of specific components supplied for particular vehicles. These relationships typically extend over the life of the related vehicle. Prices are negotiated with respect to each purchase order, which may be subject to adjustments under certain circumstances, such as commodity or foreign exchange escalation/de-escalation clauses or for cost reductions achieved by us. In most instances our OEM customers agree to purchase their requirements for specific products but are not required to purchase any minimum amount of products from us. The terms and conditions typically provide that we are subject to a warranty on the products supplied; in most cases, the duration of such warranty is coterminous with the warranty offered by the OEM to the end-user of the vehicle. We may also be obligated to share in all or a part of recall costs if the OEM recalls its vehicles for defects attributable to our products.
Individual purchase orders are terminable for cause or non-performance and, in most cases, upon our insolvency and certain change of control events. In addition, many of our OEM customers have the option to terminate for convenience, which permits our customers to impose pressure on pricing during the life of the vehicle program, and have the ability to issue purchase contracts for less than the duration of the vehicle program, which potentially reduces our profit margins and increases the risk of our losing future sales under those purchase contracts. Additionally, our largest customer, GM, expressly reserves a right to terminate for competitiveness on certain of our long-term supply contracts. We manufacture and ship based on customer release schedules, normally provided on a weekly basis, which can vary due to cyclical automobile production or dealer inventory levels.
Although customer programs typically extend to future periods, and although there is an expectation that we will supply certain levels of OEM production during such future periods, customer agreements including applicable terms and conditions do not necessarily constitute firm orders. Firm orders are generally limited to specific and authorized customer purchase order releases placed with our manufacturing and distribution centers for actual production and order fulfillment. Firm orders are typically fulfilled as promptly as possible from the conversion of available raw materials, sub-components and work-in-process inventory for OEM orders and from current on-hand finished goods inventory for aftermarket orders. The dollar amount of such purchase order releases on hand and not processed at any point in time is not believed to be significant based upon the timeframe involved.
11
Table of Contents
Our Global Operations
Information concerning principal geographic areas for our continuing operations is set forth below. Net sales data reflects the manufacturing location for the years ended December 31, 2011 and 2010, the periods from August 19 to December 31, 2009 and January 1 to October 6, 2009. Net property data is as of December 31, 2011, 2010 and 2009.
| Successor | Predecessor | |||||||||||||||||||||||||||||
| Year ended December 31, 2011 |
Year ended December 31, 2010 |
Period from August 19 to December 31, 2009 |
Period from January 1 to October 6, 2009 |
|||||||||||||||||||||||||||
| (in millions) | (in millions) | |||||||||||||||||||||||||||||
| Net Sales | Net Property(1) |
Net Sales | Net Property(1) |
Net Sales | Net Property(1) |
Net Sales | ||||||||||||||||||||||||
| United States |
$ | 4,993 | $ | 506 | $ | 4,529 | $ | 417 | $ | 1,083 | $ | 430 | $ | 3,107 | ||||||||||||||||
| Other North America |
118 | 129 | 76 | 134 | 16 | 109 | 24 | |||||||||||||||||||||||
| Europe, Middle East & Africa(2) |
7,264 | 1,107 | 5,892 | 1,045 | 1,448 | 1,047 | 3,330 | |||||||||||||||||||||||
| Asia Pacific |
2,464 | 422 | 2,177 | 325 | 590 | 272 | 1,223 | |||||||||||||||||||||||
| South America |
1,202 | 151 | 1,143 | 146 | 284 | 102 | 650 | |||||||||||||||||||||||
|
|
|
|
|
|
|
|
|
|
|
|
|
|
|
|||||||||||||||||
| Total |
$ | 16,041 | $ | 2,315 | $ | 13,817 | $ | 2,067 | $ | 3,421 | $ | 1,960 | $ | 8,334 | ||||||||||||||||
|
|
|
|
|
|
|
|
|
|
|
|
|
|
|
|||||||||||||||||
| (1) | Net property data represents property, plant and equipment, net of accumulated depreciation. |
| (2) | Includes our country of domicile, Jersey, and the country of our principal executive offices, the United Kingdom. We had no sales in Jersey in any period. We had net sales of $866 million, $690 million, $159 million, and $394 million in the United Kingdom for the years ended December 31, 2011 and 2010, the period from August 19 to December 31, 2009, the period from January 1 to October 6, 2009, respectively. We had net property in the United Kingdom of $138 million, $137 million, and $141 million as of December 31, 2011, 2010 and 2009, respectively. |
Research, Development and Intellectual Property
We maintain technical engineering centers in major regions of the world to develop and provide advanced products, processes and manufacturing support for all of our manufacturing sites, and to provide our customers with local engineering capabilities and design development on a global basis. As of December 31, 2011, we employed over 17,000 scientists, engineers and technicians around the world. Total expenditures for research and development activities, which include engineering, were approximately $1.2 billion, $1.0 billion, $0.3 billion, and $1.0 billion for the years ended December 31, 2011 and 2010, the period from August 19 to December 31, 2009, and the period from January 1 to October 6, 2009, respectively. Each year we share some engineering expenses with OEMs and government agencies. While this amount varies from year-to-year, it is generally in the range of 20% to 25% of engineering expenses.
We believe that our engineering and technical expertise, together with our emphasis on continuing research and development, allow us to use the latest technologies, materials and processes to solve problems for our customers and to bring new, innovative products to market. We believe that continued engineering activities are critical to maintaining our pipeline of technologically advanced products. Given our strong financial discipline, we seek to effectively manage fixed costs and efficiently rationalize capital spending by critically evaluating the profit potential of new and existing customer programs, including investment in innovation and technology. We maintain our engineering activities around our focused product portfolio and allocate our capital and resources to those products with distinctive technologies. We expect expenditures for engineering activities to be approximately $1.2 billion for the year ended December 31, 2012.
We maintain a large portfolio of patents in the operation of our business. While no individual patent or group of patents, taken alone, is considered material to our business, taken in the aggregate, these patents provide
12
Table of Contents
meaningful protection for our products and technical innovations. Similarly, while our trademarks (particularly those protecting the Delphi brand) are important to identify our position in the industry, we do not believe that any of these are individually material to our business. We are actively pursuing marketing opportunities to commercialize and license our technology to both automotive and non-automotive industries and we have selectively taken licenses from others to support our business interests. These activities foster optimization of intellectual property rights.
Materials
We procure our raw materials from a variety of suppliers around the world. Generally, we seek to obtain materials in the region in which our products are manufactured in order to minimize transportation and other costs. The most significant raw materials we use to manufacture our products include aluminum, copper and resins. As of December 31, 2011, we have not experienced any significant shortages of raw materials and normally do not carry inventories of such raw materials in excess of those reasonably required to meet our production and shipping schedules.
Commodity cost volatility, most notably related to copper, aluminum, petroleum-based resin products and fuel is a challenge for us and our industry. We are continually seeking to manage these and other material-related cost pressures using a combination of strategies, including working with our suppliers to mitigate costs, seeking alternative product designs and material specifications, combining our purchase requirements with our customers and/or suppliers, changing suppliers, hedging of certain commodities and other means. In the case of copper, which primarily affects our Electrical/Electronic Architecture segment, and aluminum, which primarily affects our Thermal segment, contract escalation clauses have enabled us to pass on some of the price increases to our customers and thereby partially offset the impact of increased commodity costs on operating income for the related products. However, other than in the case of copper and aluminum, our overall success in passing commodity cost increases on to our customers has been limited. We will continue our efforts to pass market-driven commodity cost increases to our customers in an effort to mitigate all or some of the adverse earnings impacts, including by seeking to renegotiate terms as contracts with our customers expire.
Seasonality
Our business is moderately seasonal, as our primary North American customers historically halt operations for approximately two weeks in July and approximately one week in December. Our European customers generally reduce production during the months of July and August and for one week in December. Shut-down periods in the rest of the world generally vary by country. In addition, automotive production is traditionally reduced in the months of July, August and September due to the launch of parts production for new vehicle models. Accordingly, our results reflect this seasonality.
Employees
As of December 31, 2011, we employed approximately 104,000 people (5,000 in the U.S., and 99,000 outside of the U.S.): 24,000 salaried employees and 80,000 hourly employees. In addition, we maintain an alternative workforce of 39,000 contract and temporary workers. Our employees are represented worldwide by numerous unions and works councils, including the IUE-CWA, the United Steel, Paper and Forestry, Rubber, Manufacturing, Energy, Allied Industrial and Service Workers International Union and its Local Union 87L (together, the “USW”), and Confederacion De Trabajadores Mexicanos. In the U.S., our employees are represented by only the IUE-CWA and the USW, with which we have competitive wage and benefit packages.
Environmental Compliance
We are subject to the requirements of U.S. federal, state and local, and non-U.S., environmental and safety and health laws and regulations. These include laws regulating air emissions, water discharge, hazardous materials and waste management. We have an environmental management structure designed to facilitate and
13
Table of Contents
support our compliance with these requirements globally. Although it is our intent to comply with all such requirements and regulations, we cannot provide assurance that we are at all times in compliance. Environmental requirements are complex, change frequently and have tended to become more stringent over time. Accordingly, we cannot assure that environmental requirements will not change or become more stringent over time or that our eventual environmental costs and liabilities will not be material.
Certain environmental laws assess liability on current or previous owners or operators of real property for the cost of removal or remediation of hazardous substances. In addition to clean-up actions brought by U.S. federal, state, local and non-U.S. agencies, plaintiffs could raise personal injury or other private claims due to the presence of hazardous substances on or from a property. We are currently in the process of investigating and cleaning up some of our current or former sites. In addition, there may be soil or groundwater contamination at several of our properties resulting from historical, ongoing or nearby activities.
At December 31, 2011, December 31, 2010 and December 31, 2009, the reserve for environmental investigation and remediation was approximately $22 million, $23 million and $21 million, respectively, of which $7 million, $8 million and $5 million, respectively, related to sites within the U.S. We cannot ensure that our eventual environmental remediation costs and liabilities will not exceed the amount of our current reserves. In the event that such liabilities were to significantly exceed the amounts recorded, our results of operations could be materially affected.
SUPPLEMENTARY ITEM. EXECUTIVE OFFICERS OF THE REGISTRANT
The name, age (as of February 1, 2012), current positions and description of business experience of each of our executive officers are listed below. Our executive officers are elected annually by the Board of Directors and hold office until their successors are elected and qualified or until the officer’s resignation or removal. Positions noted below reflect service to both Delphi Automotive PLC and Delphi Automotive LLP. Each officer listed below as a senior vice president was a vice president until February 2012.
Mr. Rodney O’Neal, 58, is president and chief executive officer (CEO) of Delphi and is a member of the company’s board of directors. He was named president and CEO in October 2009 and became a member of the board in May 2011. Mr. O’Neal was president and CEO of Old Delphi from January 2007. He was president and chief operating officer (COO) of Old Delphi from January 1, 2005. Prior to the president and COO position, Mr. O’Neal served as president of Old Delphi’s former Dynamics, Propulsion and Thermal sector from January 2003 and as executive vice president and president of Old Delphi’s former Safety, Thermal and Electrical Architecture sector from January 2000. Previously, he served as vice president and president of Delphi Interior Systems since November 1998 and general manager of the former Delphi Interior & Lighting Systems since May 1997. Mr. O’Neal serves on the board of directors for the Goodyear Tire & Rubber Company and the Sprint/Nextel Corporation.
Mr. Kevin P. Clark, 49, is senior vice president and chief financial officer of Delphi. He was named to his current position in July 2010. Previously, Mr. Clark was a founding partner of Liberty Lane Partners, LLC, a private-equity investment firm focused on building and improving middle-market companies. Prior to Liberty Lane Partners, Mr. Clark served as the chief financial officer of Fisher-Scientific International Inc., a manufacturer, distributor and service provider to the global healthcare market. Mr. Clark served as Fisher-Scientific’s chief financial officer from the company’s initial public offering in 2001 through the completion of its merger with Thermo Electron Corporation in 2006. Prior to becoming chief financial officer, Mr. Clark served as Fisher-Scientific’s corporate controller and treasurer.
Mr. Majdi Abulaban, 48, is senior vice president of Delphi and president of Delphi Electrical/Electronic Architecture (E/EA) effective February 2012. He also continues to serve as president of Delphi Asia-Pacific. Mr. Abulaban was most recently president of the Connection Systems product business unit for Delphi E/EA. Mr. Abulaban was appointed managing director for the former Packard Electric Systems’ Asia Pacific operations
14
Table of Contents
and became chairman of the board for Delphi Packard Electric Systems Co., Ltd, (China) in July 2002. He previously held a variety of assignments, including business line executive for cockpits at Old Delphi’s former Safety & Interior division since 2001 and director of Asia Pacific Operations for Delphi Harrison Thermal Systems since January 2000.
Mr. James A.Bertrand, 54, is senior vice president of Delphi and president of Delphi Thermal Systems. He was named to his current position in October 2009 and was previously vice president of Old Delphi and president of Delphi Thermal Systems since May 2008. Earlier, Mr. Bertrand served a dual role beginning in January 2003 as president of Delphi Automotive Holdings Group and president of Old Delphi’s former Safety & Interior Systems, to which he was named president in January 2000.
Mr. Kevin M. Butler, 56, is senior vice president of human resource management and global business services for Delphi. He was named to his current position in November 2009 and previously served as vice president, human resource management and an officer of Old Delphi from 2000 to 2009. From 1997 to 2009, Mr. Butler was general director of human resources at Delphi Delco Electronics Systems.
Mr. Steven A. Kiefer, 48, is senior vice president of Delphi and president of Delphi Powertrain Systems. He was named to his current position in July 2011and previously served as general director of engineering and executive director for the HVAC product line within Delphi Thermal Systems from 2009 until his current assignment. In 2005, Mr. Kiefer was named managing director, Delphi Thermal Systems-Europe. Previously, Mr. Kiefer served as chief engineer and business line executive in Delphi’s Powertrain division in Luxembourg and in the Asia Pacific and North America regions.
Ms. Lùcia V. Moretti, 47, is senior vice president of Delphi and president of Delphi Product and Service Solutions (DPSS). She was named to her current position in August 2011 and was most recently director of the Global Independent Aftermarket product business unit at DPSS, a position she held since September 2010. Previously, she held a variety of assignments, including director of Aftermarket for South America, director of global marketing for DPSS and managing director for DPSS Europe. Ms. Moretti began her career at Delphi at Delphi Powertrain Systems in 1998.
Mr. Jeffrey J. Owens, 57, is senior vice president and chief technology officer of Delphi. He was most recently vice president of Delphi Electronics and Safety since October 2009 and was previously vice president of Old Delphi and president of Delphi Electronics and Safety, from September 2001 to September 2009. He also served as president of Delphi Asia Pacific from 2006 to 2009.
Mr. David M. Sherbin, 52, is senior vice president, general counsel, secretary and chief compliance officer of Delphi. He was named to his current position in October 2009 and previously was vice president, general counsel of Old Delphi, from October 2005 to October 2009. He was appointed chief compliance officer in January 2006. Prior to joining Delphi, Mr. Sherbin was vice president, general counsel and secretary for Pulte Homes, Inc., a national homebuilder, from January 2005 through September 2005. Mr. Sherbin joined Federal-Mogul Corporation in 1997 and was named senior vice president, general counsel, secretary and chief compliance officer in 2003.
Mr. James A. Spencer, 58, is senior vice president of Delphi and sector president of Electrical and Electronics. He was named to his current position in February 2012 and was most recently vice president and president of Delphi Electrical/Electronic Architecture since October 2009. Mr. Spencer was vice president of Old Delphi and president of Delphi Electrical/Electronic Architecture, formerly Packard Electric Systems, since 1999 and previously was president of Delphi Asia Pacific from 1999 to 2000. He also has served as president of Delphi Latin America since July 2006.
15
Table of Contents
Mr. Jugal K. Vijayvargiya, 43, is senior vice president of Delphi and president of Delphi Electronics and Safety (E&S). He was named to his current position in February 2012 and was most recently vice president of the Infotainment & Driver Interface product business unit (PBU) for Delphi E&S since August 2009. He was previously general director of the Controls & Security PBU since 2006. Earlier, Mr. Vijayvargiya was global business line executive (BLE) for Body Security & Mechatronics at Delphi Electrical/Electronic Architecture. Prior to his BLE assignment, Mr. Vijayvargiya was director of program management before being named product line manager of Audio Systems in 2002.
16
Table of Contents
Set forth below are certain risks and uncertainties that could adversely affect our results of operations or financial condition and cause our actual results to differ materially from those expressed in forward-looking statements made by the Company. Also refer to the Cautionary Statement Regarding Forward-Looking Information in this annual report.
Risks Related to Business Environment and Economic Conditions
The cyclical nature of automotive sales and production can adversely affect our business.
Our business is directly related to automotive sales and automotive vehicle production by our customers. Automotive sales and production are highly cyclical and, in addition to general economic conditions, also depend on other factors, such as consumer confidence and consumer preferences. Lower global automotive sales result in substantially all of our automotive OEM customers significantly lowering vehicle production schedules, which has a direct impact on our earnings and cash flows. The most recent example of this was the 2009 downturn in which North American and Western Europe automotive production declined approximately 43% and 26%, respectively, below production levels in 2007. While the industry is recovering from the 2009 downturn, production volumes in North America and Western Europe remain below levels experienced prior to 2009. In addition, automotive sales and production can be affected by labor relations issues, regulatory requirements, trade agreements, the availability of consumer financing and other factors. Economic declines that result in a significant reduction in automotive sales and production by our customers have in the past had, and may in the future have, an adverse effect on our business, results of operations and financial condition.
Our sales are also affected by inventory levels and OEMs’ production levels. We cannot predict when OEMs will decide to increase or decrease inventory levels or whether new inventory levels will approximate historical inventory levels. Uncertainty and other unexpected fluctuations could have a material adverse effect on our business and financial condition.
A prolonged economic downturn or economic uncertainty could adversely affect our business and cause us to require additional sources of financing, which may not be available.
Our sensitivity to economic cycles and any related fluctuation in the businesses of our customers or potential customers may have a material adverse effect on our financial condition, results of operations or cash flows. If global economic conditions deteriorate or economic uncertainty increases, our customers and potential customers may experience deterioration of their businesses, which may result in the delay or cancellation of plans to purchase our products. If vehicle production were to remain at low levels for an extended period of time or if cash losses for customer defaults rise, our cash flow could be adversely impacted, which could result in our needing to seek additional financing to continue our operations. There can be no assurance that we would be able to secure such financing on terms acceptable to us, or at all.
Any changes in consumer credit availability or cost of borrowing could adversely affect our business.
Declines in the availability of consumer credit and increases in consumer borrowing costs have negatively impacted global automotive sales and resulted in lower production volumes in the past. Substantial declines in automotive sales and production by our customers could have a material adverse effect on our business, results of operations and financial condition.
A drop in the market share and changes in product mix offered by our customers can impact our revenues.
We are dependent on the continued growth, viability and financial stability of our customers. Our customers generally are OEMs in the automotive industry. This industry is subject to rapid technological change, vigorous competition, short product life cycles and cyclical and reduced consumer demand patterns. When our customers
17
Table of Contents
are adversely affected by these factors, we may be similarly affected to the extent that our customers reduce the volume of orders for our products. As a result of changes impacting our customers, sales mix can shift which may have either favorable or unfavorable impact on revenue and would include shifts in regional growth, shifts in OEM sales demand, as well as shifts in consumer demand related to vehicle segment purchases and content penetration. For instance, a shift in sales demand favoring a particular OEM’s vehicle model for which we do not have a supply contract may negatively impact our revenue. A shift in regional sales demand toward certain markets could favorably impact the sales of those of our customers that have a large market share in those regions, which in turn would be expected to have a favorable impact on our revenue.
The mix of vehicle offerings by our OEM customers also impacts our sales. A decrease in consumer demand for specific types of vehicles where we have traditionally provided significant content could have a significant effect on our business and financial condition. Our sales of products in the regions in which our customers operate also depend on the success of these customers in those regions.
Declines in the market share or business of Daimler, Ford, GM, PSA and VW may have a disproportionate adverse impact on our revenues and profitability.
Daimler, Ford, GM, PSA and VW accounted for approximately 47% of our total net sales in the year ended December 31, 2011. Accordingly, our revenues may be disproportionately affected by decreases in any of their businesses or market share. Because our customers typically have no obligation to purchase a specific quantity of parts, a decline in the production levels of any of our major customers, particularly with respect to models for which we are a significant supplier, could disproportionately reduce our sales and thereby adversely affect our financial condition, operating results and cash flows. See Item 1. Supply Relationships with Our Customers.
Continued pricing pressures, OEM cost reduction initiatives and the ability of OEMs to re-source or cancel vehicle programs may result in lower than anticipated margins, or losses, which may have a significant negative impact on our business.
Cost-cutting initiatives adopted by our customers result in increased downward pressure on pricing. Our customer supply agreements generally require step-downs in component pricing over the period of production, typically one to two percent per year. In addition, our customers often reserve the right to terminate their supply contracts for convenience, which enhances their ability to obtain price reductions. OEMs have also possessed significant leverage over their suppliers, including us, because the automotive component supply industry is highly competitive, serves a limited number of customers, has a high fixed cost base and historically has had excess capacity. Based on these factors, and the fact that our customers’ product programs typically last a number of years and are anticipated to encompass large volumes, our customers are able to negotiate favorable pricing. Accordingly, as a Tier I supplier, we are subject to substantial continuing pressure from OEMs to reduce the price of our products. It is possible that pricing pressures beyond our expectations could intensify as OEMs pursue restructuring and cost cutting initiatives. If we are unable to generate sufficient production cost savings in the future to offset price reductions, our gross margin and profitability would be adversely affected. See Item 1. Supply Relationships with Our Customers for a detailed discussion of our supply agreements with our customers.
Our supply agreements with our OEM customers are generally requirements contracts, and a decline in the production requirements of any of our customers, and in particular our largest customers, could adversely impact our revenues and profitability.
We receive OEM purchase orders for specific components supplied for particular vehicles. In most instances our OEM customers agree to purchase their requirements for specific products but are not required to purchase any minimum amount of products from us. The contracts we have entered into with most of our customers have terms ranging from one year to the life of the model (usually three to seven years, although customers often reserve the right to terminate for convenience). Therefore, a significant decrease in demand for certain key models or group of related models sold by any of our major customers or the ability of a manufacturer to re-source and discontinue purchasing from us, for a particular model or group of models, could
18
Table of Contents
have a material adverse effect on us. To the extent that we do not maintain our existing level of business with our largest customers because of a decline in their production requirements or because the contracts expire or are terminated for convenience, we will need to attract new customers or win new business with existing customers, or our results of operations and financial condition will be adversely affected. See Item 1. Supply Relationships with Our Customers for a detailed discussion of our supply agreements with our customers.
We have invested substantial resources in markets where we expect growth and we may be unable to timely alter our strategies should such expectations not be realized.
Our future growth is dependent on our making the right investments at the right time to support product development and manufacturing capacity in areas where we can support our customer base. We have identified the Asia Pacific and South American regions, and China, Brazil and India, in particular, as key markets likely to experience substantial growth, and accordingly have made and expect to continue to make substantial investments, both directly and through participation in various partnerships and joint ventures, in numerous manufacturing operations, technical centers and other infrastructure to support anticipated growth in those regions. If we are unable to deepen existing and develop additional customer relationships in these regions, we may not only fail to realize expected rates of return on our existing investments, but we may incur losses on such investments and be unable to timely redeploy the invested capital to take advantage of other markets, potentially resulting in lost market share to our competitors. Our results will also suffer if these regions do not grow as quickly as we anticipate.
Our business in China is subject to aggressive competition and is sensitive to economic and market conditions.
Maintaining a strong position in the Chinese market is a key component of our global growth strategy. The automotive supply market in China is highly competitive, with competition from many of the largest global manufacturers and numerous smaller domestic manufacturers. As the size of the Chinese market continues to increase, we anticipate that additional competitors, both international and domestic, will seek to enter the Chinese market and that existing market participants will act aggressively to increase their market share. Increased competition may result in price reductions, reduced margins and our inability to gain or hold market share. In addition, our business in China is sensitive to economic and market conditions that drive sales volume in China. If we are unable to maintain our position in the Chinese market or if vehicle sales in China decrease or do not continue to increase, our business and financial results could be materially adversely affected.
Disruptions in the supply of raw materials and other supplies that we and our customers use in our products may adversely affect our profitability.
We and our customers use a broad range of materials and supplies, including copper, aluminum and other metals, petroleum-based resins, chemicals, electronic components and semiconductors. A significant disruption in the supply of these materials for any reason could decrease our production and shipping levels, which could materially increase our operating costs and materially decrease our profit margins.
We, as with other component manufacturers in the automotive industry, ship products to our customers’ vehicle assembly plants throughout the world so they are delivered on a “just-in-time” basis in order to maintain low inventory levels. Our suppliers also use a similar method. However, this “just-in-time” method makes the logistics supply chain in our industry very complex and very vulnerable to disruptions.
Such disruptions could be caused by any one of a myriad of potential problems, such as closures of one of our or our suppliers’ plants or critical manufacturing lines due to strikes, mechanical breakdowns, electrical outages, fires, explosions or political upheaval, as well as logistical complications due to weather, volcanic eruptions, or other natural or nuclear disasters, mechanical failures, delayed customs processing and more. Additionally, as we grow in low cost countries, the risk for such disruptions is heightened. The lack of even a
19
Table of Contents
small single subcomponent necessary to manufacture one of our products, for whatever reason, could force us to cease production, even for a prolonged period. Similarly, a potential quality issue could force us to halt deliveries while we validate the products. Even where products are ready to be shipped, or have been shipped, delays may arise before they reach our customer. Our customers may halt or delay their production for the same reason if one of their other suppliers fails to deliver necessary components. This may cause our customers, in turn to suspend their orders, or instruct us to suspend delivery, of our products, which may adversely affect our financial performance.
When we fail to make timely deliveries in accordance with our contractual obligations, we generally have to absorb our own costs for identifying and solving the “root cause” problem as well as expeditiously producing replacement components or products. Generally, we must also carry the costs associated with “catching up,” such as overtime and premium freight.
Additionally, if we are the cause for a customer being forced to halt production, the customer may seek to recoup all of its losses and expenses from us. These losses and expenses could be significant, and may include consequential losses such as lost profits. Any supply-chain disruption, however small, could potentially cause the complete shutdown of an assembly line of one of our customers, and any such shutdown that is due to causes that are within our control could expose us to material claims of compensation. Where a customer halts production because of another supplier failing to deliver on time, it is unlikely we will be fully compensated, if at all.
Adverse developments affecting one or more of our suppliers could harm our profitability.
Any significant disruption in our supplier relationships, particularly relationships with sole-source suppliers, could harm our profitability. Furthermore, some of our suppliers may not be able to handle the commodity cost volatility and/or sharply changing volumes while still performing as we expect. To the extent our suppliers experience supply disruptions, there is a risk for delivery delays, production delays, production issues or delivery of non-conforming products by our suppliers. Even where these risks do not materialize, we may incur costs as we try to make contingency plans for such risks.
The loss of business with respect to, or the lack of commercial success of, a vehicle model for which we are a significant supplier could adversely affect our financial performance.
Although we receive purchase orders from our customers, these purchase orders generally provide for the supply of a customer’s requirements for a particular vehicle model and assembly plant, rather than for the purchase of a specific quantity of products. The loss of business with respect to, or the lack of commercial success of, a vehicle model for which we are a significant supplier could reduce our sales and thereby adversely affect our financial condition, operating results and cash flows.
We operate in the highly competitive automotive supply industry.
The global automotive component supply industry is highly competitive. Competition is based primarily on price, technology, quality, delivery and overall customer service. There can be no assurance that our products will be able to compete successfully with the products of our competitors. Furthermore, the rapidly evolving nature of the markets in which we compete may attract new entrants, particularly in low-cost countries such as China, Brazil, India and Russia. Additionally, consolidation in the automotive industry may lead to decreased product purchases from us. As a result, our sales levels and margins could be adversely affected by pricing pressures from OEMs and pricing actions of competitors. These factors led to selective resourcing of business to competitors in the past and may also do so in the future. In addition, any of our competitors may foresee the course of market development more accurately than us, develop products that are superior to our products, have the ability to produce similar products at a lower cost than us, or adapt more quickly than us to new technologies or evolving customer requirements. As a result, our products may not be able to compete successfully with their products. These trends may adversely affect our sales as well as the profit margins on our products.
20
Table of Contents
Increases in costs of the materials and other supplies that we use in our products may have a negative impact on our business.
Significant changes in the markets where we purchase materials, components and supplies for the production of our products may adversely affect our profitability, particularly in the event of significant increases in demand where there is not a corresponding increase in supply, inflation or other pricing increases. In recent periods there have been significant fluctuations in the global prices of copper, aluminum and petroleum-based resin products, and fuel charges, which have had and may continue to have an unfavorable impact on our business, results of operations or financial condition. Continuing volatility may have adverse effects on our business, results of operations or financial condition. We will continue efforts to pass some supply and material cost increases onto our customers, although competitive and market pressures have limited our ability to do that, particularly with domestic OEMs, and may prevent us from doing so in the future, because our customers are generally not obligated to accept price increases that we may desire to pass along to them. Even where we are able to pass price increases through to the customer, in some cases there is a lapse of time before we are able to do so. The inability to pass on price increases to our customers when raw material prices increase rapidly or to significantly higher than historic levels could adversely affect our operating margins and cash flow, possibly resulting in lower operating income and profitability. We expect to be continually challenged as demand for our principal raw materials and other supplies, including electronic components, is significantly impacted by demand in emerging markets, particularly in China, Brazil, India and Russia, and by the anticipated global economic recovery. We cannot provide assurance that fluctuations in commodity prices will not otherwise have a material adverse effect on our financial condition or results of operations, or cause significant fluctuations in quarterly and annual results of operations.
Our hedging activities to address commodity price fluctuations may not be successful in offsetting future increases in those costs or may reduce or eliminate the benefits of any decreases in those costs.
In order to mitigate short-term volatility in operating results due to the aforementioned commodity price fluctuations, we hedge a portion of near-term exposure to certain raw materials used in production. The results of our hedging practice could be positive, neutral or negative in any period depending on price changes in the hedged exposures. Our hedging activities are not designed to mitigate long-term commodity price fluctuations and, therefore, will not protect from long-term commodity price increases. Our future hedging positions may not correlate to actual raw material costs, which could cause acceleration in the recognition of unrealized gains and losses on hedging positions in operating results.
We face manufacturing challenges.
The volume and timing of sales to our customers may vary due to: variation in demand for our customers’ products; our customers’ attempts to manage their inventory; design changes; changes in our customers’ manufacturing strategy; and acquisitions of or consolidations among customers. Due in part to these factors, many of our customers do not commit to long-term production schedules. Our inability to forecast the level of customer orders with certainty makes it difficult to schedule production and maximize utilization of manufacturing capacity.
We rely on third-party suppliers for the components used in our products, and we rely on third-party manufacturers to manufacture certain of our assemblies and finished products. Our results of operations, financial condition and cash flows could be adversely affected if our third party suppliers lack sufficient quality control or if there are significant changes in their financial or business condition. If our third-party manufacturers fail to deliver products, parts and components of sufficient quality on time and at reasonable prices, we could have difficulties fulfilling our orders, sales and profits could decline, and our commercial reputation could be damaged.
From time to time, we have underutilized our manufacturing lines. This excess capacity means we incur increased fixed costs in our products relative to the net revenue we generate, which could have an adverse effect
21
Table of Contents
on our results of operations, particularly during economic downturns. If we are unable to improve utilization levels for these manufacturing lines and correctly manage capacity, the increased expense levels will have an adverse effect on our business, financial condition and results of operations. In addition, some of our manufacturing lines are located in China or other foreign countries that are subject to a number of additional risks and uncertainties, including increasing labor costs and political, social and economic instability.
We may not be able to respond quickly enough to changes in regulations, technology and technological risks, and to develop our intellectual property into commercially viable products.
Changes in legislative, regulatory or industry requirements or in competitive technologies may render certain of our products obsolete or less attractive. Our ability to anticipate changes in technology and regulatory standards and to successfully develop and introduce new and enhanced products on a timely basis are significant factors in our ability to remain competitive and to maintain or increase our revenues. We cannot provide assurance that certain of our products will not become obsolete or that we will be able to achieve the technological advances that may be necessary for us to remain competitive and maintain or increase our revenues in the future. We are also subject to the risks generally associated with new product introductions and applications, including lack of market acceptance, delays in product development or production and failure of products to operate properly. The pace of our development and introduction of new and improved products depends on our ability to implement successfully improved technological innovations in design, engineering and manufacturing, which requires extensive capital investment. Any capital expenditure cuts in these areas that we may determine to implement in the future to reduce costs and conserve cash could reduce our ability to develop and implement improved technological innovations, which may materially reduce demand for our products.
To compete effectively in the automotive supply industry, we must be able to launch new products to meet changing consumer preferences and our customers’ demand in a timely and cost-effective manner. Our ability to respond to competitive pressures and react quickly to other major changes in the marketplace including in the case of automotive sales, increased gasoline prices or consumer desire for and availability of vehicles using alternative fuels is also a risk to our future financial performance.
We cannot provide assurance that we will be able to install and certify the equipment needed to produce products for new product programs in time for the start of production, or that the transitioning of our manufacturing facilities and resources to full production under new product programs will not impact production rates or other operational efficiency measures at our facilities. Development and manufacturing schedules are difficult to predict, and we cannot provide assurance that our customers will execute on schedule the launch of their new product programs, for which we might supply products. Our failure to successfully launch new products, or a failure by our customers to successfully launch new programs, could adversely affect our results.
Changes in factors that impact the determination of our non-U.S. pension liabilities may adversely affect us.
Certain of our non-U.S. subsidiaries sponsor defined benefit pension plans, which generally provide benefits based on negotiated amounts for each year of service. Our primary non-U.S. plans are located in Mexico and the United Kingdom and were underfunded by $319 million as of December 31, 2011. The funding requirements of these benefit plans, and the related expense reflected in our financial statements, are affected by several factors that are subject to an inherent degree of uncertainty and volatility, including governmental regulation. In addition to the defined benefit pension plans, we have retirement obligations driven by requirements in many of the countries in which we operate. These legally required plans require payments at the time benefits are due. Obligations, net of plan assets, related to the defined benefit pension plans and statutorily required retirement obligations totaled $609 million at December 31, 2011, of which $16 million is included in accrued liabilities and $593 million is included in long-term liabilities in our consolidated balance sheet. Key assumptions used to value these benefit obligations and the cost of providing such benefits, funding requirements and expense recognition
22
Table of Contents
include the discount rate and the expected long-term rate of return on pension assets. If the actual trends in these factors are less favorable than our assumptions, this could have an adverse effect on our results of operations and financial condition.
We may suffer future asset impairment and other restructuring charges.
We have taken restructuring actions in recent years to realign and resize our production capacity and cost structure to meet current and projected operational and market requirements. If we are required to take further restructuring actions, the charges related to these actions may have a material adverse effect on our results of operations and financial condition. We cannot assure that any future restructurings will be completed as planned or achieve the desired results. Additionally, from time to time in the past, we have recorded asset impairment losses relating to specific plants and operations. Generally, we record asset impairment losses when we determine that our estimates of the future undiscounted cash flows from an operation will not be sufficient to recover the carrying value of that facility’s building, fixed assets and production tooling. We cannot assure that we will not incur such charges in the future.
Employee strikes and labor-related disruptions involving us or one or more of our customers or suppliers may adversely affect our operations.
Our business is labor-intensive and utilizes a number of work councils and other represented employees. A strike or other form of significant work disruption by our employees would likely have an adverse effect on our ability to operate our business. A labor dispute involving us or one or more of our customers or suppliers or that could otherwise affect our operations could reduce our sales and harm our profitability. A labor dispute involving another supplier to our customers that results in a slowdown or a closure of our customers’ assembly plants where our products are included in the assembled parts or vehicles could also adversely affect our business and harm our profitability. In addition, our inability or the inability of any of our customers, our suppliers or our customers’ suppliers to negotiate an extension of a collective bargaining agreement upon its expiration could reduce our sales and harm our profitability. Significant increases in labor costs as a result of the renegotiation of collective bargaining agreements could also adversely affect our business and harm our profitability.
We may lose or fail to attract and retain key salaried employees and management personnel.
An important aspect of our competitiveness is our ability to attract and retain key salaried employees and management personnel. Our ability to do so is influenced by a variety of factors, including the compensation we award and the competitive market position of our overall compensation package. We may not be as successful as competitors at recruiting, assimilating and retaining highly skilled personnel. The loss of the services of any member of senior management or a key salaried employee could have an adverse effect on our business.
We are exposed to foreign currency fluctuations as a result of our substantial global operations, which may affect our financial results.
We have currency exposures related to buying, selling and financing in currencies other than the local currencies of the countries in which we operate. Approximately 69% of our net revenue for the year ended December 31, 2011 was invoiced in currencies other than the U.S. dollar, and we expect net revenue from non-U.S. markets to continue to represent a significant portion of our net revenue. Price increases caused by currency exchange rate fluctuations may make our products less competitive or have an adverse effect on our margins. Currency exchange rate fluctuations may also disrupt the business of our suppliers by making their purchases of raw materials more expensive and more difficult to finance.
Historically, we have reduced our exposure by aligning our costs in the same currency as our revenues or, if that is impracticable, through financial instruments that provide offsets or limits to our exposures, which are opposite to the underlying transactions. However, any measures that we may implement to reduce the effect of volatile currencies and other risks of our global operations may not be effective.
23
Table of Contents
In addition, we have significant business in Europe and transact much of this business in the Euro currency, including sales and purchase contracts. There have been recent concerns over the stability of the Euro as a currency and the economic outlook for both Euro functional countries as well as non-Euro countries. Given the broad range of possible outcomes it is difficult to fully assess the implications on our business. Some of the potential outcomes could significantly impact our operations. In the event of a country redenominating its currency away from the Euro the potential impact could be material to operations. We cannot provide assurance that fluctuations in currency exposures will not have a material adverse effect on our financial condition or results of operations, or cause significant fluctuations in quarterly and annual results of operations.
We face risks associated with doing business in non-U.S. jurisdictions.
The majority of our manufacturing and distribution facilities are in countries outside of the U.S., including Mexico and countries in Asia Pacific, Eastern and Western Europe, South America and Northern Africa. We also purchase raw materials and other supplies from many different countries around the world. For the year ended December 31, 2011, approximately 69% of our net revenue came from sales outside the United States. International operations are subject to certain risks inherent in doing business abroad, including:
| • | exposure to local economic, political and labor conditions; |
| • | unexpected changes in laws, regulations, trade or monetary or fiscal policy, including interest rates, foreign currency exchange rates and changes in the rate of inflation in the U.S. and other foreign countries; |
| • | tariffs, quotas, customs and other import or export restrictions and other trade barriers; |
| • | expropriation and nationalization; |
| • | difficulty of enforcing agreements, collecting receivables and protecting assets through non-U.S. legal systems; |
| • | reduced intellectual property protection; |
| • | limitations on repatriation of earnings; |
| • | withholding and other taxes on remittances and other payments by subsidiaries; |
| • | investment restrictions or requirements; |
| • | export and import restrictions; |
| • | violence and civil unrest in local countries; and |
| • | compliance with the requirements of applicable anti-bribery laws, including the U.S. Foreign Corrupt Practices Act. |
Additionally, our global operations may also be adversely affected by political events, domestic or international terrorist events and hostilities or complications due to natural or nuclear disasters. These uncertainties could have a material adverse effect on the continuity of our business and our results of operations and financial condition.
Increasing our manufacturing footprint in Asian markets, including China, and our business relationships with Asian automotive manufacturers are important elements of our strategy. In addition, our strategy includes
24
Table of Contents
increasing revenue and expanding our manufacturing footprint in lower-cost regions. As a result, our exposure to the risks described above may be greater in the future. The likelihood of such occurrences and their potential impact on us vary from country to country and are unpredictable.
If we fail to manage our growth effectively or to integrate successfully any future acquisition or strategic alliance into our business, our business could be harmed.
We expect to pursue acquisitions and strategic alliances that leverage our technology capabilities, enhance our customer base, geographic penetration, and scale to complement our current businesses. While we believe that such transactions are an integral part of our long-term strategy, there are risks and uncertainties related to these activities. Such risks and uncertainties include difficulty in integrating acquired operations, technology and products and potential unknown liabilities associated with the acquired company.
We depend on information technology to conduct our business. Any significant disruption could impact our business.
Our ability to keep our business operating effectively depends on the functional and efficient operation of information technology and telecommunications systems. We rely on these systems to make a variety of day-to-day business decisions as well as to track transactions, billings, payments and inventory. Our systems, as well as those of our customers, suppliers, partners, and service providers, are susceptible to interruptions (including those caused by systems failures, malicious computer software (malware), and other natural or man-made incidents or disasters), which may be prolonged. We are also susceptible to security breaches that may go undetected. Although we have taken precautions to mitigate such events, including geographically diverse data centers and redundant infrastructure, a significant or large-scale interruption of our information technology could adversely affect our ability to manage and keep our operations running efficiently and effectively. An incident that results in a wider or sustained disruption to our business could have a material adverse effect on our business, financial condition and results of operations.
Risks Related to Our Ordinary Shares
The price of our ordinary shares is subject to volatility.
Various factors could cause the market price of our ordinary shares to fluctuate substantially including general financial market changes, regional economic environments, changes in governmental regulation, significant automotive industry announcements or developments, the introduction of new products or technologies by us or our competitors, and changes in other conditions or trends in the automotive industry. Other factors that could cause the price of our ordinary shares to fluctuate could be actual or anticipated variations in our or our competitors’ quarterly and annual financial results, financial results failing to meet expectations of analysts or investors, changes in securities analysts’ estimates of the our future performance or of that of our competitors and the general health of the automotive industry. Also, the increase or decrease to the number of freely tradable shares in the public market could cause the market price of our ordinary shares to fluctuate
Future sales of ordinary shares by existing shareholders could depress the market price of our ordinary shares.
We have 328,244,510 ordinary shares outstanding, of which 114,549,400 ordinary shares are freely tradable in the public market unless purchased by any of our affiliates including the 90,470,573 shares that were released from lock-up restrictions on February 14, 2012 and registered for resale under the Securities Act. We expect the remaining 213,695,110 ordinary shares, representing approximately 65% of our total outstanding ordinary shares, will become available for resale in the public market in May 2012. The holders of all the remaining 213,695,110 ordinary shares (including our directors) remain subject to lock-up restrictions until May 15, 2012. The lock-up
25
Table of Contents
agreements are subject to extension in the case of an earnings release or material news or a material event relating to us. Goldman, Sachs & Co. and J.P. Morgan Securities LLC may, in their sole discretion and without notice, release all or any portion of the ordinary shares subject to lock-up agreements. As restrictions on resale end, the market price of our ordinary shares could drop significantly if the holders of these shares sell them or are perceived by the market as intending to sell them. We are required to file a shelf registration statement prior to expiration of the lock-up period on May 15, 2012 to permit the resale of such remaining shares. Any such shares not registered for resale will be freely tradable (subject to volume and manner of sale requirements) on May 22, 2012. The increase or decrease to the number of freely tradable shares in the public market could cause the market price of our ordinary shares to fluctuate, and could also make it more difficult for us to raise additional funds through future offerings of our ordinary shares or other securities.
Risks Related to Legal, Regulatory, Tax and Accounting Matters
We may incur material losses and costs as a result of warranty claims and product liability and intellectual property infringement actions that may be brought against us.
We face an inherent business risk of exposure to warranty claims and product liability in the event that our products fail to perform as expected and, in the case of product liability, such failure of our products results in bodily injury and/or property damage. The fabrication of the products we manufacture is a complex and precise process. Our customers specify quality, performance and reliability standards. If flaws in either the design or manufacture of our products were to occur, we could experience a rate of failure in our products that could result in significant delays in shipment and product re-work or replacement costs. Although we engage in extensive product quality programs and processes, these may not be sufficient to avoid product failures, which could cause us to:
| • | lose net revenue; |
| • | incur increased costs such as warranty expense and costs associated with customer support; |
| • | experience delays, cancellations or rescheduling of orders for our products; |
| • | experience increased product returns or discounts; or |
| • | damage our reputation, |
all of which could negatively affect our financial condition and results of operations.
If any of our products are or are alleged to be defective, we may be required to participate in a recall involving such products. Each vehicle manufacturer has its own practices regarding product recalls and other product liability actions relating to its suppliers. However, as suppliers become more integrally involved in the vehicle design process and assume more of the vehicle assembly functions, OEMs continue to look to their suppliers for contribution when faced with recalls and product liability claims. A recall claim brought against us, or a product liability claim brought against us in excess of our available insurance, may have a material adverse effect on our business. OEMs also require their suppliers to guarantee or warrant their products and bear the costs of repair and replacement of such products under new vehicle warranties. Depending on the terms under which we supply products to a vehicle manufacturer, a vehicle manufacturer may attempt to hold us responsible for some or all of the repair or replacement costs of defective products under new vehicle warranties when the OEM asserts that the product supplied did not perform as warranted. Although we cannot assure that the future costs of warranty claims by our customers will not be material, we believe our established reserves are adequate to cover potential warranty settlements. Our warranty reserves are based on our best estimates of amounts necessary to settle future and existing claims. We regularly evaluate the level of these reserves and adjust them when appropriate. However, the final amounts determined to be due related to these matters could differ materially from our recorded estimates.
26
Table of Contents
In addition, as we adopt new technology, we face an inherent risk of exposure to the claims of others that we have allegedly violated their intellectual property rights. We cannot assure that we will not experience any material warranty, product liability or intellectual property claim losses in the future or that we will not incur significant costs to defend such claims.
We may be adversely affected by environmental regulation, litigation or other liabilities.
We are subject to various U.S. federal, state and local, and non-U.S., environmental, health and safety laws and regulations governing, among other things:
| • | the generation, storage, handling, use, transportation, presence of, or exposure to hazardous materials; |
| • | the emission and discharge of hazardous materials into the ground, air or water; |
| • | the incorporation of certain chemical substances into our products, including electronic equipment; and |
| • | the health and safety of our employees. |
We are also required to obtain permits from governmental authorities for certain operations. We cannot assure you that we have been or will be at all times in complete compliance with such laws, regulations and permits. If we violate or fail to comply with these laws, regulations or permits, we could be fined or otherwise sanctioned by regulators. We could also be held liable for any and all consequences arising out of human exposure to hazardous substances or other environmental damage.
Certain environmental laws impose liability, sometimes regardless of fault, for investigating or cleaning up contamination on or emanating from our currently or formerly owned, leased or operated property, as well as for damages to property or natural resources and for personal injury arising out of such contamination. These environmental laws also assess liability on persons who arrange for hazardous substances to be sent to third party disposal or treatment facilities when such facilities are found to be contaminated. At this time, we are involved in various stages of investigation and cleanup related to environmental remediation matters at a number of present and former facilities in the U.S. and abroad. The ultimate cost to us of site cleanups is difficult to predict given the uncertainties regarding the extent of the required cleanup, the potential for ongoing environmental monitoring and maintenance that could be required for many years, the interpretation of applicable laws and regulations, alternative cleanup methods, and potential agreements that could be reached with governmental and third parties. While we have environmental reserves of approximately $22 million at December 31, 2011 for the cleanup of presently-known environmental contamination conditions, it cannot be guaranteed that actual costs will not significantly exceed these reserves. We also could be named a potentially responsible party at additional sites in the future and the costs associated with such future sites may be material.
In addition, environmental laws are complex, change frequently and have tended to become more stringent over time. While we have budgeted for future capital and operating expenditures to maintain compliance with environmental laws, we cannot assure that environmental laws will not change or become more stringent in the future. Therefore, we cannot assure that our costs of complying with current and future environmental and health and safety laws, and our liabilities arising from past or future releases of, or exposure to, hazardous substances will not adversely affect our business, results of operations or financial condition. For example, adoption of greenhouse gas rules in jurisdictions in which we operate facilities could require installation of emission controls, acquisition of emission credits, emission reductions, or other measures that could be costly, and could also impact utility rates and increase the amount we spend annually for energy.
We may identify the need for additional environmental remediation or demolition obligations relating to facility divestiture, closure and decommissioning activities.
As we sell, close and/or demolish facilities around the world, environmental investigations and assessments will continue to be performed. We may identify previously unknown environmental conditions or further
27
Table of Contents
delineate known conditions that may require remediation or additional costs related to demolition or decommissioning, such as abatement of asbestos containing materials or removal of polychlorinated biphenyls or storage tanks. Such costs could exceed our reserves.
We are involved from time to time in legal proceedings and commercial or contractual disputes, which could have an adverse impact on our profitability and consolidated financial position.
We are involved in legal proceedings and commercial or contractual disputes that, from time to time, are significant. These are typically claims that arise in the normal course of business including, without limitation, commercial or contractual disputes, including warranty claims and other disputes with customers and suppliers; intellectual property matters; personal injury claims; environmental issues; tax matters; and employment matters. There is also a pending antitrust investigation in the European Union.
In addition, we conduct significant business operations in Brazil that are subject to the Brazilian federal labor, social security, environmental, tax and customs laws as well as a variety of state and local laws. While we believe we comply with such laws, they are complex, subject to varying interpretations, and we are often engaged in litigation with government agencies regarding the application of these laws to particular circumstances. As of December 31, 2011, related claims totaling approximately $225 million (using December 31, 2011 foreign currency rates) had been asserted against us. As of December 31, 2011, we maintained reserves for these asserted claims of approximately $40 million (using December 31, 2011 foreign currency rates).
We are also subject to class action complaints filed in various U.S. federal district courts alleging violations of U.S. antitrust laws, and are subject to a pending antitrust investigation in the European Union related to the supply of wire harnesses to vehicle manufacturers, for which no accruals have been recorded as of December 31, 2011.
While we believe our reserves are adequate, the final amounts required to resolve these matters could differ materially from our recorded estimates and our results of operations could be materially affected.
For further information regarding our legal matters, see Item 3. Legal Proceedings. No assurance can be given that such proceedings and claims will not have a material adverse effect on our profitability and consolidated financial position.
Developments or assertions by us or against us relating to intellectual property rights could materially impact our business.
We own significant intellectual property, including a large number of patents and tradenames, and are involved in numerous licensing arrangements. Our intellectual property plays an important role in maintaining our competitive position in a number of the markets we serve. Developments or assertions by or against us relating to intellectual property rights could negatively impact our business. Significant technological developments by others also could materially and adversely affect our business and results of operations and financial condition.
There is a significant risk that the IRS will assert that Delphi Automotive LLP and, as a result, Delphi Automotive PLC should be treated as a domestic corporation for U.S. federal income tax purposes. If we were unsuccessful in defending against this assertion, this could result in a material impact on our future tax liability.
On May 19, 2011, Delphi Automotive PLC was formed as a Jersey public limited company, and had nominal assets, no liabilities and had conducted no operations prior to its initial public offering. On November 22, 2011, in conjunction with the completion of its initial public offering by the selling shareholders,
28
Table of Contents
all of the outstanding equity of Delphi Automotive LLP was exchanged for ordinary shares in Delphi Automotive PLC. As a result, Delphi Automotive LLP became a wholly-owned subsidiary of Delphi Automotive PLC. Delphi Automotive PLC is a United Kingdom (“U.K.”) resident taxpayer and as such is not generally subject to U.K. tax on remitted foreign earnings.
Delphi Automotive LLP, which acquired the automotive supply and other businesses of the Predecessor on October 6, 2009 (the “Acquisition Date”), was established on August 19, 2009 as a limited liability partnership incorporated under the laws of England and Wales. At the time of its formation, Delphi Automotive LLP elected to be treated as a partnership for U.S. federal income tax purposes. Prior to the Acquisition Date, the Internal Revenue Service (the “IRS”) issued Notice 2009-78 (the “Notice”) announcing its intent to issue regulations under Section 7874 of the Internal Revenue Code of 1986, as amended (the “Code”), with an effective date prior to the Acquisition Date. If regulations as described in the Notice are issued with the effective date indicated in the Notice and with no exceptions for transactions that were subject to binding commitments on that date, we believe there is a significant risk that the IRS may assert that Delphi Automotive LLP, and as a result Delphi Automotive PLC, should be treated as a domestic corporation for U.S. federal income tax purposes, retroactive to the Acquisition Date. If Delphi Automotive LLP were treated as a domestic corporation for U.S. federal income tax purposes, we expect that, although we are incorporated under the laws of Jersey and a tax resident in the U.K., we would also be treated as a domestic corporation for U.S. federal income tax purposes.
Delphi Automotive LLP has filed informational U.S. federal partnership tax returns for 2009 and 2010. In light of the Notice, the IRS is currently reviewing whether Section 7874 applies to Delphi Automotive LLP’s acquisition of the automotive supply and other businesses of the Predecessor. We believe, after consultation with counsel, that neither Delphi Automotive LLP nor Delphi Automotive PLC should be treated as domestic corporations for U.S. federal income tax purposes, and intends to vigorously defend any assertion by the IRS to the contrary, including through litigation if we were unable to reach a satisfactory resolution with the IRS. However, no assurance can be given that the IRS will not contend, or that a court will not conclude, that neither Delphi Automotive LLP, and therefore Delphi Automotive PLC should be treated as a domestic corporation for U.S. federal income tax purposes. No accrual for this matter has been recorded as of December 31, 2011.
If we were treated as a domestic corporation for U.S. federal income tax purposes, we would be subject to U.S. federal income tax on our worldwide taxable income, including some or all of the distributions from our subsidiaries as well as some of the undistributed earnings of our foreign subsidiaries that constitute “controlled foreign corporations.” This could have a material adverse impact on our future tax liability related to these distributions and earnings. Future cash distributions made by us to non-U.S. shareholders could be subject to U.S. income tax withholding at a rate of 30%, unless reduced or eliminated by a tax treaty. In addition, we could be liable for additional U.S. federal income taxes on such distributions and earnings, and for the failure by Delphi Automotive LLP to withhold U.S. income taxes on distributions to its non-U.S. members, for periods beginning on or after, the Acquisition Date, which liability could have a material adverse impact on our results of operations and financial condition.
Taxing authorities could challenge our historical and future tax positions.
The amount of tax we pay is subject to our interpretation of applicable tax laws in the jurisdictions in which we file. We have taken and will continue to take tax positions based on our interpretation of such tax laws. In particular, we will seek to run ourselves in such a way that we are and remain tax resident in the United Kingdom. While we believe that we have complied with all applicable tax laws, there can be no assurance that a taxing authority will not have a different interpretation of the law and assess us with additional taxes. Should additional taxes be assessed, this may result in a material adverse effect on our results of operations and financial condition.
29
Table of Contents
Our application of acquisition accounting could result in additional asset impairments and may make comparisons of our financial position and results of operations to prior periods more difficult.
As required by U.S. GAAP, we recognized and measured the fair value of the identifiable assets acquired and the liabilities assumed from the Predecessor. This resulted in the recognition of significant identifiable intangible assets which could be impaired in future periods. Additionally, the consolidated financial statements of Delphi Automotive PLC are not comparable to the consolidated statements of the Predecessor due to the effects of the consummation of the First Amended Joint Plan of Reorganization of Delphi Corporation and Certain Affiliates, Debtors and Debtors-In Possession (As Modified) and the change in the basis of presentation. This lack of comparability could limit interest and investment in our securities, including the ordinary shares.
Our operating results are exposed to variability as a result of the currently designed Long Term Incentive Program for our key employees.
The recognition of compensation costs on a U.S. GAAP basis resulting from the execution of our Value Creation Plan, our Long Term Incentive Program for key employees, is based on a variable formula that is likely to result in fluctuations impacting operating results. No assurance can be given that such impacts will not have a material impact on our profitability and consolidated financial position.
ITEM 1B. UNRESOLVED STAFF COMMENTS
We have no unresolved SEC staff comments to report.
As of December 31, 2011, we owned or leased 114 major manufacturing sites and 15 major technical centers in 30 countries. A manufacturing site may include multiple plants and may be wholly or partially owned or leased. We also have many smaller manufacturing sites, sales offices, warehouses, engineering centers, joint ventures and other investments strategically located throughout the world. The following table shows the regional distribution of our major manufacturing sites by the operating segment that uses such facilities:
| North America |
Europe, Middle East & Africa |
Asia Pacific |
South America |
Total | ||||||||||||||||
| Electrical/Electronic Architecture |
26 | 17 | 13 | 6 | 62 | |||||||||||||||
| Powertrain Systems |
4 | 10 | 5 | 2 | 21 | |||||||||||||||
| Electronics and Safety |
3 | 10 | 3 | 1 | 17 | |||||||||||||||
| Thermal Systems |
5 | 4 | 4 | 1 | 14 | |||||||||||||||
|
|
|
|
|
|
|
|
|
|
|
|||||||||||
| Total |
38 | 41 | 25 | 10 | 114 | |||||||||||||||
|
|
|
|
|
|
|
|
|
|
|
|||||||||||
In addition to these manufacturing sites, we had 15 major technical centers: five in North America; five in Europe, Middle East and Africa; four in Asia Pacific; and one in South America.
Of our 114 major manufacturing sites and 15 major technical centers, which include facilities owned or leased by our consolidated subsidiaries, 71 are primarily owned and 58 are primarily leased.
Delphi operates administrative offices in Troy, Michigan. We also maintain regional offices in Sao Paulo, Brazil; Shanghai, China; and Bascharage, Luxembourg.
We frequently review our real estate portfolio and develop footprint strategies to support our customers’ global plans, while at the same time supporting our technical needs and controlling operating expenses. We believe our evolving portfolio will meet current and anticipated future needs.
30
Table of Contents
We are from time to time subject to various legal actions and claims incidental to our business, including those arising out of alleged defects, breach of contracts, product warranties, intellectual property matters, and employment-related matters. It is our opinion that the outcome of such matters will not have a material adverse impact on our consolidated financial position, results of operations, or cash flows. With respect to warranty matters, although we cannot ensure that the future costs of warranty claims by customers will not be material, we believe our established reserves are adequate to cover potential warranty settlements. However, the final amounts required to resolve these matters could differ materially from our recorded estimates.
European Union Antitrust Investigation
We have received requests for information from antitrust authorities at the European Commission seeking information about alleged conduct by us in connection with an investigation of automotive parts suppliers concerning possible violations of antitrust laws related to the supply of wire harnesses to vehicle manufacturers. We are cooperating fully with the European authorities. Investigations of this nature often continue for several years and may result in fines imposed by the European authorities. Any fine could result in a material adverse impact on our operating results and cash flows. However, at this time, we are unable to estimate any reasonably possible range of loss that may ultimately result from this investigation. No accrual for this matter has been recorded as of December 31, 2011.
Class Action Antitrust Litigation
A number of class action complaints have been filed in various U.S. federal district courts alleging that several wire harness manufacturers, including us, have violated U.S. antitrust laws. These complaints allege that consumers overpaid for their vehicles as a result of the alleged conduct of the wire harness manufacturers. At this time, we believe that the allegations contained in the complaints are without merit with regard to us and we intend to vigorously defend against the allegations set forth in the complaints. No accruals for these matters have been recorded as of December 31, 2011.
Unsecured Creditors Litigation
In December 2011, a complaint was filed in the Bankruptcy Court alleging that the redemption by Delphi Automotive LLP of the membership interests of GM and the PBGC, our initial public offering and a distribution by Delphi Automotive LLP in the amount of $95 million principally in respect of taxes constituted, in the aggregate, distributions to the members of Delphi Automotive LLP in excess of $7.2 billion. The complaint further alleges that such aggregate distributions obligate Delphi Automotive LLP to pay to the holders of allowed general unsecured claims against the Predecessor $32.50 for every $67.50 in excess of $7.2 billion in distributions, up to a maximum of $300 million. At this time, we believe that the allegations contained in the complaint are without merit, and we intend to vigorously contest the allegations set forth in the complaint. No accrual for this matter has been recorded as of December 31, 2011.
Warranty Matters
In 2009, we received information regarding potential warranty claims related to certain components supplied by our Powertrain segment. In March 2011, we reached a settlement with our customer related to this matter. During the three months ended March 31, 2011, we recognized an unusual warranty expense in cost of sales of approximately $76 million as a result of the settlement agreement. In April 2011, Delphi made a payment of €90 million (approximately $133 million at April 30, 2011 foreign currency rates) related to this matter.
We have recognized our best estimate for our total aggregate warranty reserves across all of our operating segments as of December 31, 2011. The estimated reasonably possible amounts to ultimately resolve all matters is not materially different from the recorded reserves.
31
Table of Contents
Brazil Matters
We conduct significant business operations in Brazil that are subject to the Brazilian federal labor, social security, environmental, tax and customs laws, as well as a variety of state and local laws. While we believe that we comply with such laws, they are complex, subject to varying interpretations, and we are often engaged in litigation with government agencies regarding the application of these laws to particular circumstances. In addition, we are also a party to commercial and labor litigation with private parties. As of December 31, 2011, related claims totaling approximately $225 million (using December 31, 2011 foreign currency rates) have been asserted against us. As of December 31, 2011, we maintain accruals for these asserted claims of approximately $40 million (using December 31, 2011 foreign currency rates). The amounts accrued represent claims that are deemed probable of loss and are reasonably estimable based on our analyses and assessment of the asserted claims and prior experience with similar matters. While we believe our accruals are adequate, the final amounts required to resolve these matters could differ materially from our recorded estimates and our results of operations could be materially affected.
Romania Value Added Tax (“VAT”) Assessment
During the first quarter of 2010, as a result of a tax audit for years 2006–2008, we received a tax assessment from the Romanian tax authorities in the amount of approximately $42 million based on the taxing authority’s assessment that we underpaid its VAT (mostly on export sales) by approximately $24 million and owe accrued interest and penalties of $18 million. We filed an appeal contesting the assessment and in October 2010, the Romanian tax authorities substantially reduced the amount of the assessment and decided to re-audit us. In December 2011, the Company received $13 million from the tax authorities related to the outstanding VAT credit. As of December 31, 2011, we maintain a reserve for this contingency that is substantially less than the amount of the remaining balance under assessment. While we believe our reserve is adequate, the final amounts required to resolve this initial assessment could differ materially from our recorded estimate.
ITEM 4. MINE SAFETY DISCLOSURES
Not applicable.
32
Table of Contents
PART II
ITEM 5. MARKET FOR REGISTRANT’S COMMON EQUITY, RELATED STOCKHOLDER MATTERS AND ISSUER PURCHASES OF EQUITY SECURITIES
Our ordinary shares have only been publicly traded since November 17, 2011 when our ordinary shares were listed and began trading on the New York Stock Exchange (NYSE) under the symbol “DLPH”.
The following table sets forth the high and low sales price per share of our ordinary shares, as reported by NYSE, for the period from commencement of trading on November 17, 2011 through December 31, 2011. As of February 13, 2012, there were approximately 230 shareholders of record of our ordinary shares.
| Period from November 17 through December 31, 2011 |
Price Range of Ordinary Shares | |||
| High |
Low | |||
| Period from November 17 through December 31, 2011 |
$ 22.13 | $ 19.63 | ||
The following graph reflects the comparative changes in the value from November 17, 2011, the first day of our ordinary shares trading on the NYSE, through December 31, 2011, assuming an initial investment of $100 and the reinvestment of dividends, if any in (1) our ordinary shares, (2) the S&P 500 index, and (3) the Automotive Supplier Peer Group. Historical performance may not be indicative of future shareholder returns.
Stock Performance Graph
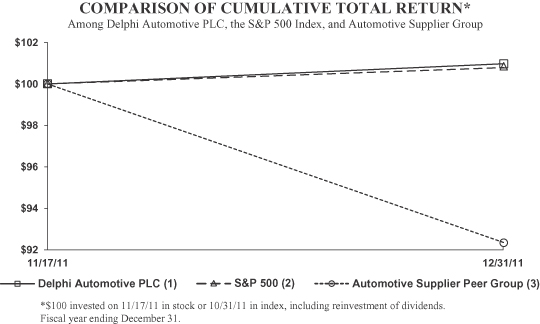
(1) Delphi Automotive PLC
(2) S&P 500 – Standard & Poor’s 500 Total Return Index
(3) Automotive Supplier Peer Group – Russell 3000 Auto Parts Index, including American Axle & Manufacturing, Amerigon Inc., Autoliv Inc., BorgWarner Inc., Dana Holding Corp., Dorman Products Inc., Exide Technologies, Federal-Mogul Corp., Fuel Systems Solutions Inc., Gentex Corp., Genuine Parts Co., Johnson Controls Inc., LKQ Corp., Lear Corp., Meritor Inc., Motorcar Parts of America Inc., Standard Motor Products Inc., Stoneridge Inc., Superior Industries International, TRW Automotive Holdings Corp., Tenneco Inc., Tower International Inc., US Auto Parts Network Inc., Visteon Corp., and WABCO Holdings Inc.
33
Table of Contents
| Company Index |
November 17, 2011 | December 31, 2011 | ||
| Delphi Automotive PLC (1) |
100.00 | 100.98 | ||
| S&P 500 (2) |
100.00 | 100.80 | ||
| Automotive Supplier Peer Group (3) |
100.00 | 92.37 |
Dividends
Delphi Automotive PLC currently does not pay any cash dividends on its share capital. We currently anticipate that we will retain all available funds for use in the operation and expansion of our business, and are not currently contemplating a dividend payment.
In October 2011, the Board of Managers of Delphi Automotive LLP approved a distribution of approximately $95 million, which was paid on December 5, 2011, principally in respect of taxes, to members of Delphi Automotive LLP who held membership interests as of the close of business on October 31, 2011.
Equity Compensation Plan Information
The table below contains information about securities authorized for issuance under equity compensation plans. The features of these plans are discussed further in Note 21 Share-Based Compensation to our consolidated financial statements.
|
Plan Category |
Number of Securities to be Issued Upon Exercise of Outstanding Options, Restricted Common Stock Warrants and Rights (a) |
Weighted-Average Exercise Price of Outstanding Options, Restricted Common Stock Warrants and Rights (b) |
Number of Securities Remaining Available for Future Issuance Under Equity Compensation Plans (excluding securities reflected in column (a)) (c) | |||
| Equity compensation plans approved by security holders |
7,107,361 (1) | — (2) | 22,926,113 (3) | |||
| Equity compensation plans not approved by security holders |
— | — | — | |||
|
|
|
| ||||
| Total |
7,107,361 | — | 22,926,113 | |||
|
|
|
|
| (1) | Includes (a) 51,003 restricted stock units granted to our Board of Directors under the Company’s long term incentive program; and (b) an estimate of the total shares (7,056,358 shares) that would have been granted under the Management Value Creation Plan, or Value Creation Plan (“the VCP”), had the shares been issued as of 1/30/2012. While we have estimated the reserve based on all VCP awards being settled in shares, we currently expect to settle a significant portion of such awards in cash instead of shares. In addition, the actual number of shares that could be issued could vary materially based on changes in the value of Delphi’s ordinary shares between the date of this filing and December 31, 2012, the last day of the performance period. See Note 21 Share-Based Compensation to the audited financial statements included herein. |
| (2) | The restricted stock units and the estimated VCP award shares have no exercise price. |
| (3) | Remaining shares available under the Long Term Incentive Plan. |
Repurchase of Equity Securities
None of our issued ordinary shares have been reacquired by the Company since their initial issuance on November 17, 2011.
In January 2012, the Board of Directors authorized a share repurchase of up to $300 million of ordinary shares. The program will terminate on the earlier of December 31, 2012 or when the Company attains $300 million in ordinary share repurchases.
34
Table of Contents
Recent Sales of Unregistered Securities
The registrant, a Jersey public limited company, was formed on May 19, 2011. Since its formation, the registrant has sold the following securities without registration under the Securities Act of 1933:
| • | On May 19, 2011, the Registrant issued 2 ordinary shares for aggregate consideration of $0.02 pursuant to Section 4(2) under the Securities Act of 1933. |
| • | On November 22, 2011, the Registrant issued 328,244,510 ordinary shares in exchange for all outstanding membership interests of Delphi Automotive LLP pursuant to Section 4(2) under the Securities Act of 1933. |
Initial Public Offering Proceeds
We completed our initial public offering on November 22, 2011 pursuant to a registration statement on Form S-1 (No. 333-174493). All of the proceeds of the offering were received by the selling shareholders in the offering.
35
Table of Contents
ITEM 6. SELECTED FINANCIAL DATA
The following selected consolidated financial data of the Successor and the Predecessor have been derived from the audited consolidated financial statements of the Successor and the Predecessor and should be read in conjunction with, and are qualified by reference to, Item 7. Management’s Discussion and Analysis of Financial Condition and Results of Operations and the consolidated financial statements and notes thereto included elsewhere in this Annual Report. The financial information presented may not be indicative of our future performance.
| Successor | Predecessor (1) | |||||||||||||||||||||||||
| Year ended December 31, | Period from August 19 to December 31, 2009 |
Period from January 1 to October 6, 2009 |
Year ended December 31, | |||||||||||||||||||||||
| 2011 | 2010 | 2008 | 2007 | |||||||||||||||||||||||
| (dollars and shares in millions, except per share data) |
(dollars and shares in millions, except per share data) |
|||||||||||||||||||||||||
| Statements of operations data: |
||||||||||||||||||||||||||
| Net sales |
$ | 16,041 | $ | 13,817 | $ | 3,421 | $ | 8,334 | $ | 16,808 | $ | 19,526 | ||||||||||||||
| Depreciation and amortization |
475 | 421 | 139 | 540 | 822 | 871 | ||||||||||||||||||||
| Operating income (loss) |
1,644 | 940 | (10) | (1,118) | (1,425) | (1,557) | ||||||||||||||||||||
| Interest expense |
(123) | (30) | (8) | — | (434) | (764) | ||||||||||||||||||||
| Reorganization items, net |
— | — | — | 10,210 | 5,147 | (163) | ||||||||||||||||||||
| Income (loss) from continuing operations |
1,223 | 703 | (3) | 9,391 | 3,163 | (1,855) | ||||||||||||||||||||
| Net income (loss) |
1,223 | 703 | (3) | 9,347 | 3,066 | (2,997) | ||||||||||||||||||||
| Net income attributable to noncontrolling interests |
78 | 72 | 15 | 29 | 29 | 68 | ||||||||||||||||||||
| Net income (loss) attributable to Successor/Predecessor |
1,145 | 631 | (18) | 9,318 | 3,037 | (3,065) | ||||||||||||||||||||
| Net income (loss) per share data: |
||||||||||||||||||||||||||
| Income (loss) from continuing operations attributable to Successor/Predecessor |
$ | 2.72 | $ | 0.92 | $ | (0.03) | $ | 16.58 | $ | 5.55 | $ | (3.41) | ||||||||||||||
| Loss from discontinued operations attributable to Successor/Predecessor |
— | — | — | (0.08) | (0.17) | (2.04) | ||||||||||||||||||||
|
|
|
|
|
|
|
|
|
|
|
|
|
|||||||||||||||
| Basic and diluted income (loss) per share attributable to Successor/Predecessor |
$ | 2.72 | $ | 0.92 | $ | (0.03) | $ | 16.50 | $ | 5.38 | $ | (5.45) | ||||||||||||||
| Weighted average shares outstanding |
421 | 686 | 685 | 565 | 565 | 562 | ||||||||||||||||||||
| Other financial data: |
||||||||||||||||||||||||||
| Capital expenditures |
$ | 630 | $ | 500 | $ | 88 | $ | 321 | $ | 771 | $ | 577 | ||||||||||||||
| EBITDA(2) |
2,119 | 1,361 | 129 | (514) | (211) | (384) | ||||||||||||||||||||
| Adjusted EBITDA(2) |
2,150 | 1,633 | 313 | (229) | 269 | 731 | ||||||||||||||||||||
| EBITDA margin(3) |
13.2% | 9.9% | 3.8% | (6.2)% | (1.3)% | (2.0)% | ||||||||||||||||||||
| Adjusted EBITDA margin(3) |
13.4% | 11.8% | 9.1% | (2.7)% | 1.6% | 3.7% | ||||||||||||||||||||
| Net cash provided by (used in) operating activities |
1,377 | 1,142 | 159 | (257) | 455 | (98) | ||||||||||||||||||||
| Net cash (used in) provided by investing activities |
(10) | (911) | 885 | (1,052) | (958) | (530) | ||||||||||||||||||||
| Net cash (used in) provided by financing activities |
(3,194) | (126) | 2,062 | 315 | 465 | (58) | ||||||||||||||||||||
| Successor | Predecessor(1) | |||||||||||||||||||||
| As of December 31, 2011 |
As of December 31, 2010 |
As of December 31, 2009 |
As of December 31, 2008 |
As of December 31, 2007 |
||||||||||||||||||
| (in millions) | (in millions) | |||||||||||||||||||||
| Balance sheet and employment data: |
||||||||||||||||||||||
| Cash and cash equivalents |
$ | 1,363 | $ | 3,219 | $ | 3,107 | $ | 959 | $ | 1,036 | ||||||||||||
| Total assets |
$ | 9,128 | $ | 11,082 | $ | 10,307 | $ | 10,306 | $ | 13,667 | ||||||||||||
| Total debt |
$ | 2,103 | $ | 289 | $ | 396 | $ | 4,229 | $ | 3,554 | ||||||||||||
| Working capital(4) |
$ | 1,116 | $ | 1,059 | $ | 1,217 | $ | 1,838 | $ | 2,772 | ||||||||||||
| Liabilities subject to compromise |
$ | — | $ | — | $ | — | $ | 14,583 | $ | 16,197 | ||||||||||||
| Shareholders’ deficit |
N/A | N/A | N/A | $ | (14,266) | $ | (13,284) | |||||||||||||||
| Shareholders’ equity |
$ | 2,171 | $ | 6,099 | $ | 5,366 | N/A | N/A | ||||||||||||||
| Global employees(5) |
104,000 | 99,700 | 104,800 | 146,600 | 169,500 | |||||||||||||||||
| (1) | The Predecessor adopted the accounting guidance in Financial Accounting Standards Board Accounting Standards Codification (“FASB ASC”) 852, Reorganizations, effective October 8, 2005 and has segregated in the financial statements for all reporting periods subsequent to such date and through the consummation of the transactions pursuant to the Modified Plan (as defined in Note 1. |
36
Table of Contents
| General to the audited consolidated financial statements included herein), transactions and events that were directly associated with the reorganization from the ongoing operations of the business. Our consolidated financial statements are not comparable to the consolidated financial statements of the Predecessor due to the effects of the consummation of the Modified Plan and the change in the basis of presentation. For more information, please refer to Item 7. Management’s Discussion and Analysis of Financial Condition and Results of Operations. |
| (2) | Our management utilizes net income before depreciation and amortization (including long-lived asset and goodwill impairment), interest expense, other income (expense), net, income tax expense and equity income, net of tax (“EBITDA”) to evaluate performance. EBITDA was used as a performance indicator for the year ended December 31, 2011. |
Through December 31, 2010, our management relied on Adjusted EBITDA as a key performance measure. Our management believed that net income before depreciation and amortization (including long-lived asset and goodwill impairment), interest expense, other income (expense), net, income tax expense, equity income, net of tax, transformation and rationalization charges related to plant consolidations, plant wind-downs and discontinued operations (“Adjusted EBITDA”) was a meaningful measure of performance and it was used by management and the Board of Managers of Delphi Automotive LLP to analyze Company and stand-alone segment operating performance and for planning and forecasting purposes. Effective January 1, 2011, our management began utilizing EBITDA as a key performance measure because our restructuring was substantially completed in 2010. EBITDA and Adjusted EBITDA should not be considered substitutes for results prepared in accordance with U.S. GAAP and should not be considered alternatives to net income (loss) attributable to Successor/Predecessor, which is the most directly comparable financial measure to EBITDA and Adjusted EBITDA that is in accordance with U.S. GAAP. EBITDA and Adjusted EBITDA, as determined and measured by us, should also not be compared to similarly titled measures reported by other companies.
In the year ended December 31, 2011, we reached a final customer commercial settlement that resulted in an unusual warranty expense of $76 million. This amount adversely affected EBITDA and Adjusted EBITDA in such period.
The reconciliation of Adjusted EBITDA to EBITDA includes other transformation and rationalization costs related to 1) the implementation of information technology systems to support finance, manufacturing and product development initiatives, 2) certain plant consolidations and closures costs and 3) consolidation of many staff administrative functions into a global business service group. The reconciliation of EBITDA and Adjusted EBITDA to net income (loss) attributable to Successor/Predecessor follows:
| Successor | Predecessor | |||||||||||||||||||||||||
| Period from August 19 to December 31, 2009 |
Period from January 1 to October 6, 2009 |
|||||||||||||||||||||||||
| Year ended December 31, | Year ended December 31, | |||||||||||||||||||||||||
| 2011 | 2010 | 2008 | 2007 | |||||||||||||||||||||||
| Adjusted EBITDA |
$ | 2,150 | $ | 1,633 | $ | 313 | $ | (229) | $ | 269 | $ | 731 | ||||||||||||||
| Transformation and rationalization charges: |
||||||||||||||||||||||||||
| Employee termination benefits and other exit costs |
(31) | (224) | (126) | (235) | (326) | (301) | ||||||||||||||||||||
| Other transformation and rationalization costs |
— | (48) | (58) | (50) | (154) | (814) | ||||||||||||||||||||
|
|
|
|
|
|
|
|
|
|
|
|
|
|||||||||||||||
| EBITDA |
$ | 2,119 | $ | 1,361 | $ | 129 | $ | (514) | $ | (211) | $ | (384) | ||||||||||||||
|
|
|
|
|
|
|
|
|
|
|
|
|
|||||||||||||||
| Depreciation and amortization |
(475) | (421) | (139) | (540) | (822) | (871) | ||||||||||||||||||||
| Goodwill impairment charges |
— | — | — | — | (325) | — | ||||||||||||||||||||
| Discontinued operations |
— | — | — | (64) | (67) | (302) | ||||||||||||||||||||
|
|
|
|
|
|
|
|
|
|
|
|
|
|||||||||||||||
| Operating income (loss) |
$ | 1,644 | $ | 940 | $ | (10) | $ | (1,118) | $ | (1,425) | $ | (1,557) | ||||||||||||||
|
|
|
|
|
|
|
|
|
|
|
|
|
|||||||||||||||
| Interest expense |
(123) | (30) | (8) | — | (434) | (764) | ||||||||||||||||||||
| Other (expense) income, net |
(15) | 34 | (17) | 24 | 9 | 47 | ||||||||||||||||||||
| Reorganization items |
— | — | — | 10,210 | 5,147 | (163) | ||||||||||||||||||||
|
|
|
|
|
|
|
|
|
|
|
|
|
|||||||||||||||
| Income (loss) from continuing operations before income taxes and equity income (loss) |
1,506 | 944 | (35) | 9,116 | 3,297 | (2,437) | ||||||||||||||||||||
| Income tax (expense) benefit |
(305) | (258) | 27 | 311 | (163) | 547 | ||||||||||||||||||||
| Equity income (loss), net of tax |
22 | 17 | 5 | (36) | 29 | 35 | ||||||||||||||||||||
| Loss from discontinued operations, net of tax |
— | — | — | (44) | (97) | (1,142) | ||||||||||||||||||||
|
|
|
|
|
|
|
|
|
|
|
|
|
|||||||||||||||
| Net income (loss) |
$ | 1,223 | $ | 703 | $ | (3) | $ | 9,347 | $ | 3,066 | $ | (2,997) | ||||||||||||||
| Net income attributable to noncontrolling interest |
78 | 72 | 15 | 29 | 29 | 68 | ||||||||||||||||||||
|
|
|
|
|
|
|
|
|
|
|
|
|
|||||||||||||||
| Net income (loss) attributable to Successor/Predecessor |
$ | 1,145 | $ | 631 | $ | (18) | $ | 9,318 | $ | 3,037 | $ | (3,065) | ||||||||||||||
|
|
|
|
|
|
|
|
|
|
|
|
|
|||||||||||||||
| (3) | EBITDA margin is defined as EBITDA as a percentage of revenues. Adjusted EBITDA margin is defined as Adjusted EBITDA as a percentage of revenues. |
| (4) | Working capital is calculated herein as accounts receivable plus inventories less accounts payable. |
| (5) | Excludes temporary and contract workers. As of December 31, 2011, we employed approximately 39,000 temporary and contract workers. |
37
Table of Contents
ITEM 7. MANAGEMENT’S DISCUSSION AND ANALYSIS OF FINANCIAL CONDITION AND RESULTS OF OPERATIONS
The following management’s discussion and analysis of financial condition and results of operations (“MD&A”) is intended to help you understand the business operations and financial condition of the Company for the three-year period ended December 31, 2011. This discussion should be read in conjunction with Item 8. Financial Statements and Supplementary Data. Our MD&A is presented in seven sections:
| • | Executive Overview |
| • | Consolidated Results of Operations |
| • | Results of Operations by Segment |
| • | Liquidity and Capital Resources |
| • | Off-Balance Sheet Arrangements and Other Matters |
| • | Significant Accounting Policies and Critical Accounting Estimates |
| • | Recently Issued Accounting Pronouncements |
Within the MD&A, “Delphi,” the “Company,” the “Successor,” “we,” “us” and “our” refer to Delphi Automotive PLC, a public limited company which was formed under the laws of Jersey on May 19, 2011, together with its subsidiaries, including Delphi Automotive LLP, a limited liability partnership incorporated under the laws of England and Wales which was formed on August 19, 2009 for the purpose of acquiring certain assets of the former Delphi Corporation, and became a subsidiary of Delphi Automotive PLC in connection with the completion of the Company’s initial public offering on November 22, 2011. The former Delphi Corporation and, as the context may require, its subsidiaries and affiliates, are referred to herein as the “Predecessor” or “Old Delphi”.
Executive Overview
Our Business
We are a leading global vehicle components manufacturer and provide electrical and electronic, powertrain, safety and thermal technology solutions to the global automotive and commercial vehicle markets. We are one of the largest vehicle component manufacturers and our customers include 24 of the 25 largest automotive OEMs in the world.
Business Strategy
We believe the Company is well-positioned for growth from increasing global vehicle production volumes, increased demand for our Safe, Green and Connected products which are being added to vehicle content, and new business wins with existing and new customers. As a result of the actions taken by the Predecessor and Delphi’s continuing efforts following its acquisition of the majority of the Predecessor’s businesses in October 2009, we have substantially reduced our costs, aligned our product offerings with the faster-growing industry mega trends and re-aligned our manufacturing footprint into an efficient regional service model, allowing us to increase our profit margins.
Our achievements in 2011 included the following:
| • | Optimizing our portfolio of 10 business units and 33 product lines around the mega trends of Safe, Green and Connected; |
38
Table of Contents
| • | Focusing on the diversification of our geographic, product and customer mix, resulting in 32% of our 2011 net sales being generated in the North American market, 23% of our 2011 net sales being generated in emerging markets, and 19% from our largest customer; |
| • | Continuing to reduce our cost structure and re-aligning our manufacturing footprint to increase our operational flexibility and maintain profitability at all points in the normal automotive business cycle, with approximately 90% of our hourly workforce in low cost countries and approximately 32% of our hourly workforce composed of temporary employees; |
| • | Achieving, based on our estimation, the #1 or #2 position in product categories representing over 72% of our 2011 net sales, including electrical/electronic distribution systems, automotive connection systems, diesel engine management systems, and infotainment & driver interface; |
| • | Providing products in 2011 that were found in 17 of the 20 top-selling vehicle models in the United States, in all of the 20 top-selling vehicle models in Europe and in 13 of the 20 top-selling vehicle models in China; |
| • | Generating gross business bookings of $23.5 billion, based upon expected volumes and pricing. |
| • | Completing our initial public offering in November 2011 and the listing of our ordinary shares on the New York Stock Exchange. |
Going forward, our strategy will be to build on these accomplishments and continue to develop and manufacture innovative market-relevant products for a diverse base of customers around the globe and leverage our lean and flexible cost structure to achieve strong earnings growth and returns on invested capital. Through our culture of innovation and world class engineering capabilities we intend to employ our rigorous, forward-looking product development process to deliver new technologies that provide solutions to OEMs. Key strategic priorities include:
Targeting the Right Business with the Right Customers. We intend to be strategic in our pursuit of new business and customers. We conduct in-depth analysis of market share and product trends by region in order to prioritize research, development, and engineering spend for the customers that we believe will be successful. Collaboration with customers in our 15 major technical centers around the world helps us develop innovative product solutions designed to meet their needs. As more OEMs design vehicles for global platforms, where the same vehicle architecture is shared among different regions, we are well suited to provide global design and engineering support while manufacturing these products for a specific regional market.
Leveraging Our Engineering and Technological Prowess. We seek to leverage our strong product portfolio tied to the industry’s key mega trends with our global footprint to increase our revenues, as well as committing to substantial annual investment in research and development to maintain and enhance our leadership in each of our product lines.
Capitalizing on Our Scale, Global Footprint and Established Position in Emerging Markets. We intend to generate sustained growth by capitalizing on the breadth and scale of our operating capabilities. Our global footprint provides us important proximity to our customers’ manufacturing facilities and allows us to serve them in every region in which they operate. We anticipate that we will continue to build upon our extensive geographic reach to capitalize on the fast-growing automotive markets, particularly in China, Brazil, India and Russia. In addition, our presence in low cost countries positions us to realize incremental margin improvements as the global balance of automotive production shifts towards emerging markets.
Leveraging Our Lean and Flexible Cost Structure to Deliver Profitability and Cash Flow. We recognize the importance of maintaining a lean and flexible cost structure in order to deliver stable earnings and cash flow in a cyclical industry. Our focus is on maximizing manufacturing output to meet increasing production requirements
39
Table of Contents
with minimal additions to our fixed-cost base. Additionally, we are continuing to use a meaningful amount of temporary workers to ensure we have the appropriate operational flexibility to scale our operations so that we can maintain our profitability as industry production levels increase or contract.
Pursuing Selected Acquisitions and Strategic Alliances. We intend to pursue selected transactions that leverage our technology capabilities and enhance our customer base, geographic penetration and scale to complement our current businesses.
Trends, Uncertainties and Opportunities
Rate of economic recovery. Our business is directly related to automotive sales and automotive vehicle production by our customers. Automotive sales depend on a number of factors, including economic conditions. The economy is recovering slowly from a recession that began in late 2007 and became increasingly severe with the global credit crisis in 2008 and 2009. The weaker economic conditions led to a substantial industry-wide decline in vehicle sales in 2008 and 2009. However, global automotive vehicle production increased over 3% from 2010 to 2011 and is expected to increase by an additional 5% to 6% in 2012. Any future economic declines that result in a significant reduction in automotive sales and production by our customers would have an adverse effect on our business, results of operations and financial condition. Additionally, volatility in oil and gasoline prices negatively impacts consumer confidence and automotive sales, as well as, the mix of future sales (from trucks and sport utility vehicles toward smaller, fuel-efficient passenger cars). While our diversified customer and geographic revenue base have well positioned us to withstand the impact of industry downturns and benefit from industry upturns, shifts to vehicles with less content would adversely impact our profitability.
Emerging markets growth. Rising income levels in the emerging markets of China, Brazil, India and Russia are resulting in stronger growth rates in these markets. Our strong global presence and presence in these markets have positioned us to experience above-market growth rates. We continue to expand our established presence in emerging markets, positioning us to benefit from the expected growth opportunities in these regions. We will accomplish this by capitalizing on our long-standing relationships with the global OEMs and further enhancing our positions with the emerging market OEMs to continue expanding our worldwide leadership. We will continue to build upon our extensive geographic reach to capitalize on the fast-growing automotive markets, particularly China, Brazil, India and Russia. We believe that our presence in low cost countries positions us to realize incremental margin improvements as the global balance of automotive production shifts towards the emerging markets.
We have a strong presence in China, where we have operated for nearly 20 years. All of our business segments have operations and sales in China. As a result, we have well-established relationships with all of the major OEMs in China. We generated approximately $2 billion in revenue from China in 2011. With only 21 of our 33 offered products currently locally manufactured, we believe we have the opportunity to expand additional product lines into China, and as a result, we see further growth potential.
Market driven products. Our product offerings satisfy the OEMs’ need to meet increasingly stringent government regulations and fulfill consumer preferences for products that address the mega trends of Safe, Green and Connected, leading to increased content per vehicle, greater profitability and higher margins. With these offerings, we believe we are well-positioned to capitalize on demand for increased safety, fuel efficiency, emissions control and connectivity to the global information network. There has been a substantial increase in vehicle content and electrification requiring a complex and reliable electrical architecture and systems to operate, such as hybrid power electronics, electrical vehicle monitoring, lane departure warning systems, integrated electronic displays, navigation systems and consumer electronics. Our ability to design a reliable electrical architecture that optimizes power distribution and/or consumption is key to satisfying the OEMs’ need to reduce emissions while continuing to meet the demands of consumers. Additionally, our Powertrain Systems and Thermal Systems segments are also focused on addressing the demand for increased fuel efficiency and emission control by controlling fuel consumption and heat dissipation, which are principal factors influencing fuel efficiency and emissions.
40
Table of Contents
Global capabilities. Many OEMs are adopting global vehicle platforms to increase standardization, reduce per unit cost and increase capital efficiency and profitability. As a result, OEMs are selecting suppliers that have the capability to manufacture products on a worldwide basis, as well as, the flexibility to adapt to regional variations. Suppliers with global scale and strong design, engineering and manufacturing capabilities, are best positioned to benefit from this trend. Our global footprint enables us to serve the global OEMs on a worldwide basis as we gain market share with the emerging market OEMs. This regional model has largely migrated to service the North American market out of Mexico, the South American market out of Brazil, the European market out of Eastern Europe and North Africa and the Asia Pacific market out of China.
Product development. The automotive component supply industry is highly competitive, both domestically and internationally. Our ability to anticipate changes in technology and regulatory standards and to successfully develop and introduce new and enhanced products on a timely basis will be a significant factor in our ability to remain competitive. To compete effectively in the automotive supply industry, we must be able to launch new products to meet our customers’ demands in a timely manner. Our innovative technologies and robust global engineering and development capabilities have well positioned us to meet the increasingly stringent vehicle manufacturer demands.
OEMs are increasingly looking to their suppliers to simplify vehicle design and assembly processes to reduce costs. As a result, suppliers that sell vehicle components directly to manufacturers (Tier I suppliers) have assumed many of the design, engineering, research and development and assembly functions traditionally performed by vehicle manufacturers. Suppliers that can provide fully-engineered solutions, systems and pre-assembled combinations of component parts are positioned to leverage the trend toward system sourcing.
Engineering, design & development. Our history and culture of innovation have enabled us to develop significant intellectual property and design and development expertise to provide advanced technology solutions that meet the demands of our customers. We have a team of more than 17,000 scientists, engineers and technicians focused on developing leading product solutions for our key markets, located at 15 major technical centers in Brazil, China, France, Germany, India, Luxembourg, Mexico, Poland, South Korea, the United Kingdom and the United States. We invest approximately $1 billion annually in research and development, including engineering, to maintain our portfolio of innovative products, and currently own approximately 5,500 patents. We also encourage “open innovation” and collaborate extensively with peers in the industry, government agencies and academic institutions. Our technology competencies are recognized by both customers and government agencies, who have co-invested approximately $400 million of additional funds annually in new product development, increasing our total spend accordingly, accelerating the pace of innovation and reducing the risk associated with successful commercialization of technological breakthroughs.
In the past, suppliers often incurred the initial cost of engineering, designing and developing automotive component parts, and recovered their investments over time by including a cost recovery component in the price of each part based on expected volumes. Recently, we and many other suppliers have negotiated for cost recovery payments independent of volumes. This trend reduces our economic risk.
Pricing. Cost-cutting initiatives adopted by our customers result in increased downward pressure on pricing. Our customer supply agreements generally require step-downs in component pricing over the periods of production and OEMs have historically possessed significant leverage over their outside suppliers because the automotive component supply industry is fragmented and serves a limited number of automotive OEMs. Our profitability depends in part on our ability to generate sufficient production cost savings in the future to offset price reductions.
In 2010, we largely completed our restructuring activities, resulting in a lower fixed cost base, improved manufacturing footprint and reduced overhead. We dramatically reduced our U.S. and Western European footprints, realigned our selling, general and administrative cost structure and increased the variable nature of our employee base. As a result, approximately 90% of our hourly workforce is located in low cost countries. Furthermore, we have substantial operational flexibility by leveraging a large workforce of temporary workers,
41
Table of Contents
which represented approximately 32% of the hourly workforce as of December 31, 2011. We are focused on maintaining a low fixed cost base to minimize our net income before depreciation and amortization (including long-lived asset and goodwill impairment), interest expense, other income (expense), net, income tax expense and equity income, net of tax (“EBITDA”) breakeven, which we estimate to be approximately 38% below the current production volumes, assuming constant product mix and based on 2011 results. We believe that our lean cost structure will allow us to remain profitable at all points of the traditional vehicle industry production cycle.
Efficient use of capital. The global vehicle components industry is generally capital intensive and a portion of a supplier’s capital equipment is frequently utilized for specific customer programs. Lead times for procurement of capital equipment are long and typically exceed start of production by one to two years. Substantial advantages exist for suppliers that can leverage their prior investments in capital equipment or amortize the investment over higher volume global customer programs.
Industry consolidation. Consolidation among worldwide suppliers is expected to continue as suppliers seek to achieve operating synergies and value stream efficiencies, acquire complementary technologies, and build stronger customer relationships as OEMs continue to expand globally. We believe companies with strong balance sheets and financial discipline are in the best position to take advantage of the industry consolidation trend. We have a strong balance sheet with gross debt of approximately $2.1 billion and substantial liquidity of approximately $2.7 billion of cash and cash equivalents and available financing under our Revolving Credit Facility (as defined below in Liquidity and Capital Resources) as of December 31, 2011, and no significant U.S. defined benefit or workforce postretirement health care benefits and employer-paid postretirement basic life insurance benefits (“OPEB”) liabilities. We intend to maintain strong financial discipline targeting industry-leading earnings growth, cash flow generation and return on invested capital and to maintain sufficient liquidity to sustain our financial flexibility throughout the industry cycle.
Our History and Structure
On August 19, 2009, Delphi Automotive LLP, a limited liability partnership organized under the laws of England and Wales, was formed for the purpose of acquiring certain assets and subsidiaries of the former Delphi Corporation, our Predecessor, which, along with certain of its U.S. subsidiaries, had filed voluntary petitions for bankruptcy in October 2005. On October 6, 2009, Delphi Automotive LLP acquired the major portion of the business of the Predecessor, other than the global steering business, the U.S. manufacturing facilities in which the hourly employees were represented by the UAW and certain non-productive U.S. assets, and Delphi Automotive LLP issued membership interests to a group of investors consisting of lenders to the Predecessor, GM and the Pension Benefit Guaranty Corporation (the “PBGC”). For additional information see Note 1. General to the audited consolidated financial statements included herein.
On March 31, 2011, all of the outstanding Class A and Class C membership interests held by GM and the PBGC were redeemed, respectively, for approximately $4.4 billion. The redemption transaction was funded by a $3.0 billion credit facility entered into on March 31, 2011 (the “Credit Facility”) and existing cash.
On May 19, 2011, Delphi Automotive PLC was formed as a Jersey public limited company, and had nominal assets, no liabilities and had conducted no operations prior to its initial public offering. On November 22, 2011, in conjunction with the completion of its initial public offering by the selling shareholders, all of the outstanding equity of Delphi Automotive LLP was exchanged for ordinary shares in Delphi Automotive PLC. As a result, Delphi Automotive LLP became a wholly-owned subsidiary of Delphi Automotive PLC.
Disposition of the Predecessor and Acquisition Accounting
On October 6, 2009 (the “Acquisition Date”), the Predecessor (i) consummated the transactions contemplated by the Modified Plan (as defined in Note 1. General to the audited consolidated financial statements included herein) and (ii) exited chapter 11 as DPH Holdings Corp. and its subsidiaries and affiliates
42
Table of Contents
(“DPHH”), except that two of the Predecessor’s debtor subsidiaries became subsidiaries of Delphi Automotive LLP. A summary of significant terms of the Modified Plan follows:
| • | We acquired the businesses (other than the global steering business and the manufacturing facilities in the U.S. at which the hourly employees are represented by the UAW of the Predecessor pursuant to the master disposition agreement (including all schedules and exhibits thereto, the “MDA”), and received $1,833 million from GM, of which $1,689 million was received on the Acquisition Date and $144 million was received during the Successor period from August 19 to December 31, 2009, and $209 million, net from certain of the debtor-in-possession (“DIP”) lenders to the Predecessor (collectively, the “Acquisition”). |
| • | GM acquired substantially all of the Predecessor’s global steering business and the manufacturing facilities in the U.S. at which the hourly employees were represented by the UAW. |
| • | The Predecessor’s debtor-in-possession financing was settled. |
| • | The Predecessor’s liabilities subject to compromise were extinguished. |
| • | If cumulative distributions to the members of Delphi Automotive LLP under certain provisions of its limited liability partnership agreement exceed $7.2 billion, we, as disbursing agent on behalf of DPHH, are required to pay to the holders of allowed general unsecured claims against the Predecessor, $32.50 for every $67.50 in excess of $7.2 billion distributed to the members, up to a maximum of $300 million. |
| • | The Predecessor’s equity holders did not receive recoveries on their claims. |
As a result of the Acquisition, we acquired the major portion of the business of the Predecessor and this business constituted the entirety of the operations of the Successor. Accordingly, as required under the applicable accounting guidance, the financial information set forth herein reflects the consolidated results of operations of the Successor for the years ended December 31, 2011 and 2010 and the period from its incorporation on August 19, 2009 to December 31, 2009 and of the Predecessor for the period from January 1, 2009 to October 6, 2009. Delphi Automotive LLP had no material or substantive transactions from its organization on August 19, 2009 to the Acquisition Date.
In 2009, the Predecessor recognized a gain of approximately $10.2 billion for reorganization items as a result of the process of reorganizing the Debtors (as defined and further discussed in Note 1. General to the audited consolidated financial statements included herein) under chapter 11 of the United States Bankruptcy Code. This gain reflects the extinguishment of liabilities subject to compromise, OPEB settlement and the sale/ disposition of the Predecessor, offset by the PBGC termination of the U.S. pension plans and professional fees directly related to the reorganization.
We have recorded the assets acquired and the liabilities assumed from the Predecessor at estimated fair values in accordance with the guidance in FASB ASC 820, Fair Value Measurements and Disclosures. The fair values were estimated based on valuations performed by an independent valuation specialist utilizing three generally accepted business valuation approaches. For additional information see Note 1. General to the audited consolidated financial statements included herein.
In connection with the Acquisition, we did not acquire all of the assets or assume all of the liabilities of the Predecessor. As noted above, the assets we acquired and the liabilities we assumed from the Predecessor were generally recorded at fair value, resulting in a change from the Predecessor’s basis. Accordingly, our consolidated financial statements are not comparable to the consolidated financial statements of the Predecessor due to the effects of the consummation of the Modified Plan. For these reasons, we do not generally present
43
Table of Contents
financial information on a combined basis for the Predecessor period from January 1 to October 6, 2009 and the Successor period from August 19 to December 31, 2009 (“Full Year 2009”), except as noted below. We have compared consolidated net sales and EBITDA of the Successor for the year ended December 31, 2010 to the total net sales and Adjusted EBITDA for the Full Year 2009. We believe these comparisons are most meaningful and useful in providing a thorough understanding of the financial statements. Where applicable, “Operations Not Acquired” is included in the tables below explaining the variance attributable to the acquisition by GM on October 6, 2009 of the manufacturing facilities in the U.S. at which the hourly employees were represented by the UAW.
Consolidated Results of Operations
Our improved total net sales during the year ended December 31, 2011 as compared to 2010 reflect the impacts of increased OEM production volumes as well as the level of our content per unit, and, to a lesser extent, the impacts of foreign currency exchange rate fluctuations. Although global OEM production volumes increased over 3%, for the year ended December 31, 2011 versus 2010, excluding production decreases from Japan and Japanese OEM production in North America of 9% resulting from the Japan earthquake and tsunami, global OEM production volumes increased 6%, for the year ended December 31, 2011 as compared to 2010. We did not experience any significant adverse impacts resulting from the Japan earthquake and tsunami, particularly given that the Japanese OEMs are not among our principal customers. To the extent that the Japanese OEMs grow faster than others as they make up for lost production in 2011, we would expect that our volume growth from our OEM customers could be slower than the market.
The improvements in OEM production volumes continue to indicate a stabilization of the global economy. However, current OEM production volumes in North America and Western Europe continue to be substantially less than OEM production volumes prior to the disruptions in the economic and credit markets experienced in 2008 and 2009. As a result of the significant restructuring actions implemented by the Predecessor and continued by us in 2010, our reduced cost structure is enabling us to translate the total net sales growth achieved in 2011 into strong gross margin and improved operating earnings.
Significant issues affected the Predecessor’s financial performance in 2009, including a depressed global vehicle production environment for OEMs, pricing pressures and increasingly volatile commodity prices. In addition, the Predecessor was adversely impacted by legacy U.S. labor liabilities, which included noncompetitive wage and benefit levels and restrictive collectively-bargained labor agreement provisions which historically inhibited the Predecessor’s responsiveness to market conditions, including exiting non-strategic, non-profitable operations or flexing the size of the unionized workforce when volume decreases. Also, during 2009, the Predecessor’s operational challenges intensified as a result of the continued downturn in general economic conditions, including reduced consumer spending and confidence, high oil prices and the credit market crisis, all of which resulted in global vehicle manufacturers reducing production and taking other restructuring actions.
We benefited from the restructuring initiatives implemented throughout the last several years and in particular, in 2009 from the restructuring of the business that took place through the acquisition of the Predecessor’s global steering business and the UAW manufacturing facilities by GM, together with its subsidiaries and affiliates, in the U.S. as of the Acquisition Date, as defined and further discussed below. In addition, we benefited from the increase in OEM production volumes beginning in the fourth quarter of 2009 and continuing throughout 2010 and 2011. Our results of operations include the effects of the improvement in the cost structure and the operating leverage we can now employ with improvements in OEM production volumes versus the Predecessor. While production volume levels improved in 2011 and 2010 as compared to the production volume levels experienced in 2009, we continued to face challenges, with production volumes globally still significantly lower than 2007 due to the lingering effects from the disruptions in the economy and credit markets in 2008 and 2009 and volatile commodity prices. As a result of the Acquisition, beginning in 2010, we incurred and expect to incur incremental, annual non-cash amortization charges of approximately $80 million related to the recognition of acquired intangible assets. Additionally, in conjunction with the initial public offering in November 2011, we incurred transaction-related fees and recognized expenses in the year ended December 31, 2011 of approximately $44 million.
44
Table of Contents
We typically experience fluctuations in revenue due to changes in OEM production schedules, vehicle sales mix and the net of new and lost business (which we refer to collectively as volume), increased prices attributable to escalation clauses in our supply contracts for recovery of increased commodity costs (which we refer to as commodity pass-through), fluctuations in foreign currency exchange rates (which we refer to as FX), contractual reductions of the sales price to the OEM (which we refer to as contractual price reductions) and engineering changes. Changes in sales mix can have either favorable or unfavorable impact on revenue. Such changes can be the result of shifts in regional growth, shifts in OEM sales demand, as well as shifts in consumer demand related to vehicle segment purchases and content penetration. For instance, a shift in sales demand favoring a particular OEM’s vehicle model for which we do not have a supply contract may negatively impact our revenue. A shift in regional sales demand toward certain markets could favorably impact the sales of those of our customers that have a large market share in those regions, which in turn would be expected to have a favorable impact on our revenue.
We typically experience (as described below) fluctuations in operating income due to:
| • | Volume, net of contractual price reductions—changes in volume offset by contractual price reductions (which typically range from 1% to 3% of net sales); |
| • | Operational performance—changes to costs for materials and commodities or manufacturing variances; and |
| • | Other—including restructuring costs and any remaining variances not included in Volume, net of contractual price reductions or Operational performance. |
The automotive component supply industry is subject to inflationary pressures with respect to raw materials and labor which have placed and will continue to place operational and profitability burdens on the entire supply chain. We will continue to work with our customers and suppliers to mitigate the impact of these inflationary pressures in the future. In addition, we expect commodity cost volatility, particularly related to copper, aluminum and petroleum-based resin products, to have a continual impact on future earnings and/or operating cash flows. As such, we continually seek to mitigate both inflationary pressures and our material-related cost exposures using a number of approaches, including combining purchase requirements with customers and/or other suppliers, using alternate suppliers or product designs, negotiating cost reductions and/or commodity cost contract escalation clauses into our vehicle manufacturer supply contracts, and hedging.
45
Table of Contents
2011 versus 2010
The results of operations for the years ended December 31, 2011 and 2010 were as follows:
| Year Ended December 31, | ||||||||||||||||||||
| 2011 | 2010 | Favorable/ (unfavorable) |
||||||||||||||||||
| (dollars in millions) | ||||||||||||||||||||
| Net sales |
$ | 16,041 | $ | 13,817 | $ | 2,224 | ||||||||||||||
| Cost of sales |
13,386 | 11,768 | (1,618) | |||||||||||||||||
|
|
|
|
|
|
|
|||||||||||||||
| Gross margin |
2,655 | 16.6 | % | 2,049 | 14.8 | % | 606 | |||||||||||||
| Selling, general and administrative |
901 | 815 | (86) | |||||||||||||||||
| Amortization |
79 | 70 | (9) | |||||||||||||||||
| Restructuring |
31 | 224 | 193 | |||||||||||||||||
|
|
|
|
|
|
|
|||||||||||||||
| Operating income |
1,644 | 940 | 704 | |||||||||||||||||
| Interest expense |
(123) | (30) | (93) | |||||||||||||||||
| Other (expense) income, net |
(15) | 34 | (49) | |||||||||||||||||
|
|
|
|
|
|
|
|||||||||||||||
| Income before income taxes and equity income |
1,506 | 944 | 562 | |||||||||||||||||
| Income tax expense |
(305) | (258) | (47) | |||||||||||||||||
|
|
|
|
|
|
|
|||||||||||||||
| Income before equity income |
1,201 | 686 | 515 | |||||||||||||||||
| Equity income, net of tax |
22 | 17 | 5 | |||||||||||||||||
|
|
|
|
|
|
|
|||||||||||||||
| Net income |
1,223 | 703 | 520 | |||||||||||||||||
| Net income attributable to noncontrolling interest |
78 | 72 | 6 | |||||||||||||||||
|
|
|
|
|
|
|
|||||||||||||||
| Net income attributable to Delphi |
$ | 1,145 | $ | 631 | $ | 514 | ||||||||||||||
|
|
|
|
|
|
|
|||||||||||||||
Total Net Sales
Below is a summary of our total net sales for the year ended December 31, 2011 versus December 31, 2010.
| Year ended December 31, | Variance due to: | |||||||||||||||||||||||||||||||
| 2011 | 2010 | Favorable/ (unfavorable) |
Volume, net of contractual price reductions |
FX | Commodity pass- through |
Other | Total | |||||||||||||||||||||||||
| (in millions) | (in millions) | |||||||||||||||||||||||||||||||
| Total net sales |
$ | 16,041 | $ | 13,817 | $ | 2,224 | $ | 1,721 | $ | 419 | $ | 229 | $ | (145) | $ | 2,224 | ||||||||||||||||
Total net sales for the year ended December 31, 2011 increased 16% compared to year ended December 31, 2010. The increase in total net sales resulted primarily from increased volume as a result of improved OEM production schedules in 2011 as well as the level of our content per unit, and to a lesser extent, the impacts of foreign currency exchange rate fluctuations primarily related to the Euro. Additionally, included in Other above are decreased sales of approximately $120 million related to divestitures that occurred during the year ended December 31, 2010.
Operating Results
The information below summarizes the operating results for the year ended December 31, 2011 as compared to the year ended December 31, 2010.
46
Table of Contents
Cost of Sales
Cost of sales is primarily comprised of material, labor, manufacturing overhead, freight, fluctuations in foreign currency exchange rates, product engineering, design and development expenses, depreciation and amortization, warranty costs and other operating expenses. Gross margin is revenue less cost of sales and gross margin percentage is gross margin as a percent of net sales. Cost of sales increased $1,618 million for the year ended December 31, 2011 compared to the year ended December 31, 2010, as summarized below.
| Year ended December 31, | Variance due to: | |||||||||||||||||||||||||||
| 2011 | 2010 | Favorable/ (unfavorable) |
Volume(1) | Operational performance |
Other | Total | ||||||||||||||||||||||
| (dollars in millions) | (in millions) | |||||||||||||||||||||||||||
| Cost of sales |
$ | 13,386 | $ | 11,768 | $ | (1,618 | ) | $ | (1,285 | ) | $ | 177 | $ | (510 | ) | $ | (1,618 | ) | ||||||||||
| Gross margin |
$ | 2,655 | $ | 2,049 | $ | 606 | $ | 436 | $ | 177 | $ | (7 | ) | $ | 606 | |||||||||||||
| Percentage of net sales |
16.6 | % | 14.8 | % | ||||||||||||||||||||||||
| (1) | Presented net of contractual price reductions for gross margin variance. |
The increase in cost of sales was driven by increases in volume and the following items in other above:
| • | $229 million of increased pass-through commodity costs, which were offset in sales through contract escalation clauses with our customers; |
| • | Increased depreciation of fixed assets, including tooling, of $45 million; and |
| • | Approximately $360 million due to fluctuations in foreign currency exchange rates. |
These increases were partially offset by improved operational performance as well as $94 million related to divested businesses (primarily the occupant protection systems business on March 31, 2010).
Selling, General and Administrative Expense
| Year ended December 31, | ||||||||||||
| 2011 | 2010 | Favorable/ (unfavorable) |
||||||||||
| (dollars in millions) | ||||||||||||
| Selling, general and administrative expense |
$ | 901 | $ | 815 | $ | (86) | ||||||
| Percentage of net sales |
5.6 | % | 5.9 | % | ||||||||
Selling, general and administrative expense (“SG&A”) includes administrative expenses, information technology costs and incentive compensation related costs, and declined as a percent of sales during the year ended December 31, 2011 compared to 2010 due to maintaining administrative and information technology cost increases at or lower than the increasing rate of net sales. Increases in SG&A were largely attributable to foreign exchange effects and increased accruals for incentive compensation of $29 million including the accelerated vesting of Board of Directors shares upon our initial public offering.
Amortization
| Year ended December 31, | ||||||||||||
| 2011 | 2010 | Favorable/ (unfavorable) |
||||||||||
| (in millions) | ||||||||||||
| Amortization |
$ | 79 | $ | 70 | $ | (9) | ||||||
47
Table of Contents
Amortization expense reflects the non-cash charge related to definite-lived intangible assets, primarily recognized as part of the Acquisition.
Restructuring
| Year ended December 31, | ||||||||||||
| 2011 | 2010 | Favorable/ (unfavorable) |
||||||||||
| (dollars in millions) | ||||||||||||
| Restructuring |
$ | 31 | $ | 224 | $ | 193 | ||||||
| Percentage of net sales |
0.2 | % | 1.6 | % | ||||||||
The decrease in restructuring expense is due to a decline in workforce reductions and programs related to the rationalization of manufacturing and engineering processes, including plant closures, in the year ended December 31, 2011 as compared to 2010, as we had largely completed our significant restructuring programs by the end of 2010.
Refer to Note 11. Restructuring to the audited consolidated financial statements included herein for additional information.
Interest Expense
| Year ended December 31, | ||||||||||||
| 2011 | 2010 | Favorable/ (unfavorable) |
||||||||||
| (dollars in millions) | ||||||||||||
| Interest expense |
$ | 123 | $ | 30 | $ | (93) | ||||||
| Percentage of net sales |
0.8 | % | 0.2 | % | ||||||||
The increase in interest expense for the year ended December 31, 2011 as compared to 2010 is due to changes in debt balances, primarily related to the borrowings under the credit agreement (the “Credit Agreement”) and issuance of the $500 million of 5.875% senior notes due 2019 and $500 million of 6.125% senior notes due 2021 (collectively, the “Senior Notes”), in conjunction with the redemption of the Class A and Class C membership interests.
Refer to Note 12. Debt to the audited consolidated financial statements included herein for additional information.
Other (Expense) Income, Net
| Year ended December 31, | ||||||||||||
| 2011 | 2010 | Favorable/ (unfavorable) |
||||||||||
| (in millions) | ||||||||||||
| Other (expense) income, net |
$ | (15) | $ | 34 | $ | (49) | ||||||
The increase in other expense for the year ended December 31, 2011 as compared to other income for the year ended December 31, 2010 was primarily the result of incurring approximately $44 million in transaction costs related to our initial public offering in November 2011, and an increase of $8 million loss on extinguishment of debt.
Refer to Note 18. Other income (expense), net to the audited consolidated financial statements included herein for additional information.
48
Table of Contents
Income Taxes
| Year ended December 31, | ||||||||||||
| 2011 | 2010 | Favorable/ (unfavorable) |
||||||||||
| (in millions) | ||||||||||||
| Income tax expense |
$ | 305 | $ | 258 | $ | (47) | ||||||
The effective tax rate was 20% and 27% in 2011 and 2010, respectively. The Company’s tax rate is affected by the tax rates in the jurisdictions in which the Company operates, the relative amount of income earned by jurisdiction, and the relative amount of losses or income for which no tax benefit or expense was recognized due to a valuation allowance. In 2011, tax incentives of $64 million were obtained in various non-U.S. countries, primarily Hi-Tech Enterprise status in China and the Maquiladora regime in Mexico, and a $65 million tax benefit for income earned in jurisdictions where a valuation allowance has been recorded, primarily in France.
We recognized a $52 million, primarily Germany, and $21 million tax benefit in 2011 and 2010, respectively, related to changes in judgment of valuation allowances for the realization of deferred tax assets. During 2011, the Company recorded a withholding tax of $10 million related to the funding of the redemption of all the outstanding Class A and Class C membership interests and $27 million related to changes in our assertion with respect to our intent to repatriate foreign earnings in certain countries.
Our annual effective tax rate may be impacted by future events including changes in tax laws, geographic income mix, cash requirements, tax audits, closure of tax years, legal entity restructuring and changes in valuation allowances on deferred tax assets. Our effective tax rate can potentially have wide variances from quarter to quarter, resulting from interim reporting requirements and the recognition of discrete events.
Equity Income
| Year ended December 31, | ||||||||||||
| 2011 | 2010 | Favorable/ (unfavorable) |
||||||||||
| (in millions) | ||||||||||||
| Equity income, net of tax |
$ | 22 | $ | 17 | $ | 5 | ||||||
Equity income reflects our interest in the results of ongoing operations of entities accounted for as equity-method investments. Equity income increased during the year ended December 31, 2011 as compared to 2010 partially due to the recognition of $8 million of gain on the sale of our 49.5% interest in Daesung Electric, Co., Ltd as well as improved performance at our Mexican and Korean joint ventures. These increases were partially offset by a $7 million impairment charge related to a European joint venture.
Results of Operations by Segment
We operate our core business along the following operating segments, which are grouped on the basis of similar product, market and operating factors:
| • | Electrical/Electronic Architecture, which includes complete electrical architecture and component products. |
| • | Powertrain Systems, which includes extensive systems integration expertise in gasoline, diesel and fuel handling and full end-to-end systems including fuel injection, combustion, electronics controls, exhaust handling, test and validation capabilities, diesel and automotive aftermarket, and original equipment service. |
49
Table of Contents
| • | Electronics and Safety, which includes component and systems integration expertise in infotainment and connectivity, body controls and security systems, displays, mechatronics, passive and active safety electronics and electric and hybrid electric vehicle power electronics, as well as advanced development of software. |
| • | Thermal Systems, which includes heating, ventilating and air conditioning systems, components for multiple transportation and other adjacent markets, and powertrain cooling and related technologies. |
| • | Eliminations and Other, which includes i) the elimination of inter-segment transactions, and ii) certain other expenses and income of a non-operating or strategic nature. |
Through December 31, 2010, we evaluated performance based on stand-alone segment Adjusted EBITDA and accounted for inter-segment sales and transfers as if the sales or transfers were to third parties, at current market prices. Our management believed that Adjusted EBITDA was a meaningful measure of performance and it was used by management to analyze Company and stand-alone segment operating performance. Management also used Adjusted EBITDA for planning and forecasting purposes. Effective January 1, 2011, our management began utilizing segment EBITDA as a key performance measure because our restructuring was substantially completed by the end of 2010. Segment EBITDA and Adjusted EBITDA should not be considered substitutes for results prepared in accordance with U.S. GAAP and should not be considered alternatives to net income attributable to Delphi, which is the most directly comparable financial measure to EBITDA and Adjusted EBITDA that is in accordance with U.S. GAAP. Segment EBITDA and Adjusted EBITDA, as determined and measured by us, should also not be compared to similarly titled measures reported by other companies.
The reconciliation of EBITDA to net income attributable to Delphi for the year ended December 31, 2011 is as follows:
| Electrical/ Electronic Architecture |
Powertrain Systems |
Electronics and Safety |
Thermal Systems |
Eliminations and Other |
Total | |||||||||||||||||||
| (in millions) | ||||||||||||||||||||||||
| For the year ended December 31, 2011: |
||||||||||||||||||||||||
| EBITDA |
$ | 868 | $ | 710 | $ | 369 | $ | 172 | $ | — | $ | 2,119 | ||||||||||||
| Depreciation and amortization |
(131) | (195) | (105) | (44) | — | (475) | ||||||||||||||||||
|
|
|
|
|
|
|
|
|
|
|
|
|
|||||||||||||
| Operating income |
$ | 737 | $ | 515 | $ | 264 | $ | 128 | $ | — | $ | 1,644 | ||||||||||||
|
|
|
|
|
|
|
|
|
|
|
|||||||||||||||
| Interest expense |
(123) | |||||||||||||||||||||||
| Other expense, net |
(15) | |||||||||||||||||||||||
|
|
|
|||||||||||||||||||||||
| Income before income taxes and equity income |
1,506 | |||||||||||||||||||||||
| Income tax expense |
(305) | |||||||||||||||||||||||
| Equity income |
22 | |||||||||||||||||||||||
|
|
|
|||||||||||||||||||||||
| Net income |
$ | 1,223 | ||||||||||||||||||||||
| Net income attributable to noncontrolling interest |
78 | |||||||||||||||||||||||
|
|
|
|||||||||||||||||||||||
| Net income attributable to Delphi |
$ | 1,145 | ||||||||||||||||||||||
|
|
|
|||||||||||||||||||||||
For the year ended December 31, 2010, the reconciliation of Adjusted EBITDA to EBITDA includes other restructuring costs related to 1) the implementation of projects aimed at reducing the cost and improving the functionality of information technology systems to support finance, manufacturing and product development initiatives, 2) certain plant consolidations and closures costs, 3) continued consolidation of many staff administrative activities, and 4) employee benefit plan settlements in Mexico.
50
Table of Contents
The reconciliation of EBITDA to net income attributable to Delphi for the year ended December 31, 2010 is as follows:
| Electrical/ Electronic Architecture |
Powertrain Systems |
Electronics and Safety |
Thermal Systems |
Eliminations and Other |
Total | |||||||||||||||||||
| (in millions) | ||||||||||||||||||||||||
| For the year ended December 31, 2010: |
||||||||||||||||||||||||
| Adjusted EBITDA |
$ | 758 | $ | 423 | $ | 293 | $ | 165 | $ | (6) | $ | 1,633 | ||||||||||||
| Restructuring charges: |
||||||||||||||||||||||||
| Employee termination benefits and other exit costs |
(94) | (49) | (29) | (52) | — | (224) | ||||||||||||||||||
| Other restructuring costs |
(14) | (13) | (17) | (4) | — | (48) | ||||||||||||||||||
|
|
|
|
|
|
|
|
|
|
|
|
|
|||||||||||||
| EBITDA |
$ | 650 | $ | 361 | $ | 247 | $ | 109 | $ | (6) | 1,361 | |||||||||||||
|
|
|
|
|
|
|
|
|
|
|
|
|
|||||||||||||
| Depreciation and amortization |
(108) | (170) | (100) | (42) | (1) | (421) | ||||||||||||||||||
|
|
|
|
|
|
|
|
|
|
|
|
|
|||||||||||||
| Operating income (loss) |
$ | 542 | $ | 191 | $ | 147 | $ | 67 | $ | (7) | $ | 940 | ||||||||||||
|
|
|
|
|
|
|
|
|
|
|
|||||||||||||||
| Interest expense |
(30) | |||||||||||||||||||||||
| Other income, net |
34 | |||||||||||||||||||||||
|
|
|
|||||||||||||||||||||||
| Income before income taxes and equity income |
944 | |||||||||||||||||||||||
| Income tax expense |
(258) | |||||||||||||||||||||||
| Equity income |
17 | |||||||||||||||||||||||
|
|
|
|||||||||||||||||||||||
| Net income |
$ | 703 | ||||||||||||||||||||||
| Net income attributable to noncontrolling interest |
72 | |||||||||||||||||||||||
|
|
|
|||||||||||||||||||||||
| Net income attributable to Delphi |
$ | 631 | ||||||||||||||||||||||
|
|
|
|||||||||||||||||||||||
Net sales, gross margin as a percentage of net sales and EBITDA by segment for the years ended December 31, 2011 and 2010 are as follows:
Net Sales by Segment
| Years ended December 31, | Variance due to: | |||||||||||||||||||||||||||||||
| 2011 | 2010 | Favorable/ (unfavorable) |
Volume, net of contractual price reductions |
FX | Commodity pass-through |
Other | Total | |||||||||||||||||||||||||
| (in millions) | (in millions) | |||||||||||||||||||||||||||||||
| Electrical/Electronic Architecture |
$ | 6,642 | $ | 5,620 | $ | 1,022 | $ | 632 | $ | 169 | $ | 220 | $ | 1 | $ | 1,022 | ||||||||||||||||
| Powertrain Systems |
4,970 | 4,086 | 884 | 749 | 143 | 1 | (9) | 884 | ||||||||||||||||||||||||
| Electronics and Safety |
2,931 | 2,721 | 210 | 260 | 64 | — | (114) | 210 | ||||||||||||||||||||||||
| Thermal Systems |
1,755 | 1,603 | 152 | 86 | 56 | 8 | 2 | 152 | ||||||||||||||||||||||||
| Eliminations and Other |
(257) | (213) | (44) | (6) | (13) | — | (25) | (44) | ||||||||||||||||||||||||
|
|
|
|
|
|
|
|
|
|
|
|
|
|
|
|
|
|||||||||||||||||
| Total |
$ | 16,041 | $ | 13,817 | $ | 2,224 | $ | 1,721 | $ | 419 | $ | 229 | $ | (145) | $ | 2,224 | ||||||||||||||||
|
|
|
|
|
|
|
|
|
|
|
|
|
|
|
|
|
|||||||||||||||||
| • | Included in Other above are decreased sales of approximately $120 million related to divestitures that occurred during the year ended December 31, 2010. |
51
Table of Contents
Gross Margin Percentage by Segment
| Year ended December 31, | ||||||||
| 2011 | 2010 | |||||||
| Electrical/Electronic Architecture |
16.7 | % | 16.8 | % | ||||
| Powertrain Systems |
17.6 | % | 13.8 | % | ||||
| Electronics and Safety |
15.5 | % | 12.8 | % | ||||
| Thermal Systems |
12.6 | % | 12.4 | % | ||||
| Eliminations and Other |
0.0 | % | 1.4 | % | ||||
| Total |
16.6 | % | 14.8 | % | ||||
EBITDA by Segment
| Year ended December 31, | Variance due to: | |||||||||||||||||||||||||||
| 2011 | 2010 | Favorable/ (unfavorable) |
Volume, net of contractual price reductions |
Operational performance |
Other | Total | ||||||||||||||||||||||
| (in millions) | (in millions) | |||||||||||||||||||||||||||
| Electrical/Electronic Architecture |
$ | 868 | $ | 650 | $ | 218 | $ | 145 | $ | 19 | $ | 54 | $ | 218 | ||||||||||||||
| Powertrain Systems |
710 | 361 | 349 | 260 | 71 | 18 | 349 | |||||||||||||||||||||
| Electronics and Safety |
369 | 247 | 122 | 37 | 70 | 15 | 122 | |||||||||||||||||||||
| Thermal Systems |
172 | 109 | 63 | (6) | 17 | 52 | 63 | |||||||||||||||||||||
| Eliminations and Other |
— | (6) | 6 | — | — | 6 | 6 | |||||||||||||||||||||
|
|
|
|
|
|
|
|
|
|
|
|
|
|
|
|||||||||||||||
| Total |
$ | 2,119 | $ | 1,361 | $ | 758 | $ | 436 | $ | 177 | $ | 145 | $ | 758 | ||||||||||||||
|
|
|
|
|
|
|
|
|
|
|
|
|
|
|
|||||||||||||||
As noted in the table above, EBITDA for the year ended December 31, 2011 as compared to 2010 was impacted by volume and contractual price reductions and operational performance improvements, as well as the following items included in Other in the table above:
| • | Reduced restructuring of $193 million in 2011 related to reduced employee termination benefits and other exit costs as we had largely completed our significant restructuring programs by the end of 2010; |
| • | $49 million due to fluctuations in foreign currency rates; |
| • | Offset by $57 million principally due to increased accruals for incentive compensation in 2011 related to our executive Long-Term Incentive Plan, as well as vesting of Board of Directors shares including accelerated vesting upon our initial public offering; and |
| • | $23 million related to divestitures that occurred during the year ended December 31, 2010. |
52
Table of Contents
Consolidated Results of Operations
2010 versus 2009
The results of operations for the year ended December 31, 2010 and the periods from August 19 to December 31, 2009 (“Successor Period of 2009”) and January 1 to October 6, 2009 (“Predecessor Period of 2009”) were as follows:
| Successor | Predecessor | |||||||||||||||||||||||
| Year ended December 31, 2010 |
Period from August 19
to December 31, 2009 |
Period from January 1
to October 6, 2009 |
||||||||||||||||||||||
| (dollars in millions) | (dollars in millions) | |||||||||||||||||||||||
| Net sales |
$ | 13,817 | $ | 3,421 | $ | 8,334 | ||||||||||||||||||
| Cost of sales |
11,768 | 3,047 | 8,480 | |||||||||||||||||||||
|
|
|
|
|
|
|
|||||||||||||||||||
| Gross margin |
2,049 | 14.8 | % | 374 | 10.9 | % | (146 | ) | (1.8 | )% | ||||||||||||||
| Selling, general and administrative |
815 | 242 | 734 | |||||||||||||||||||||
| Amortization |
70 | 16 | 3 | |||||||||||||||||||||
| Restructuring |
224 | 126 | 235 | |||||||||||||||||||||
|
|
|
|
|
|
|
|||||||||||||||||||
| Operating income (loss) |
940 | (10 | ) | (1,118 | ) | |||||||||||||||||||
| Interest expense |
(30 | ) | (8 | ) | — | |||||||||||||||||||
| Other income (expense), net |
34 | (17 | ) | 24 | ||||||||||||||||||||
| Reorganization items |
— | — | 10,210 | |||||||||||||||||||||
|
|
|
|
|
|
|
|||||||||||||||||||
| Income (loss) from continuing operations before income taxes and equity income (loss) |
944 | (35 | ) | 9,116 | ||||||||||||||||||||
| Income tax (expense) benefit |
(258 | ) | 27 | 311 | ||||||||||||||||||||
|
|
|
|
|
|
|
|||||||||||||||||||
| Income (loss) from continuing operations before equity income (loss) |
686 | (8 | ) | 9,427 | ||||||||||||||||||||
| Equity income (loss), net of tax |
17 | 5 | (36 | ) | ||||||||||||||||||||
|
|
|
|
|
|
|
|||||||||||||||||||
| Income (loss) from continuing operations |
703 | (3 | ) | 9,391 | ||||||||||||||||||||
| Loss from discontinued operations, net of tax |
— | — | (44 | ) | ||||||||||||||||||||
|
|
|
|
|
|
|
|||||||||||||||||||
| Net income (loss) |
703 | (3 | ) | 9,347 | ||||||||||||||||||||
| Net income attributable to noncontrolling interest |
72 | 15 | 29 | |||||||||||||||||||||
|
|
|
|
|
|
|
|||||||||||||||||||
| Net income (loss) attributable to Successor/Predecessor |
$ | 631 | $ | (18 | ) | $ | 9,318 | |||||||||||||||||
|
|
|
|
|
|
|
|||||||||||||||||||
Total Net Sales
Total net sales for the year ended December 31, 2010 as compared to Full Year 2009 were as follows:
| Successor | Predecessor | Variance due to: | ||||||||||||||||||||||||||||||||||||||
| Year ended December 31, 2010 |
Period from August 19 to December 31, 2009 |
Period from January 1 to October 6, 2009 |
2010 versus full year 2009 favorable/ (unfavorable) |
Operations not acquired |
Volume, net of contractual price reductions |
FX | Commodity pass- through |
Other | Total | |||||||||||||||||||||||||||||||
| (in millions) | (in millions) | (in millions) | ||||||||||||||||||||||||||||||||||||||
| Total net sales |
$ | 13,817 | $ | 3,421 | $ | 8,334 | $ | 2,062 | $ | (639) | $ | 2,725 | $ | (91) | $ | 145 | $ | (78) | $ | 2,062 | ||||||||||||||||||||
Total net sales in 2010 increased 18% compared to Full Year 2009 net sales. Excluding the sales impacts of the Operations Not Acquired, sales increased 24% in 2010. The increase in total net sales resulted primarily from increased volume as a result of rebounding OEM production schedules throughout 2010.
53
Table of Contents
Cost of Sales
Cost of sales is primarily comprised of material, labor, manufacturing overhead, freight, fluctuations in foreign currency exchange rates, product engineering, design and development expenses, depreciation and amortization, warranty costs and other operating expenses.
| Successor | Predecessor | |||||||||||||
| Year ended December 31, 2010 |
Period from August 19 to December 31, 2009 |
Period from January 1 to October 6, 2009 |
||||||||||||
| (dollars in millions) | (dollars in millions) | |||||||||||||
| Cost of sales |
$ | 11,768 | $ | 3,047 | $ | 8,480 | ||||||||
| Gross margin |
$ | 2,049 | $ | 374 | $ | (146 | ) | |||||||
| Percentage of net sales |
14.8 | % | 10.9 | % | (1.8 | )% | ||||||||
Successor
Cost of sales in the year ended December 31, 2010 was impacted by higher volume offset by favorable operational performance and our reduced cost structure due to previous restructuring actions. Additionally, cost of sales was impacted by the following items:
| • | Warranty costs of $142 million; |
| • | Depreciation of fixed assets, including tooling, of $323 million; and |
| • | Pension and OPEB costs of $71 million. |
Cost of sales in the Successor Period of 2009 was impacted by higher volume offset by favorable operational performance and our reduced cost structure due to previous restructuring actions. Additionally, cost of sales was impacted by the following items:
| • | Warranty costs of $24 million; |
| • | Non-recurring $34 million non-cash charge as a result of the sale of inventory acquired from the Predecessor, which was required to be recorded at fair value as a result of the Acquisition; |
| • | Depreciation of fixed assets, including tooling, of $115 million; and |
| • | Pension and OPEB costs of $23 million. |
Predecessor
Cost of sales in the Predecessor Period of 2009 was impacted by the relatively fixed cost nature of the Predecessor’s operations that inhibited the Predecessor’s ability to adjust its cost structure appropriately to the reduced volumes resulting from the economic and credit crises of 2008 and 2009 that adversely impacted OEM production levels. Additionally, cost of sales was impacted by the following items:
| • | Warranty costs of $114 million; |
| • | Depreciation of fixed assets, including tooling, and including impairments, of $502 million; and |
| • | Pension and OPEB costs of $134 million. |
54
Table of Contents
Selling, General and Administrative Expense
| Successor | Predecessor | |||||||||||||
| Year ended December 31, 2010 |
Period from August 19 to December 31, 2009 |
Period from January 1 to October 6, 2009 |
||||||||||||
| (dollars in millions) | (dollars in millions) | |||||||||||||
| Selling, general and administrative expense |
$ | 815 | $ | 242 | $ | 734 | ||||||||
| Percentage of net sales |
5.9 | % | 7.1 | % | 8.8 | % | ||||||||
Successor
SG&A continued to decline as a percent of sales in the year ended December 31, 2010 and the Successor Period of 2009 as compared to the Predecessor Period of 2009 as a result of the positive effects of cost savings initiatives.
Predecessor
During the Predecessor Period of 2009, the impact of cost saving and restructuring initiatives had not yet been fully realized. In addition, reduced volumes during 2009 resulted in SG&A being a larger percentage of net sales due to the fixed nature of certain SG&A costs.
Amortization
| Successor | Predecessor | |||||||||||||
| Year ended December 31, 2010 |
Period from August 19 to December 31, 2009 |
Period from January 1 to October 6, 2009 |
||||||||||||
| (in millions) | (in millions) | |||||||||||||
| Amortization |
$ | 70 | $ | 16 | $ | 3 | ||||||||
Successor
Amortization for the year ended December 31, 2010 and the Successor Period of 2009 is a result of the recognition at fair value of approximately $766 million of intangible assets that we acquired as a part of the Acquisition.
Predecessor
During the Predecessor Period of 2009, amortization was insignificant.
Refer to Note 8. Intangible Assets and Goodwill to the audited consolidated financial statements included herein for additional information.
Restructuring
| Successor | Predecessor | |||||||||||||
| Year ended December 31, 2010 |
Period from August 19 to December 31, 2009 |
Period from January 1 to October 6, 2009 |
||||||||||||
| (dollars in millions) | (dollars in millions) | |||||||||||||
| Restructuring |
$ | 224 | $ | 126 | $ | 235 | ||||||||
| Percentage of net sales |
1.6 | % | 3.7 | % | 2.8 | % | ||||||||
55
Table of Contents
Successor
During the year ended December 31, 2010, we continued our restructuring actions to align our manufacturing operations with current OEM production levels as well as continuing to relocate our manufacturing and engineering processes to lower cost locations. As such, we recognized employee termination and other related exit costs in conjunction with workforce reduction programs primarily in Europe of $174 million and $78 million during the year ended December 31, 2010 and the Successor Period of 2009, respectively. Similar actions to appropriately align North American manufacturing operations were also undertaken, resulting in $28 million and $34 million of charges during the year ended December 31, 2010 and the Successor Period of 2009, respectively.
Predecessor
As part of the Predecessor’s continuing restructuring activities in 2009 and in response to the depressed OEM production volumes of 2009, the Predecessor undertook significant restructuring actions. As a result, during the Predecessor Period of 2009, restructuring included approximately $69 million to realign manufacturing operations within North America to lower cost markets and reduce the workforce in line with the realigned manufacturing operations. Additionally, approximately $99 million of employee termination benefits and other exit costs were incurred in Europe, South America and Asia. The Predecessor also incurred $58 million for employee termination benefits resulting from the separation of certain salaried employees in North America.
Refer to Note 11. Restructuring to the audited consolidated financial statements included herein for additional information.
Interest Expense
| Successor | Predecessor | |||||||||||||
| Year ended December 31, 2010 |
Period from August 19 to December 31, 2009 |
Period from January 1 to October 6, 2009 |
||||||||||||
| (in millions) | (in millions) | |||||||||||||
| Interest expense |
$ | 30 | $ | 8 | $ | — | ||||||||
| Percentage of net sales |
0.2 | % | 0.2 | % | — | % | ||||||||
Successor
Interest expense for the year ended December 31, 2010 and the Successor Period of 2009 reflects the financing costs relating to our outstanding indebtedness subsequent to the Acquisition, including the $41 million in the Old Notes issued as part of the Acquisition as well as receivable factoring programs.
Predecessor
Interest expense for the Predecessor Period of 2009 includes the amortization of financing costs related to outstanding debtor-in-possession financing during the period and interest on debtor-in-possession financing, offset by the reversal of $415 million of accrued postpetition interest on prepetition debt and allowed unsecured claims, as more fully described in Note 2. Significant Accounting Policies to the audited consolidated financial statements included herein.
Other Income, Net
| Successor | Predecessor | |||||||||||||
| Year ended December 31, 2010 |
Period from August 19 to December 31, 2009 |
Period from January 1 to October 6, 2009 |
||||||||||||
| (in millions) | (in millions) | |||||||||||||
| Other income (expense), net |
$ | 34 | $ | (17) | $ | 24 | ||||||||
56
Table of Contents
Successor
Other income, net during 2010 included $29 million of interest income, partially offset by a $9 million impairment of an investment in available-for-sale securities and an $8 million loss on the early extinguishment of debt that was revalued to fair value as part of acquisition accounting. Additionally, other income, net includes insurance and other recoveries and income from royalties.
During the Successor Period of 2009, other expense, net included $5 million of interest income, offset by $19 million of transactions costs related to the Acquisition.
Predecessor
Other income, net for the Predecessor Period of 2009 included $10 million of interest income.
Reorganization Items, Net
| Predecessor | ||||
| Period from January 1 to October 6, 2009 |
||||
| (in millions) | ||||
| Reorganization items, net |
$ | 10,210 | ||
Predecessor
The following table details the components of bankruptcy-related reorganization items (refer to Note 1. General to the audited consolidated financial statements included herein for additional information):
| Predecessor | ||||
| (Income)/expense | ||||
| Period from January 1 to October 6, 2009 |
||||
| (in millions) | ||||
| Sale / disposition of the Predecessor |
$ | (794) | ||
| Extinguishment of liabilities subject to compromise |
(11,159) | |||
| PBGC termination of U.S. pension plans |
2,818 | |||
| Salaried OPEB settlement |
(1,168) | |||
| Professional fees directly related to reorganization |
68 | |||
| Other |
25 | |||
|
|
|
|||
| Total reorganization items |
$ | (10,210) | ||
|
|
|
|||
Income Taxes
| Successor | Predecessor | |||||||||||
| Year ended December 31, 2010 |
Period from August 19 to December 31, 2009 |
Period from January 1 to October 6, 2009 |
||||||||||
| (in millions) | (in millions) | |||||||||||
| Income tax (expense) benefit |
$ | (258 | ) | $ | 27 | $ | 311 | |||||
Our and the Predecessor’s tax rate in all periods is affected by the tax rates in the U.S. and non-U.S. jurisdictions, the relative amount of income we earn in such jurisdictions and the relative amount of losses for which no tax benefit was recognized due to a valuation allowance.
57
Table of Contents
Successor
The annual effective tax rate in the year ended December 31, 2010 was impacted by a $2 million benefit related to tax contingencies for favorable tax settlements in various jurisdictions, a $21 million benefit related to valuation allowance changes in various countries outside the U.S., a $29 million benefit for U.S. primarily related to research and development credit, and a $15 million benefit due to changes in estimate related to tax law changes in Mexico.
During the Successor period of 2009, our tax rate was affected by the tax rates in non-U.S. jurisdictions, the relative amount of income we earn in such jurisdictions and the relative amount of losses for which no tax benefit would be recognized due to a valuation allowance.
Predecessor
The annual effective tax rate and the income tax benefit for the Predecessor Period of 2009 were favorably impacted by the recognition of $306 million and $52 million of tax benefits in continuing operations due to the elimination of the disproportionate tax effects in accumulated other comprehensive income related to the salaried pension and OPEB obligations, respectively, which were settled during the same period. Refer to Note 15. Income Taxes to the audited consolidated financial statements included herein.
Equity Income (Loss), Net of Tax
| Successor | Predecessor | |||||||||||
| Year ended December 31, 2010 |
Period from August 19 to December 31, 2009 |
Period from January 1 to October 6, 2009 |
||||||||||
| (in millions) | (in millions) | |||||||||||
| Equity income (loss), net of tax |
$ | 17 | $ | 5 | $ | (36 | ) | |||||
Successor
During both the year ended 2010 and the Successor Period of 2009, equity income reflects our interest in the results of ongoing operations of entities accounted for as equity-method investments, principally from our South Korean and Mexican joint ventures.
Predecessor
Equity income (loss), net of tax in the Predecessor Period of 2009 includes a $23 million impairment charge related to an investment in a non-consolidated affiliate, as well as the overall negative economic impact resulting from the industry downturn during 2009.
Loss from Discontinued Operations, Net of Tax
| Predecessor | ||||
| Period from January 1 to October 6, 2009 |
||||
| (in millions) | ||||
| Loss from discontinued operations, net of tax |
$ | (44 | ) | |
Predecessor
The loss from discontinued operations for the Predecessor Period of 2009 includes the losses related to the operations and assets held for sale of the halfshaft and steering system products (the “Steering Business”) and the Automotive Holdings Group (“AHG”), which included various non-core product lines and plant sites that did not fit our or the Predecessor’s strategic framework.
58
Table of Contents
Results of Operations by Segment
The reconciliation of Adjusted EBITDA to EBITDA includes other transformation and rationalization costs related to 1) the implementation of information technology systems to support finance, manufacturing and product development initiatives, 2) certain plant consolidations and closures costs and 3) consolidation of many staff administrative functions into a global business service group. The reconciliation of EBITDA to net income (loss) attributable to Successor/Predecessor follows:
| Successor | ||||||||||||||||||||||||
| Electrical/ Electronic Architecture |
Powertrain Systems |
Electronics and Safety |
Thermal Systems |
Eliminations and Other |
Total | |||||||||||||||||||
| (in millions) | ||||||||||||||||||||||||
| 2010: |
||||||||||||||||||||||||
| Adjusted EBITDA |
$ | 758 | $ | 423 | $ | 293 | $ | 165 | $ | (6 | ) | $ | 1,633 | |||||||||||
| Transformation and rationalization charges: |
||||||||||||||||||||||||
| Employee termination benefits and other exit costs |
(94 | ) | (49 | ) | (29 | ) | (52 | ) | — | (224 | ) | |||||||||||||
| Other transformation and rationalization costs |
(14 | ) | (13 | ) | (17 | ) | (4 | ) | — | (48 | ) | |||||||||||||
|
|
|
|
|
|
|
|
|
|
|
|
|
|||||||||||||
| EBITDA |
$ | 650 | $ | 361 | $ | 247 | $ | 109 | $ | (6 | ) | 1,361 | ||||||||||||
|
|
|
|
|
|
|
|
|
|
|
|||||||||||||||
| Depreciation and amortization |
(108 | ) | (170 | ) | (100 | ) | (42 | ) | (1 | ) | (421 | ) | ||||||||||||
|
|
|
|
|
|
|
|
|
|
|
|
|
|||||||||||||
| Operating income (loss) |
$ | 542 | $ | 191 | $ | 147 | $ | 67 | $ | (7 | ) | 940 | ||||||||||||
|
|
|
|
|
|
|
|
|
|
|
|||||||||||||||
| Interest expense |
(30 | ) | ||||||||||||||||||||||
| Other income, net |
34 | |||||||||||||||||||||||
|
|
|
|||||||||||||||||||||||
| Income from continuing operations before income taxes and equity income |
944 | |||||||||||||||||||||||
| Income tax expense |
(258 | ) | ||||||||||||||||||||||
| Equity income, net of tax |
17 | |||||||||||||||||||||||
|
|
|
|||||||||||||||||||||||
| Net income |
$ | 703 | ||||||||||||||||||||||
| Net income attributable to noncontrolling interest |
72 | |||||||||||||||||||||||
|
|
|
|||||||||||||||||||||||
| Net income attributable to Successor |
$ | 631 | ||||||||||||||||||||||
|
|
|
|||||||||||||||||||||||
| Successor | ||||||||||||||||||||||||
| Electrical/ Electronic Architecture |
Powertrain Systems |
Electronics and Safety |
Thermal Systems |
Eliminations and Other |
Total | |||||||||||||||||||
| (in millions) | ||||||||||||||||||||||||
| August 19 – December 31, 2009: |
||||||||||||||||||||||||
| Adjusted EBITDA |
$ | 155 | $ | 79 | $ | 56 | $ | 21 | $ | 2 | $ | 313 | ||||||||||||
| Transformation and rationalization charges: |
||||||||||||||||||||||||
| Employee termination benefits and other exit costs |
(50 | ) | (50 | ) | (20 | ) | (5 | ) | (1 | ) | (126 | ) | ||||||||||||
| Other transformation and rationalization costs |
(11 | ) | (20 | ) | (19 | ) | (8 | ) | — | (58 | ) | |||||||||||||
|
|
|
|
|
|
|
|
|
|
|
|
|
|||||||||||||
| EBITDA |
$ | 94 | $ | 9 | $ | 17 | $ | 8 | $ | 1 | 129 | |||||||||||||
|
|
|
|
|
|
|
|
|
|
|
|
|
|||||||||||||
| Depreciation and amortization |
(31 | ) | (52 | ) | (39 | ) | (17 | ) | — | (139 | ) | |||||||||||||
|
|
|
|
|
|
|
|
|
|
|
|
|
|||||||||||||
| Operating (loss) income |
$ | 63 | $ | (43 | ) | $ | (22 | ) | $ | (9 | ) | $ | 1 | (10 | ) | |||||||||
|
|
|
|
|
|
|
|
|
|
|
|||||||||||||||
| Interest expense |
(8 | ) | ||||||||||||||||||||||
| Other expense, net |
(17 | ) | ||||||||||||||||||||||
|
|
|
|||||||||||||||||||||||
| Loss from continuing operations before income taxes and equity income |
(35 | ) | ||||||||||||||||||||||
| Income tax benefit |
27 | |||||||||||||||||||||||
| Equity income, net of tax |
5 | |||||||||||||||||||||||
|
|
|
|||||||||||||||||||||||
| Net loss |
$ | (3 | ) | |||||||||||||||||||||
| Net income attributable to noncontrolling interest |
15 | |||||||||||||||||||||||
|
|
|
|||||||||||||||||||||||
| Net loss attributable to Successor |
$ | (18 | ) | |||||||||||||||||||||
|
|
|
|||||||||||||||||||||||
59
Table of Contents
| Predecessor | ||||||||||||||||||||||||
| Electrical/ Electronic Architecture |
Powertrain Systems |
Electronics and Safety |
Thermal Systems |
Eliminations and Other |
Total | |||||||||||||||||||
| (in millions) | ||||||||||||||||||||||||
| January 1 – October 6, 2009: |
||||||||||||||||||||||||
| Adjusted EBITDA |
$ | (18 | ) | $ | (9 | ) | $ | (214 | ) | $ | 17 | $ | (5 | ) | $ | (229 | ) | |||||||
| Transformation and rationalization charges: |
||||||||||||||||||||||||
| Employee termination benefits and other exit costs |
(99 | ) | (45 | ) | (91 | ) | (11 | ) | 11 | (235 | ) | |||||||||||||
| Other transformation and rationalization costs |
(15 | ) | (17 | ) | (14 | ) | (2 | ) | (2 | ) | (50 | ) | ||||||||||||
|
|
|
|
|
|
|
|
|
|
|
|
|
|||||||||||||
| EBITDA |
$ | (132 | ) | $ | (71 | ) | $ | (319 | ) | $ | 4 | $ | 4 | (514 | ) | |||||||||
|
|
|
|
|
|
|
|
|
|
|
|
|
|||||||||||||
| Depreciation and amortization |
(147 | ) | (163 | ) | (177 | ) | (53 | ) | — | (540 | ) | |||||||||||||
| Discontinued operations |
— | — | — | — | (64 | ) | (64 | ) | ||||||||||||||||
|
|
|
|
|
|
|
|
|
|
|
|
|
|||||||||||||
| Operating loss |
$ | (279 | ) | $ | (234 | ) | $ | (496 | ) | $ | (49 | ) | $ | (60 | ) | (1,118 | ) | |||||||
|
|
|
|
|
|
|
|
|
|
|
|||||||||||||||
| Other income, net |
24 | |||||||||||||||||||||||
| Reorganization items |
10,210 | |||||||||||||||||||||||
|
|
|
|||||||||||||||||||||||
| Income from continuing operations before income taxes and equity loss |
9,116 | |||||||||||||||||||||||
| Income tax benefit |
311 | |||||||||||||||||||||||
| Equity loss, net of tax |
(36 | ) | ||||||||||||||||||||||
| Loss from discontinued operations, net of tax |
(44 | ) | ||||||||||||||||||||||
|
|
|
|||||||||||||||||||||||
| Net income |
$ | 9,347 | ||||||||||||||||||||||
| Net income attributable to noncontrolling interest |
29 | |||||||||||||||||||||||
|
|
|
|||||||||||||||||||||||
| Net income attributable to Predecessor |
$ | 9,318 | ||||||||||||||||||||||
|
|
|
|||||||||||||||||||||||
Net sales and gross margin as a percentage of net sales for the year ended December 31, 2010 and periods from August 19 to December 31 and January 1 to October 6, 2009 by segment are as follows:
Net Sales by Segment
| Successor |
Predecessor | Variance due to: | ||||||||||||||||||||||||||||||||||||||||||
| Year ended December 31, 2010 |
Period from August 19 to December 31, 2009 |
Period from January 1 to October 6, 2009 |
2010 versus full year 2009 favorable/ (unfavorable) |
Operations not acquired |
Volume, net of contractual price reductions |
Commodity pass- through |
FX | Other | Total | |||||||||||||||||||||||||||||||||||
| (in millions) | (in millions) | (in millions) | ||||||||||||||||||||||||||||||||||||||||||
| Electrical/ Electronic Architecture |
$ | 5,620 | $ | 1,325 | $ | 2,970 | $ | 1,325 | $ | — | $ | 1,215 | $ | 135 | $ | (26) | $ | 1 | $ | 1,325 | ||||||||||||||||||||||||
| Powertrain Systems |
4,086 | 957 | 2,667 | 462 | (384) | 879 | — | (36) | 3 | 462 | ||||||||||||||||||||||||||||||||||
| Electronics and Safety |
2,721 | 761 | 1,801 | 159 | (96) | 294 | — | (38) | (1) | 159 | ||||||||||||||||||||||||||||||||||
| Thermal Systems |
1,603 | 365 | 1,008 | 230 | (172) | 384 | 10 | 8 | — | 230 | ||||||||||||||||||||||||||||||||||
| Eliminations and Other |
(213) | 13 | (112) | (114) | 13 | (47) | — | 1 | (81) | (114) | ||||||||||||||||||||||||||||||||||
|
|
|
|
|
|
|
|
|
|
|
|
|
|
|
|
|
|
|
|
|
|||||||||||||||||||||||||
| Total |
$ | 13,817 | $ | 3,421 | $ | 8,334 | $ | 2,062 | $ | (639) | $ | 2,725 | $ | 145 | $ | (91) | $ | (78) | $ | 2,062 | ||||||||||||||||||||||||
|
|
|
|
|
|
|
|
|
|
|
|
|
|
|
|
|
|
|
|
|
|||||||||||||||||||||||||
60
Table of Contents
| • | Eliminations and Other includes $75 million of keep site facilitation reimbursements recognized by the Predecessor during the period from January 1 to October 6, 2009 as a result of the Amended MRA, which became effective in September 2008 (refer to Note 3. Elements of Predecessor Transformation Plan to the audited consolidated financial statements included herein for more information.) |
| • | Foreign exchange fluctuations are primarily related to the Euro. |
Gross Margin Percentage by Segment
| Successor | Predecessor | |||||||||||||
| Year ended December 31, 2010 |
Period from August 19 to December 31, 2009 |
Period from January 1 to October 6, 2009 |
||||||||||||
| Electrical/Electronic Architecture |
16.8 | % | 14.5 | % | 1.4 | % | ||||||||
| Powertrain Systems |
13.8 | % | 10.1 | % | 2.6 | % | ||||||||
| Electronics and Safety |
12.8 | % | 7.9 | % | (12.9 | )% | ||||||||
| Thermal Systems |
12.4 | % | 5.5 | % | 3.2 | % | ||||||||
| Eliminations and Other |
1.4 | % | 38.5 | % | 49.1 | % | ||||||||
| Total |
14.8 | % | 10.9 | % | (1.8 | )% | ||||||||
EBITDA by Segment
| Successor |
Predecessor | Variance due to: | ||||||||||||||||||||||||||||||||||||||
| Year ended December 31, 2010 |
Period from August 19 to December 31, 2009 |
Period from January 1 to October 6, 2009 |
2010 versus full year 2009 favorable/ (unfavorable) |
Operations not acquired |
Volume, net of contractual price reductions |
Operational performance |
Other | Total | ||||||||||||||||||||||||||||||||
| (in millions) | (in millions) | (in millions) | ||||||||||||||||||||||||||||||||||||||
| Electrical/ Electronic Architecture |
$ | 650 | $ | 94 | $ | (132) | $ | 688 | $ | — | $ | 358 | $ | 161 | $ | 169 | $ | 688 | ||||||||||||||||||||||
| Powertrain Systems |
361 | 9 | (71) | 423 | 23 | 283 | 70 | 47 | 423 | |||||||||||||||||||||||||||||||
| Electronics and Safety |
247 | 17 | (319) | 549 | (10) | 118 | 211 | 230 | 549 | |||||||||||||||||||||||||||||||
| Thermal Systems |
109 | 8 | 4 | 97 | 14 | 75 | 41 | (33) | 97 | |||||||||||||||||||||||||||||||
| Eliminations and Other |
(6) | 1 | 4 | (11) | (99) | — | — | 88 | (11) | |||||||||||||||||||||||||||||||
|
|
|
|
|
|
|
|
|
|
|
|
|
|
|
|
|
|
|
|||||||||||||||||||||||
| Total |
$ | 1,361 | $ | 129 | $ | (514) | $ | 1,746 | $ | (72) | $ | 834 | $ | 483 | $ | 501 | $ | 1,746 | ||||||||||||||||||||||
|
|
|
|
|
|
|
|
|
|
|
|
|
|
|
|
|
|
|
|||||||||||||||||||||||
As noted in the table above, 2010 EBITDA as compared to Full Year 2009 EBITDA was impacted by Operations Not Acquired by the Successor, volume and contractual price reductions, and operational performance improvements, which include favorable manufacturing and engineering performance offset by unfavorable material and freight economics, as well as the following items included in Other in the table above:
| • | $137 million of decreased costs associated with restructuring activities resulting in employee termination benefit cost reductions, including $82 million, $46 million and $55 million in the Electronics and Safety, Powertrain Systems and Electrical/Electronic Architecture, respectively, offset by increased costs of $36 million and $10 million in the Thermal Systems and Eliminations and Other segments, respectively. |
| • | Favorable foreign currency exchange impact of $29 million primarily due to the Euro, Brazilian Real, Polish Zloty and British pound, including $24 million, $4 million and $10 million in the Electronics and Safety, Powertrain Systems and Electrical/Electronic Architecture segments, respectively, which were partially offset by $9 million of unfavorable foreign currency exchange in the Thermal Systems segment. |
| • | $150 million of decreases in pension and OPEB, offset by favorable EBITDA from discontinued operations of $64 million in the Eliminations and Other segment. |
| • | Approximately $60 million of decreased SG&A as a result of the positive effects of cost savings initiatives. |
61
Table of Contents
Liquidity and Capital Resources
Overview of Capital Structure
As of December 31, 2011, we had cash and cash equivalents of $1.4 billion and net debt (defined as outstanding debt less cash and cash equivalents) of $740 million. We also have access to additional liquidity pursuant to the terms of the $1.3 billion Revolving Credit Facility as described below. We expect existing cash, available liquidity and cash flows from operations to continue to be sufficient to fund our global operating activities and capital expenditures. We also continue to expect to be able to move funds between different countries to manage our global liquidity needs without material adverse tax implications, subject to current monetary policies and to the terms of the Credit Agreement. Based on this, we believe we possess sufficient liquidity to fund our operations and capital investments in 2012 and beyond.
On March 31, 2011, all outstanding Class A and Class C membership interests were redeemed for $3,791 million and $594 million, respectively. In conjunction with the redemption transaction, Delphi Automotive LLP incurred transaction-related fees and expenses totaling approximately $180 million, including amounts paid to certain membership interest holders. In addition, Delphi Automotive LLP obtained necessary consents to the redemption of the Class A and Class C membership interests and modified and eliminated specific rights provided to these membership interest holders under the Second Amended and Restated Limited Liability Partnership Agreement of Delphi Automotive LLP. Subsequent to the redemption transaction on March 31, 2011, Delphi Automotive LLP membership interest equity was comprised of a single voting class of membership interests, the Class B membership interests of Delphi Automotive LLP. In addition to this class of voting membership interests, non-voting Class E-1 membership interests were held by the Board of Managers of Delphi Automotive LLP.
On July 12, 2011, the Third Amended and Restated Limited Liability Partnership Agreement of Delphi Automotive LLP was amended and restated by the Fourth Amended and Restated Limited Liability Partnership Agreement of Delphi Automotive LLP (the “Fourth LLP Agreement”). The Fourth LLP Agreement was undertaken to further position us for our initial public offering. Refer to Note 16. Capital Stock and Net Income (Loss) Per Share to the audited consolidated financial statements for additional information.
In August 2011, the Board of Managers of Delphi Automotive LLP approved a repurchase program of Class B membership interests. In 2011 prior to the initial public offering, 10,005 Class B membership interests were repurchased for a cumulative cost of approximately $180 million at an average price per membership interests unit of $17,904. This was recorded as a reduction to the carrying value of the Class B membership interests.
In October 2011, the Board of Managers of Delphi Automotive LLP approved a distribution of approximately $95 million, which was paid on December 5, 2011, principally in respect of taxes, to members who held membership interests as of the close of business on October 31, 2011 pursuant to the terms of the Fourth LLP Agreement.
On May 19, 2011, Delphi Automotive PLC was formed as a Jersey public limited company, and had nominal assets, no liabilities and had conducted no operations prior to the completion of its initial public offering on November 22, 2011. Delphi Automotive PLC completed the initial public offering of 24,078,827 ordinary shares by the selling shareholders for an aggregate purchase price of approximately $530 million. Delphi Automotive PLC did not receive any proceeds from the offering, and incurred transaction fees and expenses of approximately $44 million.
Other
In January 2012, the Board of Directors authorized the purchase and redemption of up to $300 million of ordinary shares. The program will terminate on the earlier of December 31, 2012 or when the Company attains
62
Table of Contents
$300 million in ordinary share repurchases. To the extent we generate discretionary cash flow we may consider using this additional cash flow for optional prepayments of existing indebtedness, strategic acquisitions, dividends on share capital, additional share repurchases, and/or general corporate purposes.
Pursuant to the registration rights agreement for the Senior Notes, during the first half of 2012, the Company expects to file a Form S-4 Registration Statement to register the debt securities.
Credit Agreement
In March 2011, in conjunction with the redemption of membership interests from Class A and Class C membership interest holders, Delphi Corporation, a wholly-owned U.S. subsidiary of Delphi Automotive LLP (the “Issuer”), entered into a credit agreement with JPMorgan Chase Bank, N.A., as lead arranger and administrative agent, with respect to $3.0 billion in senior secured credit facilities (the “Credit Facilities”). The March 2011 agreement has been amended and restated (the “Credit Agreement”) and as of December 31, 2011 consists of a $1.3 billion 5-year senior secured revolving credit facility (the “Revolving Credit Facility”), a $258 million senior secured 5-year term A loan (the “Tranche A Term Loan”) and a $950 million senior secured 6-year term B loan (the “Tranche B Term Loan”). During the year ended December 31, 2011, $47 million and $177 million of the Tranche A Term Loan and Tranche B Term Loan, respectively, were repaid under the Credit Agreement. In conjunction with the repayments, approximately $10 million of debt issuance costs were extinguished. The maximum amount drawn under our Revolving Credit Facility in 2011 to manage intra-month working capital needs was $150 million. The Revolving Credit Facility was undrawn at December 31, 2011. As of December 31, 2011, we had approximately $9 million in letters of credit issued under the Credit Agreement. Letters of credit issued under the Credit Agreement reduce availability under the Revolving Credit Facility.
The Credit Agreement carries an interest rate, at the Issuer’s option, of either (a) the Administrative Agent’s Alternate Base Rate (“ABR” as defined in the Credit Agreement) plus (i) with respect to the Revolving Credit Facility and the Tranche A Term Loan, 1.50% per annum or (ii) with respect to the Tranche B Term Loan, 1.50% per annum, or (b) the London Interbank Offered Rate (the “Adjusted LIBO Rate” as defined in the Credit Agreement) (“LIBOR”) plus (i) with respect to the Revolving Credit Facility and the Tranche A Term Loan, 2.50% per annum or (ii) with respect to the Tranche B Term Loan, 2.50% per annum since our initial public offering. The Tranche B Term Loan includes a LIBOR floor of 1.00%.
The interest rate period with respect to the LIBOR interest rate option can be set at one-, two-, three-, or six-months as selected by the Issuer in accordance with the terms of the Credit Agreement (or other period as may be agreed by the applicable lenders), but payable no less than quarterly. The Issuer may elect to change the selected interest rate over the term of the Credit Facilities in accordance with the provisions of the Credit Agreement. The applicable interest rates listed above for the Revolving Credit Facility and the Tranche A Term Loan may increase or decrease from time to time by 0.25% based upon changes to our corporate credit ratings. Accordingly, the interest rate will fluctuate during the term of the Credit Agreement based on changes in the ABR, LIBOR or future changes in our corporate credit ratings. Upon completion of our initial public offering, the applicable interest rates for the Tranche A Term Loan and Revolving Credit Facility were reduced by 25 basis points. The Credit Agreement also requires that the Issuer pay certain commitment fees on the unused portion of the Revolving Credit Facility and certain letter of credit issuance and fronting fees.
The Issuer is obligated to make quarterly principal payments throughout the terms of the Tranche A and Tranche B Term Loans according to the amortization schedule in the Credit Agreement. In conjunction with the repayments during the year ended December 31, 2011, all quarterly principal payment obligations prior to maturity have been satisfied for the Tranche B Term Loan and quarterly principal payments have been satisfied through December 31, 2013 for the Tranche A Term Loan and partially satisfied through March 31, 2014. Borrowings under the Credit Agreement are prepayable at the Issuer’s option without premium or penalty, provided that any prepayment of the Tranche B Term Loan is accompanied by a pro rata payment of the Tranche A Term Loan (based on the respective amounts then outstanding). The Issuer may request that all or a portion of
63
Table of Contents
the Term Loans be converted to extend the scheduled maturity date(s) with respect to all or a portion of any principal amount of such Term Loans under certain conditions. The Credit Agreement also contains certain mandatory prepayment provisions in the event we generate excess cash flow (as defined in the Credit Agreement) or we receive net cash proceeds from any asset sale or casualty event. No mandatory prepayments, under these provisions, have been made or are due through December 31, 2011.
As of December 31, 2011, the Issuer selected the one-month LIBOR interest rate option, as detailed in the table below, for amounts outstanding, net of the discount (in millions) and rates effective as of December 31, 2011 were:
| LIBOR plus | Borrowings as of December 31, 2011 |
Rates effective as of December 31, 2011 |
||||||||||
| Revolving Credit Facility |
2.50 | % | $ | — | — | % | ||||||
| Tranche A Term Loan |
2.50 | % | $ | 210 | 2.81 | % | ||||||
| Tranche B Term Loan |
2.50 | % | $ | 772 | 3.50 | %* | ||||||
| * | Includes a LIBOR floor of 1.00%. |
The Credit Agreement contains certain covenants that limit, among other things, our (and our subsidiaries’) ability to incur additional indebtedness or liens, to dispose of assets, to make certain investments, to prepay certain indebtedness and to pay dividends, or to make other distributions or redemptions/repurchases, in respect of our equity interests. In addition, the Credit Agreement requires that we maintain a consolidated leverage ratio (the ratio of Consolidated Total Indebtedness to Consolidated EBITDA, each as defined in the Credit Agreement) of less than 2.75 to 1.0. The Credit Agreement also contains events of default customary for financings of this type. We were in compliance with the Credit Agreement covenants as of December 31, 2011.
The Tranche A Term Loan and the Tranche B Term Loan were each issued under the Credit Agreement at a 0.5% discount and we paid approximately $86 million of debt issuance costs in connection with the Credit Facilities. The discount and debt issuance costs are being amortized over the life of the facility. The amended and modified Credit Agreement reduced the discount related to the Tranche B Term Loan to 0.25%.
All obligations under the Credit Agreement are borrowed by Delphi Corporation, and jointly and severally guaranteed by its direct and indirect parent companies and by certain of Delphi Automotive PLC’s existing and future direct and indirect U.S. subsidiaries, subject to certain exceptions set forth in the Credit Agreement. All obligations under the Credit Agreement, including the guarantees of those obligations, are secured by certain assets of Delphi Corporation and the guarantors, including substantially all of the assets of Delphi Automotive PLC, and its U.S. subsidiaries, and certain assets of Delphi Corporation’s direct and indirect parent companies.
Senior Notes
On May 17, 2011, Delphi Corporation issued $500 million of 5.875% senior notes due 2019 and $500 million of 6.125% senior notes due 2021 (the “Senior Notes”) in a transaction exempt from registration under Rule 144A and Regulation S of the Securities Act. The Senior Notes are fully and unconditionally guaranteed, jointly and severally, by Delphi Automotive PLC and certain of its existing and future subsidiaries. Interest is payable semi-annually on May 15 and November 15 of each year. Delphi paid $30 million of interest in November 2011. We paid approximately $23 million of debt issuance costs in connection with the Senior Notes. The net proceeds of approximately $1.0 billion as well as cash on hand were used to pay down amounts outstanding under the Credit Agreement.
The indenture governing the Senior Notes limits, among other things, our (and our subsidiaries’) ability to incur additional indebtedness or liens, dispose of assets, make certain restricted payments or investments, enter into transactions with affiliates or merge with or into other entities.
64
Table of Contents
Acquisition Financing
In connection with the Acquisition, Delphi Automotive LLP (i) issued $41 million in senior unsecured five-year notes (the “Old Notes”) pursuant to a Note Purchase Agreement (the “NPA”) with an Acquisition Date fair value of $49 million and (ii) entered into a senior secured delayed draw term loan facility (the “DDTL”) with a syndicate of lenders. The Old Notes paid 12% interest and were scheduled to mature on October 6, 2014. The DDTL permitted borrowings of up to $890 million, consisting of a U.S. tranche of up to $267 million in borrowings and a foreign tranche of up to $623 million in borrowings. There was no commitment fee associated with the DDTL, but, if drawn, we were required to pay interest at the rate of LIBOR plus 6.0% per annum, with a minimum LIBOR amount of 2.0% per annum. The DDTL had a term of 5 years. A majority of the holders of the Old Notes and the lenders under the DDTL were related parties as holders of the Class A and Class B membership interests.
In connection with the redemption of the Class A and Class C membership interests on March 31, 2011 and execution of the Credit Agreement, each of the DDTL and the NPA was terminated (including the termination, discharge and release of all security and guarantees granted in connection with the DDTL and the NPA) and we paid approximately $57 million to redeem the Old Notes in full. In connection with the termination of the Old Notes, we incurred early termination penalties and recognized a loss on extinguishment of debt of approximately $9 million for the year ended December 31, 2011.
Other Financing and Liquidity
Accounts receivable factoring—We maintain various accounts receivable factoring facilities in Europe that are accounted for as short-term debt. We utilize these programs to fund our working capital needs including our intra-month liquidity needs. These uncommitted factoring facilities are available through various financial institutions. As of December 31, 2011 and 2010, $54 million and $112 million, respectively, was outstanding under these accounts receivable factoring facilities.
Capital leases and other—As of December 31, 2011 and 2010, approximately $67 million and $130 million, respectively, of other debt issued by certain international subsidiaries was outstanding, primarily related to bank lines in Asia Pacific and capital lease obligations.
U.S. Federal Government Programs—We have numerous technology and manufacturing development programs that are competitively awarded from agencies of the U.S. Federal Government. These programs are from the U.S. Department of Transportation (“DOT”), the U.S. Department of Energy (“DOE”), and the U.S. Department of Defense (“DoD”). We received $55 million from these Federal agencies in 2011 for work performed. These programs supplement our internal research and development funds and directly support our product focus of Safe, Green and Connected. The largest current program by cost was awarded as part of the American Recovery and Reinvestment Act of 2009, through which the DOE will reimburse us for 50% of project costs up to total reimbursements of $89 million associated with the development and low cost U.S. manufacturing of power electronics related to electric and hybrid electric vehicles. The project period for this grant is January 2010 through December 2012. As of December 31, 2011, we have received from the DOE related project cost reimbursements of $62 million. During 2012, we expect to complete this project and receive the remaining project cost reimbursements from the DOE of $27 million. During 2011, we pursued many technology development programs by bidding on competitively procured programs from DOT, DOE and DoD. Some of these programs were bid with us being the lead or “Prime Contractor”, and some were bid with us as a “Subrecipient” to the Prime Contractor. We were awarded 7 new programs with nearly $6 million of U.S. Government funds that will be received over the next 36 months.
Warranty settlement—On April 30, 2011, we paid €90 million (approximately $133 million at April 30, 2011 exchange rates) under the terms of a March 2011 warranty settlement. We are also required to make a €60 million (approximately $78 million at December 31, 2011 exchange rates) payment on April 30, 2012 related to this settlement.
65
Table of Contents
Contractual Commitments
The following table summarizes our expected cash outflows resulting from financial contracts and commitments as of December 31, 2011. We have not included information on our recurring purchases of materials for use in our manufacturing operations. These amounts are generally consistent from year to year, closely reflect our levels of production, and are not long-term in nature. The amounts below exclude as of December 31, 2011, the gross liability for uncertain tax positions of $99 million related to the items below. We do not expect a significant payment related to these obligations to be made within the next twelve months. We are not able to provide a reasonably reliable estimate of the timing of future payments relating to the non-current portion of obligations associated with uncertain tax positions. For more information, refer to Note 15. Income Taxes to the audited consolidated financial statements included herein.
| Payments due by Period | ||||||||||||||||||||
| Total | 2012 | 2013 & 2014 | 2015 & 2016 | Thereafter | ||||||||||||||||
| (in millions) | ||||||||||||||||||||
| Debt and capital lease obligations |
$ | 2,106 | $ | 107 | $ | 31 | $ | 190 | $ | 1,778 | ||||||||||
| Estimated interest costs related to debt and capital lease obligations |
733 | 116 | 204 | 195 | 218 | |||||||||||||||
| Operating lease obligations |
325 | 82 | 124 | 86 | 33 | |||||||||||||||
| Contractual commitments for capital expenditures |
233 | 232 | 1 | — | — | |||||||||||||||
| Other contractual purchase commitments, including information technology |
208 | 77 | 71 | 43 | 17 | |||||||||||||||
|
|
|
|
|
|
|
|
|
|
|
|||||||||||
| Total |
$ | 3,605 | $ | 614 | $ | 431 | $ | 514 | $ | 2,046 | ||||||||||
|
|
|
|
|
|
|
|
|
|
|
|||||||||||
We also have significant obligations to make payments to management under our Value Creation Plan that are not reflected in the table above. See Note 21. Share-Based Compensation to the audited consolidated financial statements included herein for additional information.
66
Table of Contents
Capital Expenditures
Supplier selection in the auto industry is generally finalized several years prior to the start of production of the vehicle. Therefore, current capital expenditures are based on customer commitments entered into previously, generally several years ago when the customer contract was awarded. As of December 31, 2011, we had approximately $233 million in outstanding cancellable and non-cancellable capital commitments. Capital expenditures by operating segment and geographic region for the periods presented were:
| Successor | Predecessor | |||||||||||||||
| Year ended December 31, 2011 |
Year ended December 31, 2010 |
Period from August 19 to December 31, 2009 |
Period from January 1 to October 6, 2009 |
|||||||||||||
| (in millions) | (in millions) | |||||||||||||||
| Electrical/Electronic Architecture |
$ | 219 | $ | 202 | $ | 21 | $ | 60 | ||||||||
| Powertrain Systems |
228 | 186 | 41 | 167 | ||||||||||||
| Electronics and Safety |
100 | 59 | 14 | 58 | ||||||||||||
| Thermal Systems |
70 | 35 | 8 | 29 | ||||||||||||
| Eliminations and Other |
13 | 18 | 4 | 7 | ||||||||||||
|
|
|
|
|
|
|
|
|
|||||||||
| Continuing operations capital expenditures |
630 | 500 | 88 | 321 | ||||||||||||
|
|
|
|
|
|
|
|
|
|||||||||
| Discontinued operations |
— | — | — | 99 | ||||||||||||
|
|
|
|
|
|
|
|
|
|||||||||
| Total capital expenditures |
$ | 630 | $ | 500 | $ | 88 | $ | 420 | ||||||||
|
|
|
|
|
|
|
|
|
|||||||||
| North America |
$ | 176 | $ | 140 | $ | 21 | $ | 91 | ||||||||
| Europe, Middle East & Africa |
278 | 236 | 51 | 187 | ||||||||||||
| Asia Pacific |
118 | 87 | 6 | 28 | ||||||||||||
| South America |
58 | 37 | 10 | 15 | ||||||||||||
|
|
|
|
|
|
|
|
|
|||||||||
| Continuing operations capital expenditures |
630 | 500 | 88 | 321 | ||||||||||||
|
|
|
|
|
|
|
|
|
|||||||||
| Discontinued operations |
— | — | — | 99 | ||||||||||||
|
|
|
|
|
|
|
|
|
|||||||||
| Total capital expenditures |
$ | 630 | $ | 500 | $ | 88 | $ | 420 | ||||||||
|
|
|
|
|
|
|
|
|
|||||||||
Cash Flows
Intra-month cash flow cycles vary by region, but in general we are users of cash through the first half of a typical month and we generate cash during the latter half of a typical month. Due to this cycle of cash flows, we may utilize short-term financing, including our Revolving Credit Facility and European factoring lines, to manage our intra-month working capital needs. Our cash balance typically peaks at month end.
Cash in the U.S. is managed centrally through a U.S. cash pooling arrangement. As of December 31, 2011, all but one of our European operations were participating in a European cash pool. Outside the U.S. and those countries participating in the pan-European cash pool, cash may be managed through a country cash pool, a self-managed cash flow arrangement or a combination of the two depending on our presence in the respective country.
Operating Activities. Net cash provided by operating activities totaled $1,377 million and $1,142 million for the years ended December 31, 2011 and 2010, respectively. The $235 million increase primarily reflects higher earnings resulting from increased volumes, partially offset by higher working capital requirements. Cash flow from operating activities for the year ended December 31, 2011 consisted of net earnings of $1,223 million increased by $475 million for non-cash charges for depreciation and amortization, partially offset by $370 million related to changes in operating assets and liabilities, net of restructuring and pension contributions. Cash flow from operating activities for the year ended December 31, 2010 consisted of net earnings of $703 million
67
Table of Contents
increased by $421 million for non-cash charges for depreciation and amortization, partially offset by $9 million related to changes in operating assets and liabilities, net of restructuring and pension contributions.
Net cash provided by operating activities totaled $159 million for the Successor period from August 19 to December 31, 2009, which resulted primarily from the improvements in OEM production volumes during the fourth quarter of 2009, resulting in near break-even net earnings increased by $139 million for non-cash charges for depreciation and amortization. Net cash used in operating activities totaled $257 million for the Predecessor period from January 1 to October 6, 2009, which primarily reflected the decreased OEM production volumes during this period.
Investing Activities. Net cash used in investing activities totaled $10 million and $911 million for the years ended December 31, 2011 and 2010, respectively. The decrease is primarily due to the net change related to maturities/purchases of time deposits, partially offset by a $130 million increase in capital expenditures.
Net cash provided by investing activities totaled $885 million for the Successor period from August 19 to December 31, 2009, which resulted primarily from $862 million acquired from the Predecessor as a result of the Acquisition. In addition, cash used for capital expenditures of $88 million for the Successor period from August 19 to December 31, 2009 were offset by $74 million in proceeds from the sale of the brakes and suspensions and occupant protection systems businesses and a $28 million decrease in restricted cash. Net cash used in investing activities totaled $1,052 million for the Predecessor period from January 1 to October 6, 2009, which resulted primarily from $862 million acquired by the Successor as a result of the Acquisition. Additionally, cash used for capital expenditures of $321 million for the Predecessor period from January 1 to October 6, 2009 was offset by decreases in restricted cash of $142 million.
Financing Activities. Net cash used in financing activities totaled $3,194 million and $126 million for the years ended December 31, 2011 and 2010, respectively. Net cash used in financing activities for the year ended December 31, 2011 was driven by the redemption of the Class A and Class C membership interests for $4,566 million and the repurchase of Class B membership interests for $181 million, offset by the proceeds received, net of repayments, from the issuance of debt to partially fund the redemption transaction and the repayment of the Old Notes, of $1,689 million. Net cash used in financing activities for the year ended December 31, 2010, was driven by $99 million of net repayments under debt agreements and $27 million of dividend payments to minority shareholders of consolidated affiliates.
Net cash provided by financing activities totaled $2,062 million for the Successor period from August 19 to December 31, 2009, which resulted from the $2,042 million of cash received associated with the issuance of Class A and Class B membership interests in us. Net cash provided by financing activities totaled $315 million for the Predecessor period from January 1 to October 6, 2009. During this period the Predecessor received $850 million under GM liquidity support agreements and repaid $488 million under the amended and restated debtor-in-possession facility and short-term debt agreements.
Off-Balance Sheet Arrangements and Other Matters
We do not engage in any off-balance sheet financial arrangements that have or are reasonably likely to have a current or future effect on our financial condition, changes in financial condition, revenues or expenses, results of operations, liquidity, capital expenditures or capital resources.
Pension Benefits
Certain of our non-U.S. subsidiaries sponsor defined benefit pension plans, which generally provide benefits based on negotiated amounts for each year of service. Our primary non-U.S. plans are located in France, Germany, Luxembourg, Mexico, Portugal and the United Kingdom (“U.K.”). The U.K. and certain Mexican
68
Table of Contents
plans are funded. In addition, we have defined benefit plans in South Korea, Turkey and Italy for which amounts are payable to employees immediately upon separation. The obligations for these plans are recorded based on the vested obligation. We anticipate making required pension contributions of approximately $55 million in 2012.
Delphi sponsors a Supplemental Executive Retirement Program (“SERP”) for those employees who were U.S. executives prior to September 30, 2008 and were still U.S. executives on October 7, 2009, the effective date of the program. This program is unfunded. Executives receive benefits over 5 years after an involuntary or voluntary separation from Delphi. The SERP is closed to new members and was frozen effective September 30, 2008. Refer to Note 13. Pension Benefits to the audited consolidated financial statements for further information.
Prior to the PBGC termination of the U.S. pension plans, the Predecessor sponsored pension plans covering employees in the U.S., which generally provided benefits of stated amounts for each year of service, as well as supplemental benefits for employees who qualified for retirement before normal retirement age. Certain employees also participated in non-qualified pension plans covering executives, which are based on targeted wage replacement percentages and are unfunded. The Predecessor froze the salaried plan, the SERP, the ASEC Manufacturing Retirement Program, the Delphi Mechatronics Retirement Program and the PHI Non-Bargaining Retirement Plan (collectively, the “Pension Plans”) effective September 30, 2008. Additionally, the Predecessor reached agreement with its labor unions resulting in a freeze of traditional benefit accruals under the Delphi hourly-rate employees pension plan effective as of November 30, 2008.
The PBGC terminated the Pension Plans on July 31, 2009. Accordingly, the Predecessor recognized a pension curtailment and settlement loss of $2.8 billion included in reorganization items in the consolidated statements of operations for the three and nine month periods ended September 30, 2009. This loss included the reversal of $5.2 billion of liabilities subject to compromise related to the Pension Plans offset by the recognition of $5.0 billion of related unamortized losses previously recorded in accumulated other comprehensive income and the recognition of a $3.0 billion allowed general unsecured non-priority claim granted to the PBGC.
On February 4, 2009, the Predecessor filed a motion with the United States Bankruptcy Court for the Southern District of New York (the “Court”) seeking the authority to cease providing retiree OPEB benefits in retirement to salaried employees, retirees, and surviving spouses after March 31, 2009. On February 24, 2009, the Court provisionally approved the Predecessor’s motion to terminate such benefits effective March 31, 2009 based on the Court’s finding that the Predecessor had met its evidentiary burdens, subject to the appointment of a retirees’ committee (the “Retirees’ Committee”) to review whether it believes that any of the affected programs involved vested benefits (as opposed to “at will” or discretionary, unvested benefits). On March 11, 2009, the Court issued a final order approving the Predecessor’s motion to terminate salaried OPEB benefits. The Court approved a settlement agreement (the “Settlement”), between the Predecessor and the Retirees’ Committee and the Delphi Salaried Retirees’ Association (the “Association”) settling any and all rights for the parties to appeal the Court’s March 11, 2009 final order authorizing the Predecessor to terminate salaried OPEB benefits. Pursuant to the Settlement, the Predecessor agreed to provide the Retirees’ Committee with consideration of $9 million to resolve pending litigation. The Predecessor recognized a salaried OPEB curtailment and settlement gain of $1,168 million included in reorganization items in the consolidated statement of operations for the period from January 1 to October 6, 2009. This settlement gain reflects the reversal of existing liabilities of $1,173 million ($1,181 million net of $8 million to pay salaried OPEB claims incurred but not reported as of March 31, 2009) and the recognition of previously unamortized net gains included in accumulated other comprehensive income of $4 million. The reorganization gain also reflects the impact of the $9 million consideration to be provided for the Settlement described above.
Refer to Note 13. Pension Benefits to the audited consolidated financial statements included herein for further information on (1) historical benefit costs of the pension plans, (2) the principal assumptions used to determine the pension benefit expense and the actuarial value of the projected benefit obligation for the U.S. and non-U.S. pension plans, (3) a sensitivity analysis of potential changes to pension obligations and expense that would result from changes in key assumptions and (4) funding obligations.
69
Table of Contents
Environmental Matters
We are subject to the requirements of U.S. federal, state and local, and non-U.S., environmental and safety and health laws and regulations. These include laws regulating air emissions, water discharge, hazardous materials and waste management. We have an environmental management structure designed to facilitate and support our compliance with these requirements globally. Although it is our intent to comply with all such requirements and regulations, we cannot provide assurance that we are at all times in compliance. Environmental requirements are complex, change frequently and have tended to become more stringent over time. Accordingly, we cannot assure that environmental requirements will not change or become more stringent over time or that our eventual environmental remediation costs and liabilities will not be material.
Certain environmental laws assess liability on current or previous owners or operators of real property for the cost of removal or remediation of hazardous substances. In addition to clean-up actions brought by U.S. federal, state, local and non-U.S. agencies, plaintiffs could raise personal injury or other private claims due to the presence of hazardous substances on or from a property. We are currently in the process of investigating and cleaning up some of our current or former sites. In addition, there may be soil or groundwater contamination at several of our properties resulting from historical, ongoing or nearby activities.
As of December 31, 2011 and 2010, the undiscounted reserve for environmental investigation and remediation was approximately $22 million (of which $5 million was recorded in accrued liabilities and $17 million was recorded in other long-term liabilities) and $23 million (of which $5 million was recorded in accrued liabilities and $18 million was recorded in other long-term liabilities), respectively. We cannot ensure that environmental requirements will not change or become more stringent over time or that our eventual environmental remediation costs and liabilities will not exceed the amount of our current reserves. In the event that such liabilities were to significantly exceed the amounts recorded, our results of operations could be materially affected.
Legal Proceedings
For a description of our legal proceedings, see Item 3. Legal Proceedings and Note 14. Commitments and Contingencies to the audited consolidated financial statements included herein.
Significant Accounting Policies and Critical Accounting Estimates
Our significant accounting policies are described in Note 2. Significant Accounting Policies to the audited consolidated financial statements included herein. Certain of our accounting policies require the application of significant judgment by management in selecting the appropriate assumptions for calculating financial estimates. By their nature, these judgments are subject to an inherent degree of uncertainty. These judgments are based on our historical experience, terms of existing contracts, our evaluation of trends in the industry, information provided by our customers and information available from other outside sources, as appropriate.
We consider an accounting estimate to be critical if:
| • | It requires us to make assumptions about matters that were uncertain at the time we were making the estimate, and |
| • | Changes in the estimate or different estimates that we could have selected would have had a material impact on our financial condition or results of operations. |
Acquisition Accounting
Upon the Acquisition the recorded amounts for the assets acquired and the liabilities assumed from the Predecessor were adjusted to reflect estimated fair values in accordance with the provisions of FASB ASC 805,
70
Table of Contents
Business Combinations. The fair values were estimated in accordance with the guidance in FASB ASC 820, Fair Value Measurements and Disclosures, and were based on three generally accepted business valuation approaches: the income, market, and cost approaches. Generally, the income and market approaches were used and weighted by the independent valuation specialists as appropriate.
The discounted cash flow (“DCF”) method is a form of the income approach commonly used to value business interests. The DCF method was based on Company-prepared projections which included a variety of estimates and assumptions. While we consider such estimates and assumptions reasonable, they are inherently subject to significant business, economic and competitive uncertainties, many of which are beyond our control and, therefore, may not be realized. Changes in these estimates and assumptions may have a significant effect on the determination of the fair value of the assets acquired and liabilities assumed in the Acquisition. Accordingly, there can be no assurance that the estimates, assumptions, and values reflected in the valuations will be realized, and actual results could vary materially.
Other estimates used in determining fair value include, but are not limited to, future cash flows or income related to intangibles, market rate assumptions, actuarial assumptions for benefit plans and appropriate discount rates. Our estimates of fair value are based upon assumptions believed to be reasonable, but that are inherently uncertain. Acquisition accounting along with the consummation of the Modified Plan and the disposition of the Predecessor has had a material effect on the financial statements. Refer to Note 1. General to the audited consolidated financial statements included herein for additional information.
Warranty Obligations
Estimating warranty obligations requires us to forecast the resolution of existing claims and expected future claims on products sold. We base our estimate on historical trends of units sold and payment amounts, combined with our current understanding of the status of existing claims and discussions with our customers. The key factors which impact our estimates are (1) the stated or implied warranty period; (2) OEM source; (3) OEM policy decisions regarding warranty claims; and (4) OEMs seeking to hold suppliers responsible for product warranties. These estimates are re-evaluated on an ongoing basis. Actual warranty obligations could differ from the amounts estimated requiring adjustments to existing reserves in future periods. Due to the uncertainty and potential volatility of the factors contributing to developing these estimates, changes in our assumptions could materially affect our results of operations.
Legal and Other Contingencies
We are involved from time to time in various legal proceedings and claims, including commercial or contractual disputes, product liability claims and environmental and other matters, that arise in the normal course of business. We routinely assess the likelihood of any adverse judgments or outcomes related to these matters, as well as ranges of probable losses, by consulting with internal personnel involved with such matters as well as with outside legal counsel handling such matters. We have accrued for estimated losses in accordance with U.S. GAAP for those matters where we believe that the likelihood of a loss has occurred, is probable and the amount of the loss is reasonably estimable. The determination of the amount of such reserves is based on knowledge and experience with regard to past and current matters and consultation with internal personnel involved with such matters and with outside legal counsel handling such matters. The amount of such reserves may change in the future due to new developments or changes in circumstances. The inherent uncertainty related to the outcome of these matters can result in amounts materially different from any provisions made with respect to their resolution.
Environmental Matters
Environmental remediation liabilities are recognized when a loss is probable and can be reasonably estimated. Such liabilities generally are not subject to insurance coverage. The cost of each environmental remediation is estimated by engineering, financial, and legal specialists based on current law and considers the
71
Table of Contents
estimated cost of investigation and remediation required and the likelihood that, where applicable, other responsible parties will be able to fulfill their legal obligations and commitments. The process of estimating environmental remediation liabilities is complex and dependent primarily on the nature and extent of historical information and physical data relating to a contaminated site, the complexity of the site, the uncertainty as to what remediation and technology will be required, and the outcome of discussions with regulatory agencies and, if applicable, other responsible parties. In future periods, new laws or regulations, advances in remediation technologies and additional information about the ultimate remediation methodology to be used could significantly change our estimates. Refer to Note 14. Commitments and Contingencies to the audited consolidated financial statements included herein for additional details. We cannot ensure that environmental requirements will not change or become more stringent over time or that our eventual environmental costs and liabilities will not exceed the amount of current reserves. In the event that such liabilities were to significantly exceed the amounts recorded, our results of operations could be materially affected.
Restructuring
Accruals have been recorded in conjunction with our restructuring actions. These accruals include estimates primarily related to employee termination costs, contract termination costs and other related exit costs in conjunction with workforce reduction and programs related to the rationalization of manufacturing and engineering processes. Actual costs may vary from these estimates. These accruals are reviewed on a quarterly basis and changes to restructuring actions are appropriately recognized when identified.
Pensions
We use actuarial estimated and related actuarial methods to calculate our obligation and expense. We are required to select certain actuarial assumptions, which are determined based on current market conditions, historical information and consultation with and input from our actuaries and asset managers. Refer to Note 13. Pension Benefits to the audited consolidated financial statements included herein for additional details. The key factors which impact our estimates are (1) discount rates; (2) asset return assumptions; and (3) actuarial assumptions such as retirement age and mortality which are determined as of the current year measurement date. We review our actuarial assumptions on an annual basis and make modifications to the assumptions based on current rates and trends when appropriate. Experience gains and losses, as well as the effects of changes in actuarial assumptions and plan provisions are amortized over the average future service period of employees.
The principal assumptions used to determine the pension expense and the actuarial value of the projected benefit obligation for the U.S. and non-U.S. pension plans were:
Assumptions used to determine benefit obligations at December 31:
| Pension Benefits | ||||||||||||||||
| U.S. Plans | Non-U.S. Plans | |||||||||||||||
| 2011 | 2010 | 2011 | 2010 | |||||||||||||
| Weighted-average discount rate |
3.30% | 4.10% | 5.24% | 5.69% | ||||||||||||
| Weighted-average rate of increase in compensation levels |
N/A | N/A | 3.66% | 3.88% | ||||||||||||
Assumptions used to determine net expense for years ended December 31:
| Pension Benefits | ||||||||||||||||||||||||
| U.S. Plans | Non-U.S. Plans | |||||||||||||||||||||||
| 2011 | 2010 | 2009 | 2011 | 2010 | 2009 | |||||||||||||||||||
| Weighted-average discount rate |
4.10% | 5.00% | 6.16% | 5.69% | 5.97% | 6.22% | ||||||||||||||||||
| Weighted-average rate of increase in compensation levels |
N/A | N/A | N/A | 3.88% | 3.89% | 3.95% | ||||||||||||||||||
| Expected long-term rate of return on plan assets |
N/A | N/A | 8.25% | 6.65% | 7.14% | 7.81% | ||||||||||||||||||
72
Table of Contents
We select discount rates by analyzing the results of matching each plan’s projected benefit obligations with a portfolio of high-quality fixed income investments rated AA- or higher by Standard and Poor’s.
In 2011, we no longer had any U.S. pension assets; therefore no U.S. asset rate of return calculation was necessary for 2011. The primary funded non-U.S. plans are in the United Kingdom and Mexico. For the determination of 2011 expense, we assumed a long-term asset rate of return of approximately 6.25% and 9.50% for the United Kingdom and Mexico, respectively. We evaluated input from local actuaries and asset managers, including consideration of recent fund performance and historical returns, in developing the long-term rate of return assumptions. The assumptions for the United Kingdom and Mexico are primarily conservative long-term, prospective rates.
Our pension expense for 2012 is determined at the December 31, 2011 measurement date. For purposes of analysis, the following table highlights the sensitivity of our pension obligations and expense to changes in key assumptions:
| Change in Assumption |
Impact on Pension Expense | Impact on Projected Benefit Obligation | ||||
| 25 basis point (“bp”) decrease in discount rate |
+ $2 million | + $66 million | ||||
| 25 bp increase in discount rate |
- $2 million | - $62 million | ||||
| 25 bp decrease in long-term return on assets |
+ $2 million | — | ||||
| 25 bp increase in long-term return on assets |
- $2 million | — | ||||
The above sensitivities reflect the effect of changing one assumption at a time. It should be noted that economic factors and conditions often affect multiple assumptions simultaneously and the effects of changes in key assumptions are not necessarily linear. The above sensitivities also assume no changes to the design of the pension plans and no major restructuring programs.
Based on information provided by our actuaries and asset managers, we believe that the assumptions used are reasonable; however, changes in these assumptions could impact our financial position, results of operations or cash flows. Refer to Note 13. Pension Benefits to the audited consolidated financial statements included herein for additional information.
Accounts Receivable Allowance
Establishing valuation allowances for doubtful accounts requires the use of estimates and judgment in regard to the risk exposure and ultimate realization. The allowance for doubtful accounts is established based upon analysis of trade receivables for known collectability issues, including bankruptcies, and aging of receivables at the end of each period. Changes to our assumptions could materially affect our recorded allowance.
Valuation of Long-Lived Assets, Intangible Assets and Investments in Affiliates and Expected Useful Lives
We periodically review the recoverability of our long-lived and indefinite-lived assets based on projections of anticipated future cash flows, including future profitability assessments of various manufacturing sites when events and circumstances warrant such a review. We estimate cash flows and fair value using internal budgets based on recent sales data, independent automotive production volume estimates and customer commitments and review of appraisals. The key factors which impact our estimates are (1) future production estimates; (2) customer preferences and decisions; (3) product pricing; (4) manufacturing and material cost estimates; and (5) product life / business retention. Any differences in actual results from the estimates could result in fair values different from the estimated fair values, which could materially impact our future results of operations and financial condition. We believe that the projections of anticipated future cash flows and fair value assumptions are reasonable; however, changes in assumptions underlying these estimates could affect our valuations.
73
Table of Contents
Inventories
Inventories are stated at the lower of cost, determined on a first-in, first-out basis, or market, including direct material costs and direct and indirect manufacturing costs. Refer to Note 4. Inventories to the audited consolidated financial statements included herein. Obsolete inventory is identified based on analysis of inventory for known obsolescence issues, and, as of December 31, 2011, the market value of inventory on hand in excess of one year’s supply is generally fully-reserved.
From time to time, payments may be received from suppliers. These payments from suppliers are recognized as a reduction of the cost of the material acquired during the period to which the payments relate. In some instances, supplier rebates are received in conjunction with or concurrent with the negotiation of future purchase agreements and these amounts are amortized over the prospective agreement period.
Income Taxes
Deferred tax assets and liabilities reflect temporary differences between the amount of assets and liabilities for financial and tax reporting purposes. Such amounts are adjusted, as appropriate, to reflect changes in tax rates expected to be in effect when the temporary differences reverse. A valuation allowance is recorded to reduce our deferred tax assets to the amount that is more likely than not to be realized. Changes in tax laws or accounting standards and methods may affect recorded deferred taxes in future periods.
When establishing a valuation allowance, we consider future sources of taxable income such as “future reversals of existing taxable temporary differences, future taxable income exclusive of reversing temporary differences and carryforwards” and “tax planning strategies.” A tax planning strategy is defined as “an action that: is prudent and feasible; an enterprise ordinarily might not take, but would take to prevent an operating loss or tax credit carryforward from expiring unused; and would result in realization of deferred tax assets.” In the event we determine the deferred tax assets will not be realized in the future, the valuation adjustment to the deferred tax assets will be charged to earnings in the period in which we make such a determination. The valuation of deferred tax assets requires judgment and accounting for the deferred tax effect of events that have been recorded in the financial statements or in tax returns and our future projected profitability. Changes in our estimates, due to unforeseen events or otherwise, could have a material impact on our financial condition and results of operations.
We calculate our current and deferred tax provision based on estimates and assumptions that could differ from the actual results reflected in income tax returns filed in subsequent years. Adjustments based on filed returns are recorded when identified. The amount of income taxes we pay is subject to ongoing audits by federal, state and foreign tax authorities. Our estimate of the potential outcome of any uncertain tax issue is subject to management’s assessment of relevant risks, facts, and circumstances existing at that time. We use a more-likely-than-not threshold for financial statement recognition and measurement of tax positions taken or expected to be taken in a tax return. We record a liability for the difference between the benefit recognized and measured and tax position taken or expected to be taken on our tax return. To the extent that our assessment of such tax positions changes, the change in estimate is recorded in the period in which the determination is made. We report tax-related interest and penalties as a component of income tax expense. We do not believe there is a reasonable likelihood that there will be a material change in the tax related balances or valuation allowance balances. However, due to the complexity of some of these uncertainties, the ultimate resolution may be materially different from the current estimate. Refer to Note 15. Income Taxes to the audited consolidated financial statements included herein for additional information.
Fair Value Measurement of Derivative Instruments
In determining the fair value of our derivatives, we utilize valuation techniques as prescribed by FASB ASC 820-10, Fair Value Measurements and Disclosures, and also prioritize the use of observable inputs. The availability of observable inputs varies amongst derivatives and depends on the type of derivative and how
74
Table of Contents
actively traded the derivative is. For many of our derivatives, the valuation does not require significant management judgment as the valuation inputs are readily observable in the market. For other derivatives, however, valuation inputs are not as readily observable in the market, and significant management judgment may be required.
All derivative instruments are required to be reported on the balance sheet at fair value unless the transactions qualify and are designated as normal purchases or sales. Changes in fair value are reported currently through earnings unless they meet hedge accounting criteria. Our derivative exposures are with counterparties with long-term investment grade credit ratings. We estimate the fair value of our derivative contracts using an income approach based on valuation techniques to convert future amounts to a single, discounted amount. Estimates of the fair value of foreign currency and commodity derivative instruments are determined using exchange traded prices and rates. We also consider the risk of non-performance in the estimation of fair value, and include an adjustment for non-performance risk in the measure of fair value of derivative instruments. The non-performance risk adjustment reflects the full credit default spread (“CDS”) applied to the net commodity and foreign currency exposures by counterparty. When we are in a net derivative asset position, the counterparty CDS rates are applied to the net derivative asset position. When we are in a net derivative liability position, estimates of peer companies’ CDS rates are applied to the net derivative liability position.
In certain instances where market data is not available, we use management judgment to develop assumptions that are used to determine fair value. This could include situations of market illiquidity for a particular currency or commodity or where observable market data may be limited. In those situations, we generally survey investment banks and/or brokers and utilize the surveyed prices and rates in estimating fair value.
As of December 31, 2011 and 2010, we were in a net derivative liability position of $65 million and asset position of $76 million, respectively, and there were no adjustments recorded for nonperformance risk based on the application of peer companies’ CDS rates and because Delphi’s exposures were to counterparties with investment grade credit ratings. Refer to Note 17. Fair Value of Financial Instruments, Derivatives and Hedging Activities to the audited consolidated financial statements included herein for more information.
Share-Based Compensation
We expense the estimated fair value of the Value Creation Plan (as defined and further discussed in Note 21. Share-Based Compensation to the audited consolidated financial statements included herein), a long-term incentive plan for key employees. Estimating the fair value for share-based payments requires us to make assumptions regarding the nature of the payout of the award as well as changes in our stock price during the post-initial public offering period. Any differences in actual results from management’s estimates could result in fair values different from estimated fair values, which could materially impact our future results of operations and financial condition. The following highlights the sensitivity to changes in our stock price:
| Change in Estimate of Stock Price |
Impact on 2012 Operating Expense |
|||
| + 10% |
+ $9 million | |||
| - 10% |
- $9 million | |||
The fair market value of the Class E-1 Interests (as defined and further discussed in Note 21. Share-Based Compensation to the audited consolidated financial statements included herein) was estimated based on a contemporaneous valuation performed by an independent valuation specialist, utilizing generally accepted valuation approaches. Under certain conditions with respect to our initial public offering or a change in control, as defined in the Board of Managers 2010 Class E-1 Interest Incentive Plan, any interests that had not yet vested would immediately become vested. Approximately $8 million was recognized as a charge to compensation expense since the criteria for immediate vesting was met with respect to the completion of our initial public offering on November 22, 2011.
75
Table of Contents
Refer to Note 21. Share-Based Compensation to the audited consolidated financial statements included herein for additional information.
Recently Issued Accounting Pronouncements
Refer to Note 2. Significant Accounting Policies to the unaudited consolidated financial statements included herein for a complete description of recent accounting standards which we have not yet been required to implement which may be applicable to our operations. Additionally the significant accounting standards that have been adopted during the year ended December 31, 2011 are described.
76
Table of Contents
ITEM 7A. QUANTITATIVE AND QUALITATIVE DISCLOSURES ABOUT MARKET RISK
We are exposed to market risks from changes in currency exchange rates and certain commodity prices. In order to manage these risks, we operate a centralized risk management program that consists of entering into a variety of derivative contracts with the intent of mitigating our risk to fluctuations in currency exchange rates and commodity prices. We do not enter into derivative transactions for speculative or trading purposes.
A discussion of our accounting policies for derivative instruments is included in Note 2. Significant Accounting Policies to the audited consolidated financial statements included herein and further disclosure is provided in Note 17. Fair Value of Financial Instruments, Derivatives and Hedging Activities to the audited consolidated financial statements included herein. We maintain risk management control systems to monitor exchange and commodity risks and related hedge positions. Positions are monitored using a variety of analytical techniques including market value and sensitivity analysis. The following analyses are based on sensitivity tests, which assume instantaneous, parallel shifts in currency exchange rates and commodity prices. For options and instruments with non-linear returns, appropriate models are utilized to determine the impact of shifts in rates and prices. Currently, we do not have any options or instruments with non-linear returns.
We have currency exposures related to buying, selling and financing in currencies other than the local currencies in which we operate. Historically, we have reduced our exposure through financial instruments (hedges) that provide offsets or limits to our exposures, which are opposite to the underlying transactions. We also face an inherent business risk of exposure to commodity prices risks, and have historically offset our exposure, particularly to changes in the price of various non-ferrous metals used in our manufacturing operations, through fixed price purchase agreements, commodity swaps and option contracts. We continue to manage our exposures to changes in currency rates and commodity prices using these derivative instruments.
Currency Exchange Rate Risk
Currency exposures may impact future earnings and/or operating cash flows. In some instances, we choose to reduce our exposures through financial instruments (hedges) that provide offsets or limits to our exposures. Currently our most significant currency exposures relate to the Mexican Peso, Euro, Chinese Yuan (Renminbi), Turkish Lira, Romanian New Leu, Brazilian Real and Great Britain Pound. As of December 31, 2011 the net fair value asset of all financial instruments, including hedges and underlying transactions, with exposure to currency risk was approximately $844 million and the net fair value asset at December 31, 2010 was $794 million. The potential loss or gain in fair value for such financial instruments from a hypothetical 10% adverse or favorable change in quoted currency exchange rates would be approximately $148 million and $137 million at December 31, 2011 and 2010, respectively. The impact of a 10% change in rates on fair value differs from a 10% change in the net fair value asset due to the existence of hedges. The model assumes a parallel shift in currency exchange rates; however, currency exchange rates rarely move in the same direction. The assumption that currency exchange rates change in a parallel fashion may overstate the impact of changing currency exchange rates on assets and liabilities denominated in currencies other than the U.S. dollar.
Commodity Price Risk
Commodity swaps/average rate forward contracts are executed to offset a portion of our exposure to the potential change in prices mainly for various non-ferrous metals used in the manufacturing of automotive components. The net fair value of our contracts was a liability of approximately $27 million and an asset of approximately $48 million at December 31, 2011 and 2010, respectively. If the price of the commodities that are being hedged by our commodity swaps/average rate forward contracts changed adversely or favorably by 10%, the fair value of our commodity swaps/average rate forward contracts would decrease or increase by $26 million and $24 million at December 31, 2011 and 2010, respectively. The changes in the net fair value liability differ from 10% of those balances due to the relative differences between the underlying commodity prices and the prices in place in our commodity swaps/average rate forward contracts. These amounts exclude the offsetting impact of the price risk inherent in the physical purchase of the underlying commodities.
77
Table of Contents
Interest Rate Risk
Our exposure to market risk associated with changes in interest rates relates primarily to our debt obligations. As of December 31, 2011, we had approximately $1 billion of floating rate debt principally related to the Credit Agreement. The Credit Agreement carries an interest rate, at our option, of either (a) the ABR plus (i) with respect to the Revolving Credit Facility and the Tranche A Term Loan, 1.50% per annum or (ii) with respect to the Tranche B Term Loan, 1.50% per annum, or (b) LIBOR plus (i) with respect to the Revolving Credit Facility and the Tranche A Term Loan, 2.50% per annum or (ii) with respect to the Tranche B Term Loan, 2.50% per annum. The Tranche B Term Loan includes a LIBOR floor of 1.00%. The interest rate period with respect to the LIBOR interest rate option can be set at one-, two-, three-, or six-months as selected by us in accordance with the terms of the Credit Agreement (or other period as may be agreed by the applicable lenders), but payable no less than quarterly. We may elect to change the selected interest rate over the term of the Credit Facilities in accordance with the provisions of the Credit Agreement. The applicable interest rates listed above for the Revolving Credit Facility and the Tranche A Term Loan may increase or decrease from time to time by 0.25% based on changes to our corporate credit ratings. Accordingly, the interest rate will fluctuate during the term of the Credit Agreement based on changes in the Alternate Base Rate, LIBOR or future changes in our corporate credit ratings.
The table below indicates interest rate sensitivity on interest expense to floating rate debt based on amounts outstanding as of December 31, 2011.
| Tranche A |
Tranche B | |||
| Change in Rate |
(impact to annual interest | |||
| 25 bps decrease |
- $1 | - $2* | ||
| 25 bps increase |
+$1 | +$2 | ||
| * | LIBOR floor of 1.00% prohibits a 25 basis point reduction at current LIBOR levels. |
78
Table of Contents
ITEM 8. FINANCIAL STATEMENTS AND SUPPLEMENTARY DATA
Report of Independent Registered Public Accounting Firm
The Board of Directors and Shareholders of Delphi Automotive PLC:
We have audited the accompanying consolidated balance sheets of Delphi Automotive PLC (Successor) as of December 31, 2011 and 2010, and the related consolidated statements of operations, comprehensive income, shareholders’ equity, and cash flows for the years then ended, and the period from August 19, 2009 to December 31, 2009, and of the former Delphi Corporation (now known as DPH Holdings Corp.) (Predecessor) for the period from January 1, 2009 to October 6, 2009. Our audits also included the financial statement schedule included in Item 15(a)(2). These financial statements and schedule are the responsibility of the Company’s management. Our responsibility is to express an opinion on these financial statements and schedule based on our audits.
We conducted our audits in accordance with the standards of the Public Company Accounting Oversight Board (United States). Those standards require that we plan and perform the audit to obtain reasonable assurance about whether the financial statements are free of material misstatement. An audit includes examining, on a test basis, evidence supporting the amounts and disclosures in the financial statements. An audit also includes assessing the accounting principles used and significant estimates made by management, as well as evaluating the overall financial statement presentation. We believe that our audits provide a reasonable basis for our opinion.
In our opinion, the financial statements referred to above present fairly, in all material respects, the consolidated financial position of Delphi Automotive PLC (Successor) at December 31, 2011 and 2010, and the consolidated results of its operations and its cash flows for the years then ended, and the period from August 19, 2009 to December 31, 2009, and of the former Delphi Corporation (now known as DPH Holdings Corp.) (Predecessor) for the period from January 1, 2009 to October 6, 2009, in conformity with U.S. generally accepted accounting principles. Also, in our opinion, the related financial statement schedule, when considered in relation to the basic financial statements taken as a whole, presents fairly in all material respects the information set forth therein.
As discussed in Note 1 to the consolidated financial statements, the Successor acquired the automotive supply business (other than the global steering business and the UAW manufacturing facilities in the U.S.) of the Predecessor on October 6, 2009. Accordingly, the accompanying consolidated financial statements have been prepared in conformity with ASC 805, “Business Combinations,” for the Successor as a new entity with assets, liabilities and a capital structure not comparable to prior periods.
We also have audited, in accordance with the standards of the Public Company Accounting Oversight Board (United States), Delphi Automotive PLC’s internal control over financial reporting as of December 31, 2011, based on criteria established in Internal Control—Integrated Framework issued by the Committee of Sponsoring Organizations of the Treadway Commission and our report dated February 17, 2012 expressed an unqualified opinion thereon.
/s/ Ernst & Young LLP
Detroit, Michigan
February 17, 2012
79
Table of Contents
Report of Independent Registered Public Accounting Firm
The Board of Directors and Shareholders of Delphi Automotive PLC:
We have audited Delphi Automotive PLC’s internal control over financial reporting as of December 31, 2011, based on criteria established in Internal Control—Integrated Framework issued by the Committee of Sponsoring Organizations of the Treadway Commission (the COSO criteria). Delphi Automotive PLC’s management is responsible for maintaining effective internal control over financial reporting, and for its assessment of the effectiveness of internal control over financial reporting included in the accompanying Management’s Report on Internal Control over Financial Reporting. Our responsibility is to express an opinion on the Company’s internal control over financial reporting based on our audit.
We conducted our audit in accordance with the standards of the Public Company Accounting Oversight Board (United States). Those standards require that we plan and perform the audit to obtain reasonable assurance about whether effective internal control over financial reporting was maintained in all material respects. Our audit included obtaining an understanding of internal control over financial reporting, assessing the risk that a material weakness exists, testing and evaluating the design and operating effectiveness of internal control based on the assessed risk, and performing such other procedures as we considered necessary in the circumstances. We believe that our audit provides a reasonable basis for our opinion.
A company’s internal control over financial reporting is a process designed to provide reasonable assurance regarding the reliability of financial reporting and the preparation of financial statements for external purposes in accordance with generally accepted accounting principles. A company’s internal control over financial reporting includes those policies and procedures that (1) pertain to the maintenance of records that, in reasonable detail, accurately and fairly reflect the transactions and dispositions of the assets of the company; (2) provide reasonable assurance that transactions are recorded as necessary to permit preparation of financial statements in accordance with generally accepted accounting principles, and that receipts and expenditures of the company are being made only in accordance with authorizations of management and directors of the company; and (3) provide reasonable assurance regarding prevention or timely detection of unauthorized acquisition, use, or disposition of the company’s assets that could have a material effect on the financial statements.
Because of its inherent limitations, internal control over financial reporting may not prevent or detect misstatements. Also, projections of any evaluation of effectiveness to future periods are subject to the risk that controls may become inadequate because of changes in conditions, or that the degree of compliance with the policies or procedures may deteriorate.
In our opinion, Delphi Automotive PLC maintained, in all material respects, effective internal control over financial reporting as of December 31, 2011, based on the COSO criteria.
We also have audited, in accordance with the standards of the Public Company Accounting Oversight Board (United States), the consolidated balance sheets of Delphi Automotive PLC (Successor) as of December 31, 2011 and 2010, and the related consolidated statements of operations, comprehensive income, shareholders’ equity, and cash flows for the years then ended, and the period from August 19, 2009 to December 31, 2009, and of the former Delphi Corporation (now known as DPH Holdings Corp.) (Predecessor) for the period from January 1, 2009 to October 6, 2009 and our report dated February 17, 2012 expressed an unqualified opinion thereon.
/s/ Ernst & Young LLP
Detroit, Michigan
February 17, 2012
80
Table of Contents
DELPHI AUTOMOTIVE PLC
CONSOLIDATED STATEMENTS OF OPERATIONS
| Successor | Predecessor | |||||||||||||||||
| Year ended December 31, 2011 |
Year ended December 31, 2010 |
Period from August 19 to December 31, 2009 |
Period from January 1 to October 6, 2009 |
|||||||||||||||
| (in millions, except per share amounts) | (in millions, except per share amounts) |
|||||||||||||||||
| Net sales: |
$ | 16,041 | $ | 13,817 | $ | 3,421 | $ | 8,334 | ||||||||||
| Operating expenses: |
||||||||||||||||||
| Cost of sales |
13,386 | 11,768 | 3,047 | 8,480 | ||||||||||||||
| Selling, general and administrative |
901 | 815 | 242 | 734 | ||||||||||||||
| Amortization (Note 8) |
79 | 70 | 16 | 3 | ||||||||||||||
| Restructuring (Note 11) |
31 | 224 | 126 | 235 | ||||||||||||||
|
|
|
|
|
|
|
|
|
|||||||||||
| Total operating expenses |
14,397 | 12,877 | 3,431 | 9,452 | ||||||||||||||
|
|
|
|
|
|
|
|
|
|||||||||||
| Operating income (loss) |
1,644 | 940 | (10) | (1,118) | ||||||||||||||
| Interest expense (Note 2) |
(123) | (30) | (8) | — | ||||||||||||||
| Other (expense) income, net (Note 18) |
(15) | 34 | (17) | 24 | ||||||||||||||
| Reorganization items, net (Note 1) |
— | — | — | 10,210 | ||||||||||||||
|
|
|
|
|
|
|
|
|
|||||||||||
| Income (loss) from continuing operations before income taxes and equity income (loss) |
1,506 | 944 | (35) | 9,116 | ||||||||||||||
| Income tax (expense) benefit |
(305) | (258) | 27 | 311 | ||||||||||||||
|
|
|
|
|
|
|
|
|
|||||||||||
| Income (loss) from continuing operations before equity income (loss) |
1,201 | 686 | (8) | 9,427 | ||||||||||||||
| Equity income (loss), net of tax |
22 | 17 | 5 | (36) | ||||||||||||||
|
|
|
|
|
|
|
|
|
|||||||||||
| Income (loss) from continuing operations |
1,223 | 703 | (3) | 9,391 | ||||||||||||||
| Loss from discontinued operations, net of tax |
— | — | — | (44) | ||||||||||||||
|
|
|
|
|
|
|
|
|
|||||||||||
| Net income (loss) |
1,223 | 703 | (3) | 9,347 | ||||||||||||||
| Net income attributable to noncontrolling interest |
78 | 72 | 15 | 29 | ||||||||||||||
|
|
|
|
|
|
|
|
|
|||||||||||
| Net income (loss) attributable |
$ | 1,145 | $ | 631 | $ | (18) | $ | 9,318 | ||||||||||
|
|
|
|
|
|
|
|
|
|||||||||||
| Amounts attributable to Successor/Predecessor: |
||||||||||||||||||
| Income (loss) from continuing operations |
$ | 1,145 | $ | 631 | $ | (18) | $ | 9,363 | ||||||||||
| Discontinued operations (Note 20) |
— | — | — | (45) | ||||||||||||||
|
|
|
|
|
|
|
|
|
|||||||||||
| Net income (loss) attributable to Successor/Predecessor |
$ | 1,145 | $ | 631 | $ | (18) | $ | 9,318 | ||||||||||
|
|
|
|
|
|
|
|
|
|||||||||||
| Net income (loss) per share: |
||||||||||||||||||
| Basic and diluted income (loss) per share attributable to Successor |
$ | 2.72 | $ | 0.92 | $ | (0.03) | N/A | |||||||||||
|
|
|
|
|
|
|
|||||||||||||
| Weighted average shares outstanding |
421 | 686 | 685 | N/A | ||||||||||||||
|
|
|
|
|
|
|
|||||||||||||
| Income from continuing operations attributable to Predecessor |
N/A | N/A | N/A | $ | 16.58 | |||||||||||||
| Loss from discontinued operations attributable to Predecessor |
N/A | N/A | N/A | (0.08) | ||||||||||||||
|
|
|
|||||||||||||||||
| Basic and diluted income per share attributable to Predecessor |
N/A | N/A | N/A | $ | 16.50 | |||||||||||||
|
|
|
|||||||||||||||||
| Weighted average shares outstanding |
N/A | N/A | N/A | 565 | ||||||||||||||
|
|
|
|||||||||||||||||
See notes to consolidated financial statements.
81
Table of Contents
DELPHI AUTOMOTIVE PLC
CONSOLIDATED STATEMENTS OF COMPREHENSIVE INCOME
| Successor | Predecessor | |||||||||||||||||
| Year ended December 31, 2011 |
Year ended December 31, 2010 |
Period from August 19 to December 31, 2009 |
Period from January 1 to October 6, 2009 |
|||||||||||||||
| (in millions) | (in millions) | |||||||||||||||||
| Net income (loss): |
$ | 1,223 | $ | 703 | $ | (3 | ) | $ | 9,347 | |||||||||
| Other comprehensive (loss) income: |
||||||||||||||||||
| Currency translation adjustments |
(94 | ) | (4 | ) | (16 | ) | 171 | |||||||||||
| Net change in unrecognized (loss) gain on |
(98 | ) | 48 | 5 | 42 | |||||||||||||
| Employee benefit plans adjustment, net of tax (2) (Note 13) |
(77 | ) | 26 | 33 | 4,733 | |||||||||||||
|
|
|
|
|
|
|
|
|
|||||||||||
| Other comprehensive (loss) income |
(269 | ) | 70 | 22 | 4,946 | |||||||||||||
|
|
|
|
|
|
|
|
|
|||||||||||
| Comprehensive income |
954 | 773 | 19 | 14,293 | ||||||||||||||
| Comprehensive income attributable to noncontrolling interests |
83 | 75 | 13 | 30 | ||||||||||||||
|
|
|
|
|
|
|
|
|
|||||||||||
| Comprehensive income attributable |
$ | 871 | $ | 698 | $ | 6 | $ | 14,263 | ||||||||||
|
|
|
|
|
|
|
|
|
|||||||||||
| (1) | Other comprehensive (loss) income is net of a $57 million tax effect, a $31 million tax effect, a $0 million tax effect and a $0 million tax effect related to unrecognized income on derivative instruments for the years ended December 31, 2011 and 2010, and the periods from August 19 to December 31, 2009 and from January 1 to October 6, 2009, respectively. |
| (2) | Other comprehensive (loss) income is net of a $22 million tax effect, a $7 million tax effect, a $10 million tax effect and a $371 million tax effect related to employee benefit plans liability adjustments for the years ended December 31, 2011 and 2010, and the periods from August 19 to December 31, 2009 and from January 1 to October 6, 2009, respectively. |
See notes to consolidated financial statements.
82
Table of Contents
DELPHI AUTOMOTIVE PLC
CONSOLIDATED BALANCE SHEETS
| December 31, | ||||||||
| 2011 | 2010 | |||||||
| (in millions) | ||||||||
| ASSETS |
||||||||
| Current assets: |
||||||||
| Cash and cash equivalents (Note 2) |
$ | 1,363 | $ | 3,219 | ||||
| Restricted cash |
9 | 47 | ||||||
| Time deposits (Note 2) |
— | 550 | ||||||
| Accounts receivable, net (Note 2) |
2,459 | 2,307 | ||||||
| Inventories (Note 4) |
1,054 | 988 | ||||||
| Other current assets (Note 5) |
616 | 555 | ||||||
|
|
|
|
|
|||||
| Total current assets |
5,501 | 7,666 | ||||||
| Long-term assets: |
||||||||
| Property, net (Note 7) |
2,315 | 2,067 | ||||||
| Investments in affiliates (Note 6) |
257 | 281 | ||||||
| Intangible assets, net (Note 8) |
596 | 665 | ||||||
| Other long-term assets (Note 5) |
459 | 403 | ||||||
|
|
|
|
|
|||||
| Total long-term assets |
3,627 | 3,416 | ||||||
|
|
|
|
|
|||||
| Total assets |
$ | 9,128 | $ | 11,082 | ||||
|
|
|
|
|
|||||
| LIABILITIES AND SHAREHOLDERS’ EQUITY |
||||||||
| Current liabilities: |
||||||||
| Short-term debt (Note 12) |
$ | 107 | $ | 218 | ||||
| Accounts payable |
2,397 | 2,236 | ||||||
| Accrued liabilities (Note 9) |
1,208 | 1,265 | ||||||
|
|
|
|
|
|||||
| Total current liabilities |
3,712 | 3,719 | ||||||
| Long-term liabilities: |
||||||||
| Long-term debt (Note 12) |
1,996 | 71 | ||||||
| Pension benefit obligations (Note 13) |
674 | 677 | ||||||
| Other long-term liabilities (Note 9) |
575 | 516 | ||||||
|
|
|
|
|
|||||
| Total long-term liabilities |
3,245 | 1,264 | ||||||
|
|
|
|
|
|||||
| Total liabilities |
6,957 | 4,983 | ||||||
|
|
|
|
|
|||||
| Commitments and contingencies (Note 14) |
||||||||
| Shareholders’ equity: |
||||||||
| Preferred shares, $0.01 par value per share, 50,000,000 shares authorized, none issued and outstanding |
— | — | ||||||
| Ordinary shares, $0.01 par value per share, 1,200,000,000 shares authorized, 328,244,510 issued and outstanding |
3 | — | ||||||
| Additional paid-in capital |
1,758 | — | ||||||
| Retained earnings |
110 | — | ||||||
| Membership interests (Note 16) |
— | 5,550 | ||||||
| Accumulated other comprehensive (loss) income |
(183) | 91 | ||||||
|
|
|
|
|
|||||
| Total Delphi shareholders’ equity |
1,688 | 5,641 | ||||||
| Noncontrolling interest |
483 | 458 | ||||||
|
|
|
|
|
|||||
| Total shareholders’ equity |
2,171 | 6,099 | ||||||
|
|
|
|
|
|||||
| Total liabilities and shareholders’ equity |
$ | 9,128 | $ | 11,082 | ||||
|
|
|
|
|
|||||
See notes to consolidated financial statements.
83
Table of Contents
DELPHI AUTOMOTIVE PLC
CONSOLIDATED STATEMENTS OF CASH FLOWS
| Successor | Predecessor | |||||||||||||||||
| Year ended December 31, |
Year ended December 31, |
Period from August 19 to December 31, |
Period from January 1 to October 6, |
|||||||||||||||
| 2011 | 2010 | 2009 | 2009 | |||||||||||||||
| (in millions) | (in millions) | |||||||||||||||||
| Cash flows from operating activities: |
||||||||||||||||||
| Net income (loss) |
$ | 1,223 | $ | 703 | $ | (3 | ) | $ | 9,347 | |||||||||
| Adjustments to reconcile net income (loss) to net cash provided by (used in) operating activities: |
||||||||||||||||||
| Depreciation |
396 | 351 | 123 | 537 | ||||||||||||||
| Amortization |
79 | 70 | 16 | 3 | ||||||||||||||
| Amortization of deferred issuance costs |
10 | — | — | — | ||||||||||||||
| Restructuring expense, net of cash paid |
(74 | ) | (67 | ) | (23 | ) | 57 | |||||||||||
| Deferred income taxes |
(36 | ) | (14 | ) | (93 | ) | (380 | ) | ||||||||||
| Pension benefit expenses |
70 | 59 | 23 | 315 | ||||||||||||||
| Equity (income) loss, net of dividends received |
(13 | ) | (7 | ) | (5 | ) | 44 | |||||||||||
| Reorganization items (Note 3) |
— | — | — | (10,210 | ) | |||||||||||||
| Loss (gain) on investments / extinguishment of debt |
4 | (12 | ) | — | 3 | |||||||||||||
| Shared-based compensation |
14 | 5 | — | — | ||||||||||||||
| Changes in operating assets and liabilities: |
||||||||||||||||||
| Accounts receivable, net |
(149 | ) | (184 | ) | (85 | ) | 122 | |||||||||||
| Inventories |
(64 | ) | (130 | ) | 40 | 149 | ||||||||||||
| Other current assets |
(31 | ) | 66 | 138 | 154 | |||||||||||||
| Accounts payable |
98 | 354 | 277 | (123 | ) | |||||||||||||
| Accrued and other long-term liabilities |
3 | 88 | (94 | ) | (353 | ) | ||||||||||||
| Other, net |
6 | (24 | ) | (111 | ) | 223 | ||||||||||||
| Pension contributions |
(159 | ) | (117 | ) | (44 | ) | (111 | ) | ||||||||||
| Other, net |
— | 1 | — | (102 | ) | |||||||||||||
| Discontinued operations (Note 20) |
— | — | — | 68 | ||||||||||||||
|
|
|
|
|
|
|
|
|
|||||||||||
| Net cash provided by (used in) operating activities |
1,377 | 1,142 | 159 | (257 | ) | |||||||||||||
|
|
|
|
|
|
|
|
|
|||||||||||
| Cash flows from investing activities: |
||||||||||||||||||
| Capital expenditures |
(630 | ) | (500 | ) | (88 | ) | (321 | ) | ||||||||||
| Purchase of time deposits |
— | (750 | ) | — | — | |||||||||||||
| Maturity of time deposits |
550 | 200 | — | — | ||||||||||||||
| Proceeds from sale of property/investments |
72 | 93 | 74 | 36 | ||||||||||||||
| Cost of acquisitions, net of cash acquired |
(17 | ) | — | — | — | |||||||||||||
| Decrease in restricted cash |
38 | 49 | 28 | 142 | ||||||||||||||
| Loans to related parties |
(14 | ) | — | — | — | |||||||||||||
| Cash acquired from Delphi Corporation |
— | — | 862 | (862 | ) | |||||||||||||
| Other, net |
(9 | ) | (3 | ) | 9 | (11 | ) | |||||||||||
| Discontinued operations |
— | — | — | (36 | ) | |||||||||||||
|
|
|
|
|
|
|
|
|
|||||||||||
| Net cash (used in) provided by investing activities |
(10 | ) | (911 | ) | 885 | (1,052 | ) | |||||||||||
|
|
|
|
|
|
|
|
|
|||||||||||
| Cash flows from financing activities: |
||||||||||||||||||
| Repayments of amended and restated debtor-in-possession facility |
— | — | — | (244 | ) | |||||||||||||
| Accommodation agreement issuance costs |
— | — | — | (40 | ) | |||||||||||||
| Net borrowings under GM liquidity support agreements |
— | — | — | 850 | ||||||||||||||
| Net repayments under other short-term debt agreements |
(125 | ) | (49 | ) | (21 | ) | (244 | ) | ||||||||||
| Repayments under long-term debt agreements |
— | (50 | ) | — | — | |||||||||||||
| Proceeds from issuance of senior secured term loans, net of issuance costs |
2,385 | — | — | — | ||||||||||||||
| Repayment of senior secured terms loans |
(1,490 | ) | — | — | — | |||||||||||||
| Proceeds from issuance of senior notes, net of issuance costs |
976 | — | — | — | ||||||||||||||
| Repayment of five-year notes |
(57 | ) | — | — | — | |||||||||||||
| Proceeds from issuance of membership interests |
— | — | 2,042 | — | ||||||||||||||
| Proceeds from issuance of five-year notes |
— | — | 41 | — | ||||||||||||||
| Dividend payments of consolidated affiliates to minority shareholders |
(43 | ) | (27 | ) | — | (13 | ) | |||||||||||
| Distributions to Delphi equity holders |
(93 | ) | — | — | — | |||||||||||||
| Redemption of membership interests |
(4,747 | ) | — | — | — | |||||||||||||
| Discontinued operations |
— | — | — | 6 | ||||||||||||||
|
|
|
|
|
|
|
|
|
|||||||||||
| Net cash (used in) provided by financing activities |
(3,194 | ) | (126 | ) | 2,062 | 315 | ||||||||||||
|
|
|
|
|
|
|
|
|
|||||||||||
| Effect of exchange rate fluctuations on cash and cash equivalents |
(29 | ) | 7 | 1 | 35 | |||||||||||||
|
|
|
|
|
|
|
|
|
|||||||||||
| (Decrease) increase in cash and cash equivalents |
(1,856 | ) | 112 | 3,107 | (959 | ) | ||||||||||||
| Cash and cash equivalents at beginning of period |
3,219 | 3,107 | — | 959 | ||||||||||||||
|
|
|
|
|
|
|
|
|
|||||||||||
| Cash and cash equivalents at end of period |
$ | 1,363 | $ | 3,219 | $ | 3,107 | $ | — | ||||||||||
|
|
|
|
|
|
|
|
|
|||||||||||
See notes to consolidated financial statements.
84
Table of Contents
DELPHI AUTOMOTIVE PLC
CONSOLIDATED STATEMENTS OF SHAREHOLDERS’ EQUITY (DEFICIT)—PREDECESSOR
| Common Stock | Accumulated Paid-in Capital |
Retained Earnings (Accumulated Deficit) |
Accumulated Other Comprehensive Income (Loss) |
Treasury Stock |
Non- controlling Interest |
Total Shareholders’ Equity (Deficit) |
||||||||||||||||||||||||||
| Shares | Amount | |||||||||||||||||||||||||||||||
| (in millions) | ||||||||||||||||||||||||||||||||
| Balance at January 1, 2009 |
565 | $ | 6 | $ | 2,747 | $ | (12,064) | $ | (5,086) | $ | (6) | $ | 137 | $ | (14,266) | |||||||||||||||||
| Net income |
— | — | — | 9,318 | — | — | 29 | 9,347 | ||||||||||||||||||||||||
| Other comprehensive income |
— | — | — | — | 4,945 | — | 1 | 4,946 | ||||||||||||||||||||||||
| Deconsolidation of noncontrolling interest |
— | — | — | — | — | — | (7) | (7) | ||||||||||||||||||||||||
| Dividends |
— | — | — | — | — | — | (20) | (20) | ||||||||||||||||||||||||
| Impact of the Acquisition |
(565) | (6) | (2,747) | 2,746 | 141 | 6 | (140) | — | ||||||||||||||||||||||||
|
|
|
|
|
|
|
|
|
|
|
|
|
|
|
|
|
|||||||||||||||||
| Balance at October 6, 2009 |
— | $ | — | $ | — | $ | — | $ | — | $ | — | $ | — | $ | — | |||||||||||||||||
|
|
|
|
|
|
|
|
|
|
|
|
|
|
|
|
|
|||||||||||||||||
See notes to consolidated financial statements.
85
Table of Contents
DELPHI AUTOMOTIVE PLC
CONSOLIDATED STATEMENTS OF SHAREHOLDERS’ EQUITY—SUCCESSOR
| Ordinary Shares | Additional Paid in Capital |
Retained Earnings |
Membership Interests | Accumulated Other Comprehensive Income (Loss) |
Total Delphi Shareholders’ Equity |
Non- controlling Interest |
Total Share- holders’ Equity |
|||||||||||||||||||||||||||||||||||||||||||||
| Number of Shares |
Amount | Class A | Class B | Class C | Class E-1 | Total | ||||||||||||||||||||||||||||||||||||||||||||||
| Balance at August 19, 2009 |
— | $ | — | $ | — | $ | — | $ | — | $ | — | $ | — | $ | — | $ | — | $ | — | $ | — | $ | — | $ | — | |||||||||||||||||||||||||||
| Net loss |
— | — | — | — | (3) | (12) | (3) | — | (18) | — | (18) | 15 | (3) | |||||||||||||||||||||||||||||||||||||||
| Other comprehensive income |
— | — | — | — | — | — | — | — | — | 24 | 24 | (2) | 22 | |||||||||||||||||||||||||||||||||||||||
| Issuance of membership interests (Note 16) |
— | — | — | — | 1,972 | 2,418 | 542 | — | 4,932 | — | 4,932 | — | 4,932 | |||||||||||||||||||||||||||||||||||||||
| Impact of the Acquisition (Note 1) |
— | — | — | — | — | — | — | — | — | — | — | 415 | 415 | |||||||||||||||||||||||||||||||||||||||
|
|
|
|
|
|
|
|
|
|
|
|
|
|
|
|
|
|
|
|
|
|
|
|
|
|
|
|||||||||||||||||||||||||||
| Balance at December 31, 2009 |
— | $ | — | $ | — | $ | — | $ | 1,969 | $ | 2,406 | $ | 539 | $ | — | $ | 4,914 | $ | 24 | 4,938 | $ | 428 | $ | 5,366 | ||||||||||||||||||||||||||||
|
|
|
|
|
|
|
|
|
|
|
|
|
|
|
|
|
|
|
|
|
|
|
|
|
|
|
|||||||||||||||||||||||||||
| Net income |
— | — | — | — | 114 | 410 | 107 | — | 631 | — | 631 | 72 | 703 | |||||||||||||||||||||||||||||||||||||||
| Other comprehensive income |
— | — | — | — | — | — | — | — | — | 67 | 67 | 3 | 70 | |||||||||||||||||||||||||||||||||||||||
| Dividends |
— | — | — | — | — | — | — | — | — | — | — | (45) | (45) | |||||||||||||||||||||||||||||||||||||||
| Restricted interests recognized (Note 21) |
— | — | — | — | — | — | — | 5 | 5 | — | 5 | — | 5 | |||||||||||||||||||||||||||||||||||||||
|
|
|
|
|
|
|
|
|
|
|
|
|
|
|
|
|
|
|
|
|
|
|
|
|
|
|
|||||||||||||||||||||||||||
| Balance at December 31, 2010 |
— | $ | — | $ | — | $ | — | $ | 2,083 | $ | 2,816 | $ | 646 | $ | 5 | $ | 5,550 | $ | 91 (a) | $ | 5,641 | $ | 458 | $ | 6,099 | |||||||||||||||||||||||||||
|
|
|
|
|
|
|
|
|
|
|
|
|
|
|
|
|
|
|
|
|
|
|
|
|
|
|
|||||||||||||||||||||||||||
| Net income |
— | — | — | 110 | 76 | 930 | 25 | 4 | 1,035 | — | 1,145 | 78 | 1,223 | |||||||||||||||||||||||||||||||||||||||
| Other comprehensive income |
— | — | — | — | — | — | — | — | — | (274) | (274) | 5 | (269) | |||||||||||||||||||||||||||||||||||||||
| Dividends |
— | — | — | — | — | (92) | — | (1) | (93) | — | (93) | (51) | (144) | |||||||||||||||||||||||||||||||||||||||
| Restricted interests recognized (Note 21) |
— | — | — | — | — | — | — | 7 | 7 | — | 7 | — | 7 | |||||||||||||||||||||||||||||||||||||||
| Acquisition of minority interest |
— | — | — | — | 1 | 1 | — | — | 2 | — | 2 | (7) | (5) | |||||||||||||||||||||||||||||||||||||||
| Redemption of membership interest |
— | — | — | — | (2,160) | (1,911) | (671) | (5) | (4,747) | — | (4,747) | — | (4,747) | |||||||||||||||||||||||||||||||||||||||
| Equity conversion—November |
328 | 3 | 1,751 | — | — | (1,744) | — | (10) | (1,754) | — | — | — | — | |||||||||||||||||||||||||||||||||||||||
| Share based compensation |
— | — | 7 | — | — | — | — | — | — | — | 7 | — | 7 | |||||||||||||||||||||||||||||||||||||||
|
|
|
|
|
|
|
|
|
|
|
|
|
|
|
|
|
|
|
|
|
|
|
|
|
|
|
|||||||||||||||||||||||||||
| Balance at December 31, 2011 |
328 | $ | 3 | $ | 1,758 | $ | 110 | $ | — | $ | — | $ | — | $ | — | $ | — | $ | (183)(b) | $ | 1,688 | $ | 483 | $ | 2,171 | |||||||||||||||||||||||||||
|
|
|
|
|
|
|
|
|
|
|
|
|
|
|
|
|
|
|
|
|
|
|
|
|
|
|
|||||||||||||||||||||||||||
| (a) | As of December 31, 2010, Accumulated Other Comprehensive Income totaled $91 million (net of a $48 million tax effect) and included: |
| • | A loss from currency translation adjustments and other of $21 million; |
| • | Income from unrecognized gain on derivative instruments of $53 million (net of a $31 million tax effect); and |
| • | Income from employee benefit plans liability adjustments of $59 million (net of a $17 million tax effect) |
| (b) | As of December 2011, Accumulated Other Comprehensive Loss totaled $183 million (net of a $31 million tax effect) and included: |
| • | A loss from currency translation adjustments and other of $120 million; |
| • | A loss from net changes in unrecognized income on derivative instruments of $45 million (net of a $26 million tax effect); and |
| • | A loss from employee benefit plans liability adjustments of $18 million (net of a $5 million tax effect) |
See notes to consolidated financial statements.
86
Table of Contents
DELPHI AUTOMOTIVE PLC
NOTES TO CONSOLIDATED FINANCIAL STATEMENTS
| 1. | GENERAL |
“Delphi,” the “Company,” and the “Successor” refer to Delphi Automotive PLC, a public limited company which was formed under the laws of Jersey on May 19, 2011, together with its subsidiaries, including Delphi Automotive LLP, a limited liability partnership incorporated under the laws of England and Wales which was formed on August 19, 2009 for the purpose of acquiring certain assets of the former Delphi Corporation, and became a subsidiary of Delphi Automotive PLC in connection with the completion of the Company’s initial public offering on November 22, 2011. The former Delphi Corporation and, as the context may require, its subsidiaries and affiliates, are referred to herein as the “Predecessor”.
Nature of operations—Delphi is a leading global vehicle components manufacturer and provides electrical and electronic, powertrain, safety and thermal technology solutions to the global automotive and commercial vehicle markets. Delphi is one of the largest vehicle component manufacturers, and its customers include 24 of the 25 largest automotive original equipment manufacturers (“OEMs”) in the world. Delphi operates 114 major manufacturing facilities and 15 major technical centers utilizing a regional service model that enables the Company to efficiently and effectively serve its global customers from low cost countries. Delphi has a presence in 30 countries and has over 17,000 scientists, engineers and technicians focused on developing market relevant product solutions for its customers. In line with the growth in emerging markets, Delphi has been increasing its focus on these markets, particularly in China, where the Company has a major manufacturing base and strong customer relationships.
Corporate history—On October 8, 2005 (the “Petition Date”), the former Delphi Corporation (now known as DPH Holdings Corp.) and certain of its United States (“U.S.”) subsidiaries (the “Initial Filers”) filed voluntary petitions for reorganization relief under Chapter 11 of the United States Bankruptcy Code (the “Bankruptcy Code”) in the United States Bankruptcy Court for the Southern District of New York (the “Court”). On October 14, 2005, three additional U.S. subsidiaries of the former Delphi Corporation (together with the Initial Filers, collectively, the “Debtors”) filed voluntary petitions for reorganization relief under chapter 11 of the Bankruptcy Code (collectively the Debtors’ October 8, 2005 and October 14, 2005 filings are referred to herein as the “Chapter 11 Filings”). On July 30, 2009, the Court approved modifications to the First Amended Joint Plan Of Reorganization Of Delphi Corporation And Certain Affiliates, Debtors And Debtors-In-Possession (As Modified)(the “Modified Plan”), which incorporated the master disposition agreement (including all schedules and exhibits thereto, the “MDA”) among the Predecessor, GM Component Holdings LLC, Motors Liquidation Company (“Old GM”), General Motors Company, together with its subsidiaries and affiliates (“GM”) and Delphi, for the sale and purchase of substantially all of the Predecessor’s businesses. On October 6, 2009 (the “Acquisition Date”) the Predecessor emerged from chapter 11 in accordance with the Modified Plan. Through the Acquisition Date, the Debtors operated their businesses as “debtors-in-possession” under the jurisdiction of the Court and in accordance with the applicable provisions of the Bankruptcy Code and orders of the Court. The Predecessor’s non-U.S. subsidiaries were not included in the Chapter 11 Filings, continued their business operations without supervision from the Court and were not subject to the requirements of the Bankruptcy Code.
On August 19, 2009, Delphi Automotive LLP, a limited liability partnership organized under the laws of England and Wales, was formed for the purpose of acquiring certain assets and subsidiaries of the former Delphi Corporation, its Predecessor, which, along with certain of its U.S. subsidiaries, had filed voluntary petitions for bankruptcy in October 2005. On October 6, 2009, Delphi Automotive LLP acquired the major portion of the business of the Predecessor, other than the global steering business, the U.S. manufacturing facilities in which the hourly employees were represented by the International Union, United Automobile, Aerospace and Agricultural Implement Workers of America (“UAW”) and certain non-productive U.S. assets, and Delphi Automotive LLP issued membership interests to a group of investors consisting of lenders to the Predecessor, GM and Pension Benefit Guaranty Corporation (the “PBGC”).
87
Table of Contents
On March 31, 2011, all of the outstanding Class A and Class C membership interests held by GM and the PBGC were redeemed, respectively, for approximately $4.4 billion. The redemption transaction was funded by a $3.0 billion credit facility entered into on March 31, 2011 (the “Credit Facility”) and existing cash. Refer to Note 12. Debt and Note 16. Shareholders’ Equity and Net Income (Loss) Per Share for additional disclosures.
On May 19, 2011, Delphi Automotive PLC was formed as a Jersey public limited company, and had nominal assets, no liabilities and had conducted no operations prior to its initial public offering. On November 22, 2011, in conjunction with the completion of its initial public offering by the selling shareholders, all of the outstanding equity of Delphi Automotive LLP was exchanged for ordinary shares of Delphi Automotive PLC. As a result, Delphi Automotive LLP became a wholly-owned subsidiary of Delphi Automotive PLC. The transaction whereby Delphi Automotive LLP became a wholly-owned subsidiary of Delphi Automotive PLC had no accounting effects. These consolidated financial statements of the Successor for periods prior to the initial public offering are those of Delphi Automotive LLP.
General and basis of presentation—On the Acquisition Date, the Successor acquired the automotive supply business (other than the global steering business and the manufacturing facilities in the U.S. in which the hourly employees are represented by the UAW) of the Predecessor. As a result of the Acquisition, as defined below, Delphi acquired the major portion of the business of the Predecessor and this business constituted the entirety of the operations of the Successor. Accordingly, as required, the financial information set forth herein reflects: (i) the consolidated results of operations and cash flows of the Successor for the years ended December 31, 2011 and 2010 and the period from its incorporation on August 19, 2009 to December 31, 2009 and of the Predecessor for the period from January 1, 2009 to October 6, 2009 and (ii) the consolidated financial position of the Successor as of December 31, 2011 and 2010. Delphi Automotive LLP had no material or substantive transactions from its incorporation on August 19, 2009 to the Acquisition Date. In accordance with Financial Accounting Standards Board Accounting Standards Codification (“FASB ASC”) 805, Business Combinations, as of the Acquisition Date, the Company recognized and measured the fair value of the identifiable assets acquired and the liabilities assumed from the Predecessor.
The Predecessor adopted the accounting guidance in FASB ASC 852, Reorganizations, effective October 8, 2005 and has segregated in the financial statements for all reporting periods subsequent to such date and through the consummation of the transactions pursuant to the Modified Plan on October 6, 2009, transactions and events that were directly associated with the reorganization from the ongoing operations of the business. The consolidated financial statements of Delphi are not comparable to the consolidated financial statements of the Predecessor due to the effects of the consummation of the Modified Plan and the change in the basis of presentation.
Consummation of the modified plan—On October 6, 2009, the Predecessor (i) consummated the transactions contemplated by the Modified Plan among the Predecessor, GM and Delphi and (ii) emerged from chapter 11 in accordance with the Modified Plan as DPH Holdings Corp. and its subsidiaries and affiliates (“DPHH”), except that two of the Predecessor’s debtor subsidiaries became subsidiaries of Delphi. A summary of significant terms of the Modified Plan follows:
| • | Delphi acquired the businesses (other than the global steering business and the manufacturing facilities in the U.S. in which the hourly employees are represented by the UAW) of the Predecessor pursuant to the MDA, and received $1,833 million from GM, of which $1,689 million was received on the Acquisition Date and $144 million was received during the Successor period from August 19 to December 31, 2009, and $209 million from the debtor-in-possession (“DIP”) lenders to the Predecessors (collectively, the “Acquisition”). |
| • | GM acquired substantially all of the Predecessor’s global steering business and the manufacturing facilities in the U.S. at which the hourly employees were represented by the UAW. |
| • | The Predecessor’s debtor-in-possession financing was settled. |
88
Table of Contents
| • | The Predecessor’s liabilities subject to compromise were extinguished. |
| • | If cumulative distributions to the members of Delphi Automotive LLP under certain provisions of its limited liability partnership agreement exceed $7.2 billion, Delphi, as disbursing agent on behalf of DPHH, is required to pay to the holders of allowed general unsecured claims against the Predecessor, $32.50 for every $67.50 in excess of $7.2 billion distributed to the members of Delphi Automotive LLP, up to a maximum of $300 million. |
| • | The Predecessor’s equity holders did not receive recoveries on their claims. |
Reorganization items—The accounting guidance in FASB ASC 852, Reorganizations, requires reorganization items such as revenues, professional fees directly related to the process of reorganizing the Debtors under chapter 11 of the Bankruptcy Code, realized gains and losses, provisions for losses, and interest income resulting from the reorganization and restructuring of the business to be separately disclosed. Professional fees directly related to the reorganization include fees associated with advisors to the Debtors, unsecured creditors, secured creditors and unions. The Predecessor’s reorganization items consisted of the following:
| Predecessor | ||||
| (Income)/Expense | ||||
| Period from January 1 to October 6, 2009 |
||||
| (in millions) | ||||
| Sale / disposition of the Predecessor |
$ | (794) | ||
| Extinguishment of liabilities subject to compromise |
(11,159) | |||
| PBGC termination of U.S. pension plans (Note 13) |
2,818 | |||
| Salaried OPEB settlement (Note 13) |
(1,168) | |||
| Professional fees directly related to reorganization |
68 | |||
| Other |
25 | |||
|
|
|
|||
| Total reorganization items |
$ | (10,210) | ||
|
|
|
|||
Disposition of the Predecessor—The Predecessor sold the automotive supply business (other than the global steering business and the UAW manufacturing facilities in the U.S. which were acquired by GM) to Delphi. Certain assets and liabilities were retained by DPHH and various liabilities were extinguished or settled, including the settlement of approximately $3.3 billion of DIP financing and $850 million outstanding under GM liquidity support agreements. A summary of the debt settled upon consummation of the Modified Plan is included below:
| (in millions) | ||||
| First Priority Revolving Credit Facility |
$ | 230 | ||
| First Priority Term Loan |
310 | |||
| Second Priority Term Loan |
2,750 | |||
|
|
|
|||
| DIP financing |
3,290 | |||
| GM liquidity support agreements |
850 | |||
|
|
|
|||
| Total debt settled |
$ | 4,140 | ||
|
|
|
|||
The $794 million of gain from reorganization items for the period from January 1 to October 6, 2009 primarily relate to the extinguishment of liabilities. As these liabilities were extinguished, the respective carrying values, as noted below, were eliminated resulting in a gain from reorganization, as follows:
| • | The extinguishment of accrued liabilities, resulting in a gain from reorganization items for the Predecessor of approximately $525 million. The extinguished accrued liabilities primarily included |
89
Table of Contents
| $260 million in interest accruals related to the Second Priority Term Loan settled under the terms of the Modified Plan and the extinguishment of the $210 million advance on working capital recovery for the global steering business provided in 2008 in connection with the Amended MRA (as defined and further discussed in Note 3. Elements of Predecessor Transformation Plan). |
| • | Certain other long-term liabilities, primarily workers’ compensation, that were extinguished as part of the bankruptcy process, resulting in a gain from reorganization of approximately $305 million. |
| • | The net other liabilities of the Predecessor that were not acquired by GM or Delphi, resulting in a gain from reorganization for the Predecessor of approximately $20 million. |
| • | The acquisition by GM of substantially all of the Predecessor’s global steering business and the manufacturing facilities in the U.S. at which employees were represented by the UAW in Kokomo, Indiana; Rochester, New York; Lockport, New York; and Grand Rapids, Michigan, for no cash consideration paid to Delphi. Under the MDA, in exchange for the sale of these businesses, GM waived certain claims, paid a portion of the DIP loans, agreed to pay certain administrative claims and assumed certain liabilities. The disposition of these businesses by the Predecessor resulted in a loss from reorganization of approximately $56 million. |
The following table summarizes the $11,159 million of gain from reorganization items related to the extinguishment of liabilities subject to compromise:
| Liabilities Assumed by Delphi: |
(in millions) | |||
| Pension and postretirement obligations |
$ | 68 | ||
| Cure payments |
18 | |||
| Other |
3 | |||
|
|
|
|||
| Total claims reinstated |
$ | 89 | ||
|
|
|
|||
| Liabilities Extinguished: |
||||
| Pension and postretirement obligations |
$ | 135 | ||
| Supplemental executive retirement program obligations |
117 | |||
| PBGC general unsecured claim |
3,000 | |||
| GM allowed general unsecured and administrative claims |
4,128 | |||
| Allowed IUE-CWA and USW claims |
129 | |||
| Debt and notes payable (including junior subordinated notes due 2033) |
2,375 | |||
| Accounts payable |
731 | |||
| Securities & ERISA litigation liability |
351 | |||
| Other |
193 | |||
|
|
|
|||
| Total claims extinguished |
11,159 | |||
|
|
|
|||
| Total liabilities subject to compromise assumed by Delphi or retired |
$ | 11,248 | ||
|
|
|
|||
Acquisition accounting—Delphi has recorded the assets acquired and the liabilities assumed from the Predecessor at estimated fair values in accordance with the guidance in FASB ASC 820, Fair Value Measurements and Disclosures. The fair values were estimated based on valuations performed by an independent valuation specialist utilizing three generally accepted business valuation approaches: the income, market, and cost approaches. Generally, the income and market approaches were used and weighted by the independent valuation specialists as appropriate. A further description of each approach follows:
| • | Income Approach: The income approach recognizes the value of an investment is premised on the receipt of future economic benefits. These benefits can include earnings, cost savings, tax deductions and the proceeds from disposition. The discounted cash flow (“DCF”) method is a form of the income |
90
Table of Contents
| approach commonly used to value business interests. The DCF method involves estimating future cash flows of a business and discounting them to their present value. The discount rate is selected based on consideration of the risks inherent in the investment and market rates of return available from alternative investments of similar type and quality as of the valuation date. More specifically, the DCF method bases the value of a company on the cash flow attributable to that company. This approach is based on the assumptions that: (i) a company is worth what it can generate in future cash flows to its owners; (ii) the future cash flows are reasonably predictable; and (iii) the cost of capital and investors’ required rates of return on invested capital can be estimated. This approach assumes that the income derived from a company will, to a large extent, determine the value of that company. |
The DCF method was based on Company-prepared projections which included a variety of estimates and assumptions. While the Company considers such estimates and assumptions reasonable, they are inherently subject to significant business, economic and competitive uncertainties, many of which are beyond the Company’s control and, therefore, may not be realized. Changes in these estimates and assumptions may have a significant effect on the determination of the fair value of the assets acquired and liabilities assumed in the Acquisition. Accordingly, there can be no assurance that the estimates, assumptions, and values reflected in the valuations will be realized, and actual results could vary materially. The following key assumptions were utilized in applying the DCF method:
| • | Delphi provided its independent valuation specialist with projected net sales, expenses and cash flows, for the years ending December 31, 2010, 2011 and 2012 representing the Company’s best estimates at the time the analysis was prepared. |
| • | Discount rates to determine the present value of the future cash flows from 2010 through 2012 and the terminal values were based on the weighted average cost of capital (“WACC”). The WACCs measure the average cost per dollar of capital of an enterprise based on the individual costs of debt and equity and the business unit’s target capital structure. The WACC is derived based on a set of guideline public companies for each business unit, and is an indicator of the cost of capital for a market participant in the business unit’s industry. The cost of equity estimated using the capital asset pricing model was between 13.4% and 23.5%, with a median of 16.4%. The pre-tax cost of debt was estimated to be 8% based on the yield on Delphi’s guideline companies’ publicly traded bonds as of the Acquisition Date. The range of WACCs for the business units was between 10.3% and 18.8% with a median of 13.6%. |
| • | Terminal value for each business unit was based on the Gordon Growth Model using a range of long-term growth rates of 0% to 5%, with a median of 3%. |
| • | Market Approach: The market approach measures the value of a company through the analysis of recent sales or offerings of comparable companies. The guideline public companies method and the guideline merged or acquired company method are the most common forms of the market approach used to value business interests. Use of the market approach requires that comparable transactions be available, which may include: |
| • | The recent sales price of the same or similar companies or assets in an arm’s-length transaction; or |
| • | The market price for the license of the same or similar assets to an independent third party. |
In applying the market approach, unique sets of comparable guideline public companies were identified using the Capital IQ data services. Capital IQ was used as the source of data to determine the guideline public companies’ Total Invested Capital (“TIC” defined as Market value of equity + Market value of debt + Market value of preferred stock and minority interest). The TIC was then calculated as a multiple of Trailing Twelve Months (“TTM”) Revenue, TTM Earnings Before Interest, Tax, Depreciation and Amortization (“EBITDA”), TTM Earning Before Interest, and Tax (“EBIT”), Next Fiscal Year (“NFY”) Revenue, NFY EBITDA, NFY EBIT, and NFY+1 EBITDA. For the NFY financial data, revenue and earnings estimates were obtained from
91
Table of Contents
Capital IQ for the average analyst estimates for the guideline public companies. The business unit’s respective multiples were selected depending on circumstances specific to each business unit within the range of the multiples provided by the comparable companies.
Delphi utilized TTM Revenue multiples of 0.3x-1.0x, NFY Revenue multiples of 0.3x-0.8x, NFY EBITDA multiples of 4.0x-6.9x and NFY+1 EBITDA multiples of 3.2x-7.2x. The selected multiples were then applied to respective financial results of the business units to derive an implied value of TIC. The resulting values from TTM Revenue, NFY Revenue, NFY EBITDA, and NFY+1 EBITDA multiples were weighted according to unique characteristics of each business unit, mostly at 20%, 20%, 50%, and 10%, respectively to arrive at minority marketable value of TIC. No control premium was applied to determine the fair value of the TIC of the business units on a controlling basis in consideration of the difficult conditions within the automotive supplier industry.
| • | Cost Approach: The cost approach considers reproduction or replacement cost as an indicator of value. The cost approach is based on the assumption that a prudent investor would pay no more for an entity than the amount for which he could replace or re-create it. Historical costs are often used to estimate the current cost of replacing the entity valued. In doing so, adjustments for physical deterioration and obsolescence are taken into account. When using the cost approach to value a business enterprise, the equity value is calculated as the appraised value of the individual assets that comprise the business less the value of the liabilities that encumber those assets. |
The following table summarizes the estimated provisional fair values of the assets acquired and liabilities assumed based on information that was available at the Acquisition Date. Measurement period adjustments were completed in 2010 and reflect new information obtained about facts and circumstances that existed as of the Acquisition Date, primarily related to changes in deferred taxes to reflect book to tax return reconciliations. Accordingly, the carrying amount of deferred tax assets and property, plant and equipment were retrospectively adjusted as of October 6, 2009. The impact of the retrospective adjustments was not material to Delphi’s results of operations or cash flows for the period from the Acquisition Date through December 31, 2009 and, therefore, was reflected in operating results in the year ended December 31, 2010.
| October 6, 2009 (As initially reported) |
Measurement Period Adjustments |
October 6, 2009 (As adjusted) |
||||||||||
| (in millions) | ||||||||||||
| Fair value of membership interests issued |
$ | 4,932 | $ | — | $ | 4,932 | ||||||
|
|
|
|
|
|
|
|||||||
| Recognized amounts of identifiable assets acquired and liabilities assumed |
||||||||||||
| Cash and cash equivalents(1) |
$ | 2,801 | $ | — | $ | 2,801 | ||||||
| Restricted cash |
124 | — | 124 | |||||||||
| Accounts receivable |
2,160 | — | 2,160 | |||||||||
| Inventory(2) |
964 | — | 964 | |||||||||
| Property, plant and equipment(3) |
2,255 | (169) | 2,086 | |||||||||
| Identifiable intangible assets(4) |
766 | — | 766 | |||||||||
| Deferred tax assets |
305 | 169 | 474 | |||||||||
| Other assets |
896 | — | 896 | |||||||||
| Accounts payable |
(1,585) | — | (1,585) | |||||||||
| Pension liabilities(5) |
(882) | — | (882) | |||||||||
| Debt(6) |
(419) | — | (419) | |||||||||
| Deferred tax liabilities |
(328) | — | (328) | |||||||||
| Other liabilities(7) |
(1,710) | — | (1,710) | |||||||||
| Noncontrolling interests |
(415) | — | (415) | |||||||||
|
|
|
|
|
|
|
|||||||
| Total identifiable net assets |
$ | 4,932 | $ | — | $ | 4,932 | ||||||
|
|
|
|
|
|
|
|||||||
Acquisition-related costs of $19 million were included in Other income (expense), net in the consolidated results of operations of the Successor for the period August 19 to December 31, 2009.
92
Table of Contents
| 1. | Cash and cash equivalents acquired is as follows: |
| (in millions) | ||||
| Cash from issuance of Class A membership interests |
$ | 1,689 | ||
| Cash from issuance of Class B membership interests |
209 | |||
| Cash acquired from the Predecessor |
862 | |||
| Proceeds from issuance of 5-Year Note |
41 | |||
|
|
|
|||
| Total cash and cash equivalents acquired |
$ | 2,801 | ||
|
|
|
|||
| 2. | Inventory is recorded at fair value. Raw materials were valued at current replacement costs and work-in-process was valued at the estimated selling prices of finished goods less the sum of costs to complete, costs of disposal and reasonable profit allowances for completing and selling efforts based on profits for similar finished goods. Finished goods were valued at estimated selling prices less the sum of costs of disposal and reasonable profit allowances for the selling efforts. |
| 3. | Property, plant and equipment are recorded at fair value giving consideration to their highest and best use. Key assumptions used in the valuation of the Company’s property, plant and equipment were based on a combination of the cost or market approach, depending on whether market data was available. |
| 4. | Identifiable intangible assets are recorded at fair value and include customer relationships, trade names, patents and in-process research and development (“IPR&D”). The following approaches were considered in valuing the identifiable intangible assets: |
| • | Relief from Royalty (“RFR”) Method: This form of the income approach determines the value of an intangible asset by capitalizing future royalty payments (income) that are avoided (earned) since the intangible asset is owned rather than licensed. Royalty payments are estimated at the amount that a company would be willing to pay in the form of a royalty for the use of the intangible asset, assuming an outside party owned the rights to the intangible asset. The relief from royalty method is generally used to value trademarks, trade names, and some technologies. This methodology is most reliable when there are observable royalty rates charged for the use of comparable intangible assets. |
| • | Excess Earnings (“EE”) Method: Similar to the DCF method described above, the EE method calculates the value of an intangible asset by discounting its future cash flows. Cash flow is calculated by first estimating after-tax income, which is adjusted for non-cash charges. A contributory asset charge is also applied to reflect the costs associated with the use of other assets to generate the cash flow. The excess earnings method is often used to value customer relationships, technologies, and IPR&D. The EE method is the best approach to use when future economic benefits of the intangible asset can be reasonably estimated but need to be segregated from one or more assets that contribute to the production of the cash flow. |
The following table summarizes the estimated fair values as of the Acquisition Date of the identifiable intangible assets, the method and significant assumptions used to estimate the fair values and the weighted average amortization period of definite-lived intangible assets:
| Identifiable Intangible Asset |
Valuation Approach |
Royalty Rate | Discount Rate | Weighted Average Amortization Period |
Acquisition Date Fair Value |
|||||||||
| (Years) | (in millions) | |||||||||||||
| Patents |
RFR | 0.7%-1.2% | 14.4%-22.0% | 13 | $ | 442 | ||||||||
| Customer relationships |
EE | N/A | 14.5%-22.4% | 6 | 140 | |||||||||
| Trade names |
RFR | 0.2%-1.0% | 14.5%-21.4% | 20 | 97 | |||||||||
| IPR&D |
EE | N/A | 22.4%-39.5% | N/A | 87 | |||||||||
|
|
|
|||||||||||||
| Total identifiable intangible assets |
$ | 766 | ||||||||||||
|
|
|
|||||||||||||
93
Table of Contents
| 5. | Pension obligations assumed are comprised primarily of plans outside the U.S. and were recorded at fair value as of the Acquisition Date. |
| 6. | Debt is comprised of foreign receivables factoring and other debt assumed from the Predecessor and the issuance of a $41 million five-year note with a 12% interest rate in conjunction with the Acquisition. Debt was recorded at fair value as of the Acquisition Date, which resulted in a $2 million net reduction to the nominal value of the debt. The difference between the fair value and nominal value of debt will be accreted to nominal value over the term of the indebtedness. |
| 7. | Contingent liability of up to $300 million required to be paid to the holders of allowed general unsecured claims against the Predecessor if cumulative distributions to the members exceed $7.2 billion was not probable as of October 6, 2009 and therefore, recorded at zero. |
| 2. | SIGNIFICANT ACCOUNTING POLICIES |
The significant accounting policies outlined below are applicable to both Delphi and the Predecessor, unless otherwise specifically indicated. Accordingly, except where otherwise indicated, references to “Delphi” within Note 2. Significant Accounting Policies should be understood to be related both to Delphi and the Predecessor.
Consolidation—The consolidated financial statements include the accounts of Delphi and domestic and non-U.S. subsidiaries in which Delphi holds a controlling financial or management interest and variable interest entities of which Delphi has determined that it is the primary beneficiary. Delphi’s share of the earnings or losses of non-controlled affiliates, over which Delphi exercises significant influence (generally a 20% to 50% ownership interest), is included in the consolidated operating results using the equity method of accounting. All significant intercompany transactions and balances between consolidated Delphi businesses have been eliminated.
Use of estimates—Preparation of consolidated financial statements in conformity with accounting principles generally accepted in the United States of America (“U.S. GAAP”) requires the use of estimates and assumptions that affect amounts reported therein. Generally, matters subject to estimation and judgment include amounts related to accounts receivable realization, inventory obsolescence, asset impairments, useful lives of intangible and fixed assets, deferred tax asset valuation allowances, income taxes, pension benefit plan assumptions, accruals related to litigation, warranty costs, environmental remediation costs, worker’s compensation accruals and healthcare accruals. Due to the inherent uncertainty involved in making estimates, actual results reported in future periods may be based upon amounts that differ from those estimates.
Revenue recognition—Sales are recognized when there is evidence of a sales agreement, the delivery of goods has occurred, the sales price is fixed or determinable and the collectability of revenue is reasonably assured. Sales are generally recorded upon shipment of product to customers and transfer of title under standard commercial terms. In addition, if Delphi enters into retroactive price adjustments with its customers, these reductions to revenue are recorded when they are determined to be probable and estimable. From time to time, Delphi enters into pricing agreements with its customers that provide for price reductions, some of which are conditional upon achieving certain joint cost saving targets. In these instances, revenue is recognized based on the agreed-upon price at the time of shipment.
Sales incentives and allowances are recognized as a reduction to revenue at the time of the related sale. In addition, from time to time, Delphi makes payments to customers in conjunction with ongoing and in limited circumstances future business. These payments to customers are recognized as a reduction to revenue at the time of the commitment to make these payments.
Shipping and handling fees billed to customers are included in net sales, while costs of shipping and handling are included in cost of sales.
94
Table of Contents
Delphi collects and remits taxes assessed by different governmental authorities that are both imposed on and concurrent with a revenue-producing transaction between the Company and the Company’s customers. These taxes may include, but are not limited to, sales, use, value-added, and some excise taxes. Delphi reports the collection of these taxes on a net basis (excluded from revenues).
Membership interests—At the Acquisition Date, the outstanding common stock of the Predecessor was cancelled and membership interests in Delphi Automotive LLP were issued to Delphi’s owners. On March 31, 2011, all of the outstanding Class A and Class C membership interests held by GM and PBGC were redeemed, respectively, for approximately $4.4 billion.
In conjunction with the completion of the initial public offering on November 22, 2011 of 24,078,827 ordinary shares by the selling shareholders for an aggregate purchase price of approximately $530 million, all of the outstanding equity of Delphi Automotive LLP was exchanged for 328,244,510 ordinary shares, par value $0.01 in Delphi Automotive PLC. As a result, Delphi Automotive LLP became a wholly-owned subsidiary of Delphi Automotive PLC. Delphi did not receive any proceeds from this offering.
Prior to the initial public offering, total membership interests and net income (loss) were allocated among the respective classes based on the cumulative distribution provisions of the Fourth Amended and Restated Limited Liability Partnership Agreement of Delphi Automotive LLP (the “Fourth LLP Agreement”). Refer to Note 16. Shareholders’ Equity and Net Income (Loss) Per Share for additional information.
Net income (loss) per share—Basic net income (loss) per share is computed by dividing net income (loss) attributable to Delphi by the weighted–average number of ordinary shares outstanding during the period. Diluted net income (loss) per share reflects the weighted average dilutive impact of all potentially dilutive securities from the date of issuance and is computed using the treasury stock method by dividing net income (loss) attributable to Delphi by the diluted weighted-average number of ordinary shares outstanding. Share amounts included in these notes are on a diluted basis. See Note 16. Shareholders’ Equity and Net Income (Loss) Per Share for additional information including the calculation of basic and diluted net income (loss) per share.
Research and development—Costs are incurred in connection with research and development programs that are expected to contribute to future earnings. Such costs are charged against income as incurred. Total research and development expenses (including engineering) were $1.2 billion, $1.0 billion, $0.3 billion and $1.0 billion for the years ended December 31, 2011 and 2010, and the periods August 19 to December 31, 2009, and January 1 to October 6, 2009, respectively.
Cash and cash equivalents—Cash and cash equivalents are defined as short-term, highly liquid investments with original maturities of three months or less.
Time deposits—From time to time, Delphi enters into various time deposit agreements whereby certain of Delphi’s funds on deposit with financial institutions may not be withdrawn for a specified period of time. Time deposits with original maturity periods of three months or less are included as Cash and cash equivalents in the consolidated balance sheets, while time deposits with original maturity periods greater than three months are separately stated in the consolidated balance sheets. The carrying value of time deposits approximates fair value as of December 31, 2010. There were no time deposits at December 31, 2011.
Marketable securities—Marketable securities with maturities of three months or less are classified as cash and cash equivalents for financial statement purposes. Available-for-sale securities are recorded in the consolidated financial statements at market value with changes in market value included in other comprehensive income (“OCI”). Available-for-sale securities with a cost basis of $0 million and $13 million and a carrying value of $0 million and $12 million were held as of December 31, 2011 and 2010, respectively. In the event debt or equity securities experience an other-than-temporary impairment in value, such impairment is recognized as a loss in the consolidated statement of operations. In 2011 and 2010, Delphi recognized an other-than-temporary impairment of $6 million and $9 million, respectively.
95
Table of Contents
Restricted cash—Restricted cash includes balances on deposit at financial institutions that have issued letters of credit in favor of Delphi.
Accounts receivable—Delphi enters into agreements to sell certain of its accounts receivable, primarily in Europe. Since the agreements allow Delphi to maintain effective control over the receivables, these various accounts receivable factoring facilities were accounted for as short-term debt at December 31, 2011 and 2010. Collateral is not generally required related to these trade accounts receivable.
The allowance for doubtful accounts is established based upon analysis of trade receivables for known collectability issues and the aging of the trade receivables at the end of each period and, generally, all accounts receivable balances greater than 90 days past due are fully reserved. As of December 31, 2011 and 2010, the accounts receivable reserve was $70 million and $64 million, respectively and the provision for doubtful accounts was $25 million, $45 million, $33 million and $22 million for the years ended December 31, 2011 and 2010, and the periods August 19 to December 31, 2009, and January 1 to October 6, 2009, respectively.
The Company exchanges certain amounts of accounts receivable, primarily in the Asia/Pacific region, for bank notes with original maturities greater than three months. The collection of such bank notes are included in operating cash flows based on the substance of the underlying transactions, which are operating in nature.
Inventories—As of December 31, 2011 and 2010, inventories are stated at the lower of cost, determined on a first-in, first-out basis, or market, including direct material costs and direct and indirect manufacturing costs. Refer to Note 4. Inventories for additional information. Obsolete inventory is identified based on analysis of inventory for known obsolescence issues, and, generally, the market value of inventory on hand in excess of one year’s supply is fully-reserved.
From time to time, payments may be received from suppliers. These payments from suppliers are recognized as a reduction of the cost of the material acquired during the period to which the payments relate. In some instances, supplier rebates are received in conjunction with or concurrent with the negotiation of future purchase agreements and these amounts are amortized over the prospective agreement period.
Property—Property, plant and equipment, including internally-developed internal use software and special tools, were adjusted to fair value as of October 6, 2009, which represents a new cost basis, and were adjusted for depreciation in subsequent periods. Major improvements that materially extend the useful life of property are capitalized. Expenditures for repairs and maintenance are charged to expense as incurred. For the Successor, depreciation is determined based on a straight-line method over the estimated useful lives of groups of property. For the Predecessor, depreciation was determined based on the estimated useful lives of groups of property generally using straight-line methods or using an accelerated method, which accumulates depreciation of approximately two-thirds of the depreciable cost during the first half of the estimated useful lives. Leasehold improvements under capital leases are depreciated over the period of the lease or the life of the property, whichever is shorter, with the depreciation applied directly to the asset account.
At December 31, 2011 and 2010, the special tools balance was $310 million and $247 million, respectively, included within property, net in the consolidated balance sheets. Special tools balances represent Delphi-owned tools, dies, jigs and other items used in the manufacture of customer components. Special tools also include unreimbursed pre-production tooling costs related to customer-owned tools for which the customer has provided a non-cancellable right to use the tool. Delphi-owned special tools balances are depreciated over the expected life of the special tool or the life of the related vehicle program, whichever is shorter. The unreimbursed costs incurred related to customer-owned special tools that are not subject to reimbursement are capitalized and depreciated over the expected life of the special tool or the life of the related vehicle program, whichever is shorter. Engineering, testing and other costs incurred in the design and development of production parts are expensed as incurred, unless the costs are reimbursable, as specified in a customer contract. As of December 31, 2011 and 2010, the Delphi-owned special tools balances were $259 million and $220 million, respectively, and the customer-owned special tools balances were $51 million and $27 million, respectively.
96
Table of Contents
Valuation of long-lived assets—The carrying value of long-lived assets held for use including definite-lived intangible assets is periodically evaluated when events or circumstances warrant such a review. The carrying value of a long-lived asset held for use is considered impaired when the anticipated separately identifiable undiscounted cash flows from the asset are less than the carrying value of the asset. In that event, a loss is recognized based on the amount by which the carrying value exceeds the fair value of the long-lived asset. Fair value is determined primarily using the anticipated cash flows discounted at a rate commensurate with the risk involved and Delphi’s review of appraisals. Impairment losses on long-lived assets held for sale are determined in a similar manner, except that fair values are reduced for the cost to dispose of the assets. Refer to Note 20. Discontinued Operations and Note 7. Property, Net for more information.
Intangible assets—Intangible assets were $596 million and $665 million as of December 31, 2011 and 2010, respectively. In general, definite-lived intangible assets are being amortized over their useful lives, normally 6-20 years. Costs to renew or extend the term of acquired intangible assets are recognized as expense as incurred. Refer to Note 8. Intangible Assets and Goodwill for more information.
Warranty—Expected warranty costs for products sold are recognized at the time of sale of the product based on its estimate of the amount that eventually will be required to settle such obligations. These accruals are based on factors such as past experience, production changes, industry developments and various other considerations. These estimates are adjusted from time to time based on facts and circumstances that impact the status of existing claims. Refer to Note 10. Warranty Obligations.
Foreign currency translation—Assets and liabilities of non-U.S. subsidiaries that use a currency other than U.S. dollars as their functional currency are translated to U.S. dollars at end-of-period currency exchange rates. The consolidated statements of operations of non-U.S. subsidiaries are translated to U.S. dollars at average-period currency exchange rates. The effect of translation for non-U.S. subsidiaries is generally reported in OCI. The effect of remeasurement of assets and liabilities of non-U.S. subsidiaries that use the U.S. dollar as their functional currency is primarily included in cost of sales. Also included in cost of sales are gains and losses arising from transactions denominated in a currency other than the functional currency of a particular entity. Net foreign currency transaction (gains) or losses of ($3 million), $20 million, $2 million and $5 million were included in the consolidated statements of operations for the years ended December 31, 2011 and 2010, and the periods from August 19 to December 31, 2009 and January 1 to October 6, 2009, respectively.
Restructuring—Delphi continually evaluates alternatives to align the business with the changing needs of its customers and to lower the operating costs. This includes the realignment of its existing manufacturing capacity, facility closures, or similar actions in the normal course of business. These actions may result in voluntary or involuntary employee termination benefits, which are mainly pursuant to union or other contractual agreements. Voluntary termination benefits are accrued when an employee accepts the related offer. Involuntary termination benefits are accrued upon the commitment to a termination plan and the benefit arrangement is communicated to affected employees, or when liabilities are determined to be probable and estimable, depending on the existence of a substantive plan for severance or termination. Contract termination costs are recorded when contracts are terminated or when Delphi ceases to use the leased facility and no longer derives economic benefit from the contract. All other exit costs are expensed as incurred. Refer to Note 11. Restructuring. Refer to Note 3. Elements of Predecessor Transformation Plan for employee termination benefits and other exit costs related to non-core product lines. Pursuant to the Amended MRA (as defined in Note 3. Elements of Predecessor Transformation Plan), GM reimbursed the Predecessor for severance obligations paid by the Predecessor from January 1 to October 6, 2009 in relation to all current and former UAW-represented hourly active, inactive, and retired employees.
Environmental liabilities—Environmental remediation liabilities are recognized when a loss is probable and can be reasonably estimated. Such liabilities generally are not subject to insurance coverage. The cost of each environmental remediation is estimated by engineering, financial, and legal specialists based on current law and considers the estimated cost of investigation and remediation required and the likelihood that, where applicable, other responsible parties will be able to fulfill their commitments. The process of estimating
97
Table of Contents
environmental remediation liabilities is complex and dependent primarily on the nature and extent of historical information and physical data relating to a contaminated site, the complexity of the site, the uncertainty as to what remediation and technology will be required, and the outcome of discussions with regulatory agencies and, if applicable, other responsible parties at multi-party sites. In future periods, new laws or regulations, advances in remediation technologies and additional information about the ultimate remediation methodology to be used could significantly change estimates by Delphi. Refer to Note 14. Commitments and Contingencies for more information.
Asset retirement obligations—Asset retirement obligations are recognized in accordance with FASB ASC 410, Asset Retirement and Environmental Obligations. Conditional retirement obligations have been identified primarily related to asbestos abatement at certain sites. To a lesser extent, conditional retirement obligations also exist at certain sites related to the removal of storage tanks and polychlorinated biphenyl disposal costs. Asset retirement obligations were $3 million and $4 million at December 31, 2011 and 2010, respectively.
Customer concentrations—Sales to GM were approximately 19%, 21%, 20% and 26% of Delphi’s and the Predecessor’s total net sales for the years ended December 31, 2011 and 2010, and the period from August 19, 2009 to December 31, 2009, and the period from January 1, 2009 to October 6, 2009, respectively. Accounts and other receivables due from GM were $382 million and $393 million as of December 31, 2011 and 2010, respectively. No other single customer accounted for more than 10% of Delphi’s consolidated net sales in any period presented.
Derivative financial instruments—All derivative instruments are required to be reported on the balance sheet at fair value unless the transactions qualify and are designated as normal purchases or sales. Changes in fair value are reported currently through earnings unless they meet hedge accounting criteria.
Exposure to fluctuations in currency exchange rates, interest rates and certain commodity prices are managed by entering into a variety of forward contracts and swaps with various counterparties. Such financial exposures are managed in accordance with the policies and procedures of Delphi. Delphi did not enter into derivative transactions for speculative or trading purposes. As part of the hedging program approval process, Delphi identifies the specific financial risk which the derivative transaction will minimize, the appropriate hedging instrument to be used to reduce the risk and the correlation between the financial risk and the hedging instrument. Purchase orders, sales contracts, letters of intent, capital planning forecasts and historical data are used as the basis for determining the anticipated values of the transactions to be hedged. Delphi does not enter into derivative transactions that do not have a high correlation with the underlying financial risk. Hedge positions, as well as the correlation between the transaction risks and the hedging instruments, are reviewed on an ongoing basis.
Foreign exchange forward contracts are accounted for as hedges of firm or forecasted foreign currency commitments to the extent they are designated and assessed as highly effective. All foreign exchange contracts are marked to market on a current basis. Commodity swaps are accounted for as hedges of firm or anticipated commodity purchase contracts to the extent they are designated and assessed as effective. All other commodity derivative contracts that are not designated as hedges are either marked to market on a current basis or are exempted from mark to market accounting as normal purchases. At December 31, 2011 and 2010, the exposure to movements in interest rates was not hedged with derivative instruments. Refer to Note 17. Fair Value of Financial Instruments, Derivatives and Hedging Activities for additional information.
Extended disability benefits—Costs associated with extended disability benefits provided to inactive employees are accrued throughout the duration of their active employment. Workforce demographic data and historical experience are utilized to develop projections of time frames and related expense for postemployment benefits. Pursuant to the Amended MRA (as defined in Note 3. Elements of Predecessor Transformation Plan), GM reimbursed the Predecessor for extended disability benefits paid by the Predecessor from January 1 to October 6, 2009 in relation to all current and former UAW-represented hourly active, inactive, and retired employees. Refer to Note 3. Elements of Predecessor Transformation Plan for more information.
98
Table of Contents
Workers’ compensation benefits—Workers’ compensation benefit accruals are actuarially determined and are subject to the existing workers’ compensation laws that vary by location. Accruals for workers’ compensation benefits represent the discounted future cash expenditures expected during the period between the incidents necessitating the employees to be idled and the time when such employees return to work, are eligible for retirement or otherwise terminate their employment. Delphi assumed only workers’ compensation liabilities associated with claims incurred after the Petition Date for the employees it hired. The remaining workers’ compensation liabilities of the Predecessor were discharged as part of the bankruptcy process, assumed by GM as part of its acquisition of substantially all of the Predecessor’s global steering business and the manufacturing facilities in the U.S. at which the employees were represented by the UAW, or remained liabilities of DPHH. Pursuant to the Amended MRA (as defined in Note 3. Elements of Predecessor Transformation Plan), GM reimbursed the Predecessor for workers compensation benefits paid by the Predecessor from January 1, 2009 through October 6, 2009 in relation to all current and former UAW-represented hourly active, inactive, and retired employees. Refer to Note 3. Elements of Predecessor Transformation Plan for more information.
Discontinued operations—In accordance with FASB ASC 360-10, Property, Plant, and Equipment, the general accounting principles applicable to the impairment or disposal of long-lived assets, a business component that is disposed of or classified as held for sale is reported as discontinued operations if the cash flows of the component have been or will be eliminated from the ongoing operations of an entity and that entity will no longer have any significant continuing involvement in the business component. The results of discontinued operations are aggregated and presented separately in the consolidated statements of operations and consolidated statements of cash flows. Assets and liabilities of the discontinued operations are aggregated and reported separately as assets and liabilities held for sale in the consolidated balance sheet. Amounts presented for prior years are required to be reclassified to effect their classification as discontinued operations.
For periods from January 1 to October 6, 2009 and prior, amounts have been derived from the consolidated financial statements and accounting records of the Predecessor using the historical basis of assets and liabilities held for sale and historical results of operations related to the Predecessor’s global steering and halfshaft businesses (the “Steering Business”) and the Automotive Holdings Group (“AHG”), which includes various non-core product lines and plant sites that did not fit the Predecessor’s strategic framework. At the Acquisition Date, substantially all of the Steering Business was acquired from the Predecessor by GM. While the historical results of operations of the Steering Business and AHG include general corporate allocations of certain functions historically provided by the Predecessor, such as accounting, treasury, tax, human resources, facility maintenance, and other services, no amounts for these general corporate retained functions have been allocated to discontinued operations in the statements of operations. Expenses related to the service cost of employee pension and other postretirement benefit plans were allocated to discontinued operations in the statements of operations. Allocations have been made based upon a reasonable allocation method. Refer to Note 20. Discontinued Operations for more information.
Contractual interest expense and interest expense on unsecured claims—Contractual interest expense represents amounts due under the contractual terms of outstanding debt, including debt subject to compromise for which interest expense is not recognized in accordance with the provisions of FASB ASC 852, Reorganizations. Contractual interest expense was $494 million for the period from January 1 to October 6, 2009. In September 2007, the Predecessor began recording prior contractual interest expense related to certain prepetition debt because it became probable that the interest would become an allowed claim based on the provisions of the plan of reorganization filed with the Court in September 2007 and confirmed, as amended, on January 25, 2008. The plan of reorganization confirmed on January 25, 2008 also provided that certain holders of allowed unsecured claims against the Predecessor would be paid postpetition interest on their claims, calculated at the contractual non-default rate from the Petition Date through January 25, 2008, when the Predecessor ceased accruing interest on these claims. At December 31, 2008, the Predecessor had accrued interest of $415 million related to prepetition claims. As discussed in Note 3. Elements of Predecessor Transformation Plan, on July 30, 2009, the Court confirmed the Modified Plan, eliminating postpetition interest on prepetition debt and allowed unsecured claims. Therefore, the reversal of the $415 million of accrued interest was included as a reduction of interest expense in the consolidated statement of operations of the Predecessor for the period from January 1 to October 6, 2009.
99
Table of Contents
Recently issued accounting pronouncements—In June 2009, the Financial Accounting Standards Board (“FASB”) issued guidance related to accounting for transfers of financial assets which changes the way entities account for securitizations and special-purpose entities, codified in FASB ASC 810, Consolidation, and FASB ASC 860, Transfers and Servicing. The adoption of this guidance on January 1, 2010 did not have a significant impact on Delphi’s financial statements.
In October 2009, the FASB issued Accounting Standards Update (“ASU”) 2009-13, Revenue Recognition—Multiple-Deliverable Revenue Arrangements—a consensus of the FASB Emerging Issues Task Force, which amends FASB ASC 605, Revenue Recognition, by modifying the criteria used to separate elements in a multiple-element arrangement, introducing the concept of “best estimate of selling price” for determining the selling price of a deliverable, establishing a hierarchy of evidence for determining the selling price of a deliverable, requiring use of the relative selling price method and prohibiting use of the residual method to allocate arrangement consideration among units of accounting, and expanding the disclosure requirements for all multiple-element arrangements within the scope of FASB ASC 605-25. The amended guidance is effective prospectively for revenue arrangements entered into or materially modified in fiscal years beginning on or after June 15, 2010. The adoption of this guidance on January 1, 2011 did not have a significant impact on Delphi’s financial statements.
In April 2010, the FASB ratified Emerging Issues Task Force Issue No. 08-9, Milestone Method of Revenue Recognition (“Issue 08-9”). ASU 2010-17, Revenue Recognition—Milestone Method, which resulted from the ratification of Issue 08-9 and amends FASB ASC 605. ASU 2010-17 allows, but does not require, an entity to make an accounting policy election to recognize a payment that is contingent upon the achievement of a substantive milestone in its entirety in the period in which the milestone is achieved. The guidance in ASU 2010-17 is effective for fiscal years, and interim periods within those years, beginning on or after June 15, 2010. The adoption of this guidance on January 1, 2011 did not have a significant impact on Delphi’s financial statements.
In August 2010, the FASB issued ASU 2010-20, Receivables—Disclosures about the Credit Quality of Financing Receivables and the Allowance for Credit Losses. This guidance amends required disclosures about an entity’s allowance for credit losses and the credit quality of its financing receivables. The update will require entities to provide a greater level of disaggregated information about the credit quality of its financing receivables and its allowance for credit losses. The guidance is effective for public companies for interim and annual reporting periods ending on or after December 15, 2010 and for non-public companies, for annual reporting periods ending on or after December 15, 2011. In January 2011, the FASB issued ASU 2011-01 Receivables—Deferral of the Effective Date of Disclosures about troubled debt restructurings in ASU 2010-20. This guidance temporarily delays the effective date of the disclosures about troubled debt restructurings for public entities. This deferral was reversed by the issuance of ASU 2011-02 (see description in the following paragraph) and the effective date is interim and annual periods beginning after June 15, 2011. The adoption of this guidance on January 1, 2011 did not have a significant impact on Delphi’s financial statements.
In April 2011, the FASB issued ASU 2011-02, A Creditor’s Determination of Whether a Restructuring is a Troubled Debt Restructuring. This guidance clarifies the definition of what constitutes a concession given by a creditor and clarifies guidance on whether a debtor is experiencing financial difficulties both for purposes of recording an impairment loss and for disclosure of troubled debt restructuring. The guidance in ASU 2011-02 is effective with interim and annual periods beginning after June 15, 2011. The adoption of this guidance did not have a significant impact on Delphi’s financial statements.
In May 2011, the FASB issued ASU 2011-04, Amendments to Achieve Common Fair Value Measurement and Disclosure Requirements in US GAAP and IFRSs, which updates the definition of fair value and measurement criteria to bring them into agreement with IFRSs (which are also changed to agree with US GAAP). The guidance is effective for interim and annual periods beginning after December 15, 2011. Early adoption is not permitted. Delphi is evaluating the effects of this guidance but does not expect it to have a significant impact on Delphi’s financial statements other than providing the required disclosures.
100
Table of Contents
In June 2011, the FASB issued ASU 2011-05, Presentation of Comprehensive Income. This guidance requires presentation of all non-owner changes in equity to be presented in one continuous statement of comprehensive income or in two separate but consecutive statements. It also prohibits the inclusion of comprehensive income items in the statement of equity. Also, the amendments in this update do not change the items that must be reported in other comprehensive income or when an item of other comprehensive income must be reclassified to net income. The guidance is effective for fiscal years, and interim periods within those years, beginning after December 15, 2011. Early adoption is permitted and Delphi elected to adopt this ASU in 2011. The adoption of this ASU did not have a significant impact on Delphi’s financial statements other than providing the new presentation.
ASU 2011-05 was modified by the issuance of ASU 2011-12, Deferral of the Effective Date for Amendments to the Presentation of Reclassifications of Items out of Accumulated Other Comprehensive Income in Accounting Standards Update No. 2011-05 in December 2011. This update defers certain paragraphs of ASU 2011-05 that require reclassifications of items from other comprehensive income (OCI) to net income by component of net income and by component of OCI.
In September 2011, the FASB issued ASU 2011-08, Testing Goodwill for Impairment. The revised standard is intended to simplify goodwill impairment testing by adding an option to qualitatively assess goodwill for impairment. The guidance is effective for interim and annual periods beginning after December 15, 2011. Early adoption is permitted. Delphi adopted this guidance for its testing of goodwill for impairment effective October 1, 2011 and it did not have a significant impact on Delphi’s financial statements.
In December 2011, the FASB issued ASU 2011-10, Derecognition of In-substance Real Estate—a Scope Clarification. This guidance requires that if an entity ceases to have a controlling interest in a subsidiary that is in substance real estate due to a default on the loan (mortgage) on that real estate, it would continue to recognize the asset and related debt until the real estate is legally transferred to satisfy the debt. The guidance is effective for fiscal years beginning after June 15, 2012, and early adoption is permitted. Delphi is evaluating the effects of this guidance but does not expect it to have a significant impact on its financial statements.
Also in December 2011, the FASB issued ASU 2011-11, Disclosures about Offsetting Assets and Liabilities. This guidance requires entities to disclose both gross and net information about both instruments and transactions eligible for offset in the statement of financial position and instruments and transactions subject to an agreement similar to a master netting arrangement. The guidance is effective for annual periods beginning on or after January 1, 2013. Early adoption is not permitted, but this guidance shall be applied retrospectively for any period presented that begins before the date of initial application. Delphi is evaluating the effects of this guidance but does not expect it to have a significant impact on its financial statements.
| 3. | ELEMENTS OF PREDECESSOR TRANSFORMATION PLAN |
GM—The Predecessor and Old GM entered into comprehensive settlement agreements consisting of the Global Settlement Agreement dated September 6, 2007 (as amended through December 7, 2007, (the “Original GSA”)), and the Master Restructuring Agreement dated September 6, 2007 (as amended through December 7, 2007 (the “Original MRA”)). The Original GSA and the Original MRA were approved in the order confirming the Predecessor’s initial plan of reorganization on January 25, 2008. The Original GSA and the Original MRA provided that they would not be effective until and unless the Predecessor emerged from chapter 11. However, as part of the Predecessor’s overall negotiations with its stakeholders to further amend the initial plan of reorganization and emerge from chapter 11 as soon as practicable, on September 12, 2008, the Predecessors and Old GM entered into an Amended and Restated Global Settlement Agreement (the “Amended GSA”) and an Amended and Restated Master Restructuring Agreement (the “Amended MRA”). The Court approved such amendments on September 26, 2008 and the Amended GSA and Amended MRA became effective on September 29, 2008. These amended agreements included provisions related to the transfer of certain legacy pension and other postretirement benefit obligations and became effective independent of and in advance of
101
Table of Contents
substantial consummation of an amended plan of reorganization, although provisions relating to the acceleration of payment terms were not immediately effective. The effectiveness of these agreements resulted in a material reduction in the Predecessor’s liabilities and future expenses related to U.S. hourly workforce benefit programs. Upon the Acquisition Date, the Amended MRA was terminated (except that Old GM agreed to remain responsible for certain of its obligations thereunder) and the MDA and certain ancillary agreements govern certain aspects of the relationship among GM and Delphi, as purchaser of the major portion of the Predecessor’s businesses.
Global settlement agreement—The Original GSA and the Amended GSA resolved outstanding issues between the Predecessor and Old GM, including: litigation commenced in March 2006 by the Predecessor to terminate certain supply agreements with Old GM; all potential claims and disputes with Old GM arising out of the separation of the Predecessor from Old GM in 1999, including certain post-separation claims and disputes; the proofs of claim filed by Old GM against the Predecessor in the Predecessor’s chapter 11 cases; Old GM’s treatment under the Predecessor’s original plan of reorganization; and various other legacy U.S. hourly workforce benefit issues including commitments by the Predecessor and Old GM regarding other U.S. OPEB, pension obligations, and other Old GM contributions with respect to labor matters and releases.
GM general unsecured claim—With respect to Old GM’s claims in the Predecessor’s chapter 11 cases, Old GM under the Amended GSA had agreed to a general unsecured claim of $2.5 billion, primarily for OPEB and special attrition programs for the U.S. hourly workforce. However, under the Modified Plan and the MDA, Old GM and GM agreed to waive the general unsecured claim in the Predecessor’s chapter 11 cases. GM and certain related parties and the Predecessor and certain related parties have also exchanged broad, global releases, effective as of the effective date of the Amended GSA (which releases do not apply to certain surviving claims as set forth in the Amended GSA). In addition to providing a release to GM, the Predecessor agreed to withdraw with prejudice the sealed complaint filed against GM in the Court on October 5, 2007. In addition, the Modified Plan contains additional mutual releases between Old GM, GM and the Predecessor.
Master restructuring agreement—The Amended MRA was intended to, among other things, govern certain aspects of the commercial relationship between the Predecessor and Old GM following the effectiveness of the Amended MRA and continuing after the Predecessor’s emergence from chapter 11. The Amended MRA addressed the scope of Old GM’s existing and future business awards to the Predecessor and related pricing and sourcing arrangements, Old GM’s commitments with respect to reimbursement of specified ongoing U.S. hourly workforce labor costs, the disposition of certain of the Predecessor’s facilities, and the treatment of existing commercial agreements between the Predecessor and Old GM. The MDA superseded the Amended MRA, and the Amended MRA was terminated as of the Acquisition Date (except as set forth in the MDA).
Existing and future business awards and related matters—The Amended MRA (i) addressed the scope of existing business awards, related pricing agreements, and extensions of certain existing supply agreements, including Old GM’s ability to move production to alternative suppliers, and the reorganized Predecessor’s rights to bid and qualify for new business awards; (ii) eliminated the requirement to implement price-downs with respect to certain businesses and restricted Old GM’s ability to resource products manufactured at core U.S. operations through at least December 31, 2011 and Mexican operations through December 31, 2010; (iii) contained a commitment by Old GM to provide the Predecessor with an annual keep site facilitation fee of $110 million in 2009 and 2010 which was not contingent on the Predecessor’s emergence from chapter 11, payable in quarterly installments during these periods, which, consistent with the Predecessor’s policy, was recognized in earnings over the applicable, future production periods; and (iv) contained commitments by Old GM concerning the sale of certain of the Predecessor’s non-core businesses and additional commitments by Old GM if certain of the Predecessor’s businesses and facilities were not sold or wound down by specified future dates. On March 31, 2009, June 30, 2009 and September 30, 2009, the Predecessor received quarterly installments of the annual keep site facilitation fee of $27.5 million, of which approximately $75 million was recorded as net sales during the Predecessor period from January 1 to October 6, 2009.
102
Table of Contents
Reimbursement of hourly labor costs—Old GM agreed to reimburse the Predecessor for hourly workforce labor costs in excess of $26 per hour, excluding certain costs, including hourly pension and OPEB contributions provided under the supplemental wage agreement, at specified UAW manufacturing facilities retained by the Predecessor. The economic substance of this provision of the Amended MRA was to lower the Predecessor’s labor costs at specified UAW-represented manufacturing facilities to $26 per hour, excluding certain costs, in order to maintain more competitive operations in the U.S. During the period from January 1 to October 6, 2009, the Predecessor received $106 million of reimbursement from GM of hourly labor costs in excess of $26 per hour. The Predecessor recorded $50 million as a reduction to operating expenses during the period from January 1 to October 6, 2009, with $25 million recognized in periods prior to January 1, 2009. Additionally, $31 million was recognized in 2009 as a reduction to operating expenses in discontinued operations.
Production cash burn breakeven reimbursement—The Predecessor had agreed to continue manufacturing at certain non-core sites to meet Old GM’s production requirements and Old GM had agreed to provide the Predecessor with operating cash flow breakeven support, or production cash burn breakeven (“PCBB”), from January 1, 2008 through site-specified time periods to compensate the Predecessor for keeping these sites in production. Additionally, Old GM had agreed to reimburse capital spending in excess of $50,000 per month at the PCBB sites from January 1, 2008 through site-specified time periods. PCBB reimbursement, including capital spending, from Old GM was recognized contemporaneously as incurred, and was treated as a reduction to operating expenses, fixed assets or discontinued operations, as appropriate. During the period from January 1 to October 6, 2009, the Predecessor received $150 million of PCBB reimbursement from GM, of which $86 million was recorded as income from discontinued operations and $2 million was recorded as a reduction to the Predecessor’s operating expenses.
Reimbursement of hourly workers’ compensation and other benefits—Old GM agreed to reimburse the Predecessor for all current and future workers compensation, disability, supplemental unemployment benefits, and severance obligations paid by the Predecessor after January 1, 2009 in relation to all current and former UAW-represented hourly active, inactive, and retired employees. Consistent with the substance of the provision, the Predecessor recognized anticipated, future reimbursements from Old GM contemporaneously with the Predecessor’s incurrence of related cash payments. During the period from January 1 to October 6, 2009, the Predecessor received related reimbursements from GM of $28 million. The Predecessor recorded $35 million as a reduction to operating expenses during the period from January 1 to October 6, 2009.
Pensions—Subsequent to entering chapter 11, the Predecessor had generally limited its contributions to the GM Hourly-Rate Employees Pension Plan (the “Hourly Plan”), the Delphi Retirement Program for Salaried Employees (the “Salaried Plan”), the ASEC Manufacturing Retirement Program, the Delphi Mechatronics Retirement Program, the PHI Bargaining Retirement Plan and the PHI Non-Bargaining Retirement Plan (collectively, the “U.S. Pension Plans”) to “normal cost” contributions, which are less than the minimum funding requirements established by the Internal Revenue Code and the Employee Retirement Income Security Act (“ERISA”). Following the Court’s approval of the Hourly and Salaried Pension Program Modification Motion on September 23, 2008, the Salaried Plan, the Mechatronic Plan, the ASEC Plan, and the PHI Non-Bargaining Plan were frozen effective September 30, 2008. The Hourly Plan was frozen on November 30, 2008. By freezing the U.S. pension plans, the Predecessor halted the accrual of normal cost payments going forward, thereby preserving liquidity.
On July 21, 2009, the Predecessor announced that the PBGC was expected to make a determination whether to initiate the termination process for the U.S. pension plans. Also on July 21, 2009, the Predecessor reached agreement with the PBGC to settle the PBGC’s various claims against the Predecessor and its global affiliates (the “Predecessor-PBGC Settlement Agreement”). Pursuant to that settlement agreement, the PBGC received a $3 billion allowed general unsecured non-priority claim which received the same treatment given to holders of general unsecured claims as set forth in the Modified Plan. The PBGC received additional consideration from GM which, together with the PBGC’s allowed unsecured claim, was in consideration for, among other things, a full release of all causes of action, claims, and liens; the liability to be assumed by the PBGC related to the
103
Table of Contents
possible termination of the U.S. pension plans; and the withdrawal of all notices of liens filed by the PBGC against the Predecessor’s global non-U.S. affiliates. The Predecessor-PBGC Settlement Agreement, which was subject to Court approval, was filed with the Court on July 21, 2009. In connection with seeking Court approval of the Predecessor-PBGC Settlement Agreement, the Predecessor sought a finding by the Court that such termination did not violate the Labor MOUs, the Union 1113/1114 Settlement Approval Orders, or the Local Agreement Between Delphi Connection Systems (formerly Packard-Hughes Interconnect) And Electronic And Space Technicians Local 1553, and any modifications thereto. On July 30, 2009, the Court approved the Predecessor-PBGC Settlement Agreement and made the finding that such agreement did not violate the Predecessor’s collective bargaining agreements. On August 10, 2009, the PBGC and the Predecessor executed a termination and trusteeship agreement, retroactive to July 31, 2009, with respect to the U.S. pension plans.
Portfolio—In March 2006, the Predecessor identified non-core product lines and manufacturing sites that did not fit into its future, strategic framework, including brake and chassis systems, catalysts, cockpits and instrument panels, door modules and latches, ride dynamics, steering, halfshafts, wheel bearings and power products. With the exception of the catalyst and global exhaust product lines, included in the Powertrain Systems segment, the Company’s non-core product lines were included in discontinued operations, refer to Note 20. Discontinued Operations.
Costs recorded by the Predecessor related to the transformation plan for non-core product lines include employee termination benefits and other exit costs and U.S. employee workforce transition program charges and are further described in Note 11. Restructuring and Note 20. Discontinued Operations.
Cost structure—The Predecessor implemented restructuring initiatives in pursuit of its transformation objective to reduce selling, general and administrative expenses. These initiatives included changing the model for delivery of financial services, information technology and certain sales administration activities; as well as the reduction of the global salaried workforce by leveraging attrition and using salaried separation plans, and the realignment of certain salaried benefit programs with business conditions. While the continually challenging economic environment persisted in 2009, further restructuring initiatives continued to be required. The Predecessor implemented a number of cash conservation measures, including a short-term salaried layoff plan, the suspension of 2009 pay increases and annual incentive payments for eligible employees, the cessation of health care and life insurance benefits in retirement to salaried employees and retirees effective March 31, 2009 and a decrease in salaried severance payments in 2009. The PBGC’s termination of the U.S. Pension Plans effective July 31, 2009 (refer to Note 13. Pension Benefits) also had the effect of reducing the Predecessor’s cash needs.
| 4. | INVENTORIES |
Inventories are stated at the lower of cost, determined on a first-in, first-out basis, or market, including direct material costs and direct and indirect manufacturing costs. A summary of inventories is shown below:
| December 31, 2011 |
December 31, 2010 |
|||||||
| (in millions) | ||||||||
| Productive material |
$ | 594 | $ | 544 | ||||
| Work-in-process |
144 | 159 | ||||||
| Finished goods |
316 | 285 | ||||||
|
|
|
|
|
|||||
| Total |
$ | 1,054 | $ | 988 | ||||
|
|
|
|
|
|||||
104
Table of Contents
| 5. | ASSETS |
Other current assets consisted of the following:
| December 31, 2011 |
December 31, 2010 |
|||||||
| (in millions) | ||||||||
| Value added tax receivable |
$ | 226 | $ | 180 | ||||
| Deferred income taxes (Note 15) |
183 | 136 | ||||||
| Prepaid insurance and other expenses |
93 | 87 | ||||||
| Notes receivable |
24 | 33 | ||||||
| Debt issuance costs |
17 | — | ||||||
| Income and other taxes receivable |
36 | 28 | ||||||
| Deposits to vendors |
12 | 12 | ||||||
| Derivative financial instruments (Note 17) |
4 | 59 | ||||||
| Other |
21 | 20 | ||||||
|
|
|
|
|
|||||
| Total |
$ | 616 | $ | 555 | ||||
|
|
|
|
|
|||||
Other long-term assets consisted of the following:
| December 31, 2011 |
December 31, 2010 |
|||||||
| (in millions) | ||||||||
| Deferred income taxes (Note 15) |
$ | 204 | $ | 183 | ||||
| Debt issuance costs |
71 | — | ||||||
| Income and other taxes receivable |
58 | 43 | ||||||
| Reimbursable engineering costs |
41 | 4 | ||||||
| Value added taxes receivable |
35 | 44 | ||||||
| Other investments |
3 | 13 | ||||||
| Notes receivable |
1 | 31 | ||||||
| Derivative financial instruments (Note 17) |
— | 17 | ||||||
| Other |
46 | 68 | ||||||
|
|
|
|
|
|||||
| Total |
$ | 459 | $ | 403 | ||||
|
|
|
|
|
|||||
| 6. | INVESTMENTS IN AFFILIATES |
As part of Delphi’s operations, it has investments in 9 non-consolidated affiliates accounted for under the equity method of accounting. These affiliates are not publicly traded companies and are located primarily in South Korea, China and Mexico. Delphi’s ownership percentages vary generally from approximately 20% to 50%, with the most significant investments in Korea Delphi Automotive Systems Corporation (of which Delphi owns approximately 50%), Delphi-TVS Diesel Systems Ltd (of which Delphi owns approximately 50%), and Promotora de Partes Electricas Automotrices, S.A. de C.V. (of which Delphi owns approximately 40%). The aggregate investment in non-consolidated affiliates was $257 million and $281 million at December 31, 2011 and 2010, respectively. Dividends of $1 million, $10 million, $0 million and $8 million for the years ended December 31, 2011 and 2010, and the periods from August 19 to December 31, 2009 and January 1 to October 6, 2009, respectively, have been received from non-consolidated affiliates. A $7 million impairment charge was recorded for the year ended December 31, 2011 related to Delphi’s investment in a non-consolidated affiliate. No impairment charges were recorded for the year-ended December 31, 2010 or for the period from August 19 to December 31, 2009. A $23 million impairment charges was recorded for the period from January 1 to October 6, 2009 related to Delphi’s investment in a non-consolidated affiliate.
105
Table of Contents
The following is a summary of the combined financial information of significant affiliates accounted for under the equity method as of December 31, 2011 and 2010 and for the years ended December 31, 2011 and 2010, and the periods from August 19 to December 31, 2009 and January 1 to October 6, 2009 (unaudited):
| December 31, | ||||||||
| 2011 | 2010 | |||||||
| (in millions) | ||||||||
| Current assets |
$ | 740 | $ | 888 | ||||
| Non-current assets |
405 | 545 | ||||||
|
|
|
|
|
|||||
| Total assets |
$ | 1,145 | $ | 1,433 | ||||
|
|
|
|
|
|||||
| Current liabilities |
$ | 366 | $ | 587 | ||||
| Non-current liabilities |
203 | 227 | ||||||
| Shareholders’ equity |
576 | 619 | ||||||
|
|
|
|
|
|||||
| Total liabilities and shareholders’ equity |
$ | 1,145 | $ | 1,433 | ||||
|
|
|
|
|
|||||
| Successor | Predecessor | |||||||||||||||
| Year ended December 31, 2011 |
Year ended December 31, 2010 |
Period from August 19 to December 31, 2009 |
Period from January 1 to October 6, 2009 |
|||||||||||||
| (in millions) | (in millions) | |||||||||||||||
| Net sales |
$ | 1,750 | $ | 1,750 | $ | 369 | $ | 866 | ||||||||
| Gross profit |
$ | 160 | $ | 215 | $ | 53 | $ | 56 | ||||||||
| Net income (loss) |
$ | 28 | $ | 41 | $ | 5 | $ | (44 | ) | |||||||
A summary of transactions with affiliates is shown below:
| Successor | Predecessor | |||||||||||||||
| Year ended December 31, 2011 |
Year ended December 31, 2010 |
Period from August 19 to December 31, 2009 |
Period from January 1 to October 6, 2009 |
|||||||||||||
| (in millions) | (in millions) | |||||||||||||||
| Sales to affiliates |
$ | 66 | $ | 62 | $ | 7 | $ | 8 | ||||||||
| Purchases from affiliates |
$ | 304 | $ | 315 | $ | 51 | $ | 90 | ||||||||
| 7. | PROPERTY, NET |
Property, net consisted of:
| Estimated Useful Lives |
December 31, | |||||||||
| 2011 | 2010 | |||||||||
| (Years) | (in millions) | |||||||||
| Land |
— | $ | 160 | $ | 163 | |||||
| Land and leasehold improvements |
3-20 | 85 | 79 | |||||||
| Buildings |
40 | 504 | 492 | |||||||
| Machinery, equipment, and tooling |
3-20 | 1,989 | 1,470 | |||||||
| Furniture and office equipment |
3-10 | 149 | 104 | |||||||
| Construction in progress |
— | 235 | 246 | |||||||
|
|
|
|
|
|||||||
| Total |
3,122 | 2,554 | ||||||||
| Less: accumulated depreciation |
(807) | (487) | ||||||||
|
|
|
|
|
|||||||
| Total property, net |
$ | 2,315 | $ | 2,067 | ||||||
|
|
|
|
|
|||||||
106
Table of Contents
For the years ended December 31, 2011 and 2010, Delphi did not incur impairment charges related to long-lived assets held for use. The following table summarizes the impairment charges included in cost of sales related to long-lived assets held for use for the periods from August 19 to December 31, 2009 and January 1 to October 6, 2009:
| Successor | Predecessor | |||||||
| Segment |
Period from August 19 to December 31, 2009 |
Period from January 1 to October 6, 2009 |
||||||
| (in millions) | (in millions) | |||||||
| Electronics and Safety |
$ | — | $ | 37 | ||||
| Powertrain Systems |
12 | — | ||||||
| Electrical/Electronic Architecture |
— | 1 | ||||||
| Thermal Systems |
5 | 2 | ||||||
| Eliminations and Other |
— | 1 | ||||||
|
|
|
|
|
|||||
| Continuing operations |
17 | 41 | ||||||
| Discontinued operations |
— | — | ||||||
|
|
|
|
|
|||||
| Total |
$ | 17 | $ | 41 | ||||
|
|
|
|
|
|||||
During the period from January 1 to October 6, 2009, the Predecessor’s Electronics and Safety segment recorded $37 million of long-lived asset impairment charges related to the exit of its occupant protection systems business in North America and Europe.
| 8. | INTANGIBLE ASSETS AND GOODWILL |
As further described in Note 1. General, Delphi acquired the following intangible assets in conjunction with the Acquisition.
| As of December 31, 2011 | As of December 31, 2010 | |||||||||||||||||||||||
| Gross Carrying Amount |
Accumulated Amortization |
Net Carrying Amount |
Gross Carrying Amount |
Accumulated Amortization |
Net Carrying Amount |
|||||||||||||||||||
| (in millions) | (in millions) | |||||||||||||||||||||||
| Amortized intangible assets: |
||||||||||||||||||||||||
| Patents and developed technology |
$ | 487 | $ | 94 | $ | 393 | $ | 455 | $ | 48 | $ | 407 | ||||||||||||
| Customer relationships |
140 | 57 | 83 | 137 | 32 | 105 | ||||||||||||||||||
| Trade names |
96 | 11 | 85 | 95 | 6 | 89 | ||||||||||||||||||
|
|
|
|
|
|
|
|
|
|
|
|
|
|||||||||||||
| Total |
723 | 162 | 561 | 687 | 86 | 601 | ||||||||||||||||||
| Unamortized intangible assets: |
||||||||||||||||||||||||
| In-process research & development |
27 | — | 27 | 64 | — | 64 | ||||||||||||||||||
| Goodwill |
8 | — | 8 | — | — | — | ||||||||||||||||||
|
|
|
|
|
|
|
|
|
|
|
|
|
|||||||||||||
| Total |
$ | 758 | $ | 162 | $ | 596 | $ | 751 | $ | 86 | $ | 665 | ||||||||||||
|
|
|
|
|
|
|
|
|
|
|
|
|
|||||||||||||
The estimated useful lives of the Company’s amortized intangible assets range from 6 to 20 years. Amortization expense is estimated to be $80 million for the year ending December 31, 2012, $80 million for the year ending December 31, 2013, $70 million for the year ending December 31, 2014, $60 million for the year ending December 31, 2015 and $50 million for the year ending December 31, 2016.
107
Table of Contents
A roll-forward of the gross carrying amounts for the years ended December 31, 2011 and 2010 is presented below:
| 2011 | 2010 | |||||||
| (in millions) | ||||||||
| Balance at January 1 |
$ | 751 | $ | 766 | ||||
| Acquisitions |
17 | — | ||||||
| Foreign currency translation and other |
(10 | ) | (15 | ) | ||||
|
|
|
|
|
|||||
| Balance at December 31 |
$ | 758 | $ | 751 | ||||
|
|
|
|
|
|||||
A roll-forward of the accumulated amortization for the years ended December 31, 2011 and 2010 is presented below:
| 2011 | 2010 | |||||||
| (in millions) | ||||||||
| Balance at January 1 |
$ | 86 | $ | 16 | ||||
| Amortization |
79 | 70 | ||||||
| Foreign currency translation and other |
(3 | ) | — | |||||
|
|
|
|
|
|||||
| Balance at December 31 |
$ | 162 | $ | 86 | ||||
|
|
|
|
|
|||||
| 9. | LIABILITIES |
Accrued liabilities consisted of the following:
| December 31, | ||||||||
| 2011 | 2010 | |||||||
| (in millions) | ||||||||
| Payroll-related obligations |
$ | 214 | $ | 203 | ||||
| Employee benefits, including current pension obligations |
145 | 167 | ||||||
| Income and other taxes payable |
257 | 220 | ||||||
| Warranty obligations (Note 10) |
182 | 243 | ||||||
| Restructuring (Note 11) |
55 | 115 | ||||||
| Customer deposits |
20 | 22 | ||||||
| Deferred income taxes (Note 15) |
28 | 4 | ||||||
| Derivative financial instruments (Note 17) |
43 | — | ||||||
| Accrued interest |
10 | 1 | ||||||
| Other |
254 | 290 | ||||||
|
|
|
|
|
|||||
| Total |
$ | 1,208 | $ | 1,265 | ||||
|
|
|
|
|
|||||
108
Table of Contents
Other long-term liabilities consisted of the following:
| December 31, | ||||||||
| 2011 | 2010 | |||||||
| (in millions) | ||||||||
| Environmental (Note 14) |
$ | 17 | $ | 18 | ||||
| Executive long-term incentive plan |
107 | 31 | ||||||
| Extended disability benefits |
10 | 8 | ||||||
| Warranty obligations (Note 10) |
133 | 119 | ||||||
| Restructuring (Note 11) |
41 | 54 | ||||||
| Payroll-related obligations |
10 | 11 | ||||||
| Accrued income taxes |
46 | 52 | ||||||
| Deferred income taxes (Note 15) |
134 | 178 | ||||||
| Derivative financial instruments (Note 17) |
26 | — | ||||||
| Other |
51 | 45 | ||||||
|
|
|
|
|
|||||
| Total |
$ | 575 | $ | 516 | ||||
|
|
|
|
|
|||||
| 10. | WARRANTY OBLIGATIONS |
Expected warranty costs for products sold are recognized principally at the time of sale of the product based on estimates of the amount that will eventually be required to settle such obligations. These accruals are based on factors such as past experience, production changes, industry developments and various other considerations. These estimates are adjusted from time to time based on facts and circumstances that impact the status of existing claims. Delphi has recognized its best estimate for its total aggregate warranty reserves across all of its operating segments as of December 31, 2011. The estimated reasonably possible amounts to ultimately resolve all matters are not materially different from the recorded reserves as of December 31, 2011.
The table below summarizes the activity in the product warranty liability for the years ended December 31, 2011 and 2010:
| Year Ended December 31, 2011 |
Year Ended December 31, 2010 |
|||||||
| (in millions) | ||||||||
| Accrual balance at beginning of period |
$ | 362 | $ | 332 | ||||
| Provision for estimated warranties incurred during the period |
68 | 62 | ||||||
| Provision for changes in estimate for preexisting warranties |
84 | 80 | ||||||
| Settlements made during the period (in cash or in kind) |
(205) | (99) | ||||||
| Foreign currency translation and other |
6 | (13) | ||||||
|
|
|
|
|
|||||
| Accrual balance at end of period |
$ | 315 | $ | 362 | ||||
|
|
|
|
|
|||||
In 2009, Delphi received information regarding potential warranty claims related to certain components supplied by Delphi’s Powertrain segment. In 2010, Delphi recorded a change in the previous estimate of probable loss related to this matter by recognizing warranty expense in cost of sales of $75 million. This adjustment resulted in a corresponding $75 million decrease in net income attributable to Delphi and a corresponding unfavorable earnings per share impact of $0.11. In March 2011, Delphi reached a settlement with its customer related to this matter and reflected a change in its previous estimate of probable loss as a result of the settlement agreement by recognizing $76 million of warranty expense in cost of sales. This adjustment resulted in a corresponding $76 million decrease in net income attributable to Delphi and a corresponding unfavorable earnings per share impact of $0.18. In April 2011, in accordance with the terms of the settlement agreement, Delphi made a payment of €90 million (approximately $133 million at April 30, 2011 exchange rates) related to this matter. On April 30, 2012, Delphi is required to make a €60 million (approximately $78 million at December 31, 2011 exchange rates) payment related to this matter.
109
Table of Contents
| 11. | RESTRUCTURING |
Delphi continually evaluates alternatives to align its business with the changing needs of its customers and to lower the operating costs of the Company. This includes the realignment of its existing manufacturing capacity, facility closures, or similar actions in the normal course of business. These actions may result in voluntary or involuntary employee termination benefits, which are mainly pursuant to union or other contractual agreements. Voluntary termination benefits are accrued when an employee accepts the related offer. Involuntary termination benefits are accrued when Delphi commits to a termination plan and the benefit arrangement is communicated to affected employees, or when liabilities are determined to be probable and estimable, depending on the existence of a substantive plan for severance or termination. Contract termination costs are recorded when contracts are terminated or when Delphi ceases to use the leased facility and no longer derives economic benefit from the contract. All other exit costs are accrued when incurred.
Delphi’s restructuring costs are undertaken as necessary to implement management’s strategy, streamline operations, take advantage of available capacity and resources, and ultimately achieve net cost reductions. These activities generally relate to the realignment of existing manufacturing capacity and closure of facilities and other exit or disposal activities, as it relates to executing the Company’s strategy in the normal course of business and transforming the salaried workforce to reduce general and administrative expenses.
The following table summarizes the restructuring charges recorded for the years ended December 31, 2011 and 2010, and the periods from August 19 to December 31 and January 1 to October 6, 2009 by operating segment:
| Successor | Predecessor | |||||||||||||||
| Segment |
Year ended December 31, 2011 |
Year ended December 31, 2010 |
Period from August 19 to December 31, 2009 |
Period from January 1 to October 6, 2009 |
||||||||||||
| (in millions) | (in millions) | |||||||||||||||
| Electronics and Safety |
$ | 5 | $ | 29 | $ | 20 | $ | 91 | ||||||||
| Powertrain Systems |
12 | 49 | 50 | 45 | ||||||||||||
| Electrical/Electronic Architecture |
12 | 94 | 50 | 99 | ||||||||||||
| Thermal Systems |
2 | 52 | 5 | 11 | ||||||||||||
| Eliminations and Other |
— | — | 1 | (11) | ||||||||||||
|
|
|
|
|
|
|
|
|
|||||||||
| Continuing operations |
31 | 224 | 126 | 235 | ||||||||||||
| Discontinued operations |
— | — | — | 14 | ||||||||||||
|
|
|
|
|
|
|
|
|
|||||||||
| Total |
$ | 31 | $ | 224 | $ | 126 | $ | 249 | ||||||||
|
|
|
|
|
|
|
|
|
|||||||||
110
Table of Contents
The table below summarizes the activity in the restructuring liability for the years ended December 31, 2011 and 2010:
| Employee Termination Benefits Liability |
Other Exit Costs Liability |
Total | ||||||||||
| (in millions) | ||||||||||||
| Accrual balance at January 1, 2010 |
$ | 210 | $ | 19 | $ | 229 | ||||||
| Provision for estimated expenses incurred during the period |
194 | 31 | 225 | |||||||||
| Provision for changes in estimates for preexisting programs |
(1) | — | (1) | |||||||||
| Payments made during the period |
(260) | (31) | (291) | |||||||||
| Foreign currency and other |
5 | 2 | 7 | |||||||||
|
|
|
|
|
|
|
|||||||
| Accrual balance at December 31, 2010 |
$ | 148 | $ | 21 | $ | 169 | ||||||
|
|
|
|
|
|
|
|||||||
| Provision for estimated expenses incurred during the period |
25 | 6 | 31 | |||||||||
| Payments made during the period |
(89) | (16) | (105) | |||||||||
| Foreign currency and other |
2 | (1) | 1 | |||||||||
|
|
|
|
|
|
|
|||||||
| Accrual balance at December 31, 2011 |
$ | 86 | $ | 10 | $ | 96 | ||||||
|
|
|
|
|
|
|
|||||||
Delphi has initiated several programs to streamline operations and lower costs. The following are details of significant charges during 2011.
| • | Realignment of existing manufacturing capacity and closure of facilities. As part of Delphi’s ongoing efforts to lower costs and operate efficiently, the Company recorded $10 million of restructuring costs in North America and South America, primarily related to the Electrical/Electronic Architecture segment. The Company also recorded $10 million of restructuring costs in conjunction with workforce reduction and programs related to the rationalization of manufacturing and engineering processes, including plant closures in Europe, primarily related to the Powertrain segment. Additionally, $5 million of costs were incurred related to workforce reduction efforts resulting from prior divestitures. |
Delphi and the Predecessor have initiated several programs to streamline operations and lower costs. The following are details of significant charges during 2010.
| • | Realignment of existing manufacturing capacity and closure of facilities. As part of Delphi’s ongoing efforts to lower costs and operate efficiently, the Company recorded $28 million of restructuring costs in North America, primarily related to the Electrical/Electronic Architecture segment’s continued efforts to reduce the workforce. The four reporting segments recorded $174 million of restructuring costs in conjunction with workforce reduction and programs related to the rationalization of manufacturing and engineering processes, including plant closures, primarily in Europe. The Electronics and Safety segment also incurred $8 million of costs related to the ongoing sales and wind-down of its occupant protection systems businesses during the year ended December 31, 2010. |
The following are details of significant charges during 2009.
| • | Realignment of existing manufacturing capacity and closure of facilities. As part of Delphi and the Predecessor’s ongoing efforts to lower costs and operate efficiently, the Electronics and Safety, Powertrain Systems, Electrical/Electronic Architecture and Thermal Systems segments executed initiatives to realign manufacturing operations within North America to lower cost markets and to reduce the workforce in line with the realigned manufacturing operations, and incurred approximately $34 million and $69 million of restructuring costs during the periods from August 19 to December 31, 2009 and January 1 to October 6, 2009, respectively. Additionally, European, South American and Asian operations in the Electronics and Safety and Electrical/Electronic Architecture segments incurred $78 million and $99 million of restructuring costs in the periods from August 19 to December 31, 2009 |
111
Table of Contents
| and January 1 to October 6, 2009, respectively, in conjunction with workforce reductions and programs related to the rationalization of manufacturing and engineering processes. Additionally, the Electronics and Safety segment incurred $5 million and $7 million of costs related to upcoming sales and wind-down of its occupant protection systems business in North America and Europe during periods from August 19 to December 31, 2009 and January 1 to October 6, 2009, respectively. |
| • | Transformation plan activities. As part of an effort to transform its salaried workforce and reduce general and administrative expenses, Delphi and the Predecessor identified certain salaried employees in North America during periods from August 19 to December 31, 2009 and January 1 to October 6, 2009 for involuntary separation and incurred $5 million and $58 million, respectively, in related employee termination benefits included in continuing operations. Delphi also incurred $6 million of U.S. salaried separations recorded in discontinued operations for the period from January 1 to October 6, 2009. As a result of the Amended MRA, $53 million of U.S. employee termination benefits were reimbursed by GM during the period from January 1 to October 6, 2009, of which $44 million and $9 million related to U.S. hourly separations and U.S. salaried separations, respectively. |
| 12. | DEBT |
The following is a summary of debt outstanding, net of discounts of approximately $3 million related to the Tranche A Term Loan and the Tranche B Term Loan, as of December 31, 2011 and 2010:
| 2011 | 2010 | |||||||
| (in millions) | ||||||||
| Accounts receivable factoring |
$ | 54 | $ | 112 | ||||
| 5.875%, senior notes, due 2019 |
500 | — | ||||||
| 6.125%, senior notes, due 2021 |
500 | — | ||||||
| 12.00%, unsecured notes, initially due 2014 |
— | 47 | ||||||
| Tranche A Term Loan, due 2016 |
210 | — | ||||||
| Tranche B Term Loan, due 2017 |
772 | — | ||||||
| Capital leases and other |
67 | 130 | ||||||
|
|
|
|
|
|||||
| Total debt |
2,103 | 289 | ||||||
| Less: current portion |
(107) | (218) | ||||||
|
|
|
|
|
|||||
| Long-term debt |
$ | 1,996 | $ | 71 | ||||
|
|
|
|
|
|||||
The principal maturities of debt, at nominal value follows:
| Year |
Debt and |
|||
| (in millions) | ||||
| 2012 |
$ | 107 | ||
| 2013 |
5 | |||
| 2014 |
26 | |||
| 2015 |
28 | |||
| 2016 |
162 | |||
| Thereafter |
1,778 | |||
|
|
|
|||
| Total |
$ | 2,106 | ||
|
|
|
|||
112
Table of Contents
Credit Agreement
In March 2011, in conjunction with the redemption of membership interests from Class A and Class C membership interest holders, Delphi Corporation, a wholly-owned U.S. subsidiary of Delphi Automotive LLP (the “Issuer”), entered into a credit agreement with JPMorgan Chase Bank, N.A., as lead arranger and administrative agent, with respect to $3.0 billion in senior secured credit facilities (the “Credit Facilities”). The March 2011 credit agreement has been amended and restated (the “Credit Agreement”) and as of December 31, 2011 consists of a $1.3 billion 5-year senior secured revolving credit facility (the “Revolving Credit Facility”), a $258 million senior secured 5-year term A loan (the “Tranche A Term Loan”) and a $950 million senior secured 6-year term B loan (the “Tranche B Term Loan”). During the year ended December 31, 2011, $47 million and $177 million of the Tranche A Term Loan and Tranche B Term Loan, respectively, were repaid under the Credit Agreement. In conjunction with the repayments, approximately $10 million of debt issuance costs and discount were extinguished. The Revolving Credit Facility was undrawn at December 31, 2011. As of December 31, 2011, we had approximately $9 million in letters of credit issued under the Credit Agreement. Letters of credit issued under the Credit Agreement reduce availability under the Revolving Credit Facility.
The Credit Agreement carries an interest rate, at the Issuer’s option, of either (a) the Administrative Agent’s Alternate Base Rate (“ABR” as defined in the Credit Agreement) plus (i) with respect to the Revolving Credit Facility and the Tranche A Term Loan, 1.50% per annum or (ii) with respect to the Tranche B Term Loan, 1.50% per annum, or (b) the London Interbank Offered Rate (the “Adjusted LIBO Rate” as defined in the Credit Agreement) (“LIBOR”) plus (i) with respect to the Revolving Credit Facility and the Tranche A Term Loan, 2.50% per annum or (ii) with respect to the Tranche B Term Loan, 2.50% per annum since the initial public offering. The Tranche B Term Loan includes a LIBOR floor of 1.00%.
The interest rate period with respect to the LIBOR interest rate option can be set at one-, two-, three-, or six-months as selected by the Issuer in accordance with the terms of the Credit Agreement (or other period as may be agreed by the applicable lenders), but payable no less than quarterly. The Issuer may elect to change the selected interest rate over the term of the Credit Facilities in accordance with the provisions of the Credit Agreement. The applicable interest rates listed above for the Revolving Credit Facility and the Tranche A Term Loan may increase or decrease from time to time by 0.25% based upon changes to the Company’s corporate credit ratings. Accordingly, the interest rate will fluctuate during the term of the Credit Agreement based on changes in the ABR, LIBOR or future changes in the Company’s corporate credit ratings. Upon completion of our initial public offering, the applicable interest rates for the Tranche A Term Loan and Revolving Credit Facility were reduced by 25 basis points. The Credit Agreement also requires that the Issuer pay certain commitment fees on the unused portion of the Revolving Credit Facility and certain letter of credit issuance and fronting fees.
The Issuer is obligated to make quarterly principal payments throughout the terms of the Tranche A and Tranche B Term Loans according to the amortization schedule in the Credit Agreement. In conjunction with the repayments during the year ended December 31, 2011, all quarterly principal payment obligations prior to maturity have been satisfied for the Tranche B Term Loan and quarterly principal payments have been satisfied through December 31, 2013 for the Tranche A Term Loan and partially satisfied through March 31, 2014. Borrowings under the Credit Agreement are prepayable at the Issuer’s option without premium or penalty, provided that any prepayment of the Tranche B Term Loan is accompanied by a pro rata payment of the Tranche A Term Loan (based on the respective amounts then outstanding). The Issuer may request that all or a portion of the Term Loans be converted to extend the scheduled maturity date(s) with respect to all or a portion of any principal amount of such Term Loans under certain conditions. The Credit Agreement also contains certain mandatory prepayment provisions in the event the Company generates excess cash flow (as defined in the Credit Agreement) or Delphi receives net cash proceeds from any asset sale or casualty event. No mandatory prepayments, under these provisions, have been made or are due through December 31, 2011.
113
Table of Contents
As of December 31, 2011, the Issuer selected the one-month LIBOR interest rate option, as detailed in the table below, and the amounts outstanding, net of the discount (in millions) and rates effective as of December 31, 2011 were:
| LIBOR plus | Borrowings as of December 31, 2011 |
Rates effective as of December 31, 2011 | ||||||
| Revolving Credit Facility |
2.50% | $ | — | —% | ||||
| Tranche A Term Loan |
2.50% | $ | 210 | 2.81% | ||||
| Tranche B Term Loan |
2.50% | $ | 772 | 3.50%* | ||||
| * | Includes a LIBOR floor of 1.00%. |
The Credit Agreement contains certain covenants that limit, among other things, the Company’s (and the Company’s subsidiaries’) ability to incur additional indebtedness or liens, to dispose of assets, to make certain investments, to prepay certain indebtedness and to pay dividends, or to make other distributions or redemptions/repurchases, in respect of the Company’s equity interests. In addition, the Credit Agreement requires that the Company maintain a consolidated leverage ratio (the ratio of Consolidated Total Indebtedness to Consolidated EBITDA, each as defined in the Credit Agreement) of less than 2.75 to 1.0. The Credit Agreement also contains events of default customary for financings of this type. The Company was in compliance with the Credit Agreement covenants as of December 31, 2011.
The Tranche A Term Loan and the Tranche B Term Loan were each issued under the Credit Agreement at a 0.5% discount and Delphi paid approximately $86 million of debt issuance costs in connection with the Credit Facilities. The discount and debt issuance costs are being amortized over the life of the facility. The amended and modified Credit Agreement reduced the discount related to the Tranche B Term Loan to 0.25%.
All obligations under the Credit Agreement are borrowed by Delphi Corporation and jointly and severally guaranteed by its direct and indirect parent companies and by certain of Delphi Automotive PLC’s existing and future direct and indirect U.S. subsidiaries, subject to certain exceptions set forth in the Credit Agreement. All obligations under the Credit Agreement, including the guarantees of those obligations, are secured by certain assets of Delphi Corporation and the guarantors, including substantially all of the assets of Delphi Automotive PLC, and its U.S. subsidiaries, and certain assets of Delphi Corporation’s direct and indirect parent companies.
Senior Notes
On May 17, 2011, Delphi Corporation issued $500 million of 5.875% senior notes due 2019 and $500 million of 6.125% senior notes due 2021 (the “Senior Notes”) in a transaction exempt from registration under Rule 144A and Regulation S of the Securities Act. The Senior Notes are fully and unconditionally guaranteed, jointly and severally, by Delphi Automotive PLC and certain of its existing and future subsidiaries. Interest is payable semi-annually on May 15 and November 15 of each year. Delphi paid $30 million of interest in November 2011. Delphi paid approximately $23 million of debt issuance costs in connection with the Senior Notes. The net proceeds of approximately $1.0 billion as well as cash on hand were used to pay down amounts outstanding under the Credit Agreement.
The indenture governing the Senior Notes limits, among other things, Delphi’s (and Delphi’s subsidiaries’) ability to incur additional indebtedness or liens, dispose of assets, make certain restricted payments or investments, enter into transactions with affiliates or merge with or into other entities. As of December 31, 2011 the Company was in compliance with the provisions of the Senior Notes.
114
Table of Contents
Acquisition Financing
In connection with the Acquisition, (i) Delphi Automotive LLP issued $41 million in senior unsecured five-year notes (the “Old Notes”) pursuant to a Note Purchase Agreement (the “NPA”) with an Acquisition Date fair value of $49 million and (ii) entered into a senior secured delayed draw term loan facility (the “DDTL”) with a syndicate of lenders. The Old Notes paid 12% interest and were scheduled to mature on October 6, 2014. The DDTL permitted borrowings of up to $890 million, consisting of a U.S. tranche of up to $267 million in borrowings and a foreign tranche of up to $623 million in borrowings. There was no commitment fee associated with the DDTL, but, if drawn, Delphi was required to pay interest at the rate of LIBOR plus 6.0% per annum, with a minimum LIBOR amount of 2.0% per annum. The DDTL had a term of 5 years. A majority of the holders of the Old Notes and the lenders under the DDTL were related parties as holders of the Class A and Class B membership interests.
In connection with the redemption of the Class A and Class C membership interests on March 31, 2011 and execution of the Credit Agreement, each of the DDTL and the NPA was terminated (including the termination, discharge and release of all security and guarantees granted in connection with the DDTL and the NPA) and Delphi paid approximately $57 million to redeem the Old Notes in full. In connection with the termination of the Old Notes, Delphi incurred early termination penalties and recognized a loss on extinguishment of debt of approximately $9 million for the year ended December 31, 2011.
Other Financing
Accounts receivable factoring—Various accounts receivable factoring facilities are maintained in Europe and are accounted for as short-term debt. These uncommitted factoring facilities are available through various financial institutions. As of December 31, 2011 and 2010, $54 million and $112 million, respectively, were outstanding under these accounts receivable factoring facilities.
Capital leases and other—As of December 31, 2011 and 2010, approximately $67 million and approximately $130 million, respectively, of other debt issued by certain international subsidiaries was outstanding, primarily related to bank lines in Asia Pacific and capital lease obligations.
Interest—Cash paid for interest related to amounts outstanding totaled $101 million, $30 million, $8 million and $157 million for the years ended December 31, 2011 and 2010, and the periods August 19 to December 31, 2009 and January 1 to October 6, 2009, respectively.
| 13. | PENSION BENEFITS |
Overview
Certain of Delphi’s non-U.S. subsidiaries sponsor defined benefit pension plans, which generally provide benefits based on negotiated amounts for each year of service. Delphi’s primary non-U.S. plans are located in France, Germany, Luxembourg, Mexico, Portugal and the United Kingdom (“U.K.”). The U.K. and certain Mexican plans are funded. In addition, Delphi has defined benefit plans in South Korea, Turkey and Italy for which amounts are payable to employees immediately upon separation. The obligations for these plans are recorded based on the vested obligation.
Delphi sponsors a Supplemental Executive Retirement Program (“SERP”) for those employees who were U.S. executives prior to September 30, 2008 and were still U.S. executives on October 7, 2009, the effective date of the program. This program is unfunded. Executives receive benefits over 5 years after an involuntary or voluntary separation from Delphi. The SERP is closed to new members and was frozen effective September 30, 2008, as discussed further below.
115
Table of Contents
Termination of the U.S. Pension Plans and U.S. OPEB
Prior to the PBGC termination of the U.S. pension plans, (as further discussed in Note 3. Elements of Predecessor Transformation Plan), the Predecessor sponsored pension plans covering employees in the U.S., which generally provided benefits of stated amounts for each year of service, as well as supplemental benefits for employees who qualified for retirement before normal retirement age. Certain employees also participated in non-qualified pension plans covering executives, which are based on targeted wage replacement percentages and are unfunded. The Predecessor froze the Salaried Plan, the SERP, the ASEC Manufacturing Retirement Program, the Delphi Mechatronics Retirement Program and the PHI Non-Bargaining Retirement Plan effective September 30, 2008. Additionally, the Predecessor reached agreement with its labor unions resulting in a freeze of traditional benefit accruals under the Hourly Plan effective as of November 30, 2008.
On September 26, 2008, the Predecessor received the consent of its labor unions and approval from the Court to transfer certain assets and liabilities of the Hourly Plan to the GM Hourly-Rate Employee Pension Plan, pursuant to section 414(l) of the Internal Revenue Code (the “414(l) Net Liability Transfer”), as agreed under the Amended GSA. The 414(l) Net Liability Transfer was to occur in two separate steps. On September 29, 2008, the Predecessor completed the first step of the 414(l) Net Liability Transfer, transferring liabilities of approximately $2.6 billion and assets of approximately $0.5 billion of the Hourly Plan to the GM Hourly-Rate Employees Pension Plan, representing 30% and 10% of the projected benefit obligation and plan assets, respectively, as of September 29, 2008. The 414(l) Net Liability Transfer was sufficient to avoid an accumulated funding deficiency for the Hourly Plan for plan year ended September 30, 2008. In consideration of the first step of the 414(l) Net Liability Transfer, Old GM received an allowed administrative bankruptcy claim equivalent to 77.5% of the net unfunded liabilities transferred, or $1.6 billion. The first step of the 414(l) Net Liability Transfer was accounted for as a partial settlement of the Hourly Plan under the accounting guidance related to employer’s accounting for settlements and curtailments of defined benefit pension plans and for termination benefits in the third quarter of 2008. The Predecessor recognized a settlement loss of $494 million included in reorganization items in the consolidated statements of operations for the year ended December 31, 2008, which reflects the recognition of $494 million of previously unrecognized actuarial losses included in accumulated other comprehensive income. The amount of actuarial losses recognized represents the proportion of the projected benefit obligation transferred to Old GM relative to the total projected benefit obligation of the Hourly Plan.
The second step of the 414(l) Net Liability Transfer (the “Second Pension Transfer”) was to occur upon the effectiveness of an amended plan of reorganization. In July 2009, GM advised the Predecessor that it would not assume the Hourly Plan and would not complete the Second Pension Transfer. GM and the PBGC negotiated a separate release and waiver agreement regarding a possible initiation by the PBGC of the plan termination process for the Hourly Plan, which provides consideration to the PBGC for certain releases to be granted to, among others, GM, the Predecessor, and the Predecessor’s global affiliates. On July 22, 2009, the PBGC initiated the process to terminate the Hourly Plan and the U.S. salaried and subsidiary pension plans. The Predecessor recognized a pension curtailment and settlement loss of $2.8 billion included in reorganization items in the consolidated statement of operations for the period ended October 6, 2009. This loss included the reversal of $5.2 billion of liabilities subject to compromise related to the U.S. pension plans offset by the recognition of $5.0 billion of related unamortized losses previously recorded in accumulated other comprehensive income and the recognition of a $3.0 billion allowed general unsecured non-priority claim granted to the PBGC. For additional information regarding the PBGC termination of the Hourly Plan and the U.S. salaried and subsidiary pension plans, refer to Note 3. Elements of Predecessor Transformation Plan.
On February 4, 2009, the Predecessor filed a motion with the Court seeking the authority to cease providing retiree OPEB benefits in retirement to salaried employees, retirees, and surviving spouses after March 31, 2009. On February 24, 2009, the Court provisionally approved the Predecessor’s motion to terminate such benefits effective March 31, 2009 based on the Court’s finding that the Predecessor had met its evidentiary burdens, subject to the appointment of a retirees’ committee (the “Retirees’ Committee”) to review whether it believes that any of the affected programs involved vested benefits (as opposed to “at will” or discretionary, unvested
116
Table of Contents
benefits). On March 11, 2009, the Court issued a final order approving the Predecessor’s motion to terminate salaried OPEB benefits. The Court approved a settlement agreement (the “Settlement”), between the Predecessor and the Retirees’ Committee and the Delphi Salaried Retirees’ Association (the “Association”) settling any and all rights for the parties to appeal the Court’s March 11, 2009 final order authorizing the Predecessor to terminate salaried OPEB benefits to the U.S. District Court for the Southern District of New York (the “District Court”). Pursuant to the Settlement, the Predecessor agreed to provide the Retirees’ Committee with consideration of $9 million to resolve pending litigation, including withdrawing the appeals of the Retirees’ Committee and the Association to the District Court. The consideration provided by the Predecessor under the Settlement included an initial $1 million payment in May 2009 to a hardship fund, subsequent monthly payments of $1.25 million for five months beginning in June 2009, and a final $1 million payment in November 2009, which, under the terms of the Modified Plan, was paid by DPHH. In addition, the Predecessor contributed $500,000 toward the creation of a Voluntary Employees’ Beneficiary Association (“VEBA”) and agreed to reimburse up to an additional $250,000 of reasonable legal expenses incurred by the counsel for the Retirees’ Committee and the Association. Neither Delphi nor the Predecessor has any future funding obligations or commitments to the VEBA. Following the initial payment of $1.5 million by May 1, 2009, the District Court dismissed the appeal filed by the retirees with prejudice. The Predecessor recognized a salaried OPEB curtailment and settlement gain of $1,168 million included in reorganization items in the consolidated statement of operations for the period ended October 6, 2009. This settlement gain reflects the reversal of existing liabilities of $1,173 million ($1,181 million net of $8 million to pay salaried OPEB claims incurred but not reported as of March 31, 2009) and the recognition of previously unamortized net gains included in accumulated other comprehensive income of $4 million. The reorganization gain also reflects the impact of the $9 million consideration to be provided for the Settlement described above.
On September 23, 2008, the Predecessor received approval from the Court and on September 26, 2008 received the consent of its labor unions to cease providing traditional U.S. hourly OPEB. In addition, upon effectiveness of the Amended GSA, Old GM assumed financial responsibility for all of the Predecessor’s traditional hourly OPEB liabilities from and after January 1, 2007. GM assumed approximately $6.8 billion of postretirement benefit liabilities for certain of the Predecessor’s active and retired hourly employees. The assumption of the traditional hourly OPEB liability by Old GM and Old GM’s agreement to reimburse postretirement benefit expenses through the administrative transfer date of February 1, 2009 was accounted for as a curtailment and a settlement under the guidance related to employer’s accounting for postretirement benefits other than pensions. During the Predecessor period from January 1 to October 6, 2009, Old GM and GM funded an additional $41 million of OPEB payments made to the hourly workforce.
117
Table of Contents
Funded Status
The amounts shown below reflect the change in the U.S. defined benefit pension obligations during 2011 and 2010.
| Year ended December 31, 2011 |
Year ended December 31, 2010 |
|||||||
| (in millions) | ||||||||
| Benefit obligation at beginning of period |
$ | 83 | $ | 81 | ||||
| Interest cost |
3 | 4 | ||||||
| Actuarial loss |
5 | 5 | ||||||
| Benefits paid |
(8) | (7) | ||||||
|
|
|
|
|
|||||
| Benefit obligation at end of period |
$ | 83 | $ | 83 | ||||
| Change in plan assets: |
||||||||
| Fair value of plan assets at beginning of period |
$ | — | $ | — | ||||
| Delphi contributions |
8 | 7 | ||||||
| Benefits paid |
(8) | (7) | ||||||
|
|
|
|
|
|||||
| Fair value of plan assets at end of period |
$ | — | $ | — | ||||
| Underfunded status |
$ | (83) | $ | (83) | ||||
| Amounts recognized in the consolidated balance sheets consist of: |
||||||||
| Current liabilities |
(9) | (8) | ||||||
| Non-current liabilities |
(74) | (75) | ||||||
|
|
|
|
|
|||||
| Total |
$ | (83) | $ | (83) | ||||
| Amounts recognized in accumulated other comprehensive income consist of (pre-tax): |
||||||||
| Actuarial loss |
$ | 9 | $ | 5 | ||||
|
|
|
|
|
|||||
| Total |
$ | 9 | $ | 5 | ||||
|
|
|
|
|
|||||
118
Table of Contents
The amounts shown below reflect the change in the non-U.S. defined benefit pension obligations during 2011 and 2010.
| Year ended December 31, 2011 |
Year ended December 31, 2010 |
|||||||
| (in millions) | ||||||||
| Benefit obligation at beginning of period |
$ | 1,518 | $ | 1,533 | ||||
| Service cost |
45 | 38 | ||||||
| Interest cost |
87 | 84 | ||||||
| Plan participants’ contributions |
— | 2 | ||||||
| Actuarial loss |
43 | 4 | ||||||
| Benefits paid |
(75) | (66) | ||||||
| Impact of curtailments |
(3) | (8) | ||||||
| Plan amendments and other |
2 | (9) | ||||||
| Exchange rate movements |
(21) | (60) | ||||||
|
|
|
|
|
|||||
| Benefit obligation at end of period |
$ | 1,596 | $ | 1,518 | ||||
| Change in plan assets: |
||||||||
| Fair value of plan assets at beginning of period |
$ | 910 | $ | 798 | ||||
| Actual return on plan assets |
10 | 95 | ||||||
| Delphi contributions |
151 | 109 | ||||||
| Plan participants’ contributions |
— | 2 | ||||||
| Benefits paid |
(75) | (66) | ||||||
| Exchange rate movements and other |
(9) | (28) | ||||||
|
|
|
|
|
|||||
| Fair value of plan assets at end of period |
$ | 987 | $ | 910 | ||||
| Underfunded status |
$ | (609) | $ | (608) | ||||
| Amounts recognized in the consolidated balance sheets consist of: |
||||||||
| Current liabilities |
(16) | (13) | ||||||
| Non-current liabilities |
(593) | (595) | ||||||
|
|
|
|
|
|||||
| Total |
$ | (609) | $ | (608) | ||||
| Amounts recognized in accumulated other comprehensive income consist of (pre-tax): |
||||||||
| Actuarial loss (gain) |
$ | 17 | $ | (75) | ||||
| Prior service cost |
1 | — | ||||||
|
|
|
|
|
|||||
| Total |
$ | 18 | $ | (75) | ||||
|
|
|
|
|
|||||
119
Table of Contents
The projected benefit obligation (“PBO”), accumulated benefit obligation (“ABO”), and fair value of plan assets for pension plans with accumulated benefit obligations in excess of plan assets and with plan assets in excess of accumulated benefit obligations are as follows:
| U.S. Plans | Non-U.S. Plans | |||||||||||||||
| 2011 | 2010 | 2011 | 2010 | |||||||||||||
| (in millions) | ||||||||||||||||
| Plans with ABO in Excess of Plan Assets | ||||||||||||||||
| PBO |
$ | 83 | $ | 83 | $ | 1,480 | $ | 1,402 | ||||||||
| ABO |
83 | 83 | 1,320 | 1,246 | ||||||||||||
| Fair value of plan assets at end of year |
— | — | 883 | 807 | ||||||||||||
| Plans with Plan Assets in Excess of ABO | ||||||||||||||||
| PBO |
$ | — | $ | — | $ | 116 | $ | 116 | ||||||||
| ABO |
— | — | 76 | 74 | ||||||||||||
| Fair value of plan assets at end of year |
— | — | 104 | 103 | ||||||||||||
| Total | ||||||||||||||||
| PBO |
$ | 83 | $ | 83 | $ | 1,596 | $ | 1,518 | ||||||||
| ABO |
83 | 83 | 1,396 | 1,320 | ||||||||||||
| Fair value of plan assets at end of year |
— | — | 987 | 910 | ||||||||||||
Benefit costs presented below were determined based on actuarial methods and included the following:
| U.S. Pension Plans | ||||||||||||||||
| Successor | Predecessor | |||||||||||||||
| Year ended December 31, 2011 |
Year ended December 31, 2010 |
Period from August 19 to December 31, 2009 |
Period from January 1 to October 6, 2009 |
|||||||||||||
| (in millions) | (in millions) | |||||||||||||||
| Service cost |
$ | — | $ | — | $ | — | $ | 12 | ||||||||
| Interest cost |
3 | 4 | 1 | 393 | ||||||||||||
| Expected return on plan assets |
— | — | — | (341) | ||||||||||||
| Settlement loss (gain) |
— | — | — | (188) | ||||||||||||
| Amortization of prior service costs |
— | — | — | 15 | ||||||||||||
| Amortization of actuarial losses |
— | — | — | 126 | ||||||||||||
|
|
|
|
|
|
|
|
|
|||||||||
| Net periodic benefit cost |
$ | 3 | $ | 4 | $ | 1 | $ | 17 | ||||||||
|
|
|
|
|
|
|
|
|
|||||||||
| Non-U.S. Pension Plans | ||||||||||||||||
| Successor | Predecessor | |||||||||||||||
| Year ended December 31, 2011 |
Year ended December 31, 2010 |
Period from August 19 to December 31, 2009 |
Period from January 1 to October 6, 2009 |
|||||||||||||
| (in millions) | (in millions) | |||||||||||||||
| Service cost |
$ | 45 | $ | 38 | $ | 13 | $ | 32 | ||||||||
| Interest cost |
87 | 84 | 21 | 76 | ||||||||||||
| Expected return on plan assets |
(61) | (55) | (12) | (63) | ||||||||||||
| Settlement gain |
(1) | (1) | — | — | ||||||||||||
| Curtailment (gain) loss |
(3) | (9) | (2) | 48 | ||||||||||||
| Amortization of prior service costs |
— | — | — | 2 | ||||||||||||
| Amortization of actuarial losses |
— | 3 | — | 14 | ||||||||||||
|
|
|
|
|
|
|
|
|
|||||||||
| Net periodic benefit cost |
$ | 67 | $ | 60 | $ | 20 | $ | 109 | ||||||||
|
|
|
|
|
|
|
|
|
|||||||||
120
Table of Contents
| Other Postretirement Benefits |
||||
| Period from January 1 to October 6, 2009 |
||||
| (in millions) | ||||
| Service cost |
$ | 7 | ||
| Interest cost |
18 | |||
| Settlement gain |
(1,175) | |||
| Amortization of prior service costs (credit) |
(30) | |||
| Amortization of actuarial losses |
9 | |||
|
|
|
|||
| Net periodic benefit cost |
$ | (1,171) | ||
|
|
|
|||
Other postretirement benefit obligations were not significant at December 31, 2011 or December 31, 2010. Net periodic benefit cost above reflects $5 million that was included in loss from discontinued operations of the Predecessor for the period from January 1 to October 6, 2009.
Experience gains and losses, as well as the effects of changes in actuarial assumptions and plan provisions are amortized over the average future service period of employees. The estimated actuarial loss for the defined benefit pension plans that will be amortized from accumulated other comprehensive income into net periodic benefit cost in 2012 is less than $1 million.
The principal assumptions used to determine the pension expense and the actuarial value of the projected benefit obligation for the U.S. and non-U.S. pension plans were:
Assumptions used to determine benefit obligations at December 31:
| Pension Benefits | ||||||||||||||||
| U.S. Plans | Non-U.S. Plans | |||||||||||||||
| 2011 | 2010 | 2011 | 2010 | |||||||||||||
| Weighted-average discount rate |
3.30 | % | 4.10 | % | 5.24 | % | 5.69 | % | ||||||||
| Weighted-average rate of increase in compensation levels |
N/A | N/A | 3.66 | % | 3.88 | % | ||||||||||
Assumptions used to determine net expense for years ended December 31:
| Pension Benefits | ||||||||||||||||||||||||
| U.S. Plans | Non-U.S. Plans | |||||||||||||||||||||||
| 2011 | 2010 | 2009 | 2011 | 2010 | 2009 | |||||||||||||||||||
| Weighted-average discount rate |
4.10 | % | 5.00 | % | 6.16 | % | 5.69 | % | 5.97 | % | 6.22 | % | ||||||||||||
| Weighted-average rate of increase in compensation levels |
N/A | N/A | N/A | 3.88 | % | 3.89 | % | 3.95 | % | |||||||||||||||
| Expected long-term rate of return on plan assets |
N/A | N/A | 8.25 | % | 6.65 | % | 7.14 | % | 7.81 | % | ||||||||||||||
Delphi selects discount rates by analyzing the results of matching each plan’s projected benefit obligations with a portfolio of high-quality fixed income investments rated AA-or higher by Standard and Poor’s.
Delphi does not have any U.S. pension assets; therefore no U.S. asset rate of return calculation was necessary for 2011 or 2010. The primary funded non-U.S. plans are in the United Kingdom and Mexico. For the determination of 2011 expense, Delphi assumed a long-term asset rate of return of approximately 6.25% and 9.50% for the United Kingdom and Mexico, respectively. Delphi evaluated input from local actuaries and asset
121
Table of Contents
managers, including consideration of recent fund performance and historical returns, in developing the long-term rate of return assumptions. The assumptions for the United Kingdom and Mexico are primarily conservative long-term, prospective rates.
Delphi’s pension expense for 2012 is determined at the 2011 measurement date. For purposes of analysis, the following table highlights the sensitivity of the Company’s pension obligations and expense to changes in key assumptions:
| Change in Assumption |
Impact on Pension Expense | Impact on PBO | ||
| 25 basis point (“bp”) decrease in discount rate |
+ $2 million | + $ 66 million | ||
| 25 bp increase in discount rate |
- $2 million | - $ 62 million | ||
| 25 bp decrease in long-term return on assets |
+ $2 million | — | ||
| 25 bp increase in long-term return on assets |
- $2 million | — |
The above sensitivities reflect the effect of changing one assumption at a time. It should be noted that economic factors and conditions often affect multiple assumptions simultaneously and the effects of changes in key assumptions are not necessarily linear. The above sensitivities also assume no changes to the design of the pension plans and no major restructuring programs.
Pension Funding
The following benefit payments, which reflect expected future service, as appropriate, are expected to be paid:
| Projected Pension Benefit Payments |
||||||||
| U.S. Plans | Non-U.S. Plans | |||||||
| (in millions) | ||||||||
| 2012 |
$ | 9 | $ | 65 | ||||
| 2013 |
9 | 61 | ||||||
| 2014 |
9 | 70 | ||||||
| 2015 |
5 | 65 | ||||||
| 2016 |
8 | 73 | ||||||
| 2017 – 2021 |
44 | 445 | ||||||
Delphi anticipates making required pension contributions of approximately $64 million in 2012.
Delphi sponsors and the Predecessor sponsored defined contribution plans for certain hourly and salaried employees. Expense related to the contributions for these plans was $46 million, $35 million, $6 million and $41 million for the years ended December 31, 2011 and 2010, and the periods from August 19 to December 31, 2009 and January 1 to October 6, 2009, respectively.
Plan Assets
The pension plans sponsored by Delphi and the Predecessor invest in a diversified portfolio consisting of an array of asset classes that attempts to maximize returns while minimizing volatility. These asset classes include developed market equities, emerging market equities, private equity, global high quality and high yield fixed income, real estate, and absolute return strategies.
122
Table of Contents
The fair values of Delphi’s pension plan assets weighted-average asset allocations at December 31, 2011 and 2010, by asset category, are as follows:
| Fair Value Measurements at December 31, 2011 | ||||||||||||||||
| Asset Category |
Total | Quoted Prices in Active Markets for Identical Assets (Level 1) |
Significant Observable Inputs (Level 2) |
Significant Unobservable Inputs (Level 3) |
||||||||||||
| (in millions) | ||||||||||||||||
| Cash |
$ | 101 | $ | 101 | $ | — | $ | — | ||||||||
| Equity mutual funds |
263 | — | 263 | — | ||||||||||||
| Bond mutual funds |
360 | — | 360 | — | ||||||||||||
| Real estate trust funds |
43 | — | — | 43 | ||||||||||||
| Hedge Funds |
81 | — | — | 81 | ||||||||||||
| Commodities Fund |
35 | — | 35 | — | ||||||||||||
| Debt securities |
63 | 63 | — | — | ||||||||||||
| Equity securities |
41 | 41 | — | — | ||||||||||||
|
|
|
|
|
|
|
|
|
|||||||||
| Total |
$ | 987 | $ | 205 | $ | 658 | $ | 124 | ||||||||
|
|
|
|
|
|
|
|
|
|||||||||
| Fair Value Measurements at December 31, 2010 | ||||||||||||||||
| Asset Category |
Total | Quoted Prices in Active Markets for Identical Assets (Level 1) |
Significant Observable Inputs (Level 2) |
Significant Unobservable Inputs (Level 3) |
||||||||||||
| (in millions) | ||||||||||||||||
| Cash |
$ | 185 | $ | 185 | $ | — | $ | — | ||||||||
| Equity mutual funds |
388 | — | 388 | — | ||||||||||||
| Bond mutual funds |
234 | — | 234 | — | ||||||||||||
| Debt securities |
63 | 63 | — | — | ||||||||||||
| Equity securities |
40 | 40 | — | — | ||||||||||||
|
|
|
|
|
|
|
|
|
|||||||||
| Total |
$ | 910 | $ | 288 | $ | 622 | $ | — | ||||||||
|
|
|
|
|
|
|
|
|
|||||||||
Following is a description of the valuation methodologies used for pension assets measured at fair value.
Equity Mutual Funds—The fair value of the equity mutual funds is determined by the direct quoted market prices on regulated financial exchanges of the underlying investments included in the fund.
Bond Mutual Funds—The fair value of the bond mutual funds is determined by the direct quoted market prices on regulated financial exchanges of the underlying investments included in the fund.
Real Estate—The fair value of real estate properties is estimated using an annual appraisal provided by the administrator of the property investment. Management believes this is an appropriate methodology to obtain the fair value of these assets.
Hedge Funds—The fair value of the hedge funds is accounted for by a custodian. The custodian obtains valuations from the underlying hedge fund managers based on market quotes for the most liquid assets and alternative methods for assets that do not have sufficient trading activity to derive prices. Management and the custodian review the methods used by the underlying managers to value the assets. Management believes this is an appropriate methodology to obtain the fair value of these assets.
123
Table of Contents
Commodities—The fair value of commodity funds are determined by comparing exchange traded prices and Index rates for futures and/or swap contracts as of the measurement date to the contract rate of the underlying futures and/or swap contracts.
Debt Securities—The fair value of debt securities is determined by direct quoted market prices on regulated financial exchanges.
Equity Securities—The fair value of equity securities is determined by direct quoted market prices on regulated financial exchanges.
| Fair Value Measurements Using Significant Unobservable Inputs (Level 3) |
||||||||||||
| Real Estate Trust Fund |
Alternative Investments |
Hedge Funds | ||||||||||
| (in millions) | ||||||||||||
| Beginning balance at December 31, 2009 |
$ | 82 | $ | 56 | $ | — | ||||||
| Actual return on plan assets: |
||||||||||||
| Relating to assets still held at the reporting date |
— | — | — | |||||||||
| Relating to assets sold during the period |
(35) | 2 | — | |||||||||
| Purchases, sales, and settlements |
(47) | (58) | — | |||||||||
| Transfers in and/or out of Level 3 |
— | — | — | |||||||||
|
|
|
|
|
|
|
|||||||
| Ending balance at December 31, 2010 |
$ | — | $ | — | $ | — | ||||||
|
|
|
|
|
|
|
|||||||
| Actual return on plan assets: |
||||||||||||
| Relating to assets still held at the reporting date |
1 | — | (1) | |||||||||
| Purchases, sales, and settlements |
42 | — | 82 | |||||||||
|
|
|
|
|
|
|
|||||||
| Ending balance at December 31, 2011 |
$ | 43 | $ | — | $ | 81 | ||||||
|
|
|
|
|
|
|
|||||||
14. COMMITMENTS AND CONTINGENCIES
European Union Antitrust Investigation
Delphi has received requests for information from antitrust authorities at the European Commission seeking information about alleged conduct by Delphi in connection with an investigation of automotive parts suppliers concerning possible violations of antitrust laws related to the supply of wire harnesses to vehicle manufacturers. Delphi is cooperating fully with the European authorities. Investigations of this nature often continue for several years and may result in fines imposed by the European authorities. Any fine could result in a material adverse impact on the Company’s operating results and cash flows. However, at this time, Delphi is unable to estimate any reasonably possible range of loss that may ultimately result from this investigation. No accrual for this matter has been recorded as of December 31, 2011.
Class Action Antitrust Litigation
A number of class action complaints have been filed in various U.S. federal district courts alleging that several wire harness manufacturers, including Delphi, have violated U.S. antitrust laws. These complaints allege that consumers overpaid for their vehicles as a result of the alleged conduct of the wire harness manufacturers. At this time, the Company believes that the allegations contained in the complaints are without merit with regard to the Company and the Company intends to vigorously defend against the allegations set forth in the complaints. No accruals for these matters have been recorded as of December 31, 2011.
124
Table of Contents
Unsecured Creditors Litigation
In December 2011, a complaint was filed in the Bankruptcy Court alleging that the redemption by Delphi Automotive LLP of the membership interests of GM and the PBGC, the initial public offering and a distribution by Delphi Automotive LLP in the amount of $95 million principally in respect of taxes constituted, in the aggregate, distributions to the members of Delphi Automotive LLP in excess of $7.2 billion. The complaint further alleges that such aggregate distributions obligate Delphi Automotive LLP to pay to the holders of allowed general unsecured claims against the Predecessor $32.50 for every $67.50 in excess of $7.2 billion in distributions, up to a maximum of $300 million. At this time, we believe that the allegations contained in the complaint are without merit, and we intend to vigorously contest the allegations set forth in the complaint. No accrual for this matter has been recorded as of December 31, 2011.
Environmental Matters
Delphi is subject to the requirements of U.S. federal, state and local, and non-U.S., environmental and safety and health laws and regulations. As of December 31, 2011 and 2010, the undiscounted reserve for environmental investigation and remediation was approximately $22 million (of which $5 million was recorded in accrued liabilities and $17 million was recorded in other long-term liabilities) and $23 million (of which $5 million was recorded in accrued liabilities and $18 million was recorded in other long-term liabilities), respectively. Delphi cannot ensure that environmental requirements will not change or become more stringent over time or that its eventual environmental remediation costs and liabilities will not exceed the amount of its current reserves. In the event that such liabilities were to significantly exceed the amounts recorded, Delphi’s results of operations could be materially affected. At December 31, 2011, the difference between the recorded liabilities and the reasonably possible range of loss was not significant.
Ordinary Business Litigation
Delphi is from time to time subject to various legal actions and claims incidental to its business, including those arising out of alleged defects, breach of contracts, product warranties, intellectual property matters, and employment-related matters. It is the opinion of Delphi that the outcome of such matters will not have a material adverse impact on the consolidated financial position, results of operations, or cash flows of Delphi. With respect to warranty matters, although Delphi cannot ensure that the future costs of warranty claims by customers will not be material, Delphi believes its established reserves are adequate to cover potential warranty settlements.
Brazil Matters
Delphi conducts significant business operations in Brazil that are subject to the Brazilian federal labor, social security, environmental, tax and customs laws, as well as a variety of state and local laws. While Delphi believes it complies with such laws, they are complex, subject to varying interpretations, and the Company is often engaged in litigation with government agencies regarding the application of these laws to particular circumstances. In addition, Delphi also is a party to commercial and labor litigation with private parties. As of December 31, 2011, related claims totaling approximately $225 million (using December 31, 2011 foreign currency rates) have been asserted against Delphi. As of December 31, 2011, the Company maintains accruals for these asserted claims of approximately $40 million (using December 31, 2011 foreign currency rates). The amounts accrued represent claims that are deemed probable of loss and are reasonably estimable based on the Company’s analyses and assessment of the asserted claims and prior experience with similar matters. While the Company believes its accruals are adequate, the final amounts required to resolve these matters could differ materially from the Company’s recorded estimates and Delphi’s results of operations could be materially affected.
125
Table of Contents
Romania Value Added Tax (“VAT”) Assessment
During the first quarter of 2010, as a result of a tax audit for years 2006–2008, we received a tax assessment from the Romanian tax authorities in the amount of approximately $42 million based on the taxing authority’s assessment that we underpaid its VAT (mostly on export sales) by approximately $24 million and owe accrued interest and penalties of $18 million. We filed an appeal contesting the assessment and in October 2010, the Romanian tax authorities substantially reduced the amount of the assessment and decided to re-audit us. In December 2011, the Company received $13 million from the tax authorities related to the outstanding VAT credit. As of December 31, 2011, we maintain a reserve for this contingency that is substantially less than the amount of the remaining balance under assessment. While we believe our reserve is adequate, the final amounts required to resolve this initial assessment could differ materially from our recorded estimate.
Operating leases
Rental expense totaled $95 million, $98 million, $34 million and $76 million for the years ended December 31, 2011 and 2010, and the periods from August 19 to December 31, 2009 and January 1 to October 6, 2009, respectively. As of December 31, 2011, Delphi had minimum lease commitments under non-cancellable operating leases totaling $325 million, which become due as follows:
| Year |
Minimum Future Operating Lease Commitments |
|||
| (in millions) | ||||
| 2012 |
$ | 82 | ||
| 2013 |
67 | |||
| 2014 |
57 | |||
| 2015 |
48 | |||
| 2016 |
38 | |||
| Thereafter |
33 | |||
|
|
|
|||
| Total |
$ | 325 | ||
|
|
|
|||
15. INCOME TAXES
Income (loss) from continuing operations before income taxes and equity income (loss) for U.S. and non-U.S. operations are as follows:
| Successor | Predecessor | |||||||||||||||||
| Year ended December 31, 2011 |
Year ended December 31, 2010 |
Period from August 19 to December 31, 2009 |
Period from January 1 to October 6, 2009 |
|||||||||||||||
| (in millions) | (in millions) | |||||||||||||||||
| U.S. income (loss) |
$ | 149 | $ | 313 | $ | (86) | $ | 9,460 | ||||||||||
| Non-U.S. income (loss) |
1,357 | 631 | 51 | (344) | ||||||||||||||
|
|
|
|
|
|
|
|
|
|||||||||||
| Income (loss) from continuing operations before income taxes and equity income (loss) |
$ | 1,506 | $ | 944 | $ | (35) | $ | 9,116 | ||||||||||
|
|
|
|
|
|
|
|
|
|||||||||||
The Predecessor’s U.S. income of $9,460 million for the period from January 1 to October 6, 2009 includes a reorganization gain of $10,210 million primarily relating to the extinguishment of liabilities subject to compromise.
126
Table of Contents
The provision (benefit) for income taxes is comprised of:
| Successor | Predecessor | |||||||||||||||||
| Year ended December 31, 2011 |
Year ended December 31, 2010 |
Period from August 19 to December 31, 2009 |
Period from January 1 to October 6, 2009 |
|||||||||||||||
| (in millions) | (in millions) | |||||||||||||||||
| Current income tax expense: |
||||||||||||||||||
| U.S. federal |
$ | 104 | $ | 98 | $ | 11 | $ | — | ||||||||||
| Non-U.S. |
232 | 164 | 55 | 60 | ||||||||||||||
| U.S. state and local |
5 | 10 | — | — | ||||||||||||||
|
|
|
|
|
|
|
|
|
|||||||||||
| Total current |
341 | 272 | 66 | 60 | ||||||||||||||
| Deferred income tax (benefit) expense, net: |
||||||||||||||||||
| U.S. federal |
(45) | (17) | (41) | (358) | ||||||||||||||
| Non-U.S. |
12 | 3 | (50) | (13) | ||||||||||||||
| U.S. state and local |
(3) | — | (2) | — | ||||||||||||||
|
|
|
|
|
|
|
|
|
|||||||||||
| Total deferred |
(36) | (14) | (93) | (371) | ||||||||||||||
|
|
|
|
|
|
|
|
|
|||||||||||
| Total income tax provision (benefit) |
$ | 305 | $ | 258 | $ | (27) | $ | (311) | ||||||||||
|
|
|
|
|
|
|
|
|
|||||||||||
Cash paid or withheld for income taxes was $303 million, $254 million, $20 million and $92 million for the years ended December 31, 2011 and 2010, and the periods from August 19 to December 31, 2009 and January 1 to October 6, 2009, respectively.
For purposes of comparability and consistency we have used the notional U.S. federal income tax rate when presenting our reconciliation of the income tax provision. The Company is a U.K. resident taxpayer and as such is not generally subject to U.K. tax on remitted foreign earnings. As a result we do not anticipate foreign earnings would be subject to a 35% tax rate upon repatriation to the U.K., as is the case for U.S. based companies. A reconciliation of the provision (benefit) for income taxes compared with the amounts at the notional U.S. federal statutory rate was:
| Successor | Predecessor | |||||||||||||||||
| Year ended December 31, 2011 |
Year ended December 31, 2010 |
Period from August 19 to December 31, 2009 |
Period from January 1 to October 6, 2009 |
|||||||||||||||
| (in millions) | (in millions) | |||||||||||||||||
| Notional U.S. federal income taxes at statutory rate |
$ | 527 | $ | 330 | $ | (12) | $ | 3,190 | ||||||||||
| U.S. income taxed at other rates |
1 | 9 | (1) | 266 | ||||||||||||||
| Non-U.S. income taxed at other rates |
(226) | (31) | (16) | 56 | ||||||||||||||
| Change in valuation allowance |
(52) | (21) | — | (3,464) | ||||||||||||||
| Tax credits |
(26) | (29) | (10) | — | ||||||||||||||
| Change in tax law |
13 | (15) | — | (4) | ||||||||||||||
| Other changes in tax reserves |
17 | (2) | 9 | — | ||||||||||||||
| Other comprehensive income adjustment |
— | — | — | (358) | ||||||||||||||
| Withholding taxes |
56 | 24 | 2 | 3 | ||||||||||||||
| Other adjustments |
(5) | (7) | 1 | — | ||||||||||||||
|
|
|
|
|
|
|
|
|
|||||||||||
| Total income tax expense (benefit) |
$ | 305 | $ | 258 | $ | (27) | $ | (311) | ||||||||||
|
|
|
|
|
|
|
|
|
|||||||||||
Included in loss from discontinued operations are income tax provisions of $17 million for the period from January 1 to October 6, 2009.
127
Table of Contents
The Company’s tax rate is affected by the tax rates in the jurisdictions in which the Company operates, the relative amount of income earned by jurisdiction, jurisdictions with a statutory tax rate less than the U.S. rate of 35% and the relative amount of losses or income for which no tax benefit or expense was recognized due to a valuation allowance. Included in non-U.S. income taxed at other rates for 2011, are tax incentives of $64 million obtained in various non-U.S. countries, primarily Hi-Tech Enterprise status in China and the Maquiladora regime in Mexico, and a $65 million tax benefit for income earned in jurisdictions where a valuation allowance has been recorded, primarily in France.
We recognized a $52 million, primarily Germany, and $21 million tax benefit in 2011 and 2010, respectively, related to changes of judgment in valuation allowance for the realization of deferred tax assets. During 2011, the Company recorded a withholding tax of $10 million related to the funding of the redemption of all the outstanding Class A and Class C membership interests and $27 million related to changes in our assertion with respect to our intent to repatriate foreign earnings in certain countries.
During the period from January 1 through October 6, 2009, the Company recognized tax benefits associated with gains from Other Comprehensive Income of $358 million (see discussion in Note 13. Pension Benefits).
Delphi currently benefits from tax holidays in various non-U.S. jurisdictions with expiration dates from 2012 through 2023. The income tax benefits attributable to these tax holidays are approximately $20 million ($0.05 per share) in 2011, $5 million ($0.01 per share) in 2010, $2 million ($0.00 per share) for January 1 to October 6, 2009, and $1 million ($0.00 per share) for August 19 to December 31, 2009.
Deferred income taxes
Delphi accounts for income taxes and the related accounts under the liability method. Deferred income tax assets and liabilities reflect the impact of temporary differences between amounts of assets and liabilities for financial reporting purposes and the bases of such assets and liabilities as measured by tax laws. Significant components of the deferred tax assets and liabilities are as follows:
| December 31 | ||||||||
| 2011 | 2010 | |||||||
| (in millions) | ||||||||
| Deferred tax assets: |
||||||||
| Pension |
$ | 136 | $ | 136 | ||||
| Employee Benefits |
49 | 26 | ||||||
| Net operating loss carryforwards |
483 | 561 | ||||||
| Warranty and other liabilities |
188 | 148 | ||||||
| Other |
91 | 106 | ||||||
|
|
|
|
|
|||||
| Total gross deferred tax assets |
947 | 977 | ||||||
| Less: valuation allowances |
(472) | (551) | ||||||
|
|
|
|
|
|||||
| Total deferred tax assets (1) |
$ | 475 | $ | 426 | ||||
| Deferred tax liabilities: |
||||||||
| Fixed Assets |
$ | 6 | $ | 18 | ||||
| Tax on unremitted profits of certain foreign subsidiaries |
39 | 16 | ||||||
| Intangibles |
160 | 210 | ||||||
| Foreign operating loss recapture |
45 | 45 | ||||||
|
|
|
|
|
|||||
| Total gross deferred tax liabilities |
250 | 289 | ||||||
|
|
|
|
|
|||||
| Net deferred tax assets |
$ | 225 | $ | 137 | ||||
|
|
|
|
|
|||||
| (1) | Reflects gross amount before jurisdictional netting of deferred tax assets and liabilities. |
128
Table of Contents
Net current and non-current deferred tax assets and liabilities are included in the consolidated balance sheets as follows:
| December 31 | ||||||||
| 2011 | 2010 | |||||||
| (in millions) | ||||||||
| Current assets |
$183 | $136 | ||||||
| Current liabilities |
(28) | (4) | ||||||
| Long-term assets |
204 | 183 | ||||||
| Long-term liabilities |
(134) | (178) | ||||||
|
|
|
|
|
|||||
| Total deferred tax asset |
$ 225 | $ 137 | ||||||
|
|
|
|
|
|||||
The net deferred tax assets of $225 million as of December 31, 2011 are primarily comprised of deferred tax asset amounts in the U.K., China, and Germany.
Net operating loss and tax credit carryforwards
As of December 31, 2011, Delphi has gross deferred tax assets of approximately $483 million for non-U.S. net operating loss (“NOL”) carryforwards with recorded valuation allowances of $460 million. These NOL’s are available to offset future taxable income and realization is dependent on generating sufficient taxable income prior to expiration of the loss carryforwards. The non-U.S. NOL’s relate primarily to France, Spain, and Luxembourg. The NOL carryforwards have expiration dates ranging from one year to an indefinite period.
Deferred tax assets include $10 million and $19 million of tax credit carryforwards with recorded valuation allowances of $3 million and $19 million at December 31, 2011 and 2010, respectively. These tax credit carryforwards expire in 2012 through 2029.
Cumulative undistributed foreign earnings
Withholding taxes of $39 million on undistributed earnings are related to China, South Korea and Turkey that are not indefinitely reinvested. There are no other material liabilities for U.K. income taxes on the undistributed earnings of foreign subsidiaries, as the Company has concluded that such earnings are either indefinitely reinvested or should not give rise to additional income tax liabilities as a result of the distribution of such earnings.
Uncertain tax positions
Delphi recognizes tax benefits only for tax positions that are more likely than not to be sustained upon examination by tax authorities. The amount recognized is measured as the largest amount of benefit that is greater than 50 percent likely of being realized upon ultimate settlement. Unrecognized tax benefits are tax benefits claimed in Delphi’s tax returns that do not meet these recognition and measurement standards.
129
Table of Contents
A reconciliation of the gross change in the unrecognized tax benefits balance, excluding interest and penalties is as follows:
| Year ended December 31, 2011 |
Year ended December 31, 2010 |
Period from August 19 to December 31, 2009 |
Period from January 1 to October 6, 2009 |
|||||||||||||||
| (in millions) | (in millions) | |||||||||||||||||
| Balance at beginning of period |
$ | 82 | $ | 83 | $ | — | $ | 79 | ||||||||||
| Liabilities assumed in acquisition |
— | — | 80 | — | ||||||||||||||
| Additions related to current year |
43 | 9 | 10 | 1 | ||||||||||||||
| Additions related to prior year |
7 | 11 | 1 | 6 | ||||||||||||||
| Reductions related to prior year |
(24) | (19) | (6) | (10) | ||||||||||||||
| Reductions due to expirations of statute of limitations |
(6) | (1) | (1) | (1) | ||||||||||||||
| Settlements-cash |
(3) | (1) | (1) | — | ||||||||||||||
| Gain from reorganization |
— | — | — | (75) | ||||||||||||||
|
|
|
|
|
|
|
|
|
|||||||||||
| Balance at end of period |
$ | 99 | $ | 82 | $ | 83 | $ | — | ||||||||||
|
|
|
|
|
|
|
|
|
|||||||||||
A portion of Delphi’s unrecognized tax benefits would, if recognized, reduce its effective tax rate. The remaining unrecognized tax benefits relate to tax positions for which only the timing of the benefit is uncertain. Recognition of these tax benefits would reduce the Company’s effective tax rate only through a reduction of accrued interest and penalties. As of December 31, 2011 and 2010, the amounts of unrecognized tax benefit that would reduce the Company’s effective tax rate were $68 million and $52 million, respectively. In addition, $19 million and $31 million for 2011 and 2010, respectively, would be offset by the write-off of a related deferred tax asset, if recognized.
Delphi recognizes interest and penalties as part of income tax expense. Total accrued liabilities for interest and penalties were $15 million and $18 million at December 31, 2011 and 2010, respectively. Total interest and penalties recognized as part of income tax expense (benefit) was a decrease of $3 million, a decrease of $3 million, a decrease of $3 million and an increase of $1 million for the years ended December 31, 2011 and 2010, and for the periods from August 19 to December 31, 2009 and January 1 to October 6, 2009, respectively.
Delphi files tax returns in multiple jurisdictions and is subject to examination by taxing authorities throughout the world. Taxing jurisdictions significant to Delphi include the U.S., China, Brazil, France, Germany, Mexico, Poland and the U.K. Open tax years related to these taxing jurisdictions remain subject to examination and could result in additional tax liabilities. In general, Delphi affiliates are no longer subject to income tax examinations by foreign tax authorities for years before 2002. It is reasonably possible that audit settlements, the conclusion of current examinations or the expiration of the statute of limitations in several jurisdictions could impact the Company’s unrecognized tax benefits. Delphi expects a potential reduction in unrecognized tax benefits over the next twelve months of approximately $22 million due to expected resolution with tax authorities.
Tax return filing determinations and elections
Delphi Automotive LLP, which acquired the automotive supply and other businesses of the Predecessor on October 6, 2009 (the “Acquisition Date”), was established on August 19, 2009 as a limited liability partnership incorporated under the laws of England and Wales. At the time of its formation, Delphi Automotive LLP elected to be treated as a partnership for U.S. federal income tax purposes. Prior to the Acquisition Date, the Internal Revenue Service (the “IRS”) issued Notice 2009-78 (the “Notice”) announcing its intent to issue regulations under Section 7874 of the Internal Revenue Code of 1986, as amended (the “Code”), with an effective date prior to the Acquisition Date. If regulations as described in the Notice are issued with the effective date indicated in the Notice and with no exceptions for transactions that were subject to binding commitments on that date, we believe there is a significant risk that the IRS may assert that Delphi Automotive LLP, and as a
130
Table of Contents
result Delphi Automotive PLC, should be treated as a domestic corporation for U.S. federal income tax purposes, retroactive to the Acquisition Date. If Delphi Automotive LLP were treated as a domestic corporation for U.S. federal income tax purposes, we expect that, although we are incorporated under the laws of Jersey and a tax resident in the U.K., we would also be treated as a domestic corporation for U.S. federal income tax purposes.
Delphi Automotive LLP has filed informational U.S. federal partnership tax returns for 2009 and 2010. In light of the Notice, the IRS is currently reviewing whether Section 7874 applies to Delphi Automotive LLP’s acquisition of the automotive supply and other businesses of the Predecessor. The Company believes, after consultation with counsel, that neither Delphi Automotive LLP nor Delphi Automotive PLC should be treated as domestic corporations for U.S. federal income tax purposes, and intends to vigorously defend any assertion by the IRS to the contrary, including through litigation if we were unable to reach a satisfactory resolution with the IRS. However, no assurance can be given that the IRS will not contend, or that a court would not conclude, that neither Delphi Automotive LLP, and therefore Delphi Automotive PLC should be treated as a domestic corporation for U.S. federal income tax purposes. No accrual for this matter has been recorded as of December 31, 2011.
If we were treated as a domestic corporation for U.S. federal income tax purposes, we would be subject to U.S. federal income tax on our worldwide taxable income, including some or all of the distributions from our subsidiaries as well as some of the undistributed earnings of our foreign subsidiaries that constitute “controlled foreign corporations.” This could have a material adverse impact on our future tax liability related to these distributions and earnings. Future cash distributions made by us to non-U.S. shareholders could be subject to U.S. income tax withholding at a rate of 30%, unless reduced or eliminated by a tax treaty. In addition, we could be liable for additional U.S. federal income taxes on such distributions and earnings, and for the failure by Delphi Automotive LLP to withhold U.S. income taxes on distributions to its non-U.S. members, for periods beginning on or after, the Acquisition Date, which liability could have a material adverse impact on our results of operations and financial condition.
16. SHAREHOLDERS’ EQUITY AND NET INCOME (LOSS) PER SHARE
Overview
On May 19, 2011, Delphi Automotive PLC was formed as a Jersey public limited company, and had nominal assets, no liabilities and had conducted no operations prior to its initial public offering. On November 22, 2011, in conjunction with the completion of its initial public offering, all of the outstanding equity of Delphi Automotive LLP was exchanged for 328,244,510 ordinary shares, par value $0.01 in Delphi Automotive PLC. As a result, Delphi Automotive LLP became a wholly-owned subsidiary of Delphi Automotive PLC, and subsequent to the exchange, Delphi Automotive PLC completed the initial public offering of 24,078,827 ordinary shares by the selling shareholders for an aggregate purchase price of approximately $530 million. Delphi Automotive PLC did not receive any proceeds from the offering, and incurred transaction fees and expenses of approximately $44 million.
Immediately prior to the exchange of membership interests for ordinary shares and the completion of the initial public offering, there were 344,495 Class B and 24,000 Class E-1 membership interests outstanding. Substantially all of the membership interests were exchanged for 326,306,261 ordinary shares and 1,938,249 ordinary shares of Delphi Automotive PLC, respectively. Additionally, in conjunction with the Acquisition on October 6, 2009, there were also 1,750,000 Class A and 100,000 Class C membership interests issued and outstanding until March 31, 2011, when all Class A and Class C membership interests were redeemed. See “Membership Interests” below for additional information.
Net income (loss) per share
Basic net income (loss) per share is computed by dividing net income (loss) attributable to Delphi by the weighted average number of ordinary shares outstanding during the period. Diluted net income (loss) per share reflects the weighted average dilutive impact of all potentially dilutive securities from the date of issuance and is
131
Table of Contents
computed using the treasury stock method by dividing net income (loss) attributable to Delphi by the diluted weighted average number of ordinary shares outstanding. In the second quarter of 2010, Delphi’s Board of Managers approved and authorized the Value Creation Plan (the “VCP”). Refer to Note 21. Share-Based Compensation for additional information. The awards fully vest on December 31, 2012 and final settlement can be made in cash or ordinary shares or a combination thereof as provided in the participation agreement or as otherwise determined by the Compensation and Human Resources Committee of the Board of Directors. As a result, the awards that are expected to be settled in shares were included in the calculation of diluted net income (loss) per share. Additionally, in November 2011, Delphi granted 51,003 restricted stock units (“RSUs”) to the Board of Directors. These awards were also included in the calculation of diluted net income (loss) per share. For all periods presented, the effect of the VCP awards was anti-dilutive and therefore excluded from the calculation of diluted net income (loss) per share.
Predecessor Period
In the Predecessor period, the stock options, stock appreciation rights, and restricted stock units of the Predecessor were included in the calculation of diluted net income (loss) per share. The inclusion of the Predecessor stock options, stock appreciation rights, and restricted stock units in the calculation of diluted net income (loss) per share was anti-dilutive.
Weighted Average Shares
As described above, on November 22, 2011, Delphi Automotive PLC completed the exchange of all of the outstanding equity of Delphi Automotive LLP for 328,244,510 ordinary shares in Delphi Automotive PLC. For each of the Successor periods, the net income (loss) per share is presented giving effect to this transaction on a retrospective basis. In addition, weighted average shares outstanding for the Successor periods were impacted by the following transactions:
| • | The redemption of all outstanding Class A and Class C membership interests for $4,565 million on March 31, 2011. |
| • | The repurchase of 10,005 Class B membership interests for approximately $180 million in 2011. |
| • | The issuance of 24,000 Class E-1 membership interests to the Board of Managers as part of the Class E-1 Interest Incentive Plan in June 2010. |
The impact of the above transactions on weighted average shares outstanding follows:
| Successor | ||||||||||||
| Year ended December 31, 2011 |
Year ended December 31, 2010 |
Period from August 19 to December 31, 2009 |
||||||||||
| (shares in millions) | ||||||||||||
| Weighted average ordinary shares outstanding as result of the initial public offering |
328 | 328 | 328 | |||||||||
| Redemption of Class A & C membership interests (1) |
86 | 349 | 349 | |||||||||
| Repurchase of Class B membership interests |
7 | 10 | 10 | |||||||||
| Issuance of Class E-1 membership interests |
— | (1) | (2) | |||||||||
|
|
|
|
|
|
|
|||||||
| Weighted average ordinary shares outstanding for the period |
421 | 686 | 685 | |||||||||
|
|
|
|
|
|
|
|||||||
| (1) | The Class A and C membership interests redeemed on March 31, 2011 represented approximately 51% of all outstanding membership interests at the Acquisition Date. The remaining 49% membership interests consisted primarily of Class B membership interests. The 328 million ordinary shares outstanding as of the date of the initial public offering were increased to reflect ordinary shares outstanding for the Class A and C membership interests prior to March 31, 2011. |
132
Table of Contents
The following table illustrates net income (loss) per share attributable to Delphi and the weighted average shares outstanding used in calculating basic and diluted income (loss) per share:
| Successor | Predecessor | |||||||||||||||||
| Year ended December 31, 2011 |
Year ended December 31, 2010 |
Period from August 19 to December 31, 2009 |
Period from January 1 to October 6, 2009 |
|||||||||||||||
| (in millions, except per share data) | (in millions, except per share data) |
|||||||||||||||||
| Basic and Diluted net income (loss) per share: |
||||||||||||||||||
| Numerator: |
||||||||||||||||||
| Net income (loss) attributable to Delphi |
$ | 1,145 | $ | 631 | $ | (18) | $ | 9,318 | ||||||||||
|
|
|
|
|
|
|
|
|
|||||||||||
| Denominator: |
||||||||||||||||||
| Weighted average ordinary shares outstanding |
421 | 686 | 685 | 565 | ||||||||||||||
|
|
|
|
|
|
|
|
|
|||||||||||
| Basic and diluted net income (loss) per share |
$ | 2.72 | $ | 0.92 | $ | (0.03) | $ | 16.50 | ||||||||||
|
|
|
|
|
|
|
|
|
|||||||||||
| Anti-dilutive securities share impact: |
2 | — | — | 43 | ||||||||||||||
Share Repurchase Program
In January 2012, the Board of Directors authorized a share repurchase of up to $300 million of ordinary shares. The program will terminate on the earlier to occur of December 31, 2012 or when the Company attains $300 million in ordinary share repurchases.
Membership Interests
In conjunction with the consummation of the Modified Plan on the Acquisition Date, all outstanding shares of stock of the Predecessor were cancelled and Delphi Automotive LLP issued membership interests on the Acquisition Date. As more fully described in Note 1. General, in conjunction with the Acquisition and the consummation of the Modified Plan, on October 6, 2009, Delphi Automotive LLP and GM collectively acquired substantially all of the assets of the Predecessor, the Class A, B and C membership interests were issued to GM, certain investors, including former creditors of the Predecessor, and the PBGC, respectively, and the debt outstanding from the DIP lenders was settled. The Class A and Class B membership interests entitled the holders to non-controlling representation on Delphi Automotive LLP’s Board of Managers, and, along with Class C and Class E-1 membership interests, entitled the holders to potential, future distributions by Delphi Automotive LLP. Additionally, prior to the redemption of the Class A and Class C membership interests as more fully described below, the Second Amended and Restated Limited Liability Partnership Agreement of Delphi Automotive LLP (“Second LLP Agreement”) required the consent of or provided special rights to Class A and certain Class B membership interest holders with respect to certain events, including changes in corporate governance, the execution of significant transactions and the issuance of additional securities.
133
Table of Contents
The Class A and Class B members received their membership interests in consideration for $1,833 million and $209 million of cash, respectively. In addition, the rights of the DIP lenders to receive certain assets of the Predecessor were assigned to Delphi Automotive LLP. These assets had a fair value of $2,890 million determined in accordance with FASB ASC 805, Business Combinations. The PBGC interests were derived from negotiations between GM and the PBGC with respect to the Predecessor’s terminated U.S. pension plans. In June 2010, 24,000 Class E-1 membership interests were issued to Delphi Automotive LLP’s Board of Managers, under the Class E-1 Interest Incentive Plan in order to attract and reward board members and to promote the creation of long-term value for interest holders of Delphi Automotive LLP. The fair value of the Class A, B and C membership interests issued on October 6, 2009 totaled $4,932 million, and was determined, as more fully described in Note 1. General, as follows:
| (in millions) | ||||
| Fair value of Predecessor assets acquired, net of liabilities assumed |
$ | 2,890 | ||
| Fair value of cash contributed by GM |
1,833 | |||
| Fair value of cash contributed by investors, including DIP lenders |
209 | |||
|
|
|
|||
| Fair value of net assets acquired |
$ | 4,932 | ||
|
|
|
|||
The fair value of the membership interests issued on the Acquisition Date was allocated between the respective classes based on the distribution provisions of the Second LLP Agreement. The distribution percentages varied by class of membership interest and by cumulative amount distributed, and, between classes, were not related or proportional to the number of membership interests held.
The following table summarizes the membership interests issued:
| Members | Membership Interests Issued |
Date Issued |
Membership Interests as of December 31, 2010 |
Membership Interests as of December 31, 2009 |
Allocation of Fair Value of Membership Interests as of the Acquisition Date |
|||||||||||||||||
| Class | (in millions) | |||||||||||||||||||||
| A |
GM | 1,750,000 | October 2009 | $ | 2,083 | $ | 1,969 | $ | 1,972 | |||||||||||||
| B |
DIP Lenders(1) | 354,500 | October 2009 | 2,816 | 2,406 | 2,418 | ||||||||||||||||
| C |
PBGC | 100,000 | October 2009 | 646 | 539 | 542 | ||||||||||||||||
| E-1 |
Board of Managers | 24,000 | June 2010 | 5 | — | — | ||||||||||||||||
|
|
|
|
|
|
|
|||||||||||||||||
| Total | $ | 5,550 | $ | 4,914 | $ | 4,932 | ||||||||||||||||
|
|
|
|
|
|
|
|||||||||||||||||
| (1) | Included a controlling equity stake for affiliates of Silver Point Capital and Elliot Management. Subsequent to October 6, 2009, Class B membership interests traded on the 144A market and, therefore, the holders of Class B membership interests changed over time. |
Class A and Class C membership interests redemption
On March 31, 2011, all 1,750,000 outstanding Class A and 100,000 Class C membership interests were redeemed for $3,791 million and $594 million, respectively. In conjunction with the redemption transaction, Delphi Automotive LLP incurred transaction-related fees and expenses totaling approximately $180 million, including amounts paid to certain membership interest holders. In addition, Delphi Automotive LLP obtained necessary consents to the redemption of the Class A and Class C membership interests and modified and eliminated specific rights provided to these membership interest holders under the Second LLP Agreement.
The amounts paid to redeem the outstanding Class A and Class C membership interests were $1,736 million in excess of the total recorded carrying value of the Class A and Class C membership interests. The excess was reflected as a pro-rata reduction to the recorded carrying value of the remaining membership interests (the Class B and Class E-1 membership interests).
134
Table of Contents
Class B membership interests repurchase program
In August 2011, Delphi Automotive LLP’s Board of Managers approved a repurchase program of Class B membership interests. During the year ended December 31, 2011, 10,005 Class B membership interests were repurchased for a cumulative cost of approximately $180 million at an average price per membership interests unit of $17,904. This was recorded as a reduction to the carrying value of the Class B membership interests.
Distribution
Under the terms of the Fourth LLP Agreement, if the Board of Managers determined that there was available cash (as defined in the Fourth LLP Agreement), the Class B and Class E-1 members would be entitled to receive a distribution for taxes and pursuant to the cumulative distribution provisions of available cash to enable the members to pay projected tax liabilities attributable to tax book profits and losses by Delphi that are attributable to their membership interests. In October 2011, Delphi Automotive LLP’s Board of Managers approved the payment of a distribution, primarily in respect of taxes, of approximately $95 million, which was paid on December 5, 2011, to members who held membership interests as of the close of business on October 31, 2011. Tax distributions were treated as an advance of amounts otherwise distributable to the members.
Other
Prior to the completion of the initial public offering on November 22, 2011, net income and other changes to membership interests were allocated to the respective outstanding classes based on the cumulative distribution provisions of the Fourth LLP Agreement.
In conjunction with the adoption in 2010 of the 2010 Board of Managers Class E-1 Interest Incentive Plan and the VCP, both of which are long-term incentive plans designed to assist the Company in attracting, retaining, motivating and rewarding the Board of Managers and key employees of the Company, and promoting the creation of long-term value, the Fourth LLP Agreement was amended to address the Class E-1 membership interests and the VCP. The Fourth LLP Agreement includes provisions related to potential distributions, or alternatively, allocations of equity, to the Class E-1 members and employee incentive plans based on rates/amounts as defined in the agreement (approximately 3.7% for the first approximately $1.6 billion of distributions and approximately 3.4% for distributions thereafter, subject to adjustment for the Class B membership interests repurchased) with ratable reductions in the distribution percentages applied to Class B members.
Additionally, under the terms of the Acquisition and the Fourth LLP Agreement, if cumulative distributions to the members of Delphi Automotive LLP under certain provisions of the Fourth LLP Agreement exceed $7.2 billion, Delphi, as disbursing agent on behalf of DPHH, is required to pay to the holders of allowed general unsecured claims against Old Delphi, $32.50 for every $67.50 in excess of $7.2 billion distributed to the members, up to a maximum amount of $300 million. This contingency is not considered probable of occurring as of December 31, 2011. In December 2011, a complaint was filed in the Bankruptcy Court alleging that distributions in excess of $7.2 billion were made to the members of Delphi Automotive LLP. Refer to Note 14. Commitments and Contingencies for additional information.
Allocation of net income (loss) to membership interest classes
Total membership interest equity as of October 6, 2009 was allocated to the respective classes of membership interests across all tranches of the cumulative distribution schedule as defined by the Second LLP Agreement. In subsequent periods total membership interest equity at the end of the period was allocated to the respective classes of membership interests across all tranches of the cumulative distribution schedule as defined by the LLP agreement effective in that period. The allocation of the net income (loss) for the period is the difference between the ending and beginning of period allocation of membership interest equity as adjusted for the payment of a distribution of approximately $95 million, which was paid on December 5, 2011, to members who held membership interests as of the close of business on October 31, 2011.
135
Table of Contents
The following table summarizes the allocation of net income (loss) to the membership interest classes for the periods prior to the initial public offering.
| Period from January 1, 2011 to Initial Public Offering Net Income Attributable to Membership Interests |
Year
Ended December 31, 2010 Net Income Attributable to Membership Interests |
Period from August 19 to December 31, 2009 Net Loss Attributable to Membership Interests |
||||||||||
| Class | (in millions) | |||||||||||
| A |
$ | 76 | $ | 114 | $ | (3) | ||||||
| B |
930 | 410 | (12) | |||||||||
| C |
25 | 107 | (3) | |||||||||
| E-1 |
4 | — | N/A | |||||||||
|
|
|
|
|
|
|
|||||||
| $ | 1,035 | $ | 631 | $ | (18) | |||||||
|
|
|
|
|
|
|
|||||||
17. FAIR VALUE OF FINANCIAL INSTRUMENTS, DERIVATIVES AND HEDGING ACTIVITIES
Financial Instruments
Delphi’s financial instruments include debt which consists of its accounts receivable factoring arrangements, capital leases and other debt issued by Delphi’s foreign subsidiaries, the Tranche A Term Loan, the Tranche B Term Loan and the Senior Notes. The fair value of debt is based on quoted market prices for instruments with public market data or the current book value for instruments without a quoted public market price. As of December 31, 2011 and 2010, the total of debt was recorded at $2,103 million and $289 million, respectively, and had estimated fair values of $2,125 million and $293 million, respectively. For all other financial instruments recorded at December 31, 2011 and 2010, fair value approximates book value.
Derivatives and Hedging Activities
Delphi is exposed to market risk, such as fluctuations in foreign currency exchange rates, commodity prices and changes in interest rates, which may result in cash flow risks. To manage the volatility relating to these exposures, Delphi aggregates the exposures on a consolidated basis to take advantage of natural offsets. For exposures that are not offset within its operations, Delphi enters into various derivative transactions pursuant to its risk management policies, which prohibit holding or issuing derivative financial instruments for trading purposes, and designation of derivative instruments is performed on a transaction basis to support hedge accounting. The changes in fair value of these hedging instruments are offset in part or in whole by corresponding changes in the fair value or cash flows of the underlying exposures being hedged. Delphi assesses the initial and ongoing effectiveness of its hedging relationships in accordance with its documented policy. As of December 31, 2011, Delphi has entered into derivative instruments to hedge cash flows extending out to January 2014.
136
Table of Contents
As of December 31, 2011, the Company had the following outstanding notional amounts related to commodity and foreign currency forward contracts that were entered into to hedge forecasted exposures:
| Commodity |
Quantity Hedged | Unit of Measure | ||||
| (in thousands) | ||||||
| Copper |
62,494 | pounds | ||||
| Primary Aluminum |
31,962 | pounds | ||||
| Secondary Aluminum |
17,634 | pounds | ||||
| Silver |
78 | troy ounces | ||||
| Gold |
1 | troy ounces | ||||
| Foreign Currency |
||||||
| (in millions) | ||||||
| Hungarian Forint |
11,836 | HUF | ||||
| Mexican Peso |
6,829 | MXN | ||||
| South Korean Won |
3,804 | KRW | ||||
| Chinese Yuan Renminbi |
542 | CNY | ||||
| Japanese Yen |
509 | JPY | ||||
| Romanian Leu |
292 | RON | ||||
| New Turkish Lira |
138 | TRY | ||||
| Euro |
113 | EUR | ||||
| Polish Zloty |
90 | PLN | ||||
| Brazilian Real |
51 | BRL | ||||
| British Pound |
38 | GBP | ||||
| Singapore Dollar |
7 | SGD | ||||
The fair value of derivative financial instruments recorded in the consolidated balance sheets as of December 31, 2011 and 2010 are as follows:
| Asset Derivatives | Liability Derivatives | |||||||||||
| Balance Sheet Location | December 31, 2011 |
Balance Sheet Location | December 31, 2011 |
|||||||||
| Designated derivatives instruments: | (in millions) | |||||||||||
| Commodity derivatives |
Other Current Assets | $ | 1 | Accrued Liabilities | $ | 17 | ||||||
| Foreign currency derivatives |
Other Current Assets | 3 | Accrued Liabilities | — | ||||||||
| Foreign currency derivatives* |
Accrued Liabilities | 9 | Accrued Liabilities | 35 | ||||||||
| Commodity derivatives |
Other Long-Term Assets | — | Other Long-Term Liabilities | 11 | ||||||||
| Foreign currency derivatives* |
Other Long-Term Liabilities | 2 | Other Long-Term Liabilities | 17 | ||||||||
|
|
|
|
|
|||||||||
| Total |
$ | 15 | $ | 80 | ||||||||
|
|
|
|
|
|||||||||
| Derivatives not designated: |
||||||||||||
| None |
||||||||||||
| Asset Derivatives | Liability Derivatives | |||||||||||
| Balance Sheet Location | December 31, 2010 |
Balance Sheet Location | December 31, 2010 |
|||||||||
| Designated derivatives instruments: | (in millions) | |||||||||||
| Commodity derivatives |
Other Current Assets | $ | 37 | Accrued Liabilities | $ | — | ||||||
| Foreign currency derivatives |
Other Current Assets | 29 | Accrued Liabilities | — | ||||||||
| Foreign currency derivatives* |
Accrued Liabilities | — | Other Current Assets | 7 | ||||||||
| Commodity derivatives |
Other Long-Term Assets | 11 | Other Long-Term Liabilities | — | ||||||||
| Foreign currency derivatives |
Other Long-Term Assets | 10 | Other Long-Term Assets | 4 | ||||||||
|
|
|
|
|
|||||||||
| Total |
$ | 87 | $ | 11 | ||||||||
|
|
|
|
|
|||||||||
| Derivatives not designated: |
||||||||||||
| None |
||||||||||||
| * | Derivative instruments within this category are subject to master netting arrangements and are presented on a net basis in the consolidated balance sheets in accordance with accounting guidance related to the offsetting of amounts related to certain contracts. |
137
Table of Contents
The fair value of Delphi’s derivative financial instruments decreased from a net asset position at December 31, 2010 to a net liability position at December 31, 2011 primarily due to decreases in the forward rates of commodities and certain foreign currencies.
The effect of derivative financial instruments in the consolidated statement of operations for the year ended December 31, 2011 is as follows:
| Year ended December 31, 2011 |
Loss Recognized in OCI (Effective Portion) |
Gain Reclassified from OCI into Income (Effective Portion) |
Loss Recognized in Income (Ineffective Portion Excluded from Effectiveness Testing) |
|||||||||
| (in millions) | ||||||||||||
| Designated derivatives instruments: |
||||||||||||
| Commodity derivatives |
$ (52) | $ | 28 | $ (1) | ||||||||
| Foreign currency derivatives |
(56) | 18 | — | |||||||||
|
|
|
|
|
|
|
|||||||
| Total |
$ (108) | $ | 46 | $ (1) | ||||||||
|
|
|
|
|
|
|
|||||||
| Year ended December 31, 2011 |
Gain Recognized in Income |
|||
| (in millions) | ||||
| Derivatives not designated: |
||||
| Foreign currency derivatives |
$ 2 | |||
The effect of derivative financial instruments in the consolidated statement of operations for the year ended December 31, 2010 is as follows:
| Year ended December 31, 2010 |
Gain Recognized in OCI (Effective Portion) |
Gain Reclassified from OCI into Income (Effective Portion) |
Gain Recognized in Income (Ineffective Portion Excluded from Effectiveness Testing) |
|||||||||
| (in millions) | ||||||||||||
| Designated derivatives instruments: |
||||||||||||
| Commodity derivatives |
$ | 58 | $ | 12 | $ | — | ||||||
| Foreign currency derivatives |
48 | 15 | — | |||||||||
|
|
|
|
|
|
|
|||||||
| Total |
$ | 106 | $ | 27 | $ | — | ||||||
|
|
|
|
|
|
|
|||||||
| Year ended December 31, 2010 |
Gain Recognized in Income |
|||
| (in millions) | ||||
| Derivatives not designated: |
||||
| Commodity derivatives |
$ | 1 | ||
| Foreign currency derivatives |
4 | |||
|
|
|
|||
| Total |
$ | 5 | ||
|
|
|
|||
The gain or loss reclassified from OCI into income for the effective portion of designated derivative instruments and the gain or loss recognized in income for the ineffective portion of designated derivative instruments excluded from effectiveness testing were recorded to cost of sales in the consolidated statements of operations for the years ended December 31, 2011 and 2010. The gain or loss recognized in income for non-designated derivative instruments was recorded in other income (expense), net for the years ended December 31, 2011 and 2010.
138
Table of Contents
Gains and losses on derivatives qualifying as cash flow hedges are recorded in OCI, to the extent that hedges are effective, until the underlying transactions are recognized in earnings. Unrealized amounts in accumulated OCI will fluctuate based on changes in the fair value of hedge derivative contracts at each reporting period. Net losses included in accumulated OCI as of December 31, 2011 were $45 million after-tax ($71 million pre-tax). Of this pre-tax total, a loss of approximately $44 million is expected to be included in cost of sales within the next 12 months and a loss of approximately $27 million is expected to be included in cost of sales in subsequent periods. Cash flow hedges are discontinued when Delphi determines it is no longer probable that the originally forecasted transactions will occur. The amount included in cost of sales related to hedge ineffectiveness was approximately $1 million for the year ended December 31, 2011 and insignificant for the year ended December 31, 2010.
Fair value measurements
Fair Value Measurements on a Recurring Basis
All derivative instruments are required to be reported on the balance sheet at fair value unless the transactions qualify and are designated as normal purchases or sales. Changes in fair value are reported currently through earnings unless they meet hedge accounting criteria. Delphi’s derivative exposures are with counterparties with long-term investment grade credit ratings. Delphi estimates the fair value of its derivative contracts using an income approach based on valuation techniques to convert future amounts to a single, discounted amount. Estimates of the fair value of foreign currency and commodity derivative instruments are determined using exchange traded prices and rates. Delphi also considers the risk of non-performance in the estimation of fair value, and includes an adjustment for non-performance risk in the measure of fair value of derivative instruments. The non-performance risk adjustment reflects the credit default spread (“CDS”) applied to the net commodity and foreign currency exposures by counterparty. When Delphi is in a net derivative asset position, the counterparty CDS rates are applied to the net derivative asset position. When Delphi is in a net derivative liability position, estimates of peer companies’ CDS rates are applied to the net derivative liability position.
In certain instances where market data is not available, Delphi uses management judgment to develop assumptions that are used to determine fair value. This could include situations of market illiquidity for a particular currency or commodity or where observable market data may be limited. In those situations, Delphi generally surveys investment banks and/or brokers and utilizes the surveyed prices and rates in estimating fair value.
As of December 31, 2011 and 2010, Delphi was in a net derivative liability position of $65 million and net derivative asset position of $76 million, respectively, and no significant adjustments were recorded for nonperformance risk based on the application of peer companies’ CDS rates and because Delphi’s exposures were to counterparties with investment grade credit ratings.
As of December 31, 2011 and 2010, Delphi had the following assets measured at fair value on a recurring basis:
| As of December 31, 2011: | Total | Quoted Prices in Active Markets Level 1 |
Significant Other Observable Inputs Level 2 |
Significant Unobservable Inputs Level 3 |
||||||||||||
| (in millions) | ||||||||||||||||
| Commodity derivatives |
$ | 1 | $ | — | $ | 1 | $ | — | ||||||||
| Foreign currency derivatives |
3 | — | 3 | — | ||||||||||||
|
|
|
|
|
|
|
|
|
|||||||||
| Total |
$ | 4 | $ | — | $ | 4 | $ | — | ||||||||
|
|
|
|
|
|
|
|
|
|||||||||
139
Table of Contents
| Total | Quoted Prices in Active Markets Level 1 |
Significant Other Observable Inputs Level 2 |
Significant Unobservable Inputs Level 3 |
|||||||||||||
| (in millions) | ||||||||||||||||
| As of December 31, 2010: | ||||||||||||||||
| Time deposits |
$ | 550 | $ | — | $ | 550 | $ | — | ||||||||
| Available-for-sale securities |
12 | 12 | — | — | ||||||||||||
| Commodity derivatives |
48 | — | 48 | — | ||||||||||||
| Foreign currency derivatives |
28 | — | 28 | — | ||||||||||||
|
|
|
|
|
|
|
|
|
|||||||||
| Total |
$ | 638 | $ | 12 | $ | 626 | $ | — | ||||||||
|
|
|
|
|
|
|
|
|
|||||||||
As of December 31, 2011 and 2010, Delphi had the following liabilities measured at fair value on a recurring basis:
| As of December 31, 2011: | Total | Quoted Prices in Active Markets Level 1 |
Significant Other Observable Inputs Level 2 |
Significant Unobservable Inputs Level 3 |
||||||||||||
| (in millions) | ||||||||||||||||
| Commodity derivatives |
$ | 28 | $ | — | $ | 28 | $ | — | ||||||||
| Foreign currency derivatives |
41 | — | 41 | — | ||||||||||||
|
|
|
|
|
|
|
|
|
|||||||||
| Total |
$ | 69 | $ | — | $ | 69 | $ | — | ||||||||
|
|
|
|
|
|
|
|
|
|||||||||
| As of December 31, 2010: | ||||||||||||||||
| None |
||||||||||||||||
Fair Value Measurements on a Nonrecurring Basis
In addition to items that are measured at fair value on a recurring basis, Delphi also has items in its balance sheet that are measured at fair value on a nonrecurring basis. As these items are not measured at fair value on a recurring basis, they are not included in the tables above. Nonfinancial assets and liabilities that are measured at fair value on a nonrecurring basis include long-lived assets, intangible assets, asset retirement obligations and liabilities for exit or disposal activities measured at fair value upon initial recognition. No impairment charges were recorded during the year ended December 31, 2010. During the year ended December 31, 2011, Delphi recorded an impairment charge of $7 million to the carrying value of its investments in affiliates. Delphi determined that it was not probable that it would recover its investment. The fair value measurement of Delphi’s investment in this affiliate was based on Level 3 inputs.
18. OTHER INCOME (EXPENSE), NET
Other income (expense), net included:
| Successor | Predecessor | |||||||||||||||
| Year ended December 31, 2011 |
Year ended December 31, 2010 |
Period from August 19 to December 31, 2009 |
Period from January 1 to October 6, 2009 |
|||||||||||||
| (in millions) | (in millions) | |||||||||||||||
| Interest income |
$ | 31 | $ | 29 | $ | 5 | $ | 10 | ||||||||
| Costs associated with initial public offering |
(44) | — | — | — | ||||||||||||
| Impairment—investment in available-for-sale security |
(6) | (9) | — | — | ||||||||||||
| Loss on extinguishment of debt |
(16) | (8) | — | — | ||||||||||||
| Acquisition-related transaction costs |
— | — | (19) | — | ||||||||||||
| Other, net |
20 | 22 | (3) | 14 | ||||||||||||
|
|
|
|
|
|
|
|
|
|||||||||
| Other income (expense), net |
$ | (15) | $ | 34 | $ | (17) | $ | 24 | ||||||||
|
|
|
|
|
|
|
|
|
|||||||||
140
Table of Contents
During the year ended December 31, 2011, Delphi incurred approximately $44 million in transaction costs related to our initial public offering completed in November 2011. As further discussed in Note 12. Debt, during the year ended December 31, 2011, Delphi repaid $47 million and $177 million of the Tranche A Term Loan and Tranche B Term Loan, respectively and paid $57 million to extinguish the Old Notes, recognizing losses on extinguishments .
During the year ended December 31, 2010, Delphi repaid $12 million of interest-free government-backed debt due in 2021 which required compensating cash collateral. The debt was previously adjusted to a $4 million fair value as a result of acquisition accounting and therefore Delphi recognized an $8 million loss on early extinguishment of debt. Other, net primarily includes insurance and other recoveries and income from royalties.
The Successor recognized $19 million of transaction costs related to the Acquisition for the period from August 19 to December 31, 2009.
19. ACQUISITIONS AND DIVESTITURES
Acquisitions
In May 2011, Delphi’s Powertrain segment completed the acquisition of a manufacturer of specialized diesel testing equipment for a purchase price of $19 million. The acquisition was not material to the Company’s consolidated financial statements. In connection with the acquisition, the Company recorded goodwill of approximately $8 million. The purchase price allocation was finalized to reflect final valuation studies.
Sale of Daesung investment
On January 31, 2011, Delphi completed the sale of its 49.5% ownership interest in Daesung Electric, Co., Ltd. Delphi received $35 million in net proceeds and recognized a gain on divestiture of $8 million, which is included in equity income, net of tax, in the consolidated statement of operations.
Sale of occupant protection systems
On March 31, 2010, Delphi completed the sale of its occupant protection systems business in Asia to Autoliv AB. Delphi received net proceeds of $71 million and recognized a gain on divestiture of $10 million, which is included in cost of sales in the consolidated statement of operations in 2010. The results of operations, including the gain or loss on divestiture were not significant to the consolidated financial statements in any period presented, and this divestiture did not meet the discontinued operations criteria.
20. DISCONTINUED OPERATIONS
The Court approval of Delphi’s plan to dispose of the Steering Business and the interiors and closures business triggered held for sale accounting in 2007. The Court approval of bidding procedures for the sale of the remaining assets of the chassis business on April 23, 2009 and subsequent approval of the sale triggered held for sale accounting for AHG in the second quarter of 2009.
Steering and halfshaft business
In conjunction with the consummation of the Modified Plan on the Acquisition Date, an affiliate of GM acquired the Steering Business. Refer to Note 1. General for further information. During the period from January 1 to October 6, 2009, the Predecessor recorded a loss of $24 million, net of tax, due to the results of operations and adjustment of assets held for sale to fair value of the Steering Business.
141
Table of Contents
Automotive Holdings Group
AHG included various non-core product lines and plant sites that did not fit the Predecessor’s strategic framework. As part of the Acquisition, the global suspensions and brake business of AHG was acquired by Delphi. Substantially all of the remainder of AHG emerged from chapter 11 as part of DPHH, and, therefore, is not included in Delphi’s consolidated financial statements for the period ended December 31, 2009.
Global suspension and brakes business sale—On March 31, 2009, the Predecessor announced that it had entered into an asset sale and purchase agreement with BeijingWest Industries Co., Ltd. (“BWI”) for the sale of Delphi’s remaining chassis business, the global suspension and brakes business, whereby BWI would acquire machinery and equipment, intellectual property and certain real property for a purchase price of approximately $90 million, which is subject to certain adjustments. Certain customer and supplier contracts were also to be assumed and/or assigned to BWI. The 2008 annual revenues for the global suspension and brakes business were $670 million. The closing of the sale occurred in October 2009 and Delphi received net proceeds of $82 million, which, under the terms of the Acquisition were transferred, net of Delphi’s costs in connection with the sale, to GM during the Successor period from August 19 to December 31, 2009. During the period from January 1 to October 6, 2009, a held for sale loss of $29 million was recognized by the Predecessor to reflect the revaluation of the disposal group to fair value based on the estimated proceeds of the sale agreement.
Results of discontinued operations
The Steering Business, through the Acquisition Date and AHG, through the date of the respective divestitures within AHG, are reported as discontinued operations in the consolidated statement of operations and statement of cash flows of the Predecessor for the period from January 1 to October 6, 2009.
The results of the discontinued operations are summarized as follows:
| Predecessor | ||||
| Period from January 1 to October 6, 2009 |
||||
| (in millions) | ||||
| Total sales |
$ | 1,524 | ||
| Loss before income taxes (including equity income, net of tax) |
$ | (28) | ||
| Provision for income taxes |
(17) | |||
|
|
|
|||
| Loss attributable to discontinued operations |
$ | (45) | ||
|
|
|
|||
21. SHARE-BASED COMPENSATION
2011 Delphi Long Term Incentive Plan
In November 2011, the Delphi Automotive PLC Long Term Incentive Plan (the “PLC LTIP”) was established, which allowed for the grant of awards up to 22,977,116 shares. The awards can be in the form of shares, options, stock appreciation rights, restricted stock, restricted stock units (“RSUs”), performance awards, and other share-based awards to the employees, directors, consultants or advisors of the Company.
On November 22, 2011, Delphi granted 51,003 RSUs to the Board of Directors at a grant date fair value of approximately $1 million. The grant date fair value was determined based on the closing price of the Company’s ordinary shares on November 22, 2011. The RSUs become fully vested on June 13, 2012.
142
Table of Contents
A summary of activity, including award grants, vesting and forfeitures is provided below.
| RSUs | ||
| (in thousands) | ||
| Outstanding, January 1, 2011 |
— | |
| Granted |
51 | |
| Vested |
(10) | |
| Forfeited |
— | |
|
| ||
| Outstanding, December 31, 2011 |
41 | |
|
|
2010 Board of Managers Equity Award
In June 2010, the 2010 Board of Managers Class E-1 Interest Incentive Plan (the “Plan”) was authorized in order to attract and reward board members and to promote the creation of long-term value for interest holders of Delphi. On June 30, 2010, 24,000 restricted interests of a newly created class of membership interests, Class E-1 membership interests, were issued to board members. The restricted interests were initially subject to continued service through applicable vesting dates as follows:
| • | 20% on November 1, 2010 |
| • | 40% on November 1, 2011 |
| • | 40% on November 1, 2012 |
However, in conjunction with the completion of the initial public offering in November 2011, these interests were exchanged for 1,938,249 ordinary shares of Delphi Automotive PLC.
Under certain conditions with respect to an initial public offering or a change in control, as defined in the Plan, any interests that had not yet vested would immediately vest. Because Delphi completed an initial public offering on November 22, 2011, and the resulting total equity valuation of the Company (based on the average closing price of Delphi shares during the 15-day period beginning on the 30th day after the closing of the offering), plus the value of prior distributions made under the LLP agreement effective in that period to holders of membership interests (as well as $4.4 billion paid to repurchase Class A and Class C membership interests (Refer to Note 1. General for more information)), any Class B membership interest repurchases, any additional distributions to Class B and Class E-1 membership interest holders and any amounts distributed or paid to holders of Class E-1 membership interests with respect to or to repurchase their Class E-1 membership interests), was greater than $6 billion, the remaining unvested interests fully vested. Approximately $8 million of compensation expense was recognized in 2011 since the criteria for accelerated vesting was met.
At the time of issuance, the fair market value of the Class E-1 membership interests was estimated to be $19 million, based on a contemporaneous valuation performed by an independent valuation specialist, utilizing generally accepted valuation approaches. Beginning in the third quarter of 2010, Delphi recognized compensation cost on a straight-line basis. Compensation expense recognized during the years ended December 31, 2011 and 2010 totaled $14 million and $5 million, net of tax of $0, respectively. There were no cash flow impacts for the years ended December 31, 2011 and 2010.
2010 Executive Long Term Incentive Plan
During the second quarter of 2010, the Board of Managers approved and authorized the VCP, a long-term incentive plan designed to assist the Company in attracting, retaining, motivating and rewarding key employees of the Company, and promoting the creation of long-term value. Participants were granted an award in September 2010 for the period ending December 31, 2012. Each individual participant’s target value was based
143
Table of Contents
on the participants’ level of responsibility within the Company and the country in which the participant is located. The awards cliff vest fully at the end of the performance period, but may immediately fully vest upon a change in control, as defined in the VCP, for certain participants. In the event of a qualified termination, as defined, the participant shall vest in a pro-rata percentage of their award as of the termination date. For any other termination, the award shall be forfeited.
The amounts to be settled under the VCP will be determined based on Delphi’s enterprise value and accumulated distributions (as well as $4.4 billion paid to repurchase Class A and Class C membership interests (Refer to Note 1. General for more information)), any Class B membership interest repurchases, any additional distributions to Class B and Class E-1 membership interest holders and any amounts distributed to holders of Class E-1 membership interests to repurchase their Class E-1 membership interests) as of December 31, 2012, compared to a target enterprise value of $8.25 billion. An enterprise value of $2.5 billion must be achieved to receive a minimum award payout and above this level the payout is determined as a percentage of the target award. The authorized target amount of the awards is $135 million (of which $105 million are outstanding as of December 31, 2011), but the ultimate final settlement amount of the awards could be higher or lower, depending on the enterprise value of Delphi at December 31, 2012. The estimated fair value of the awards granted as of December 31, 2011 was $186 million. Because of Delphi’s completed initial public offering, the estimated enterprise value will be based on the average daily closing market price of the Company between November 17, 2011 and the end of the performance period, plus any distributions to holders of all membership interests and the approximately $4.4 billion paid to repurchase Class A and Class C membership interests, any Class B membership interest repurchases, any additional distributions to Class B and Class E-1 membership interest holders and any amounts distributed to holders of Class E-1 membership interests with respect to or to repurchase their Class E-1 membership interests. Delphi recognized compensation cost in 2011 and 2010 and will continue to recognize compensation cost, based on estimates of the enterprise value, over the requisite vesting periods of the awards. Compensation expense recognized during the years ended December 31, 2011 and 2010 totaled $76 million ($61 million, net of tax) and $31 million ($21 million, net of tax), respectively. Based on the estimate of enterprise value as of December 31, 2011, unrecognized compensation expense on a pretax basis of approximately $79 million is anticipated to be recognized during 2012. There were no cash flow impacts for the years ended December 31, 2011 and 2010.
Final settlement can be made in cash or ordinary shares or a combination thereof as provided in the participation agreement or as otherwise determined by the Compensation and Human Resources Committee of the Board of Directors.
The VCP awards are accounted for as liability awards pursuant to FASB ASC 718, Compensation-Stock Compensation. Estimating the fair value of the liability awards under the VCP requires assumptions regarding the Company’s enterprise value. Any differences in actual results from management’s estimates could result in fair values different from estimated fair values, which could materially impact the Company’s future results of operations and financial condition. Prior to public quoted market prices for averages to determine fair value estimates for VCP, the fair market value of the liability awards were based on contemporaneous valuations performed by an independent valuation specialist, utilizing generally accepted valuation approaches.
Significant Factors, Assumptions, and Methodologies Used in Estimating Fair Value of Enterprise Value for VCP Awards and Fair Value of E-1 Membership Interests
The estimated fair value of the Class E-1 membership interests were based on a contemporaneous valuation performed as of the grant date. The liability awards under the VCP were based on contemporaneous valuations performed periodically by an independent valuation specialist. Both the Class E-1 membership interests and VCP valuations utilize appropriate weighting of the market and income approaches.
Market Approach: The market approach measures the value of a company through analysis of recent sales or offerings of comparable companies. Based on analysis of guideline public companies and guideline merged or
144
Table of Contents
acquired companies, Delphi utilized 2010 EBITDA and 2011 EBITDA multiples of 4.5x-6.25x to value the Class E-1 membership interests and VCP awards in periods prior to the completion of the initial public offering.
In addition to the guideline public company and guideline merged or acquired company approaches, the Company considered the trading price of its Class B membership interests by qualified institutional investors in determining the enterprise value of the Company in periods prior to the completion of the initial public offering.
Income Approach: The income approach derives the value of a company based on assumptions about the company’s future stream of cash flows. Delphi provided its independent valuation specialist with projected net sales, expenses and cash flows for the years ended December 31, 2010, 2011 and 2012 for the Class E-1 awards and for the years ended December 31, 2010, 2011, 2012 and 2013 for the VCP awards. These financial projections represent management’s best estimate at the time of the contemporaneous valuations. Discount rates used to determine the present value of future cash flows were based on the weighted average cost of capital which ranged from 11.6%-13.7%.
Predecessor Plans
At the Acquisition Date, all outstanding common stock of the Predecessor, including all stock options exercisable, were cancelled. Prior to the Acquisition Date, the Predecessor’s share-based compensation programs included stock options, restricted stock units, and stock appreciation rights.
22. SUPPLEMENTAL GUARANTOR AND NON-GUARANTOR CONDENSED CONSOLIDATING FINANCIAL STATEMENTS
Basis of Presentation
In May 2011, Delphi Corporation issued the Senior Notes in a transaction exempt from registration under Rule 144A and Regulation S of the Securities Act. Refer to Note 12. Debt for more information. All obligations under the Senior Notes are borrowed by Delphi Corporation (“Subsidiary Issuer”) and are fully and unconditionally guaranteed by its direct and indirect parent companies and by certain of Delphi Automotive PLC’s direct and indirect U.S. subsidiaries (the “Parent Companies”) on a joint and several basis, subject to customary release provisions. Subsidiaries not subject to the guarantee (“Non-Guarantor Subsidiaries”) consist primarily of the non-U.S. subsidiaries of the Company.
In lieu of providing separate audited financial statements for the Guarantors, the Company has included the accompanying condensed consolidating financial statements. These condensed consolidating financial statements are presented on the equity method. Under this method, the investments in subsidiaries are recorded at cost and adjusted for the parent’s share of the subsidiary’s cumulative results of operations, capital contributions and distributions and other equity changes. The Guarantor subsidiaries are combined in the condensed consolidating financial statements. The principal elimination entries are to eliminate the investments in subsidiaries and intercompany balances and transactions.
145
Table of Contents
Periods prior to the Acquisition Date are not presented as the information is not meaningful under the Predecessor corporate structure.
Statement of Operations Year Ended December 31, 2011
| Parent Companies |
Subsidiary Issuer |
Guarantor Subsidiaries |
Non- Guarantor Subsidiaries |
Eliminations | Consolidated | |||||||||||||||||||
| (in millions) | ||||||||||||||||||||||||
| Net sales |
$ | — | $ | — | $ | 5,292 | $ | 12,225 | $ | (1,476) | $ | 16,041 | ||||||||||||
| Operating expenses: |
||||||||||||||||||||||||
| Cost of sales |
— | — | 4,754 | 10,124 | (1,492) | 13,386 | ||||||||||||||||||
| Selling, general and administrative |
118 | — | 272 | 511 | — | 901 | ||||||||||||||||||
| Amortization |
— | — | 53 | 26 | — | 79 | ||||||||||||||||||
| Restructuring |
— | — | 3 | 28 | — | 31 | ||||||||||||||||||
|
|
|
|
|
|
|
|
|
|
|
|
|
|||||||||||||
| Total operating expenses |
118 | — | 5,082 | 10,689 | (1,492) | 14,397 | ||||||||||||||||||
|
|
|
|
|
|
|
|
|
|
|
|
|
|||||||||||||
| Operating (loss) income |
(118) | — | 210 | 1,536 | 16 | 1,644 | ||||||||||||||||||
| Interest expense |
(37) | (101) | (1) | (26) | 42 | (123) | ||||||||||||||||||
| Other (expense) income, net |
(38) | 27 | 3 | 36 | (43) | (15) | ||||||||||||||||||
|
|
|
|
|
|
|
|
|
|
|
|
|
|||||||||||||
| (Loss) income before income taxes and equity income |
(193) | (74) | 212 | 1,546 | 15 | 1,506 | ||||||||||||||||||
| Income tax benefit (expense) |
3 | 27 | (91) | (238) | (6) | (305) | ||||||||||||||||||
|
|
|
|
|
|
|
|
|
|
|
|
|
|||||||||||||
| (Loss) income before equity income |
(190) | (47) | 121 | 1,308 | 9 | 1,201 | ||||||||||||||||||
| Equity in net income (loss) of affiliates |
— | — | — | 22 | — | 22 | ||||||||||||||||||
| Equity in net income (loss) of subsidiaries |
1,335 | 121 | — | — | (1,456) | — | ||||||||||||||||||
|
|
|
|
|
|
|
|
|
|
|
|
|
|||||||||||||
| Net income (loss) |
1,145 | 74 | 121 | 1,330 | (1,447) | 1,223 | ||||||||||||||||||
| Net income attributable to noncontrolling interest |
— | — | — | 78 | — | 78 | ||||||||||||||||||
|
|
|
|
|
|
|
|
|
|
|
|
|
|||||||||||||
| Net income (loss) attributable to Delphi |
$ | 1,145 | $ | 74 | $ | 121 | $ | 1,252 | $ | (1,447) | $ | 1,145 | ||||||||||||
|
|
|
|
|
|
|
|
|
|
|
|
|
|||||||||||||
| Statement of Operations Year Ended December 31, 2010 | ||||||||||||||||||||||||
| Parent Companies |
Subsidiary Issuer |
Guarantor Subsidiaries |
Non- Guarantor Subsidiaries |
Eliminations | Consolidated | |||||||||||||||||||
| (in millions) | ||||||||||||||||||||||||
| Net sales |
$ | — | $ | — | $ | 4,870 | $ | 10,259 | $ | (1,312) | $ | 13,817 | ||||||||||||
| Operating expenses: |
||||||||||||||||||||||||
| Cost of sales |
— | — | 4,238 | 8,865 | (1,335) | 11,768 | ||||||||||||||||||
| Selling, general and administrative |
121 | — | 259 | 435 | — | 815 | ||||||||||||||||||
| Amortization |
— | — | 49 | 21 | — | 70 | ||||||||||||||||||
| Restructuring |
— | — | 11 | 213 | — | 224 | ||||||||||||||||||
|
|
|
|
|
|
|
|
|
|
|
|
|
|||||||||||||
| Total operating expenses |
121 | — | 4,557 | 9,534 | (1,335) | 12,877 | ||||||||||||||||||
|
|
|
|
|
|
|
|
|
|
|
|
|
|||||||||||||
| Operating (loss) income |
(121) | — | 313 | 725 | 23 | 940 | ||||||||||||||||||
| Interest expense |
— | — | (3) | (27) | — | (30) | ||||||||||||||||||
| Other income (expense), net |
— | — | 17 | 18 | (1) | 34 | ||||||||||||||||||
|
|
|
|
|
|
|
|
|
|
|
|
|
|||||||||||||
| (Loss) income before income taxes and equity income (loss) |
(121) | — | 327 | 716 | 22 | 944 | ||||||||||||||||||
| Income tax expense |
(1) | — | (94) | (156) | (7) | (258) | ||||||||||||||||||
|
|
|
|
|
|
|
|
|
|
|
|
|
|||||||||||||
| (Loss) income before equity income (loss) |
(122) | — | 233 | 560 | 15 | 686 | ||||||||||||||||||
| Equity in net income of affiliates |
— | — | — | 17 | — | 17 | ||||||||||||||||||
| Equity in net income (loss) of subsidiaries |
753 | 233 | — | — | (986) | — | ||||||||||||||||||
|
|
|
|
|
|
|
|
|
|
|
|
|
|||||||||||||
| Net income (loss) |
631 | 233 | 233 | 577 | (971) | 703 | ||||||||||||||||||
| Net income attributable to noncontrolling interest |
— | — | — | 72 | — | 72 | ||||||||||||||||||
|
|
|
|
|
|
|
|
|
|
|
|
|
|||||||||||||
| Net income (loss) attributable to Delphi |
$ | 631 | $ | 233 | $ | 233 | $ | 505 | $ | (971) | $ | 631 | ||||||||||||
|
|
|
|
|
|
|
|
|
|
|
|
|
|||||||||||||
146
Table of Contents
Statement of Operations Period from August 19 to December 31, 2009
| Parent Companies |
Subsidiary Issuer |
Guarantor Subsidiaries |
Non- Guarantor Subsidiaries |
Eliminations | Consolidated | |||||||||||||||||||
| (in millions) | ||||||||||||||||||||||||
| Net sales |
$ | — | $ | — | $ | 1,178 | $ | 2,588 | $ | (345) | $ | 3,421 | ||||||||||||
| Operating expenses: |
||||||||||||||||||||||||
| Cost of sales |
— | — | 1,135 | 2,256 | (344) | 3,047 | ||||||||||||||||||
| Selling, general and administrative |
4 | 3 | 98 | 139 | (2) | 242 | ||||||||||||||||||
| Amortization |
— | — | 10 | 6 | — | 16 | ||||||||||||||||||
| Restructuring |
— | — | 26 | 100 | — | 126 | ||||||||||||||||||
|
|
|
|
|
|
|
|
|
|
|
|
|
|||||||||||||
| Total operating expenses |
4 | 3 | 1,269 | 2,501 | (346) | 3,431 | ||||||||||||||||||
|
|
|
|
|
|
|
|
|
|
|
|
|
|||||||||||||
| Operating (loss) income |
(4) | (3) | (91) | 87 | 1 | (10) | ||||||||||||||||||
| Interest expense |
— | — | (1) | (6) | (1) | (8) | ||||||||||||||||||
| Other (expense) income, net |
(19) | 1 | 6 | (5) | — | (17) | ||||||||||||||||||
|
|
|
|
|
|
|
|
|
|
|
|
|
|||||||||||||
| (Loss) income before income taxes and equity income (loss) |
(23) | (2) | (86) | 76 | — | (35) | ||||||||||||||||||
| Income tax benefit (expense) |
1 | — | 37 | (11) | — | 27 | ||||||||||||||||||
|
|
|
|
|
|
|
|
|
|
|
|
|
|||||||||||||
| (Loss) income before equity income |
(22) | (2) | (49) | 65 | — | (8) | ||||||||||||||||||
| Equity in net income of affiliates |
— | — | — | 5 | — | 5 | ||||||||||||||||||
| Equity in net income (loss) of subsidiaries |
4 | (49) | — | — | 45 | — | ||||||||||||||||||
|
|
|
|
|
|
|
|
|
|
|
|
|
|||||||||||||
| Net (loss) income |
(18) | (51) | (49) | 70 | 45 | (3) | ||||||||||||||||||
| Net income attributable to noncontrolling interest |
— | — | — | 15 | — | 15 | ||||||||||||||||||
|
|
|
|
|
|
|
|
|
|
|
|
|
|||||||||||||
| Net (loss) income attributable to Delphi |
$ | (18) | $ | (51) | $ | (49) | $ | 55 | $ | 45 | $ | (18) | ||||||||||||
|
|
|
|
|
|
|
|
|
|
|
|
|
|||||||||||||
Statement of Comprehensive Income Year Ended December 31, 2011
| Parent Companies |
Subsidiary Issuer |
Guarantor Subsidiaries |
Non- Guarantor Subsidiaries |
Eliminations | Consolidated | |||||||||||||||||||
| (in millions) | ||||||||||||||||||||||||
| Net income (loss) |
$ | 1,145 | $ | 74 | $ | 121 | $ | 1,330 | $ | (1,447) | $ | 1,223 | ||||||||||||
| Other comprehensive (loss) income: |
||||||||||||||||||||||||
| Currency translation adjustments |
— | — | — | (94) | — | (94) | ||||||||||||||||||
| Net change in unrecognized gain (loss) on derivative instruments, net of tax |
— | — | (98) | — | — | (98) | ||||||||||||||||||
| Employee benefit plans adjustment, net of tax |
— | — | (4) | (73) | — | (77) | ||||||||||||||||||
|
|
|
|
|
|
|
|
|
|
|
|
|
|||||||||||||
| Other comprehensive (loss) income |
— | — | (102) | (167) | — | (269) | ||||||||||||||||||
|
|
|
|
|
|
|
|
|
|
|
|
|
|||||||||||||
| Equity in other comprehensive (loss) income of subsidiaries |
(274) | (102) | — | — | 376 | — | ||||||||||||||||||
|
|
|
|
|
|
|
|
|
|
|
|
|
|||||||||||||
| Comprehensive income |
871 | (28) | 19 | 1,163 | (1,071) | 954 | ||||||||||||||||||
| Comprehensive income attributable to noncontrolling interests |
— | — | — | 83 | — | 83 | ||||||||||||||||||
|
|
|
|
|
|
|
|
|
|
|
|
|
|||||||||||||
| Comprehensive income attributable to Successor/Predecessor |
$ | 871 | $ | (28) | $ | 19 | $ | 1,080 | $ | (1,071) | $ | 871 | ||||||||||||
|
|
|
|
|
|
|
|
|
|
|
|
|
|||||||||||||
Statement of Comprehensive Income Year Ended December 31, 2010
| Parent Companies |
Subsidiary Issuer |
Guarantor Subsidiaries |
Non- Guarantor Subsidiaries |
Eliminations | Consolidated | |||||||||||||||||||
| (in millions) | ||||||||||||||||||||||||
| Net income (loss) |
$ | 631 | $ | 233 | $ | 233 | $ | 577 | $ | (971) | $ | 703 | ||||||||||||
| Other comprehensive (loss) income: |
||||||||||||||||||||||||
| Currency translation adjustments |
— | — | — | (4) | — | (4) | ||||||||||||||||||
| Net change in unrecognized gain (loss) on derivative instruments, net of tax |
— | — | 48 | — | — | 48 | ||||||||||||||||||
| Employee benefit plans adjustment, net of tax |
— | — | — | 26 | — | 26 | ||||||||||||||||||
|
|
|
|
|
|
|
|
|
|
|
|
|
|||||||||||||
| Other comprehensive (loss) income |
— | — | 48 | 22 | — | 70 | ||||||||||||||||||
|
|
|
|
|
|
|
|
|
|
|
|
|
|||||||||||||
| Equity in other comprehensive income (loss) of subsidiaries |
67 | 48 | — | — | (115) | — | ||||||||||||||||||
|
|
|
|
|
|
|
|
|
|
|
|
|
|||||||||||||
| Comprehensive income |
698 | 281 | 281 | 599 | (1,086) | 773 | ||||||||||||||||||
| Comprehensive income attributable to noncontrolling interests |
— | — | — | 75 | — | 75 | ||||||||||||||||||
|
|
|
|
|
|
|
|
|
|
|
|
|
|||||||||||||
| Comprehensive income attributable to Successor/Predecessor |
$ | 698 | $ | 281 | $ | 281 | $ | 524 | $ | (1,086) | $ | 698 | ||||||||||||
|
|
|
|
|
|
|
|
|
|
|
|
|
|||||||||||||
147
Table of Contents
Statement of Comprehensive Income from August 19 to December 31, 2009
| Parent Companies |
Subsidiary Issuer |
Guarantor Subsidiaries |
Non- Guarantor Subsidiaries |
Eliminations | Consolidated | |||||||||||||||||||
| (in millions) | ||||||||||||||||||||||||
| Net income (loss) |
$ | (18) | $ | (51) | $ | (49) | $ | 70 | $ | 45 | $ | (3) | ||||||||||||
| Other comprehensive (loss) income: |
||||||||||||||||||||||||
| Currency translation adjustments |
— | — | — | (16) | — | (16) | ||||||||||||||||||
| Net change in unrecognized gain (loss) on derivative instruments, net of tax |
— | — | 5 | — | — | 5 | ||||||||||||||||||
| Employee benefit plans adjustment, net of tax |
— | — | — | 33 | — | 33 | ||||||||||||||||||
|
|
|
|
|
|
|
|
|
|
|
|
|
|||||||||||||
| Other comprehensive (loss) income |
— | — | 5 | 17 | — | 22 | ||||||||||||||||||
|
|
|
|
|
|
|
|
|
|
|
|
|
|||||||||||||
| Equity in other comprehensive income (loss) of subsidiaries |
24 | 5 | — | — | (29) | — | ||||||||||||||||||
|
|
|
|
|
|
|
|
|
|
|
|
|
|||||||||||||
| Comprehensive income |
6 | (46) | (44) | 87 | 16 | 19 | ||||||||||||||||||
| Comprehensive income attributable to noncontrolling interests |
— | — | — | 13 | — | 13 | ||||||||||||||||||
|
|
|
|
|
|
|
|
|
|
|
|
|
|||||||||||||
| Comprehensive income attributable to Successor/Predecessor |
$ | 6 | $ | (46) | $ | (44) | $ | 74 | $ | 16 | $ | 6 | ||||||||||||
|
|
|
|
|
|
|
|
|
|
|
|
|
|||||||||||||
Balance Sheet as of December 31, 2011
| Parent Companies |
Subsidiary Issuer |
Guarantor Subsidiaries |
Non- Guarantor Subsidiaries |
Eliminations | Consolidated | |||||||||||||||||||
| ASSETS | (in millions) | |||||||||||||||||||||||
| Current assets: |
||||||||||||||||||||||||
| Cash and cash equivalents |
$ | 53 | $ | — | $ | 186 | $ | 1,124 | $ | — | $ | 1,363 | ||||||||||||
| Restricted cash |
— | — | — | 9 | — | 9 | ||||||||||||||||||
| Accounts receivable |
— | — | 636 | 1,823 | — | 2,459 | ||||||||||||||||||
| Inventories |
— | — | 294 | 768 | (8) | 1,054 | ||||||||||||||||||
| Other current assets |
— | 17 | 157 | 446 | (4) | 616 | ||||||||||||||||||
|
|
|
|
|
|
|
|
|
|
|
|
|
|||||||||||||
| Total current assets |
53 | 17 | 1,273 | 4,170 | (12) | 5,501 | ||||||||||||||||||
| Long-term assets: |
||||||||||||||||||||||||
| Property, net |
— | — | 514 | 1,801 | — | 2,315 | ||||||||||||||||||
| Intangible assets, net |
— | — | 438 | 158 | — | 596 | ||||||||||||||||||
| Investments in affiliates |
— | — | — | 257 | — | 257 | ||||||||||||||||||
| Investments in subsidiaries |
3,302 | 690 | — | — | (3,992) | — | ||||||||||||||||||
| Other long-term assets |
3 | 71 | 19 | 364 | 2 | 459 | ||||||||||||||||||
|
|
|
|
|
|
|
|
|
|
|
|
|
|||||||||||||
| Total long-term assets |
3,305 | 761 | 971 | 2,580 | (3,990) | 3,627 | ||||||||||||||||||
|
|
|
|
|
|
|
|
|
|
|
|
|
|||||||||||||
| Total assets |
$ | 3,358 | $ | 778 | $ | 2,244 | $ | 6,750 | $ | (4,002) | $ | 9,128 | ||||||||||||
|
|
|
|
|
|
|
|
|
|
|
|
|
|||||||||||||
| LIABILITIES AND SHAREHOLDERS’ EQUITY | ||||||||||||||||||||||||
| Current liabilities: |
||||||||||||||||||||||||
| Short-term debt |
$ | — | $ | — | $ | 20 | $ | 87 | $ | — | $ | 107 | ||||||||||||
| Accounts payable |
2 | — | 565 | 1,830 | — | 2,397 | ||||||||||||||||||
| Accrued liabilities |
2 | 9 | 292 | 908 | (3) | 1,208 | ||||||||||||||||||
|
|
|
|
|
|
|
|
|
|
|
|
|
|||||||||||||
| Total current liabilities |
4 | 9 | 877 | 2,825 | (3) | 3,712 | ||||||||||||||||||
| Long-term liabilities: |
||||||||||||||||||||||||
| Long-term debt |
— | 1,981 | 5 | 10 | — | 1,996 | ||||||||||||||||||
| Intercompany accounts, net |
1,666 | (1,307) | 296 | (654) | (1) | — | ||||||||||||||||||
| Pension benefit obligations |
— | — | 78 | 596 | — | 674 | ||||||||||||||||||
| Other long-term liabilities |
— | — | 298 | 275 | 2 | 575 | ||||||||||||||||||
|
|
|
|
|
|
|
|
|
|
|
|
|
|||||||||||||
| Total long-term liabilities |
1,666 | 674 | 677 | 227 | 1 | 3,245 | ||||||||||||||||||
|
|
|
|
|
|
|
|
|
|
|
|
|
|||||||||||||
| Total liabilities |
1,670 | 683 | 1,554 | 3,052 | (2) | 6,957 | ||||||||||||||||||
|
|
|
|
|
|
|
|
|
|
|
|
|
|||||||||||||
| Total Delphi shareholders’ equity |
1,688 | 95 | 690 | 3,215 | (4,000) | 1,688 | ||||||||||||||||||
| Noncontrolling interest |
— | — | — | 483 | — | 483 | ||||||||||||||||||
|
|
|
|
|
|
|
|
|
|
|
|
|
|||||||||||||
| Total shareholders’ equity |
1,688 | 95 | 690 | 3,698 | (4,000) | 2,171 | ||||||||||||||||||
|
|
|
|
|
|
|
|
|
|
|
|
|
|||||||||||||
| Total liabilities and shareholders’ equity |
$ | 3,358 | $ | 778 | $ | 2,244 | $ | 6,750 | $ | (4,002) | $ | 9,128 | ||||||||||||
|
|
|
|
|
|
|
|
|
|
|
|
|
|||||||||||||
148
Table of Contents
Balance Sheet as of December 31, 2010
| Parent Companies |
Subsidiary Issuer |
Guarantor Subsidiaries |
Non- Guarantor Subsidiaries |
Eliminations | Consolidated | |||||||||||||||||||
| ASSETS | (in millions) | |||||||||||||||||||||||
| Current assets: |
||||||||||||||||||||||||
| Cash and cash equivalents |
$ | 6 | $ | — | $ | 2,010 | $ | 1,203 | $ | — | $ | 3,219 | ||||||||||||
| Restricted cash |
— | — | 25 | 22 | — | 47 | ||||||||||||||||||
| Time Deposits |
— | — | 550 | — | — | 550 | ||||||||||||||||||
| Accounts receivable |
— | — | 621 | 1,686 | — | 2,307 | ||||||||||||||||||
| Inventories |
— | — | 301 | 692 | (5) | 988 | ||||||||||||||||||
| Other current assets |
— | — | 150 | 405 | — | 555 | ||||||||||||||||||
|
|
|
|
|
|
|
|
|
|
|
|
|
|||||||||||||
| Total current assets |
6 | — | 3,657 | 4,008 | (5) | 7,666 | ||||||||||||||||||
| Long-term assets: |
||||||||||||||||||||||||
| Property, net |
— | — | 437 | 1,630 | — | 2,067 | ||||||||||||||||||
| Intangible assets, net |
— | — | 494 | 171 | — | 665 | ||||||||||||||||||
| Investments in affiliates |
— | — | — | 281 | — | 281 | ||||||||||||||||||
| Investments in subsidiaries |
5,743 | 3,355 | — | — | (9,098) | — | ||||||||||||||||||
| Other long-term assets |
4 | — | 57 | 342 | — | 403 | ||||||||||||||||||
|
|
|
|
|
|
|
|
|
|
|
|
|
|||||||||||||
| Total long-term assets |
5,747 | 3,355 | 988 | 2,424 | (9,098) | 3,416 | ||||||||||||||||||
|
|
|
|
|
|
|
|
|
|
|
|
|
|||||||||||||
| Total assets |
$ | 5,753 | $ | 3,355 | $ | 4,645 | $ | 6,432 | $ | (9,103) | $ | 11,082 | ||||||||||||
|
|
|
|
|
|
|
|
|
|
|
|
|
|||||||||||||
| LIABILITIES AND SHAREHOLDERS’ EQUITY | ||||||||||||||||||||||||
| Current liabilities: |
||||||||||||||||||||||||
| Short-term debt |
$ | — | $ | — | $ | 18 | $ | 200 | $ | — | $ | 218 | ||||||||||||
| Accounts payable |
— | — | 527 | 1,709 | — | 2,236 | ||||||||||||||||||
| Accrued liabilities |
2 | — | 250 | 1,013 | — | 1,265 | ||||||||||||||||||
|
|
|
|
|
|
|
|
|
|
|
|
|
|||||||||||||
| Total current liabilities |
2 | — | 795 | 2,922 | — | 3,719 | ||||||||||||||||||
| Long-term liabilities: |
||||||||||||||||||||||||
| Long-term debt |
— | — | 8 | 63 | — | 71 | ||||||||||||||||||
| Intercompany accounts, net |
110 | (11) | 75 | (174) | — | — | ||||||||||||||||||
| Pension benefit obligations |
— | — | 80 | 597 | — | 677 | ||||||||||||||||||
| Other long-term liabilities |
— | — | 332 | 184 | — | 516 | ||||||||||||||||||
|
|
|
|
|
|
|
|
|
|
|
|
|
|||||||||||||
| Total long-term liabilities |
110 | (11) | 495 | 670 | — | 1,264 | ||||||||||||||||||
|
|
|
|
|
|
|
|
|
|
|
|
|
|||||||||||||
| Total liabilities |
112 | (11) | 1,290 | 3,592 | — | 4,983 | ||||||||||||||||||
|
|
|
|
|
|
|
|
|
|
|
|
|
|||||||||||||
| Total Delphi shareholders’ equity |
5,641 | 3,366 | 3,355 | 2,382 | (9,103) | 5,641 | ||||||||||||||||||
| Noncontrolling interest |
— | — | — | 458 | — | 458 | ||||||||||||||||||
|
|
|
|
|
|
|
|
|
|
|
|
|
|||||||||||||
| Total shareholders’ equity |
5,641 | 3,366 | 3,355 | 2,840 | (9,103) | 6,099 | ||||||||||||||||||
|
|
|
|
|
|
|
|
|
|
|
|
|
|||||||||||||
| Total liabilities and shareholders’ equity |
$ | 5,753 | $ | 3,355 | $ | 4,645 | $ | 6,432 | $ | (9,103) | $ | 11,082 | ||||||||||||
|
|
|
|
|
|
|
|
|
|
|
|
|
|||||||||||||
149
Table of Contents
Statement of Cash Flows for the year ended December 31, 2011
| Parent Companies |
Subsidiary Issuer |
Guarantor Subsidiaries |
Non- Guarantor Subsidiaries |
Eliminations | Consolidated | |||||||||||||||||||
| (in millions) | ||||||||||||||||||||||||
| Net cash provided by (used in) operating activities |
$ | (255) | $ | 17 | $ | 269 | $ | 1,346 | $ | — | $ | 1,377 | ||||||||||||
|
|
|
|
|
|
|
|
|
|
|
|
|
|||||||||||||
| Cash flows from investing activities: |
||||||||||||||||||||||||
| Capital expenditures |
— | — | (161) | (469) | — | (630) | ||||||||||||||||||
| Maturity of time deposits |
— | — | 550 | — | — | 550 | ||||||||||||||||||
| Proceeds from sale of property/investments |
— | — | 12 | 60 | — | 72 | ||||||||||||||||||
| Cost of acquisitions, net of cash sold |
— | — | — | (17) | — | (17) | ||||||||||||||||||
| Decrease in restricted cash |
— | — | 25 | 13 | — | 38 | ||||||||||||||||||
| Loans of related parties |
— | — | — | (14) | — | (14) | ||||||||||||||||||
| Other, net |
— | — | (4) | (5) | — | (9) | ||||||||||||||||||
|
|
|
|
|
|
|
|
|
|
|
|
|
|||||||||||||
| Net cash provided by (used in) investing activities |
— | — | 422 | (432) | — | (10) | ||||||||||||||||||
|
|
|
|
|
|
|
|
|
|
|
|
|
|||||||||||||
| Cash flows from financing activities: |
||||||||||||||||||||||||
| Net (repayment) borrowings under other short-term debt agreements |
— | 4 | (1) | (128) | — | (125) | ||||||||||||||||||
| Proceeds from issuance of senior secured term loans, net of issuance costs |
— | 2,385 | — | — | — | 2,385 | ||||||||||||||||||
| Repayment of senior secured term loans |
— | (1,490) | — | — | — | (1,490) | ||||||||||||||||||
| Proceeds from issuance of senior notes, net of issuance costs |
— | 976 | — | — | — | 976 | ||||||||||||||||||
| Repayment of senior unsecured five-year notes |
— | — | — | (57) | — | (57) | ||||||||||||||||||
| Dividend payments to noncontrolling interests |
— | — | — | (43) | — | (43) | ||||||||||||||||||
| Intercompany dividends and net increase (decrease) in intercompany obligations |
5,142 | (1,892) | (2,514) | (736) | — | — | ||||||||||||||||||
| Distribution to Delphi equity holders |
(93) | — | — | — | — | (93) | ||||||||||||||||||
| Redemption of membership interests |
(4,747) | — | — | — | — | (4,747) | ||||||||||||||||||
|
|
|
|
|
|
|
|
|
|
|
|
|
|||||||||||||
| Net cash provided by (used in) financing activities |
302 | (17) | (2,515) | (964) | — | (3,194) | ||||||||||||||||||
|
|
|
|
|
|
|
|
|
|
|
|
|
|||||||||||||
| Effect of exchange rate fluctuations on cash and cash equivalents |
— | — | — | (29) | — | (29) | ||||||||||||||||||
|
|
|
|
|
|
|
|
|
|
|
|
|
|||||||||||||
| Increase (decrease) in cash and cash equivalents |
47 | — | (1,824) | (79) | — | (1,856) | ||||||||||||||||||
| Cash and cash equivalents at beginning of period |
6 | — | 2,010 | 1,203 | — | 3,219 | ||||||||||||||||||
|
|
|
|
|
|
|
|
|
|
|
|
|
|||||||||||||
| Cash and cash equivalents at end of period |
$ | 53 | $ | — | $ | 186 | $ | 1,124 | $ | — | $ | 1,363 | ||||||||||||
|
|
|
|
|
|
|
|
|
|
|
|
|
|||||||||||||
150
Table of Contents
Statement of Cash Flows for the year ended December 31, 2010
| Parent Companies |
Subsidiary Issuer |
Guarantor Subsidiaries |
Non- Guarantor Subsidiaries |
Eliminations | Consolidated | |||||||||||||||||||
| (in millions) | ||||||||||||||||||||||||
| Net cash provided by operating activities |
$ | 5 | $ | — | $ | 442 | $ | 695 | $ | — | $ | 1,142 | ||||||||||||
|
|
|
|
|
|
|
|
|
|
|
|
|
|||||||||||||
| Cash flows from investing activities: |
||||||||||||||||||||||||
| Capital expenditures |
— | — | (124) | (376) | — | (500) | ||||||||||||||||||
| Purchase of time deposits |
— | — | (750) | — | — | (750) | ||||||||||||||||||
| Maturity of time deposits |
— | — | 200 | — | — | 200 | ||||||||||||||||||
| Proceeds from sale of property/investments |
— | — | 4 | 89 | — | 93 | ||||||||||||||||||
| Decrease in restricted cash |
— | — | 33 | 16 | — | 49 | ||||||||||||||||||
| Other, net |
— | — | 12 | (15) | — | (3) | ||||||||||||||||||
|
|
|
|
|
|
|
|
|
|
|
|
|
|||||||||||||
| Net cash used in investing activities |
— | — | (625) | (286) | — | (911) | ||||||||||||||||||
|
|
|
|
|
|
|
|
|
|
|
|
|
|||||||||||||
| Cash flows from financing activities: |
||||||||||||||||||||||||
| Net repayment under other short-term debt agreements |
— | — | (2) | (47) | — | (49) | ||||||||||||||||||
| Repayments of long-term debt |
— | — | — | (50) | — | (50) | ||||||||||||||||||
| Dividend payments of consolidated affiliates to minority shareholders |
— | — | — | (27) | — | (27) | ||||||||||||||||||
|
|
|
|
|
|
|
|
|
|
|
|
|
|||||||||||||
| Net cash used in financing activities |
— | — | (2) | (124) | — | (126) | ||||||||||||||||||
|
|
|
|
|
|
|
|
|
|
|
|
|
|||||||||||||
| Effect of exchange rate fluctuations on cash and cash equivalents |
— | — | — | 7 | — | 7 | ||||||||||||||||||
|
|
|
|
|
|
|
|
|
|
|
|
|
|||||||||||||
| Increase (decrease) in cash and cash equivalents |
5 | — | (185) | 292 | — | 112 | ||||||||||||||||||
| Cash and cash equivalents at beginning of period |
1 | — | 2,195 | 911 | — | 3,107 | ||||||||||||||||||
|
|
|
|
|
|
|
|
|
|
|
|
|
|||||||||||||
| Cash and cash equivalents at end of period |
$ | 6 | $ | — | $ | 2,010 | $ | 1,203 | $ | — | $ | 3,219 | ||||||||||||
|
|
|
|
|
|
|
|
|
|
|
|
|
|||||||||||||
151
Table of Contents
Statement of Cash Flows from the period August 19 to December 31, 2009
| Parent Companies |
Subsidiary Issuer |
Guarantor Subsidiaries |
Non- Guarantor Subsidiaries |
Eliminations | Consolidated | |||||||||||||||||||
| (in millions) | ||||||||||||||||||||||||
| Net cash (used in) provided by operating activities |
$ | (18) | $ | — | $ | 180 | $ | (3) | $ | — | $ | 159 | ||||||||||||
|
|
|
|
|
|
|
|
|
|
|
|
|
|||||||||||||
| Cash flows from investing activities: |
||||||||||||||||||||||||
| Capital expenditures |
— | — | (21) | (67) | — | (88) | ||||||||||||||||||
| Proceeds from divestitures, net of cash sold |
— | — | 12 | 62 | — | 74 | ||||||||||||||||||
| Decrease in restricted cash |
— | — | 4 | 24 | — | 28 | ||||||||||||||||||
| Cash acquired from Delphi Corporation |
— | — | 3 | 859 | — | 862 | ||||||||||||||||||
| Other, net |
— | — | 8 | 1 | — | 9 | ||||||||||||||||||
|
|
|
|
|
|
|
|
|
|
|
|
|
|||||||||||||
| Net cash provided by investing activities |
— | — | 6 | 879 | — | 885 | ||||||||||||||||||
|
|
|
|
|
|
|
|
|
|
|
|
|
|||||||||||||
| Cash flows from financing activities: |
||||||||||||||||||||||||
| Net repayment under other short-term debt agreements |
— | — | — | (21) | — | (21) | ||||||||||||||||||
| Proceeds from issuance of membership interests |
19 | — | 2,009 | 14 | — | 2,042 | ||||||||||||||||||
| Proceeds from issuance of five-year notes |
— | — | — | 41 | — | 41 | ||||||||||||||||||
|
|
|
|
|
|
|
|
|
|
|
|
|
|||||||||||||
| Net cash provided by financing activities |
19 | — | 2,009 | 34 | — | 2,062 | ||||||||||||||||||
|
|
|
|
|
|
|
|
|
|
|
|
|
|||||||||||||
| Effect of exchange rate fluctuations on cash and cash equivalents |
— | — | — | 1 | — | 1 | ||||||||||||||||||
|
|
|
|
|
|
|
|
|
|
|
|
|
|||||||||||||
| Increase in cash and cash equivalents |
1 | — | 2,195 | 911 | — | 3,107 | ||||||||||||||||||
| Cash and cash equivalents at beginning of period |
— | — | — | — | — | — | ||||||||||||||||||
|
|
|
|
|
|
|
|
|
|
|
|
|
|||||||||||||
| Cash and cash equivalents at end of period |
$ | 1 | $ | — | $ | 2,195 | $ | 911 | $ | — | $ | 3,107 | ||||||||||||
|
|
|
|
|
|
|
|
|
|
|
|
|
|||||||||||||
| 23. | SEGMENT REPORTING |
Effective December 2010, Delphi realigned its segment reporting to reflect certain items previously included in the Eliminations and Other segment within its core business segments. Delphi operates its core business along the following operating segments, which are grouped on the basis of similar product, market and operating factors.
| • | Electrical/Electronic Architecture, which includes complete electrical architecture and component products. |
| • | Powertrain Systems, which includes extensive systems integration expertise in gasoline, diesel and fuel handling and full end-to-end systems including fuel and air injection, combustion, electronics controls, exhaust handling, test and validation capabilities, diesel and automotive aftermarket, and original equipment service. |
| • | Electronics and Safety, which includes component and systems integration expertise in infotainment and connectivity, body controls and security systems, displays, mechatronics, passive and active safety electronics and electric and hybrid electric vehicle power electronics, as well as advanced development of software. |
| • | Thermal Systems, which includes heating, ventilating and air conditioning (“HVAC”) systems, components for multiple transportation and other adjacent markets, and powertrain cooling and related technologies. |
152
Table of Contents
| • | Eliminations and Other, which includes i) the elimination of inter-segment transactions, and ii) certain other expenses and income of a non-operating or strategic nature. |
The accounting policies of the segments are the same as those described in Note 2. Significant Accounting Policies, except that the disaggregated financial results for the segments have been prepared using a management approach, which is consistent with the basis and manner in which management internally disaggregates financial information for the purposes of assisting internal operating decisions. Generally, Delphi evaluates performance based on stand-alone segment net income before depreciation and amortization (including long-lived asset and goodwill impairment), interest expense, other income (expense), net, income tax expense, equity income, net of tax, transformation and rationalization charges related to plant consolidations, plant wind-downs and discontinued operations (“Adjusted EBITDA”) and accounts for inter-segment sales and transfers as if the sales or transfers were to third parties, at current market prices. Through December 31, 2010, Delphi’s management believed that Adjusted EBITDA was a meaningful measure of performance and it was used by management to analyze Company and stand-alone segment operating performance. Management also used Adjusted EBITDA for planning and forecasting purposes. Effective January 1, 2011, Delphi’s management began utilizing net income before depreciation and amortization (including long-lived asset and goodwill impairment), interest expense, other income (expense), net, income tax expense and equity income, net of tax (“EBITDA”) as a key performance measure because its restructuring was substantially completed in 2010. Segment EBITDA and Adjusted EBITDA should not be considered substitutes for results prepared in accordance with U.S. GAAP and should not be considered alternatives to net income (loss) attributable to Successor/Predecessor, which is the most directly comparable financial measure to EBITDA and Adjusted EBITDA that is in accordance with U.S. GAAP. Segment EBITDA and Adjusted EBITDA, as determined and measured by Delphi, should also not be compared to similarly titled measures reported by other companies.
Included below are sales and operating data for Delphi’s segments for the years ended December 31, 2011 and 2010, and periods from August 19 to December 31, 2009 and January 1 to October 6, 2009, as well as balance sheet data as of December 31, 2011 and 2010.
| Successor | ||||||||||||||||||||||||
| Electrical/ Electronic Architecture |
Powertrain Systems |
Electronics and Safety |
Thermal Systems |
Eliminations and Other(1) |
Total | |||||||||||||||||||
| 2011: | (in millions) | |||||||||||||||||||||||
| Net sales |
$ | 6,642 | $ | 4,970 | $ | 2,931 | $ | 1,755 | $ | (257) | $ | 16,041 | ||||||||||||
| EBITDA |
$ | 868 | $ | 710 | $ | 369 | $ | 172 | $ | — | $ | 2,119 | ||||||||||||
| Depreciation & Amortization |
$ | 131 | $ | 195 | $ | 105 | $ | 44 | $ | — | $ | 475 | ||||||||||||
| Operating income (2) |
$ | 737 | $ | 515 | $ | 264 | $ | 128 | $ | — | $ | 1,644 | ||||||||||||
| Equity income (loss) |
$ | 20 | $ | 3 | $ | 1 | $ | 6 | $ | (8) | $ | 22 | ||||||||||||
| Net income attributable to noncontrolling interest |
$ | 33 | $ | 33 | $ | — | $ | 12 | $ | — | $ | 78 | ||||||||||||
| Successor | ||||||||||||||||||||||||
| Electrical/ Electronic Architecture |
Powertrain Systems |
Electronics and Safety |
Thermal Systems |
Eliminations and Other(1) |
Total | |||||||||||||||||||
| 2010: | (in millions) | |||||||||||||||||||||||
| Net sales |
$ | 5,620 | $ | 4,086 | $ | 2,721 | $ | 1,603 | $ | (213) | $ | 13,817 | ||||||||||||
| EBITDA |
$ | 650 | $ | 361 | $ | 247 | $ | 109 | $ | (6) | $ | 1,361 | ||||||||||||
| Adjusted EBITDA |
$ | 758 | $ | 423 | $ | 293 | $ | 165 | $ | (6) | $ | 1,633 | ||||||||||||
| Depreciation & Amortization |
$ | 108 | $ | 170 | $ | 100 | $ | 42 | $ | 1 | $ | 421 | ||||||||||||
| Operating income (loss) (3) |
$ | 542 | $ | 191 | $ | 147 | $ | 67 | $ | (7) | $ | 940 | ||||||||||||
| Equity income (loss) |
$ | 7 | $ | 2 | $ | (3) | $ | 8 | $ | 3 | $ | 17 | ||||||||||||
| Net income attributable to noncontrolling interest |
$ | 31 | $ | 28 | $ | 1 | $ | 12 | $ | — | $ | 72 | ||||||||||||
153
Table of Contents
| Successor | ||||||||||||||||||||||||
| Electrical/ Electronic Architecture |
Powertrain Systems |
Electronics and Safety |
Thermal Systems |
Eliminations and Other(1) |
Total | |||||||||||||||||||
| August 19—December 31, 2009: | (in millions) | |||||||||||||||||||||||
| Net sales |
$ | 1,325 | $ | 957 | $ | 761 | $ | 365 | $ | 13 | $ | 3,421 | ||||||||||||
| EBITDA |
$ | 94 | $ | 9 | $ | 17 | $ | 8 | $ | 1 | $ | 129 | ||||||||||||
| Adjusted EBITDA |
$ | 155 | $ | 79 | $ | 56 | $ | 21 | $ | 2 | $ | 313 | ||||||||||||
| Depreciation & Amortization |
$ | 31 | $ | 52 | $ | 39 | $ | 17 | $ | — | $ | 139 | ||||||||||||
| Operating income (loss) (4) |
$ | 63 | $ | (43) | $ | (22) | $ | (9) | $ | 1 | $ | (10) | ||||||||||||
| Equity income (loss) |
$ | 5 | $ | — | $ | 1 | $ | — | $ | (1) | $ | 5 | ||||||||||||
| Net income attributable to noncontrolling interest |
$ | 9 | $ | 5 | $ | — | $ | 1 | $ | — | $ | 15 | ||||||||||||
| Predecessor | ||||||||||||||||||||||||
| Electrical/ Electronic Architecture |
Powertrain Systems |
Electronics and Safety |
Thermal Systems |
Eliminations and Other(1) |
Total | |||||||||||||||||||
| January 1—October 6, 2009: | (in millions) | |||||||||||||||||||||||
| Net sales |
$ | 2,970 | $ | 2,667 | $ | 1,801 | $ | 1,008 | $ | (112) | $ | 8,334 | ||||||||||||
| EBITDA |
$ | (132) | $ | (71) | $ | (319) | $ | 4 | $ | 4 | $ | (514) | ||||||||||||
| Adjusted EBITDA |
$ | (18) | $ | (9) | $ | (214) | $ | 17 | $ | (5) | $ | (229) | ||||||||||||
| Depreciation & Amortization |
$ | 147 | $ | 163 | $ | 177 | $ | 53 | $ | — | $ | 540 | ||||||||||||
| Operating (loss) income (5) |
$ | (279) | $ | (234) | $ | (496) | $ | (49) | $ | (60) | $ | (1,118) | ||||||||||||
| Equity income (loss) |
$ | 4 | $ | (9) | $ | (13) | $ | (12) | $ | (6) | $ | (36) | ||||||||||||
| Net income attributable to noncontrolling interest |
$ | 12 | $ | 9 | $ | 1 | $ | 6 | $ | 1 | $ | 29 | ||||||||||||
| Electrical/ Electronic Architecture |
Powertrain Systems |
Electronics and Safety |
Thermal Systems |
Eliminations and Other(1) |
Total | |||||||||||||||||||
| (in millions) | ||||||||||||||||||||||||
| Balance as of: | ||||||||||||||||||||||||
| December 31, 2011 |
||||||||||||||||||||||||
| Investment in affiliates |
$ | 96 | $ | 74 | $ | — | $ | 71 | $ | 16 | $ | 257 | ||||||||||||
| Capital expenditures |
$ | 219 | $ | 228 | $ | 100 | $ | 70 | $ | 13 | $ | 630 | ||||||||||||
| Total segment assets |
$ | 3,567 | $ | 4,541 | $ | 1,723 | $ | 921 | $ | (1,624) | $ | 9,128 | ||||||||||||
| December 31, 2010 |
||||||||||||||||||||||||
| Investment in affiliates |
$ | 85 | $ | 53 | $ | 61 | $ | 60 | $ | 22 | $ | 281 | ||||||||||||
| Capital expenditures |
$ | 202 | $ | 186 | $ | 59 | $ | 35 | $ | 18 | $ | 500 | ||||||||||||
| Total segment assets |
$ | 3,336 | $ | 3,718 | $ | 1,905 | $ | 898 | $ | 1,225 | $ | 11,082 | ||||||||||||
| (1) | Eliminations and Other includes the elimination of inter-segment transactions. |
| (2) | Includes charges recorded in 2011 related to costs associated with employee termination benefits and other exit costs of $5 million for Electronics and Safety, $12 million for Powertrain Systems, $12 million for Electrical/Electronic Architecture and $2 million for Thermal Systems. |
| (3) | Includes charges recorded in 2010 related to costs associated with employee termination benefits and other exit costs of $29 million for Electronics and Safety, $49 million for Powertrain Systems, $94 million for Electrical/Electronic Architecture and $52 million for Thermal Systems. |
| (4) | Includes charges recorded from August 19 to December 31, 2009 related to long-lived asset impairments and costs associated with employee termination benefits and other exit costs of $20 million for Electronics and Safety, $62 million for Powertrain Systems, $50 million for Electrical/Electronic Architecture, $10 million for Thermal Systems, and $1 million for Eliminations and Other. |
| (5) | Includes charges recorded from January 1 to October 6, 2009 related to long-lived asset impairments and costs associated with employee termination benefits and other exit costs of $128 million for Electronics and Safety, $46 million for Powertrain Systems, $100 million for Electrical/Electronic Architecture, $13 million for Thermal Systems, and $(11) million for Eliminations and Other. |
154
Table of Contents
The reconciliation of Adjusted EBITDA to EBITDA includes other transformation and rationalization costs related to 1) the implementation of information technology systems to support finance, manufacturing and product development initiatives, 2) certain plant consolidations and closures costs, 3) consolidation of many staff administrative functions into a global business service group, and 4) employee benefit plan settlements in Mexico. The reconciliation of EBITDA to net income (loss) attributable to Successor/Predecessor follows:
| Successor | ||||||||||||||||||||||||
| Electrical/ Electronic Architecture |
Powertrain Systems |
Electronics and Safety |
Thermal Systems |
Eliminations and Other |
Total | |||||||||||||||||||
| 2011: | (in millions) | |||||||||||||||||||||||
| EBITDA |
$ | 868 | $ | 710 | $ | 369 | $ | 172 | $ | — | 2,119 | |||||||||||||
|
|
|
|
|
|
|
|
|
|
|
|||||||||||||||
| Depreciation and amortization |
(131) | (195) | (105) | (44) | — | (475) | ||||||||||||||||||
|
|
|
|
|
|
|
|
|
|
|
|
|
|||||||||||||
| Operating income |
$ | 737 | $ | 515 | $ | 264 | $ | 128 | $ | — | 1,644 | |||||||||||||
|
|
|
|
|
|
|
|
|
|
|
|||||||||||||||
| Interest expense |
(123) | |||||||||||||||||||||||
| Other expense, net |
(15) | |||||||||||||||||||||||
|
|
|
|||||||||||||||||||||||
| Income from continuing operations before income taxes and equity income |
1,506 | |||||||||||||||||||||||
| Income tax expense |
(305) | |||||||||||||||||||||||
| Equity income, net of tax |
22 | |||||||||||||||||||||||
|
|
|
|||||||||||||||||||||||
| Net income |
$ | 1,223 | ||||||||||||||||||||||
| Net income attributable to noncontrolling interest |
78 | |||||||||||||||||||||||
|
|
|
|||||||||||||||||||||||
| Net income attributable to Successor |
$ | 1,145 | ||||||||||||||||||||||
|
|
|
|||||||||||||||||||||||
| Successor | ||||||||||||||||||||||||
| Electrical/ Electronic Architecture |
Powertrain Systems |
Electronics and Safety |
Thermal Systems |
Eliminations and Other |
Total | |||||||||||||||||||
| 2010: | (in millions) | |||||||||||||||||||||||
| Adjusted EBITDA |
$ | 758 | $ | 423 | $ | 293 | $ | 165 | $ | (6) | $ | 1,633 | ||||||||||||
| Transformation and rationalization charges: |
||||||||||||||||||||||||
| Employee termination benefits and other exit costs |
(94) | (49) | (29) | (52) | — | (224) | ||||||||||||||||||
| Other transformation and rationalization costs |
(14) | (13) | (17) | (4) | — | (48) | ||||||||||||||||||
|
|
|
|
|
|
|
|
|
|
|
|
|
|||||||||||||
| EBITDA |
$ | 650 | $ | 361 | $ | 247 | $ | 109 | $ | (6) | 1,361 | |||||||||||||
|
|
|
|
|
|
|
|
|
|
|
|||||||||||||||
| Depreciation and amortization |
(108) | (170) | (100) | (42) | (1) | (421) | ||||||||||||||||||
|
|
|
|
|
|
|
|
|
|
|
|
|
|||||||||||||
| Operating income (loss) |
$ | 542 | $ | 191 | $ | 147 | $ | 67 | $ | (7) | 940 | |||||||||||||
|
|
|
|
|
|
|
|
|
|
|
|||||||||||||||
| Interest expense |
(30) | |||||||||||||||||||||||
| Other income, net |
34 | |||||||||||||||||||||||
|
|
|
|||||||||||||||||||||||
| Income from continuing operations before income taxes and equity income |
944 | |||||||||||||||||||||||
| Income tax expense |
(258) | |||||||||||||||||||||||
| Equity income, net of tax |
17 | |||||||||||||||||||||||
|
|
|
|||||||||||||||||||||||
| Net income |
$ | 703 | ||||||||||||||||||||||
| Net income attributable to noncontrolling interest |
72 | |||||||||||||||||||||||
|
|
|
|||||||||||||||||||||||
| Net income attributable to Successor |
$ | 631 | ||||||||||||||||||||||
|
|
|
|||||||||||||||||||||||
155
Table of Contents
| Successor | ||||||||||||||||||||||||
| Electrical/ Electronic Architecture |
Powertrain Systems |
Electronics and Safety |
Thermal Systems |
Eliminations and Other |
Total | |||||||||||||||||||
| August 19—December 31, 2009: | (in millions) | |||||||||||||||||||||||
| Adjusted EBITDA |
$ | 155 | $ | 79 | $ | 56 | $ | 21 | $ | 2 | $ | 313 | ||||||||||||
| Transformation and rationalization charges: |
||||||||||||||||||||||||
| Employee termination benefits and other exit costs |
(50) | (50) | (20) | (5) | (1) | (126) | ||||||||||||||||||
| Other transformation and rationalization costs |
(11) | (20) | (19) | (8) | — | (58) | ||||||||||||||||||
|
|
|
|
|
|
|
|
|
|
|
|
|
|||||||||||||
| EBITDA |
$ | 94 | $ | 9 | $ | 17 | $ | 8 | $ | 1 | 129 | |||||||||||||
|
|
|
|
|
|
|
|
|
|
|
|||||||||||||||
| Depreciation and amortization |
(31) | (52) | (39) | (17) | — | (139) | ||||||||||||||||||
|
|
|
|
|
|
|
|
|
|
|
|
|
|||||||||||||
| Operating (loss) income |
$ | 63 | $ | (43) | $ | (22) | $ | (9) | $ | 1 | (10) | |||||||||||||
|
|
|
|
|
|
|
|
|
|
|
|||||||||||||||
| Interest expense |
(8) | |||||||||||||||||||||||
| Other expense, net |
(17) | |||||||||||||||||||||||
|
|
|
|||||||||||||||||||||||
| Loss from continuing operations before income taxes and equity income |
(35) | |||||||||||||||||||||||
| Income tax benefit |
27 | |||||||||||||||||||||||
| Equity income, net of tax |
5 | |||||||||||||||||||||||
|
|
|
|||||||||||||||||||||||
| Net loss |
$ | (3) | ||||||||||||||||||||||
| Net income attributable to noncontrolling interest |
15 | |||||||||||||||||||||||
|
|
|
|||||||||||||||||||||||
| Net loss attributable to Successor |
$ | (18) | ||||||||||||||||||||||
|
|
|
|||||||||||||||||||||||
156
Table of Contents
| Predecessor | ||||||||||||||||||||||||
| Electrical/ Electronic Architecture |
Powertrain Systems |
Electronics and Safety |
Thermal Systems |
Eliminations
and Other |
Total | |||||||||||||||||||
| (in millions) | ||||||||||||||||||||||||
| January 1—October 6, 2009: |
||||||||||||||||||||||||
| Adjusted EBITDA |
$ | (18) | $ | (9) | $ | (214) | $ | 17 | $ | (5) | $ | (229) | ||||||||||||
| Transformation and rationalization charges: |
||||||||||||||||||||||||
| Employee termination benefits and other exit costs |
(99) | (45) | (91) | (11) | 11 | (235) | ||||||||||||||||||
| Other transformation and rationalization costs |
(15) | (17) | (14) | (2) | (2) | (50) | ||||||||||||||||||
|
|
|
|
|
|
|
|
|
|
|
|
|
|||||||||||||
| EBITDA |
$ | (132) | $ | (71) | $ | (319) | $ | 4 | $ | 4 | (514) | |||||||||||||
|
|
|
|
|
|
|
|
|
|
|
|||||||||||||||
| Depreciation and amortization |
(147) | (163) | (177) | (53) | — | (540) | ||||||||||||||||||
| Discontinued operations |
— | — | — | — | (64) | (64) | ||||||||||||||||||
|
|
|
|
|
|
|
|
|
|
|
|
|
|||||||||||||
| Operating loss |
$ | (279) | $ | (234) | $ | (496) | $ | (49) | $ | (60) | (1,118) | |||||||||||||
|
|
|
|
|
|
|
|
|
|
|
|||||||||||||||
| Other income, net |
24 | |||||||||||||||||||||||
| Reorganization items |
10,210 | |||||||||||||||||||||||
|
|
|
|||||||||||||||||||||||
| Income from continuing operations before income taxes and equity loss |
9,116 | |||||||||||||||||||||||
| Income tax benefit |
311 | |||||||||||||||||||||||
| Equity loss, net of tax |
(36) | |||||||||||||||||||||||
| Loss from discontinued operations, net of tax |
(44) | |||||||||||||||||||||||
|
|
|
|||||||||||||||||||||||
| Net income |
$ | 9,347 | ||||||||||||||||||||||
| Net income attributable to noncontrolling interest |
29 | |||||||||||||||||||||||
|
|
|
|||||||||||||||||||||||
| Net income attributable to Predecessor |
$ | 9,318 | ||||||||||||||||||||||
|
|
|
|||||||||||||||||||||||
Information concerning principal geographic areas is set forth below. Net sales data reflects the manufacturing location and is for the years ended December 31, 2011, December 31, 2010, the periods from August 19 to December 31 and January 1 to October 6, 2009. Net property data is as of December 31.
| Successor | Predecessor | |||||||||||||||||||||||||||||
| Year ended December 31, 2011 |
Year ended December 31, 2010 |
Period from August 19 to December 31, 2009 |
Period from January 1 to October 6, 2009 |
|||||||||||||||||||||||||||
| (in millions) | (in millions) | |||||||||||||||||||||||||||||
| Net Sales | Net Property(1) |
Net Sales | Net Property(1) |
Net Sales | Net Property(1) |
Net Sales | ||||||||||||||||||||||||
| United States |
$ | 4,993 | $ | 506 | $ | 4,529 | $ | 417 | $ | 1,083 | $ | 430 | $ | 3,107 | ||||||||||||||||
| Other North America |
118 | 129 | 76 | 134 | 16 | 109 | 24 | |||||||||||||||||||||||
| Europe, Middle East & Africa(2) |
7,264 | 1,107 | 5,892 | 1,045 | 1,448 | 1,047 | 3,330 | |||||||||||||||||||||||
| Asia Pacific |
2,464 | 422 | 2,177 | 325 | 590 | 272 | 1,223 | |||||||||||||||||||||||
| South America |
1,202 | 151 | 1,143 | 146 | 284 | 102 | 650 | |||||||||||||||||||||||
|
|
|
|
|
|
|
|
|
|
|
|
|
|
|
|||||||||||||||||
| Total |
$ | 16,041 | $ | 2,315 | $ | 13,817 | $ | 2,067 | $ | 3,421 | $ | 1,960 | $ | 8,334 | ||||||||||||||||
|
|
|
|
|
|
|
|
|
|
|
|
|
|
|
|||||||||||||||||
| (1) | Net property data represents property, plant and equipment, net of accumulated depreciation. |
157
Table of Contents
| (2) | Includes Delphi’s country of domicile, Jersey, and the country of Delphi’s principal executive offices, the United Kingdom. The Company had no sales in Jersey in any period. The Company had net sales of $866 million, $690 million, $159 million, and $394 million in the United Kingdom for the years ended December 31, 2011 and 2010, and the period from August 19 to December 31, 2009, and the period from January 1 to October 6, 2009 respectively. The Company had net property in the United Kingdom of $138 million, $137 million, and $141 million as of December 31, 2011, 2010 and 2009, respectively. |
| 24. | QUARTERLY DATA (UNAUDITED) |
The following is a condensed summary of the Company’s unaudited quarterly results of continuing operations for fiscal 2011 and 2010.
| Three months ended | ||||||||||||||||||||
| March 31, | June 30, | September 30, | December 31, | Total | ||||||||||||||||
| (in millions, except per share amounts) |
||||||||||||||||||||
| 2011 |
||||||||||||||||||||
| Net sales |
$ | 3,997 | $ | 4,213 | $ | 3,931 | $ | 3,900 | $ | 16,041 | ||||||||||
| Cost of sales (1) |
3,353 | 3,518 | 3,294 | 3,221 | 13,386 | |||||||||||||||
|
|
|
|
|
|
|
|
|
|
|
|||||||||||
| Gross profit |
$ | 644 | $ | 695 | $ | 637 | $ | 679 | $ | 2,655 | ||||||||||
|
|
|
|
|
|
|
|
|
|
|
|||||||||||
| Operating income |
$ | 412 | $ | 428 | $ | 393 | $ | 411 | $ | 1,644 | ||||||||||
| Net income |
$ | 310 | $ | 316 | $ | 285 | $ | 312 | $ | 1,223 | ||||||||||
|
|
|
|
|
|
|
|
|
|
|
|||||||||||
| Net income attributable to Delphi |
$ | 291 | $ | 298 | $ | 266 | $ | 290 | $ | 1,145 | ||||||||||
|
|
|
|
|
|
|
|
|
|
|
|||||||||||
| Basic and diluted net income per share (2) |
$ | 0.42 | $ | 0.88 | $ | 0.79 | $ | 0.88 | $ | 2.72 | ||||||||||
|
|
|
|
|
|
|
|
|
|
|
|||||||||||
| Weighted average shares outstanding |
687 | 338 | 337 | 328 | 421 | |||||||||||||||
|
|
|
|
|
|
|
|
|
|
|
|||||||||||
| 2010 |
||||||||||||||||||||
| Net sales |
$ | 3,410 | $ | 3,446 | $ | 3,309 | $ | 3,652 | $ | 13,817 | ||||||||||
| Cost of sales (1) |
2,848 | 2,903 | 2,807 | 3,210 | 11,768 | |||||||||||||||
|
|
|
|
|
|
|
|
|
|
|
|||||||||||
| Gross profit |
$ | 562 | $ | 543 | $ | 502 | $ | 442 | $ | 2,049 | ||||||||||
|
|
|
|
|
|
|
|
|
|
|
|||||||||||
| Operating income |
$ | 324 | $ | 297 | $ | 206 | $ | 113 | $ | 940 | ||||||||||
| Net income |
$ | 235 | $ | 233 | $ | 144 | $ | 91 | $ | 703 | ||||||||||
|
|
|
|
|
|
|
|
|
|
|
|||||||||||
| Net income attributable to Delphi |
$ | 215 | $ | 214 | $ | 127 | $ | 75 | $ | 631 | ||||||||||
|
|
|
|
|
|
|
|
|
|
|
|||||||||||
| Basic and diluted net income per share (2) |
$ | 0.31 | $ | 0.31 | $ | 0.18 | $ | 0.11 | $ | 0.92 | ||||||||||
|
|
|
|
|
|
|
|
|
|
|
|||||||||||
| Weighted average shares outstanding |
685 | 685 | 687 | 687 | 686 | |||||||||||||||
|
|
|
|
|
|
|
|
|
|
|
|||||||||||
| (1) | Cost of sales for the quarters ended March 31, 2011 and December 31, 2010 included $76 million and $75 million, respectively, of warranty charges. Refer to Note. 10 Warranty Obligations for more information. |
| (2) | Due to the use of the weighted average shares outstanding for each quarter for computing earnings per share, the sum of the quarterly per share amounts may not equal the per share amount for the year. |
158
Table of Contents
ITEM 9. CHANGES IN AND DISAGREEMENTS WITH ACCOUNTANTS ON ACCOUNTING AND FINANCIAL DISCLOSURE
None
ITEM 9A. CONTROLS AND PROCEDURES
Management’s Report on Internal Control over Financial Reporting
Under the supervision and with the participation of our management, including our Chief Executive Officer (the “CEO”) and Chief Financial Officer (the “CFO”), we have evaluated the effectiveness of the design and operation of our disclosure controls and procedures as of the end of the period covered by this report. Based on that evaluation, our CEO and CFO have concluded such controls and procedures were effective as of December 31, 2011.
Management is responsible for establishing and maintaining adequate internal control over financial reporting. Internal control over financial reporting includes those policies and procedures that: (a) pertain to the maintenance of records that, in reasonable detail, accurately and fairly reflect the transactions and dispositions of the assets of the Company; (b) provide reasonable assurance that transactions are recorded as necessary to permit preparation of financial statements in accordance with generally accepted accounting principles in the United States of America, and that receipts and expenditures of the Company are being made only in accordance with authorizations of management and directors of the Company; and (c) provide reasonable assurance regarding prevention or timely detection of unauthorized acquisition, use or disposition of the Company’s assets that could have a material effect on the financial statements.
Management performed its assessment of internal controls over financial reporting as of December 31, 2011, the end of our fiscal year, based on the criteria set forth in the Internal Control-Integrated Framework issued by the Committee of Sponsoring Organizations of the Treadway Commission. Based on this evaluation, management concluded that our internal controls over financial reporting were effective as of December 31, 2011.
A control system, no matter how well conceived and operated, can provide only reasonable, not absolute, assurance that the objectives of the control system are met. Because of the inherent limitations in all control systems, no evaluation of controls can provide absolute assurance that all control issues and instances of fraud, if any, within the Company have been detected.
Ernst & Young LLP has issued an attestation report which is included herein as the Report of Independent Registered Public Accounting Firm under the section headed Financial Statements and Supplementary Data for the year ended December 31, 2011.
Changes in Internal Control over Financial Reporting
There were no changes in the Company’s internal controls over financial reporting during the quarter ended December 31, 2011 that have materially affected, or are reasonably likely to materially affect, the Company’s internal controls over financial reporting.
Determination of Annual Incentive Plan Awards for 2011
On February 15, 2012, the Compensation and Human Resources Committee (the “Committee”), in the case of all named executive officers (“NEOs”) other than Mr. O’Neal, and on February 16, 2012, the Board of
159
Table of Contents
Directors (the “Board”), in the case of Mr. O’Neal, approved awards under the Company’s Annual Incentive Plan for the fiscal year ended December 31, 2011 (the “2011 Annual Incentive Plan”). Other compensation for fiscal year 2011 was previously reported by the Company in the Summary Compensation Table beginning on page 134 of the Registration Statement on Form S-1, filed February 1, 2012 (the “Registration Statement”). As of the filing of the Registration Statement, awards under the 2011 Annual Incentive Plan had not been determined and, therefore, were omitted from the Summary Compensation Table included in the Registration Statement. The awards under the 2011 Annual Incentive Plan for the NEOs are set forth below and reflect the strong performance of the Company in 2011:
| Name |
Non-Equity Incentive Plan Compensation (1)(2) |
|||
| Rodney O’Neal |
$ | 3,380,300 | ||
| Kevin P. Clark |
$ | 1,232,000 | ||
| James A Spencer |
$ | 1,049,458 | ||
| Jeffrey J. Owens |
$ | 768,688 | ||
| Kevin M. Butler |
$ | 808,500 | ||
| Ronald M. Pirtle (3) |
$ | 626,172 | ||
| (1) | The 2011 Annual Incentive Plan award payments reflect the actual performance of the Company based upon the annual metrics, weighting and targets described in the Registration Statement. In 2011 Delphi experienced a 56% increase in EBITDA and a modest increase in cash flow before financing (which is defined as cash flows from operating activities and cash flows from investing activities (excluding investments in time deposits and costs associated with the initial public offering)) from 2010, as well as $23.5 billion in gross business bookings. See Item 6. Selected Financial Data of this Annual Report for a reconciliation of EBITDA to U.S. GAAP financial measures. |
| (2) | 2011 total compensation amounts for the NEOs, as reported in the Summary Compensation Table of the Registration Statement, are adjusted to include the amounts shown in this column. |
| (3) | Mr. Pirtle ceased being an officer of Delphi as of July 1, 2011 and retired from Delphi as of January 1, 2012. Mr. Pirtle’s annual incentive payment has been adjusted to reflect his time as an officer in 2011, plus one month of transition support he provided to his successor in 2011. |
Approval of 2012 Equity Awards
On February 15, 2012, the Committee, in the case of all executives, including NEOs, other than Mr. O’Neal, and on February 16, 2012, the Board, in the case of Mr. O’Neal, also approved a grant of equity awards to the Company’s executives in the form of restricted stock unit (“RSU”) awards, which are intended to align executives’ interests with the interests of our shareholders. The number of target shares underlying the RSU award granted to each NEO who is a current officer, as well as the breakdown between target shares that vest based on performance and target shares that vest based on time, are as follows:
| Total Target
Shares Underlying RSU Award |
Performance-Based Target Shares (75%) |
Time-Based Target Shares (25%) |
||||||||||
| Rodney O’Neal |
284,360 | 213,270 | 71,090 | |||||||||
| Kevin P. Clark |
94,787 | 71,090 | 23,697 | |||||||||
| James A Spencer |
69,905 | 52,429 | 17,476 | |||||||||
| Jeffrey J. Owens |
51,327 | 38,495 | 12,832 | |||||||||
| Kevin M. Butler |
35,545 | 26,659 | 8,886 | |||||||||
160
Table of Contents
The form of award agreement for the RSU grant described above is attached as an exhibit to this Annual Report. For all officers, including the NEOs, 75% of the target shares underlying the RSU award will vest based on performance, with a performance period from January 1, 2012 to December 31, 2014. The remaining 25% of the target shares will be issued in the form of a time-based RSU award and will vest ratably over three years beginning on the first anniversary of the date of grant. The actual shares that each NEO will receive upon vesting of the performance-based target shares will range from 0% to 200% of the performance-based target shares based upon the Company’s achievement of the following performance metrics:
| Performance Metric |
Weighting | |||
| Average RONA (1) |
50 | % | ||
| Cumulative Net Income (2) |
30 | % | ||
| Relative Total Shareholder Return (3) |
20 | % | ||
| (1) | Return on Net Assets (“RONA”) is defined as tax-affected operating income, divided by average net working capital plus average net property, plant and equipment expense and is measured each calendar year. Final performance will be based upon the three-year average of calendar year performance for 2012, 2013 and 2014. |
| (2) | Cumulative Net Income is based upon the total net income for the three-year period of 2012, 2013 and 2014. |
| (3) | Relative Total Shareholder Return is a comparison of the average closing price per share of the Company’s ordinary shares for all available trading days in the fourth quarter of 2014 against the average closing price per share of the Company’s ordinary shares for all available trading days in fourth quarter of 2011, including dividends; the resulting percentage change is then compared to a comparable measure of the Russell 3000 Auto Parts Index companies. Actual payout will be based upon the Company’s position relative to the companies listed in the index, as more fully described in the grant agreement. |
Organizational Changes
As a market leader in technology, product development and operational excellence, we are committed to providing our investors and shareholders with strong financial performance. To further strengthen our capabilities, on February 15, 2012, the Committee and the Board approved certain organizational changes, which also resulted in changes to compensation we provide to Messrs. O’Neal, Owens and Spencer.
Jeffrey Owens has assumed the new role of Senior Vice President of Delphi and Chief Technology Officer. Focused on the long-range growth and technology success of Delphi, Mr. Owens will drive innovation and technology strategies to promote growth while leading the evaluation of advanced technologies and market trends. He will drive alignment of engineering resources and capabilities, including capacity planning for the global engineering footprint to achieve the company’s business goals. In recognition of the need for continuity in this important new role, on February 15, 2012, in addition to his RSU award described above, Mr. Owens was also awarded a one-time grant of 47,393 RSUs, which will cliff vest on February 15, 2015. Should Mr. Owens terminate his employment without good reason (as defined in his award agreement) or be terminated for cause by Delphi prior to the vesting date, he will forfeit this one-time special grant in full. A form of award agreement for Mr. Owens is attached as an exhibit to this Annual Report.
James Spencer has assumed the new role of Senior Vice President of Delphi and Sector President of Electrical and Electronics, and will have responsibility for Delphi Electrical/Electronic Architecture and Delphi Electronics and Safety. Mr. Spencer’s role will provide focus in order to leverage our broad electrical and electronics capabilities as these technologies are becoming more integral to our larger product portfolio. Using our combined electrical and electronics expertise, this strategic alignment will enable us to accelerate our product offerings and grow our business. In recognition of his additional responsibilities, Mr. Spencer’s base salary has
161
Table of Contents
been increased to $590,000. In addition, to provide operational continuity in this important new role, on February 15, 2012, in addition to his RSU award described above, Mr. Spencer was also awarded a one-time grant of 47,393 RSUs, which will cliff vest on February 15, 2015. Should Mr. Spencer terminate his employment without good reason (as defined in his award agreement) or be terminated for cause by Delphi prior to the vesting date, he will forfeit this one-time special grant in full. A form of award agreement for Mr. Spencer is attached as an exhibit to this filing.
Also on February 15, 2012, the Board approved adjustments to Rodney O’Neal’s compensation to provide both operational continuity and further align Mr. O’Neal’s compensation opportunity with the interests of the shareholders. Beginning in 2012, Mr. O’Neal’s annual incentive target was reduced by 18%, to $1,800,000. His long-term incentive award target was increased by 9%, to $6,000,000. After completion of one year of service following the grant date, Mr. O’Neal will not forfeit any unvested performance-based or time-based RSUs in the event he retires or otherwise terminates employment with Delphi (other than for cause) prior to the normally scheduled vesting date. Mr. O’Neal will also receive a cash continuity payment of $500,000 on each of January 15, 2013, 2014 and 2015, provided that he remains employed by Delphi on December 31st of the year preceding the payment date. A compensation agreement more fully describing the terms of above referenced compensation, including the 2012 long-term incentive award, is attached as an exhibit to this filing.
162
Table of Contents
PART III
ITEM 10. DIRECTORS, EXECUTIVE OFFICERS, AND CORPORATE GOVERNANCE
The information called for by Item 10, as to compliance with Section 16(a) of the Exchange Act, is incorporated by reference to the Company’s definitive Proxy Statement to be filed with the SEC pursuant to Regulation 14A in connection with the Company’s 2012 Annual Meeting of Shareholders under the heading “Other Information—Section 16(a) Beneficial Ownership Reporting Compliance.” The information called for by Item 10, as to the audit committee and the audit committee financial expert, is incorporated by reference to the Company’s definitive Proxy Statement to be filed with the SEC pursuant to Regulation 14A in connection with the Company’s 2012 Annual Meeting of Shareholders under the heading “Meetings of the Board of Directors and Committees of the Board—Audit Committee.” The information called for by Item 10, as to executive officers, is set forth under Executive Officers of the Registrant in the Supplementary Item in Part I of this Annual Report on Form 10-K. The information called for by Item 10, as to directors, is incorporated by reference to the Company’s definitive Proxy Statement to be filed with the SEC pursuant to Regulation 14A in connection with the Company’s 2012 Annual Meeting of Shareholders under the headings “Election of Directors (Item 1)” and “Board Practices—Other Matters Relating to Directors.”
The Company has adopted a code of ethics, the Code of Ethical Business Conduct, which applies to its principal executive officer, principal financial officer, principal accounting officer or controller, or persons performing similar functions, and all other employees and non-employee directors of the Company. The Code of Ethical Business Conduct is posted on the Company’s website (www.delphi.com). The Company intends to satisfy the disclosure requirement under Item 5.05 of Form 8-K regarding an amendment to, or waiver from, a provision of the code of ethics that applies to the Company’s principal executive officer, principal financial officer, principal accounting officer or controller, or persons performing similar functions, by posting such information on the Company’s website, at the address specified above.
The Company’s Corporate Governance Guidelines and charters for each Committee of its Board of Directors are also available on the Company’s website. The Code of Ethical Business Conduct, Corporate Governance Guidelines and charters are also available in print to any shareholder who submits a request to: Corporate Secretary, Delphi Automotive PLC, c/o Delphi Automotive Systems, LLC, 5725 Delphi Drive, Troy, Michigan, 48098.
Information on the Company’s website is not deemed to be incorporated by reference into this Annual Report on Form 10-K.
ITEM 11. EXECUTIVE COMPENSATION
The information called for by Item 11 is incorporated by reference to the Company’s definitive Proxy Statement to be filed with the SEC pursuant to Regulation 14A in connection with the Company’s 2012 Annual Meeting of Shareholders under the headings “Director Compensation,” “Compensation Discussion and Analysis,” “Executive Compensation” and “Report of the Compensation and Human Resources Committee.”
ITEM 12. SECURITY OWNERSHIP OF CERTAIN BENEFICIAL OWNERS AND MANAGEMENT AND RELATED STOCKHOLDER MATTERS
The information called for by Item 12, as to security ownership of certain beneficial owners, directors and management, is incorporated by reference to the Company’s definitive Proxy Statement to be filed with the SEC pursuant to Regulation 14A in connection with the Company’s 2012 Annual Meeting of Shareholders under the headings “Security Ownership of Certain Beneficial Owners” and “Security Ownership of Management.”
Information as of December 31, 2011 about the Company’s ordinary shares that may be issued under all of its equity compensation plans is set forth in Part II Item 5 of this Annual Report on Form 10-K.
163
Table of Contents
ITEM 13. CERTAIN RELATIONSHIPS AND RELATED TRANSACTIONS, AND DIRECTOR INDEPENDENCE
The information called for by Item 13, as to director independence, is incorporated by reference to the Company’s definitive Proxy Statement to be filed with the SEC pursuant to Regulation 14A in connection with the Company’s 2012 Annual Meeting of Shareholders under the heading “Board Practices–Director Independence.” The information called for by Item 13, as to related person transactions, is incorporated by reference to the Company’s definitive Proxy Statement to be filed with the SEC pursuant to Regulation 14A in connection with the Company’s 2012 Annual Meeting of Shareholders under the heading “Relationships and Related Party Transactions.”
ITEM 14. PRINCIPAL ACCOUNTING FEES AND SERVICES
The information called for by Item 14 is incorporated by reference to the Company’s definitive Proxy Statement to be filed with the SEC pursuant to Regulation 14A in connection with the Company’s 2012 Annual Meeting of Shareholders under the heading “Independent Registered Public Accountants’ Fees.”
164
Table of Contents
PART IV
ITEM 15. EXHIBITS, FINANCIAL STATEMENT SCHEDULES
(a) The following documents are filed as part of this Form 10-K.
(1) Financial Statements:
| Page No. | ||||||
| — Reports of Independent Registered Public Accounting Firm | 79 | |||||
| — Consolidated Statements of Operations for the Years Ended December 31, 2011 and 2010, the periods from August 19 to December 31, 2009 and January 1 to October 6, 2009 |
81 | |||||
| — Consolidated Statements of Comprehensive Income for the Years Ended December 31, 2011 and 2010, the Periods from August 19 to December 31, 2009 and January 1 to October 6, 2009 |
82 | |||||
| — Consolidated Balance Sheets as of December 31, 2011 and 2011 |
83 | |||||
| — Consolidated Statements of Cash Flows for the Years Ended December 31, 2011 and 2010, the periods from August 19 to December 31, 2009 and January 1 to October 6, 2009 |
84 | |||||
| — Consolidated Statements of Shareholders’ Equity (Deficit) for the Years Ended December 31, 2011 and 2010, the periods from August 19 to December 31, 2009 and January 1 to October 6, 2009 |
85 | |||||
| — Notes to Consolidated Financial Statements |
87 | |||||
(2) Financial Statement Schedule:
SCHEDULE II—VALUATION AND QUALIFYING ACCOUNTS AND RESERVES
| Additions | ||||||||||||||||||||
| Balance at Beginning of Period |
Charged to Costs and Expenses |
Deductions | Other Activity | Balance at End of Period |
||||||||||||||||
| (in millions) | ||||||||||||||||||||
| Successor |
||||||||||||||||||||
| December 31, 2011: |
||||||||||||||||||||
| Allowance for doubtful accounts |
$ | 64 | $ | 25 | $ | (16 | ) | $ | (3 | ) | $ | 70 | ||||||||
| Tax valuation allowance |
$ | 551 | $ | (1 | ) | $ | (61 | ) | $ | (17 | ) | $ | 472 | |||||||
| December 31, 2010: |
||||||||||||||||||||
| Allowance for doubtful accounts |
$ | 33 | $ | 45 | $ | (12 | ) | $ | (2 | ) | $ | 64 | ||||||||
| Tax valuation allowance |
$ | 552 | $ | 58 | $ | (35 | ) | $ | (24 | ) | $ | 551 | ||||||||
| Period from August 19 to December 31, 2009: |
||||||||||||||||||||
| Allowance for doubtful accounts |
$ | — | $ | 33 | $ | — | $ | — | $ | 33 | ||||||||||
| Tax valuation allowance |
$ | 490 | $ | 46 | $ | — | $ | 16 | $ | 552 | ||||||||||
| Predecessor |
||||||||||||||||||||
| Period from January 1 to October 6, 2009: |
||||||||||||||||||||
| Allowance for doubtful accounts |
$ | 134 | $ | 22 | $ | (47 | ) | $ | (109 | ) | $ | — | ||||||||
| Tax valuation allowance |
$ | 9,144 | $ | (237 | ) | $ | — | $ | (8,417 | )(1) | $ | 490 | ||||||||
| (1) | Other activity represents the loss of Delphi’s U.S. net operating loss carry forwards and other tax attributes in connection with the October 6, 2009 acquisition of substantially all of the Predecessor’s businesses, resulting in a corresponding reduction in the valuation allowance. |
The other schedules have been omitted because they are not applicable, not required or the information to be set forth therein is included in the Consolidated Financial Statements or notes thereto.
165
Table of Contents
(3) Exhibits: (including those incorporated by reference)
| Exhibit Number |
Description | |
| 2.1 |
Master Disposition Agreement among Delphi Corporation, GM Components Holdings, LLC, General Motors Company, Motors Liquidation Company (fka General Motors Corporation), DIP Holdco 3, LLC, and the other sellers and other buyers party thereto, dated July 26, 2009(1) | |
| 3.1 |
Memorandum and Articles of Association(4) | |
| 4.1 |
Form of Ordinary Share Certificate(3) | |
| 4.2 |
Senior Notes Indenture, dated as of May 17, 2011, among Delphi Corporation, the guarantors party thereto, Wilmington Trust Company, as trustee, and Deutsche Bank Trust Company Americas, as registrar, paying agent and authenticating agent (including forms of notes)(1) | |
| 4.3 |
Fourth Amended and Restated Limited Liability Partnership Agreement of Delphi Automotive LLP dated as of July 12, 2011(2) | |
| 10.1 |
Redemption Agreement between Delphi Automotive LLP and General Motors Holding LLC, dated as of March 31, 2011(1) | |
| 10.2 |
Rights Modification Agreement dated as of March 31, 2011, by and among Delphi Automotive LLP and each of the holders of Class B membership interests party thereto(1) | |
| 10.3 |
Amended and Restated Credit Agreement among Delphi Automotive LLP, as Parent, Delphi Holdings S.A.R.L., as Intermediate Holdco, Delphi Corporation, as Borrower, the Lenders party thereto, JPMorgan Chase Bank, N.A., as Administrative Agent, Citibank, N.A., as Syndication Agent, Bank of America, N.A., Barclays Bank plc and Deutsche Bank Trust Company Americas, as Co-Documentation Agents, and J.P. Morgan Securities LLC, as Sole Bookrunner and Sole Lead Arranger, dated as of May 17, 2011(1) | |
| 10.4 |
Form of Registration Rights Agreement(2) | |
| 10.5 |
First Amended and Restated Delphi Automotive LLP Board of Managers 2010 Class E-1 Interest Incentive Plan(3)+ | |
| 10.6 |
Form of Restricted Interest Grant Notice and Agreement(3)+ | |
| 10.7 |
First Amended and Restated Delphi Automotive LLP 2010 Management Value Creation Plan(3)+ | |
| 10.8 |
Form of Non-Officer Executive Participation Agreement pursuant to the Delphi Automotive LLP 2010 Management Value Creation Plan(3)+ | |
| 10.9 |
Form of Officer Participation Agreement pursuant to the Delphi Automotive LLP 2010 Management Value Creation Plan(3)+ | |
| 10.10 |
Form of Confidentiality and Noninterference Agreement pursuant to the Delphi Automotive LLP 2010 Management Value Creation Plan(3)+ | |
| 10.11 |
Form of Delphi Automotive LLP Letter re: Special Bonus for Initial Public Offering or Sale of the Company(3)+ | |
| 10.12 |
Delphi LLC Annual Incentive Plan(1)+ | |
| 10.13 |
Delphi Corporation Supplemental Executive Retirement Program(1)+ | |
| 10.14 |
Delphi Corporation Salaried Retirement Equalization Savings Program(1)+ | |
| 10.15 |
Delphi Automotive PLC Long Term Incentive Plan(3)+ |
166
Table of Contents
| Exhibit Number |
Description | |
| 10.16 |
Form of Non-Employee Director RSU Award Agreement pursuant to Delphi Automotive PLC Long Term Incentive Plan(5)+ | |
| 10.17 |
Offer letter for Rodney O’Neal, dated October 2, 2009(1)+ | |
| 10.18 |
Offer letter for James A. Bertrand, dated October 2, 2009(1)+ | |
| 10.19 |
Offer letter for Ronald M. Pirtle, dated October 2, 2009(1)+ | |
| 10.20 |
Offer letter for James A. Spencer, dated October 2, 2009(1)+ | |
| 10.21 |
Offer letter for Keith D. Stipp, dated October 2, 2009(1)+ | |
| 10.22 |
Offer letter for John D. Sheehan, dated October 2, 2009(1)+ | |
| 10.23 |
Offer letter for Kevin P. Clark, dated June 10, 2010(1)+ | |
| 10.24 |
Executive Release of Claims, Separation, Non-Solicitation and Non-Compete Agreement between Delphi Corporation and John D. Sheehan, dated February 22, 2010(1)+ | |
| 10.25 |
Form of Officer RSU Award Agreement pursuant to Delphi Automotive PLC Long Term Incentive Plan*+ | |
| 10.26 |
CEO RSU Award Agreement pursuant to Delphi Automotive PLC Long Term Incentive Plan*+ | |
| 10.27 |
Form of Officer RSU Award Agreement (including Continuity Incentive RSU Award) pursuant to Delphi Automotive PLC Long Term Incentive Plan*+ | |
| 12.1 |
Computation of Ratio of Earnings to Fixed Charges* | |
| 21.1 |
Subsidiaries of the Registrant* | |
| 23.1 |
Consent of Ernst & Young LLP* | |
| 31.1 |
Rule 13a-14(a)/15d-14(a) Certification of Principal Executive Officer.* | |
| 31.2 |
Rule 13a-14(a)/15d-14(a) Certification of Principal Financial Officer.* | |
| 32.1 |
Certification by Chief Executive Officer pursuant to 18 U.S.C. Section 1350, as adopted pursuant to Section 906 of the Sarbanes-Oxley Act of 2002.* | |
| 32.2 |
Certification by Chief Financial Officer pursuant to 18 U.S.C. Section 1350, as adopted pursuant to Section 906 of the Sarbanes-Oxley Act of 2002.* |
* Filed herewith.
+ Management contract or compensatory plan or arrangement.
(1) Filed with the Registration Statement on Form S-1 (File No. 333-174493) of Delphi Automotive PLC on June 30, 2011.
(2) Filed with the Registration Statement on Form S-1 (File No. 333-174493) of Delphi Automotive PLC on August 1, 2011.
(3) Filed with the Registration Statement on Form S-1 (File No. 333-174493) of Delphi Automotive PLC on October 31, 2011.
(4) Filed with the Registration Statement on Form 8-A (File No. 001-35346) of Delphi Automotive PLC on November 10, 2011.
(5) Filed with the Registration Statement on Form S-1 (File No. 333-174493) of Delphi Automotive PLC on February 1, 2012.
167
Table of Contents
SIGNATURES
Pursuant to the requirements of Section 13 or 15(d) of the Securities Exchange Act of 1934, the registrant has duly caused this report to be signed on its behalf by the undersigned, thereunto duly authorized.
| DELPHI AUTOMOTIVE PLC |
| /s/ Kevin P. Clark |
| By: Kevin P. Clark Senior Vice President and Chief Financial Officer |
Dated: February 17, 2012
Pursuant to the requirements of the Securities Exchange Act of 1934, this report has been signed below as of February 17, 2012, by the following persons on behalf of the registrant and in the capacities indicated:
| Title |
Signature | |
| /s/ Rodney O’Neal |
Chief Executive Officer, President & Director | |
| Rodney O’Neal | ||
| /s/ Kevin P. Clark |
Senior Vice President and Chief Financial Officer | |
| Kevin P. Clark | ||
| /s/ Allan J. Brazier |
Chief Accounting Officer (Principal Accounting Officer) | |
| Allan J. Brazier | ||
| /s/ John A. Krol |
Chairman of the Board of Directors | |
| John A. Krol | ||
| /s/ Gary L. Cowger |
Director | |
| Gary L. Cowger | ||
| /s/ Nicholas M. Donofrio |
Director | |
| Nicholas M. Donofrio | ||
| /s/ Mark P. Frissora |
Director | |
| Mark P. Frissora | ||
| /s/ Rajiv L. Gupta |
Director | |
| Rajiv L. Gupta | ||
| /s/ J. Randall MacDonald |
Director | |
| J. Randall MacDonald | ||
168
Table of Contents
| /s/ Sean O. Mahoney |
Director | |
| Sean O. Mahoney | ||
| /s/ Michael McNamara |
Director | |
| Michael McNamara | ||
| /s/ Thomas W. Sidlik |
Director | |
| Thomas W. Sidlik | ||
| /s/ Bernd Wiedemann |
Director | |
| Bernd Wiedemann | ||
| /s/ Lawrence A. Zimmerman |
Director | |
| Lawrence A. Zimmerman | ||
169