Attached files
| file | filename |
|---|---|
| 8-K - FORM 8-K COVER - Frontier Communications Parent, Inc. | form8kcoverpras.htm |
| EX-99.3 - PRO FORMAS - Frontier Communications Parent, Inc. | proformas.htm |
| EX-99.1 - 4Q'11 PRESS RELEASE/ANALYST SCHEDULES - Frontier Communications Parent, Inc. | pranalsched4q11.htm |

Investor Update
Fourth Quarter 2011
February 16, 2012

2
Safe Harbor Statement
Forward-Looking Language
This document contains forward-looking statements that are subject to risks and uncertainties that could cause actual results to differ materially from those expressed or implied in
the financial statements. Statements that are not historical facts are forward-looking statements made pursuant to the safe harbor provisions of the Private Securities Litigation
Reform Act of 1995. Words such as “believe,” “anticipate,” “expect” and similar expressions are intended to identify forward-looking statements. Forward-looking statements
(including oral representations) are only predictions or statements of current plans, which we review continuously. Forward-looking statements may differ from actual future results
due to, but not limited to, and our future results may be materially affected by, potential risks or uncertainties. You should understand that it is not possible to predict or identify all
potential risks or uncertainties. We note the following as a partial list:our ability to successfully integrate the remaining operations and systems of the Acquired Business into
Frontier’s existing operations and systems; the risk that the growth opportunities from the Transaction may not be fully realized or may take longer to realize than expected; our
indemnity obligation to Verizon for taxes which may be imposed upon them as a result of changes in ownership of our stock may discourage, delay or prevent a third party from
acquiring control of us during the two-year period ending July 2012 in a transaction that stockholders might consider favorable; the effects of increased expenses incurred due to
activities related to the integration of the Acquired Business; our ability to maintain relationships with customers, employees or suppliers; the effects of greater than anticipated
competition requiring new pricing, marketing strategies or new product or service offerings and the risk that we will not respond on a timely or profitable basis; reductions in the
number of our access lines that cannot be offset by increases in High-Speed Internet (HSI) subscribers and sales of other products and services; the effects of ongoing changes in
the regulation of the communications industry as a result of federal and state legislation and regulation, or changes in the enforcement or interpretation of such legislation and
regulation; the effects of any unfavorable outcome with respect to any current or future legal, governmental or regulatory proceedings, audits or disputes; the effects of changes in
the availability of federal and state universal funding to us and our competitors; the effects of competition from cable, wireless and other wireline carriers; our ability to adjust
successfully to changes in the communications industry and to implement strategies for growth; continued reductions in switched access revenues as a result of regulation,
competition or technology substitutions; our ability to effectively manage service quality in our territories and meet mandated service quality metrics; our ability to successfully
introduce new product offerings, including our ability to offer bundled service packages on terms that are both profitable to us and attractive to customers; changes in accounting
policies or practices adopted voluntarily or as required by generally accepted accounting principles or regulations; our ability to effectively manage our operations, operating
expenses and capital expenditures, and to repay, reduce or refinance our debt; the effects of changes in both general and local economic conditions on the markets that we serve,
which can affect demand for our products and services, customer purchasing decisions, collectability of revenues and required levels of capital expenditures related to new
construction of residences and businesses; the effects of technological changes and competition on our capital expenditures and product and service offerings, including the lack
of assurance that our network improvements will be sufficient to meet or exceed the capabilities and quality of competing networks; the effects of increased medical and pension
expenses and related funding requirements; changes in income tax rates, tax laws, regulations or rulings, or federal or state tax assessments; the effects of state regulatory cash
management practices that could limit our ability to transfer cash among our subsidiaries or dividend funds up to the parent company; our ability to successfully renegotiate union
contracts expiring in 2012 and thereafter; changes in pension plan assumptions and/or the value of our pension plan assets, which would require us to make increased
contributions to the pension plan in 2013 and beyond; the effects of customer bankruptcies and home foreclosures, which could result in difficulty in collection of revenues and loss
of customers; adverse changes in the credit markets or in the ratings given to our debt securities by nationally accredited ratings organizations, which could limit or restrict the
availability, or increase the cost, of financing; limitations on the amount of capital stock that we can issue to make acquisitions or to raise additional capital until July 2012; our
ability to pay dividends on our common shares, which may be affected by our cash flow from operations, amount of capital expenditures, debt service requirements, cash paid for
income taxes and liquidity; and the effects of severe weather events such as hurricanes, tornados, ice storms or other natural or man-made disasters. These and other
uncertainties related to our business are described in greater detail in our filings with the Securities and Exchange Commission, including our report on Forms 10-K, and the
foregoing information should be read in conjunction with these filings. We undertake no obligation to publicly update or revise any forward-looking statements or to make any other
forward-looking statement, whether as a result of new information, future events or otherwise unless required to do so by securities laws.

3
Non-GAAP Financial Measures
The Company uses certain non-GAAP financial measures in evaluating its performance. These include free cash flow, EBITDA or “operating cash flow,” which
we define as operating income plus depreciation and amortization (“EBITDA”), and Adjusted EBITDA; a reconciliation of the differences between EBITDA and
free cash flow and the most comparable financial measures calculated and presented in accordance with GAAP is included in the appendix. The non-GAAP
financial measures are by definition not measures of financial performance under generally accepted accounting principles and are not alternatives to operating
income or net income reflected in the statement of operations or to cash flow as reflected in the statement of cash flows and are not necessarily indicative of
cash available to fund all cash flow needs. The non-GAAP financial measures used by the Company may not be comparable to similarly titled measures of
other companies.
The Company believes that the presentation of non-GAAP financial measures provides useful information to investors regarding the Company’s financial
condition and results of operations because these measures, when used in conjunction with related GAAP financial measures, (i) together provide a more
comprehensive view of the Company’s core operations and ability to generate cash flow, (ii) provide investors with the financial analytical framework upon
which management bases financial, operational, compensation and planning decisions and (iii) presents measurements that investors and rating agencies
have indicated to management are useful to them in assessing the Company and its results of operations. In addition, the Company believes that free cash
flow and EBITDA, as the Company defines them, can assist in comparing performance from period to period, without taking into account factors affecting cash
flow reflected in the statement of cash flows, including changes in working capital and the timing of purchases and payments.
The Company has shown adjustments to its financial presentations to exclude certain costs because investors have indicated to management that such
adjustments are useful to them in assessing the Company and its results of operations. These adjustments are detailed in the Appendix for the reconciliation
of free cash flow and operating cash flow.
adjustments are useful to them in assessing the Company and its results of operations. These adjustments are detailed in the Appendix for the reconciliation
of free cash flow and operating cash flow.
Management uses these non-GAAP financial measures to (i) assist in analyzing the Company’s underlying financial performance from period to period, (ii)
evaluate the financial performance of its business units, (iii) analyze and evaluate strategic and operational decisions, (iv) establish criteria for compensation
decisions, and (v) assist management in understanding the Company’s ability to generate cash flow and, as a result, to plan for future capital and operational
decisions. Management uses these non-GAAP financial measures in conjunction with related GAAP financial measures. These non-GAAP financial measures
have certain shortcomings. In particular, free cash flow does not represent the residual cash flow available for discretionary expenditures, since items such as
debt repayments and dividends are not deducted in determining such measure. EBITDA has similar shortcomings as interest, income taxes, capital
expenditures, debt repayments and dividends are not deducted in determining this measure. Management compensates for the shortcomings of these
measures by utilizing them in conjunction with their comparable GAAP financial measures. The information in this document should be read in conjunction with
the financial statements and footnotes contained in our documents filed with the U.S. Securities and Exchange Commission.
4
Summary
● Board declaration of $0.10 quarterly dividend to
shareholders of record as of March 9, 2012
shareholders of record as of March 9, 2012
● Proactive dividend reduction to strengthen the balance
sheet and to improve operational and financial flexibility
sheet and to improve operational and financial flexibility
● Strongest quarterly revenue performance and EBITDA
margin since Verizon acquisition
margin since Verizon acquisition
● Successful 4-State conversion in Q4 2011 that leads to
us accelerating final systems conversion to begin March
2012
us accelerating final systems conversion to begin March
2012
● Raised synergy target to $650M by year-end 2012

5
New Dividend Policy
|
$0.40 Dividend Policy Rationale
|
|
|
|
|
|
Faster Leverage
Reduction, Improved Access to Capital |
Necessary to achieve 2.5x
leverage target; ability to refinance upcoming debt maturities at more favorable rates or pay down debt with available cash |
|
|
|
|
Increased
Investment in Strategic Initiatives |
Investment in growth initiatives
(Fiber-to-the-Cell, VDSL2), process automation, and new products |
|
|
|
|
Dividend Return
More Sustainable |
Lower payout ratio (42% at
midpoint of 2012 FCF guidance) |
● Annual dividend
reduced to $0.40
reduced to $0.40
● Strengthens the
balance sheet
balance sheet
● Improves operational
& financial flexibility
& financial flexibility
● Provides for:
§ Debt maturities
§ Competitive
response
response
§ Cash taxes
§ Pension
contributions
contributions

6
Fourth Quarter 2011 Highlights
● Strongest quarterly revenue performance since the
acquisition; total revenues down just $8M sequentially
acquisition; total revenues down just $8M sequentially
● Adjusted EBITDA margin 48%; strongest to date
● Generated incremental synergies of $14M; run rate now $552M,
raised synergy target to $650M by year-end 2012
raised synergy target to $650M by year-end 2012
● 2011 FCF of $1.1 billion at midpoint of guidance
● Broadband availability increased by 64,000 new homes;
415,000 year-to-date
415,000 year-to-date
● 4-State successful systems conversion and prep work for the
final nine-state systems conversion scheduled to begin March
2012, ahead of original 4Q12 target.
final nine-state systems conversion scheduled to begin March
2012, ahead of original 4Q12 target.

7
Quarterly Snapshot

8
Cash Flow
● 4Q11 Adjusted
EBITDA margin 48%
EBITDA margin 48%
● FCF should be
positively impacted
by further synergies,
revenue traction, and
completion of
broadband expansion
in 2013
positively impacted
by further synergies,
revenue traction, and
completion of
broadband expansion
in 2013
● Dividend coverage
improves by $348
million on new $0.40
dividend level
improves by $348
million on new $0.40
dividend level
Notes: $ Millions; See Appendix for calculation of Free Cash Flow (FCF).
Notes: $ Millions; See Appendix for calculation of Free Cash Flow (FCF).

9
Credit & Liquidity
● Leverage (Net Debt /
EBITDA) has
increased since the
acquisition
EBITDA) has
increased since the
acquisition
● Upcoming debt
payments ($Mil.):
payments ($Mil.):
Ø 2012: $94
Ø 2013: $639
Ø 2014: $658
Ø 2015: $858
● Over $1B of current
liquidity. Dividend
reduction generates
an incremental $1.4B
cash 2012-15
liquidity. Dividend
reduction generates
an incremental $1.4B
cash 2012-15
Notes: $ Millions. (1) Includes Restricted Cash; (2) Calculation excludes $72M and $63M of escrow cash as of 4Q10 and
4Q11, respectively.
4Q11, respectively.
Notes: $ Millions. (1) Includes Restricted Cash; (2) Calculation excludes $72M and $63M of escrow cash as of 4Q10 and
4Q11, respectively.
4Q11, respectively.

10
Business Update
● Business revenues grew 1.7% sequentially; now 52% of
total customer revenue
total customer revenue
● Ethernet expanded to 75% of markets with speeds up to
1Gbps
1Gbps
● Enterprise/Medium customer growth
● Local engagement and increased sales force productivity
drove +4.4% increase in average monthly recurring
revenue to $627
drove +4.4% increase in average monthly recurring
revenue to $627
● Lowest churn (1.53%) and net customer losses (71k) since
acquisition. Solid performance in both Legacy & Acquired.
acquisition. Solid performance in both Legacy & Acquired.
● Sequentially lower broadband net additions due to
conversions, as expected
conversions, as expected
● No significant promotions and incentives in 4Q11
Commercial
Commercial
Residential
Residential
11
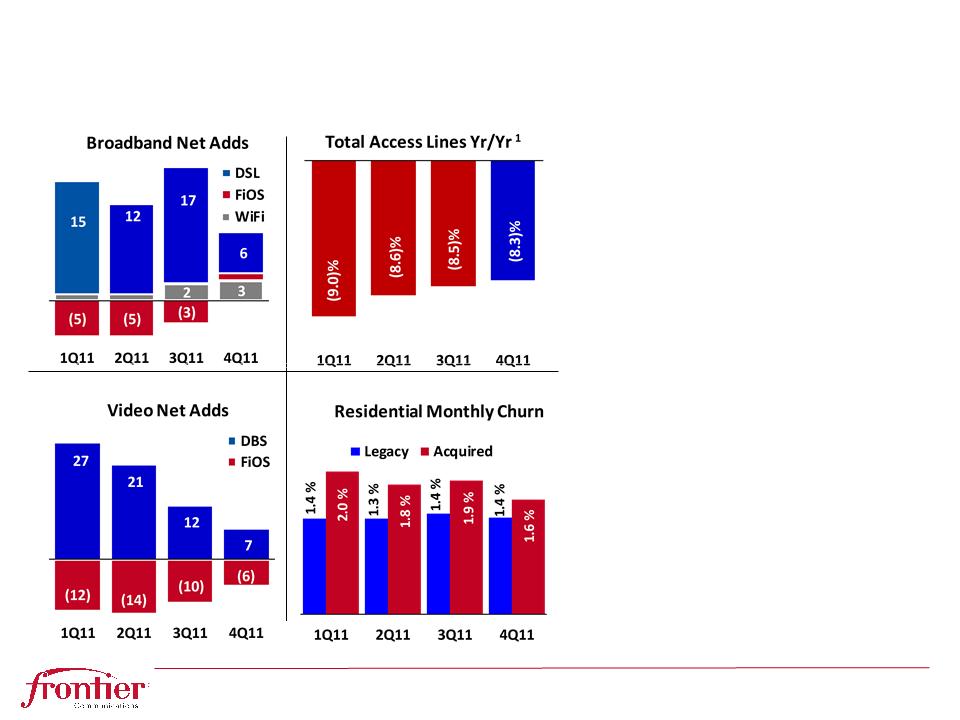
Key Metrics
● Broadband growth in
all three categories
all three categories
● No significant video
promotions in 4Q11;
lower FiOS losses
promotions in 4Q11;
lower FiOS losses
● Consistent
improvement in line
losses from 9.7% in
2Q10
improvement in line
losses from 9.7% in
2Q10
● Network
improvements and
customer focus
continue to reduce
churn
improvements and
customer focus
continue to reduce
churn
Notes: (1) Comparisons to amounts prior to 7/1/10 pro forma for the Acquired Properties. Subscriber units in 000s
Notes: (1) Comparisons to amounts prior to 7/1/10 pro forma for the Acquired Properties. Subscriber units in 000s

12
West Virginia Example
● Converted onto Legacy systems at closing on July 1, 2010
● Have built 2,000 route miles of ROADM networks connecting 65
central offices with 900Gbps of capacity
central offices with 900Gbps of capacity
● Operating on Legacy processes and systems for 6 quarters
13
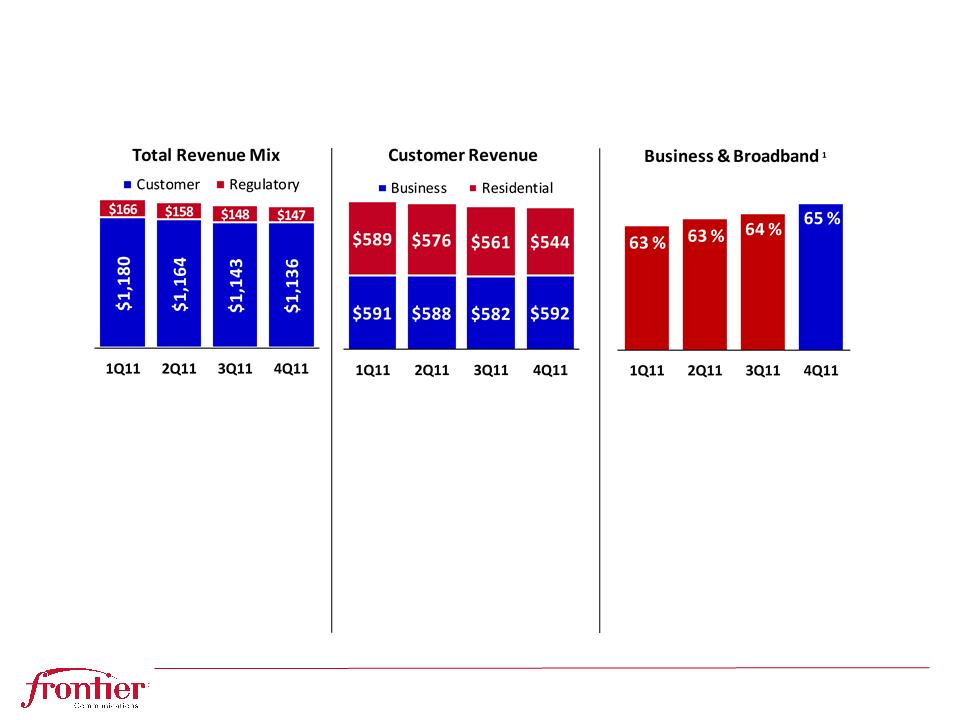
Revenues
● Regulatory
revenues 11.5% of
4Q11 total
revenues 11.5% of
4Q11 total
● ICC 5.7% of total
revenue, USF
3.8% excluding
surcharges
revenue, USF
3.8% excluding
surcharges
Notes: $ Millions; Numbers may not sum due to rounding. (1) as a percentage of Customer Revenue.
Notes: $ Millions; Numbers may not sum due to rounding. (1) as a percentage of Customer Revenue.
● Business
represents 52% of
total customer
revenues
represents 52% of
total customer
revenues
● Business ARPU
up 4.4% to $627
up 4.4% to $627
● Increased
exposure to
business and
broadband
revenues
exposure to
business and
broadband
revenues
14
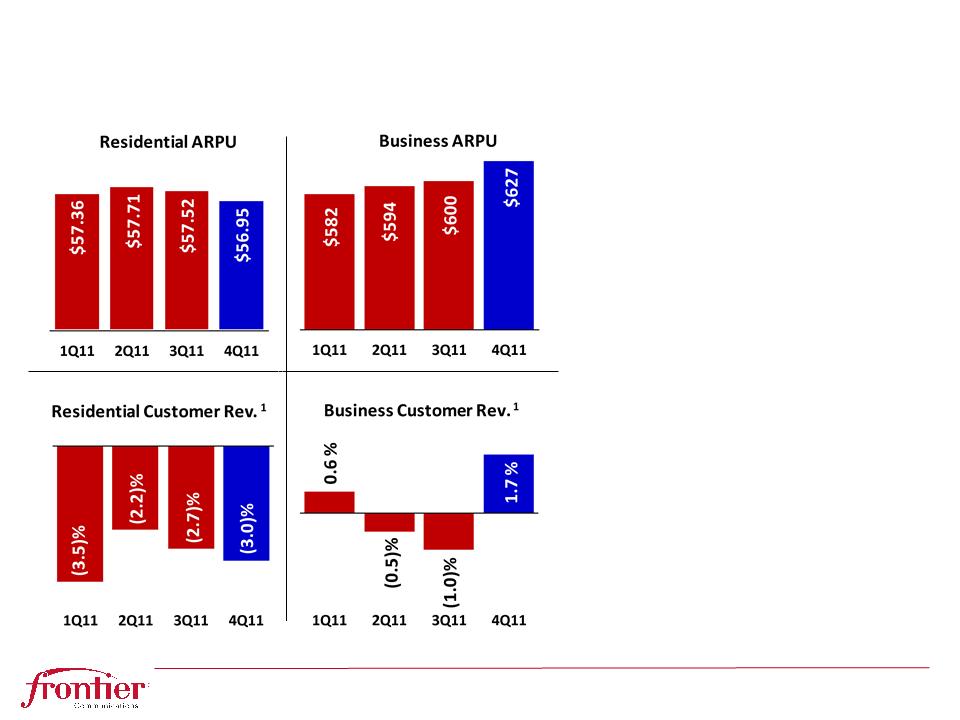
Residential & Business
● Acquired Residential
ARPU has +9% upside
to Legacy levels.
ARPU has +9% upside
to Legacy levels.
● Expect improvements
in Residential revenue
and ARPU as
broadband
penetration increases
in Residential revenue
and ARPU as
broadband
penetration increases
● Business ARPU
reflects additional
products and larger
customers. Strong
CPE installations in
4Q11.
reflects additional
products and larger
customers. Strong
CPE installations in
4Q11.
Notes: 1) Sequential quarterly change.
Notes: 1) Sequential quarterly change.
15
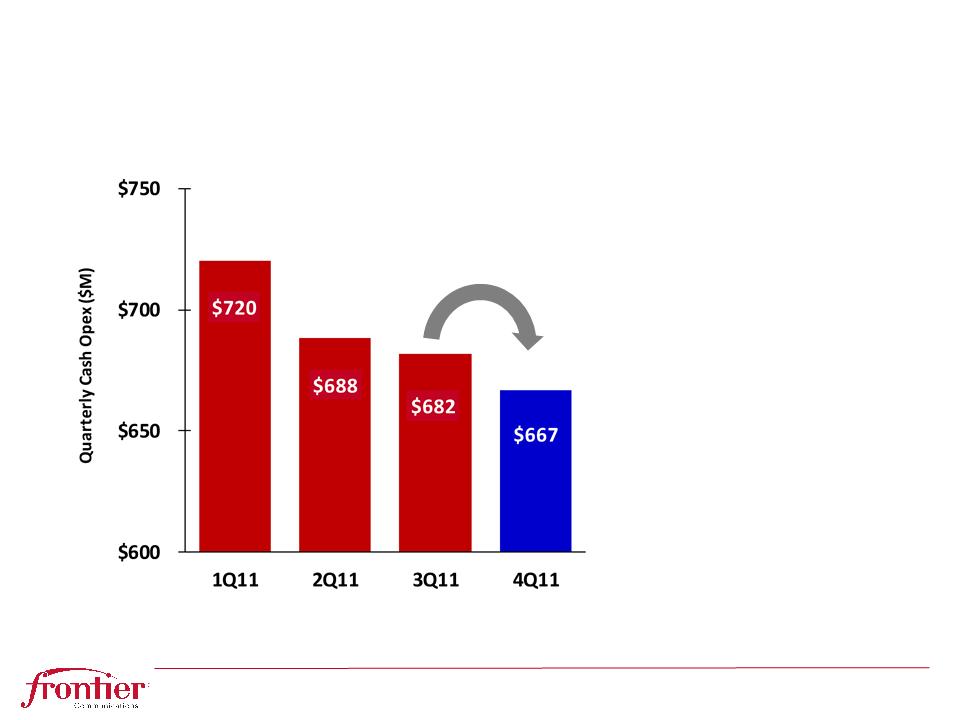
Cash Operating Expenses
Notes: $ Millions; Please see Non-GAAP reconciliations in Appendix.
Notes: $ Millions; Please see Non-GAAP reconciliations in Appendix.
● Cash operating
expenses down $15M
sequentially and
14.4% from date of
acquisition
expenses down $15M
sequentially and
14.4% from date of
acquisition
● Continued extensive
focus and discipline
on synergy list and
other areas of cost
control
focus and discipline
on synergy list and
other areas of cost
control
$15 Million
Reduction
Reduction

16
Cost Savings
● $14M incremental
synergies from IT,
backbone, wage, and
other savings
synergies from IT,
backbone, wage, and
other savings
● Raising run-rate
target +8% to $650M
by year-end 2012
target +8% to $650M
by year-end 2012
● Remaining synergies
from IT costs,
network savings, real
estate, administrative
and customer support
from IT costs,
network savings, real
estate, administrative
and customer support
Notes: $ Millions
Notes: $ Millions
Targets

17
Systems Integration Progress
|
Closing
Conversion (WV)
|
|
Bell Atlantic
system |
|
Completed:
July 1, 2010
|
|
13% of Lines
|
|
Frontier 4
(IN, MI, NC, SC)
|
|
GTE system
|
|
Completed:
October 1, 2011
|
|
34% of Lines
|
|
Frontier 9
(IL, OH, WI, OR,
CA, AZ, ID, NV, WA) |
|
GTE system
|
|
Scheduled:
March 2012
|
|
53% of Lines
|
|
Frontier 13
(All States)
|
|
Financial Systems
|
|
Completed:
October 1, 2011
|
|
100% of Lines
|
FTR is nearing the finish line…
Frontier 9 state
systems and
processes are
identical to the
Frontier 4 just
converted
systems and
processes are
identical to the
Frontier 4 just
converted
18
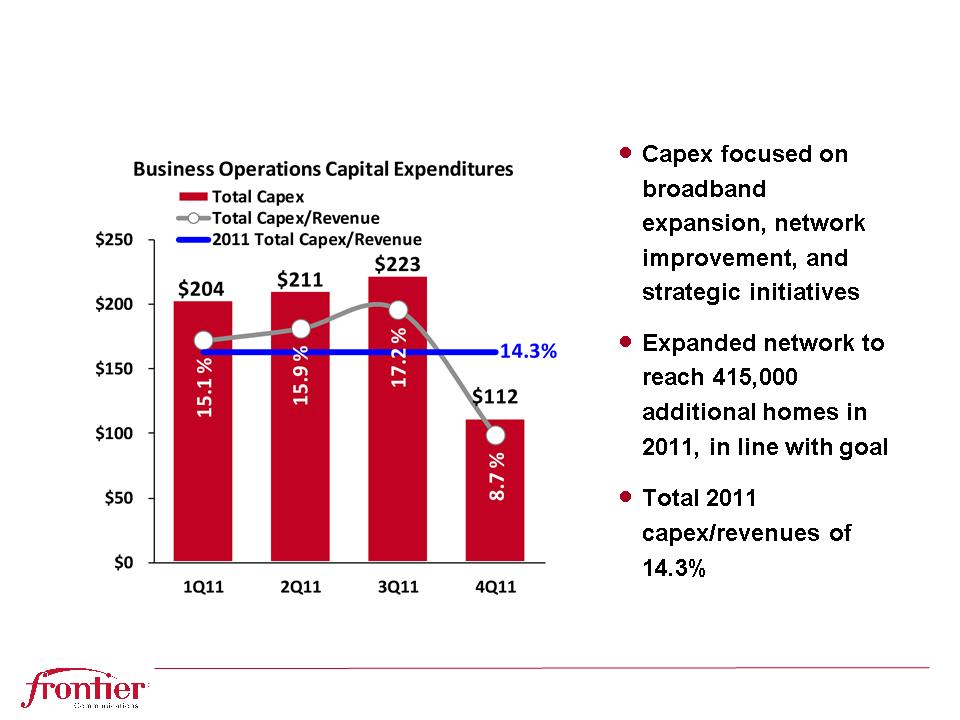
Capital Expenditures
Notes: $ Millions. Numbers may not sum due to rounding.
Notes: $ Millions. Numbers may not sum due to rounding.

19
Guidance
Notes: $ Millions. See Appendix for calculation of Free Cash Flow. (1) Cash Taxes reflect refunds in 2011.
Notes: $ Millions. See Appendix for calculation of Free Cash Flow. (1) Cash Taxes reflect refunds in 2011.
● Capital expenditures in 2012 include increased broadband expansion
and speed, fiber-to-the-cell, and other strategic initiatives
and speed, fiber-to-the-cell, and other strategic initiatives
● Incurred additional integration expense and capital in 4Q11 to accelerate
conversions beginning March 2012
conversions beginning March 2012

20
Appendix

21
Reconciliation of Non-GAAP Financial Measures
Notes: Please refer to our Historical and Operating data, filed as an 8-K, for explanatory notes which are an integral part of the historical financial data.
Notes: Please refer to our Historical and Operating data, filed as an 8-K, for explanatory notes which are an integral part of the historical financial data.

22
Reconciliation of Non-GAAP Financial Measures
Notes: Please refer to our Historical and Operating data, filed as an 8-K, for explanatory notes which are an integral part of the historical financial data.
Notes: Please refer to our Historical and Operating data, filed as an 8-K, for explanatory notes which are an integral part of the historical financial data.

23
Frontier Communications Corp.
(NASDAQ: FTR)
Investor Relations
Investor Relations
Frontier Communications Corp.
Frontier Communications Corp.
3 High Ridge Park
3 High Ridge Park
Stamford, CT 06905
Stamford, CT 06905
203.614.4606
203.614.4606
IR@FTR.com
IR@FTR.com