Attached files
| file | filename |
|---|---|
| 8-K - 8-K - CF Industries Holdings, Inc. | a12-4924_28k.htm |
Exhibit 99.1
|
|
2011 Fourth Quarter Financial Results February 16, 2012 NYSE: CF |
|
|
All statements in this presentation, other than those relating to historical facts, are forward-looking statements. These forward-looking statements are not guarantees of future performance and are subject to a number of assumptions, risks and uncertainties, many of which are beyond our control, which could cause actual results to differ materially from such statements. Important factors that could cause actual results to differ materially from our expectations include, among others: the volatility of natural gas prices in North America; the cyclical nature of our business and the agricultural sector; the global commodity nature of our fertilizer products, the impact of global supply and demand on our selling prices, and the intense global competition in the markets in which we operate; conditions in the U.S. agricultural industry; reliance on third party providers of transportation services and equipment; our ability to integrate the systems of CF Industries and Terra, including the implementation of a new enterprise resource planning system; weather conditions; risks associated with expansion of our business, including unanticipated adverse consequences and the significant resources that could be required; potential liabilities and expenditures related to environmental and health and safety laws and regulations; our potential inability to obtain or maintain required permits and governmental approvals or to meet financial assurance requirements; future regulatory restrictions and requirements related to greenhouse gas emissions and climate change; the seasonality of the fertilizer business; the impact of changing market conditions on our forward sales programs; risks involving derivatives and the effectiveness of our risk measurement and hedging activities; the significant risks and hazards involved in producing and handling our products against which we may not be fully insured; our reliance on a limited number of key facilities; risks associated with joint ventures; acts of terrorism and regulations to combat terrorism; difficulties in securing the supply and delivery of raw materials we use and increases in their costs; risks associated with international operations; losses on our investments in securities; deterioration of global market and economic conditions; our ability to manage our indebtedness; and loss of key members of management and professional staff. More detailed information about factors that may affect our performance may be found in our filings with the Securities and Exchange Commission, including our most recent periodic reports filed on Form 10-K and Form 10-Q, which are available in the Investor Relations section of the CF Industries Web site. Forward-looking statements are given only as of the date of this presentation and we disclaim any obligation to update or revise the forward-looking statements, whether as a result of new information, future events or otherwise, except as required by law. Safe Harbor Statement |
|
|
Financial Highlights In millions, except percentages and EPS 2011 Q4 2010 Q4 FY 2011 FY 2010 Net sales $ 1,718 $ 1,238 $ 6,098 $ 3,965 Gross margin 865 484 2,896 1,180 - As percent of sales 50% 39% 47% 30% EBITDA(1) $ 871 $ 500 $ 2,986 $ 1,127 Net earnings attributable to common stockholders 439 200 1,539 349 Earnings per diluted share 6.66 2.78 21.98 5.34 Cash flow provided by operations 124 560 2,079 1,194 Net debt at period end(2) 668 1,590 668 1,590(1) See slide 8 for reconciliation(2) See slide 12 for reconciliation 3 |
|
|
2011 Accomplishments Record production, sales volume, sales, earnings and cash flow Solidified platform and ability to maximize margins of the larger company Grew through added UAN and UL capacity Announced up to $1.0 to $1.5 billion expansion plan in existing nitrogen plants Retired term loan and repurchased $1.0 billion of common stock 4 |
|
|
Record Profits and Cash Flow 2006 2007 2008 2009 2010 2011 Earnings per Share Operating Cash Flow (millions) 5 |
|
|
Nitrogen Segment Results Graph source: Green Markets 2009 2010 2011 In millions, except as noted 2011 Q4 H/(L) 2010 Q4 H/(L) 2011 Q3 Sales $ 1,463 $ 461 $ 345 Gross margin 786 365 234 - Percent 54% 12 pts 4 pts Volume (000 st) 3,344 (6) 301 Average selling prices ($/st) - Ammonia $ 633 $ 181 $ 81 - Urea 465 134 40 - UAN 354 148 35 - AN 258 47 (11) Gas cost $/MMBtu $ 4.06 $ (0.23) $ (0.39) Ammonia Urea UAN-32 Mid-Corn Belt Prices 6 $/st |

|
|
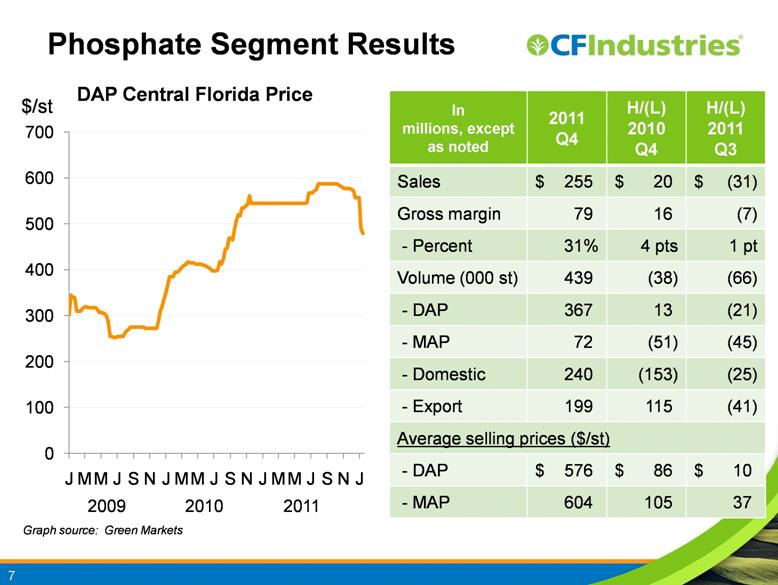
Graph source: Green Markets In millions, except as noted 2011 Q4 H/(L) 2010 Q4 H/(L) 2011 Q3 Sales $ 255 $ 20 $ (31) Gross margin 79 16 (7) - Percent 31% 4 pts 1 pt Volume (000 st) 439 (38) (66) - DAP 367 13 (21) - MAP 72 (51) (45) - Domestic 240 (153) (25) - Export 199 115 (41) Average selling prices ($/st) - DAP $ 576 $ 86 $ 10 - MAP 604 105 37 DAP Central Florida Price Phosphate Segment Results 2009 2010 2011 7 $/st |
|
|
EBITDA and Selected Items (in millions; includes Terra results from Apr. 5, 2010) Quarter ended Dec. 31, Twelve Months ended Dec. 31, 2011 2010 2011 2010 Net earnings attributable to common stockholders $ 438.9 $ 200.3 $ 1,539.2 $ 349.2 Interest expense (income) – net 32.0 50.2 145.5 219.8 Income taxes 306.4 172.0 932.0 276.8 Depreciation, depletion and amortization 101.3 106.3 416.2 394.8 Less: Other adjustments(1) (8.0) (29.3) (47.2) (113.6) EBITDA(2) $ 870.6 $ 499.5 $ 2,985.7 $ 1,127.0 Memo: Selected items included above Unrealized mark-to-market losses $ 49.7 $ (31.4) $ 77.3 $ (9.6) Impairment of methanol assets (0.3) - 34.8 - (Gain) on sale of non-core assets - - (34.5) - Restructuring and integration costs 0.2 3.7 4.4 21.6 Other business combination costs - - - 181.0 (Gain) on sale of Terra shares - - - (28.3) Peru project development costs 0.3 0.4 1.2 5.8 Total $ 49.9 $ (27.3) $ 83.2 $ 170.5 (1) Includes amortization of deferred loan fees and depreciation in noncontrolling interest. See slide 12 for additional non-GAAP information. 8 |
|
|
Capital Deployment Share Repurchases Q4: Repurchased 0.9 million shares for $198 million 2011: Repurchased 6.5 million shares for $1.0 billion 2011 repurchases constrained by credit agreement Available basket replenished, allowing repurchases to resume $500 million of authorization remains Brown Field Expansions FEED studies underway for proposed projects Most projects to be ready for decisions in 2H 2012 2012 cap ex for these projects expected to be minimal 9 |
|
|
Repurchase Impact on EPS Share repurchase program reduced share count by 6.5 million shares Lower average share count compared to Q2 increased Q4 EPS by $0.60 10 |
|
|
Outlook/Summary Tight grain stocks and high projected crop prices Forecast U.S. corn planting of 93.5 million acres Near-record level of nitrogen demand A moderate-sized order book Ability to benefit from potentially higher spring prices Some weakness in phosphate demand Supply response to help Lower raw materials costs Higher floor price and better cost visibility for nitrogen 11 |
|
|
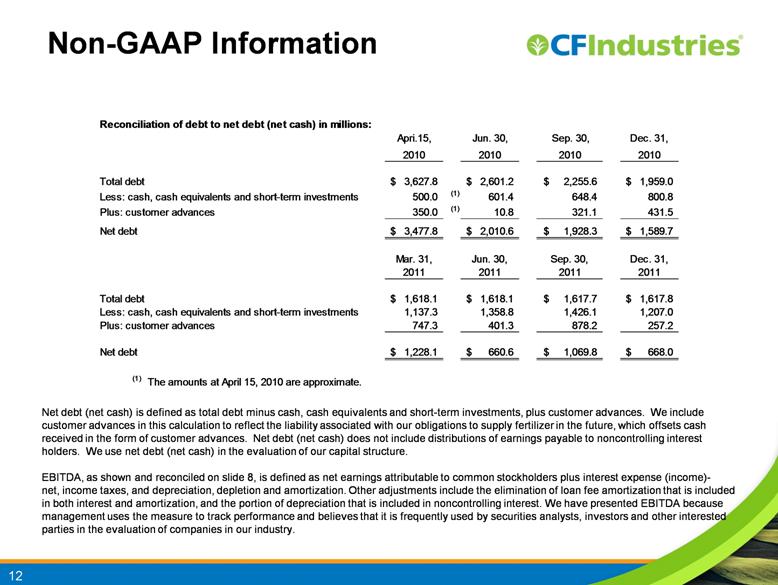
Net debt (net cash) is defined as total debt minus cash, cash equivalents and short-term investments, plus customer advances. We include customer advances in this calculation to reflect the liability associated with our obligations to supply fertilizer in the future, which offsets cash received in the form of customer advances. Net debt (net cash) does not include distributions of earnings payable to noncontrolling interest holders. We use net debt (net cash) in the evaluation of our capital structure. EBITDA, as shown and reconciled on slide 8, is defined as net earnings attributable to common stockholders plus interest expense (income)-net, income taxes, and depreciation, depletion and amortization. Other adjustments include the elimination of loan fee amortization that is included in both interest and amortization, and the portion of depreciation that is included in noncontrolling interest. We have presented EBITDA because management uses the measure to track performance and believes that it is frequently used by securities analysts, investors and other interested parties in the evaluation of companies in our industry. Non-GAAP Information 12 Reconciliation of debt to net debt (net cash) in millions: Apri.15, Jun. 30, Sep. 30, Dec. 31, 2010 2010 2010 2010 Total debt 3,627.8 $ 2,601.2 $ 2,255.6 $ 1,959.0 $ Less: cash, cash equivalents and short-term investments 500.0 (1) 601.4 648.4 800.8 Plus: customer advances 350.0 (1) 10.8 321.1 431.5 Net debt 3,477.8 $ 2,010.6 $ 1,928.3 $ 1,589.7 $ Mar. 31, Jun. 30, Sep. 30, Dec. 31, 2011 2011 2011 2011 Total debt 1,618.1 $ 1,618.1 $ 1,617.7 $ 1,617.8 $ Less: cash, cash equivalents and short-term investments 1,137.3 1,358.8 1,426.1 1,207.0 Plus: customer advances 747.3 401.3 878.2 257.2 Net debt 1,228.1 $ 660.6 $ 1,069.8 $ 668.0 $ (1) The amounts at April 15, 2010 are approximate. |