UNITED STATES
SECURITIES AND EXCHANGE COMMISSION
WASHINGTON, D.C. 20549
FORM 8-K
CURRENT REPORT
PURSUANT TO SECTION 13 OR 15(D) OF THE
SECURITIES EXCHANGE ACT OF 1934
Date of Report (Date of earliest event reported) February 16, 2012
AMERICAN EXPRESS
RECEIVABLES
FINANCING
CORPORATION V LLC
on behalf of
AMERICAN EXPRESS
ISSUANCE TRUST
(as Originator of the American Express Issuance Trust)
(Exact Name of registrant as Specified in Charter)
| Delaware | 333-158295 333-158295-01 | 20-2007139 | ||
| (State or Other Jurisdiction of Incorporation or Organization) |
(Commission File Number) | (I.R.S. Employer Identification Number) |
200 Vesey Street
Mail Stop 01-31-12
New York, New York 10285
(212) 640-2000
(Address, Including Zip Code, and Telephone Number,
Including Area Code, of Registrant’s Principal Executive Offices)
N/A
(Former Name or Former Address, if Changed Since Last Report)
Check the appropriate box below if the Form 8-K filing is intended to simultaneously satisfy the filing obligation of the registrant under any of the following provisions.
| ¨ | Written communications pursuant to Rule 425 under the Securities Act (17 CFR 230.425) |
| ¨ | Soliciting material pursuant to Rule 14a-12(b) under the Exchange Act (17 CFR 240.14a-12) |
| ¨ | Pre-commencement communications pursuant to Rule 14d-2(b) under the Exchange Act (17 CFR 240.14d-2(b)) |
| ¨ | Pre-commencement communications pursuant to Rule 13e-4(c) under the Exchange Act (17 CFR 240.13e-4(c)) |
TABLE OF CONTENTS
INFORMATION TO BE INCLUDED IN THE REPORT
| Item 8.01. | Other Events. |
The following information relates to the charge card receivables owned by American Express Issuance Trust and the related charge card accounts. Some of the terms used herein are used as defined in the Glossary of Terms at the end of this report.
The Total Portfolio
General
The Total Portfolio consists of two segments of accounts, each of which has individual yield, loss, delinquency and payment rate characteristics: (i) the Consumer and Small Business Segment, consisting of consumer and small business charge accounts, and (ii) the Commercial Segment, consisting of commercial charge accounts. We refer to each of the Consumer and Small Business Segment and the Commercial Segment individually as a “Segment” and collectively as the “Segments.” The accounts constituting each Segment are owned by one or more of TRS, Centurion and FSB and, in the future, may be owned by any of their affiliates. As of December 31, 2011, 73.38% of the receivables in the Total Portfolio arose in accounts in the Consumer and Small Business Segment and 26.62% of receivables in the Total Portfolio arose in accounts in the Commercial Segment. There is no limitation on the percentage of the Total Portfolio comprised by any Segment and, as a result, the composition of the Total Portfolio has changed, and will continue to change, over time.
The initial accounts in the Trust Portfolio were selected from the Total Portfolio based upon the eligibility criteria specified in the receivables purchase agreements and the transfer and servicing agreement applied with respect to the accounts as of their selection date. Subject only to these criteria and any applicable regulatory guidelines, the account owners have the discretion to select the accounts in any Segment of the Total Portfolio for addition to the issuance trust. The account owners have in the past considered product type and tenure, and may in the future consider similar and additional factors in determining the accounts to be added to the Trust Portfolio. Additional Accounts will consist of Eligible Accounts from the Total Portfolio which may or may not currently be in existence and which may have been originated using different credit criteria from those used in originating the accounts already included in the Trust Portfolio. Consequently, yield, loss, delinquency and payment rate experience with respect to the initial accounts and the Additional Accounts may be different from the historical experience of the Total Portfolio or any Segment thereof.
Set forth below is certain information with respect to each Segment of the Total Portfolio. The accounts in a Segment included in the Trust Portfolio may not be representative of that entire Segment. Consequently, yield, loss, delinquency and payment rate experience with respect to the accounts in the Trust Portfolio may be different from that set forth below for any Segment of the Total Portfolio.
1
Loss and Delinquency Experience
The following tables set forth the loss and delinquency experience for the Consumer and Small Business Segment and the Commercial Segment for each of the periods shown. The consumer charge accounts included in the Consumer and Small Business Segment are owned by Centurion and FSB and, in the future, may be owned by any of their affiliates. The small business charge accounts included in the Consumer and Small Business Segment are owned by FSB and, in the future, may be owned by any of its affiliates. All of the accounts in the Commercial Segment are owned by TRS and, in the future, may be owned by any of its affiliates. There is no limitation on the number of accounts owned by any account owner in any Segment and, as a result, the composition of the account ownership of the accounts in any Segment has changed, and will continue to change, over time. The receivables in an account owned by TRS, Centurion or FSB generally will be charged off no later than the date on which such account becomes six contractual payments past due (i.e., approximately 180 days delinquent).
The following tables report charge-offs in accordance with the applicable account owner’s charge-off policies as described above. The loss and delinquency rates at any time reflect, among other factors, the quality of the accounts in each Segment, the average seasoning of the accounts in each Segment, the success of the account owners’ collection efforts and general economic conditions.
During the last several years, TRS has transitioned all of its active consumer and small business charge accounts from an account servicing platform in which receivables are generally charged off after they have been approximately 330 days delinquent to an account servicing platform in which receivables are generally charged off no later than the date on which such account becomes approximately 180 days delinquent. Similarly, in January 2010, the charge-off policy for all of TRS’ active commercial charge accounts was changed from a policy under which receivables are generally charged off after they have been approximately 330 days delinquent to a policy under which receivables are generally charged off no later than the date on which such account becomes approximately 180 days delinquent. In each case, the transition resulted in the reclassification of receivables that had been outstanding for more than 180 days, as of the date of the respective transition, from delinquent status to charged-off status.
In general, the loss experience for the receivables arising in small business charge accounts included in the Consumer and Small Business Segment has been higher than the loss experience for the receivables arising in consumer charge accounts included in the Consumer and Small Business Segment. As of the year ended December 31, 2011, 55.14% of the receivables in the Consumer and Small Business Segment arose in consumer charge accounts and 44.86% of the receivables in the Consumer and Small Business Segment arose in small business charge accounts. There is, however, no limitation on the percentage of the Consumer and Small Business Segment comprised by consumer charge accounts or small business charge accounts. As a result, in addition to the factors described above, the relative percentage of receivables of each of these two types of accounts within the Consumer and Small Business Segment will cause the loss experience for the Consumer and Small Business Segment to change over time.
2
The following tables set forth the loss experience for the Consumer and Small Business Segment and the Commercial Segment for each indicated period. Total gross charge-offs include charge-offs of receivables and fees, and do not include the amount of any reductions in receivables due to a rebate, refund, error, fraudulent charge or other miscellaneous adjustment. Recoveries are collections received in respect of charged-off accounts in the applicable Segment during the period indicated in the following tables. Total net charge-offs are an amount equal to total gross charge-offs minus total recoveries, each for the applicable period. Average receivables outstanding for each indicated period is the average of the month-end receivables balances for that period. We cannot provide any assurance that the loss experience for the receivables in any Segment in the future will be similar to the historical experience set forth below.
Loss Experience of the Consumer and Small Business Segment
Total Portfolio
(Dollars in Thousands)
| Year Ended December 31, | ||||||||||||||||||||
| 2011 | 2010 | 2009 | 2008 | 2007 | ||||||||||||||||
| Average Receivables Outstanding |
$ | 17,969,187 | $ | 16,373,987 | $ | 15,146,355 | $ | 17,737,836 | $ | 18,501,059 | ||||||||||
| Total Gross Charge-Offs |
$ | 551,319 | $ | 514,089 | $ | 935,314 | $ | 1,065,618 | $ | 929,795 | ||||||||||
| Total Recoveries |
197,026 | 210,668 | 241,856 | 211,808 | 203,662 | |||||||||||||||
|
|
|
|
|
|
|
|
|
|
|
|||||||||||
| Total Net Charge-Offs |
$ | 354,293 | $ | 303,421 | $ | 693,457 | $ | 853,810 | $ | 726,133 | ||||||||||
|
|
|
|
|
|
|
|
|
|
|
|||||||||||
| Total Gross Charge-Offs as a Percentage of Average Receivables Outstanding |
3.07 | % | 3.14 | % | 6.18 | % | 6.01 | % | 5.03 | % | ||||||||||
| Total Recoveries as a Percentage of Average Receivables Outstanding |
1.10 | 1.29 | 1.60 | 1.19 | 1.10 | |||||||||||||||
|
|
|
|
|
|
|
|
|
|
|
|||||||||||
| Total Net Charge-Offs as a Percentage of Average Receivables Outstanding |
1.97 | % | 1.85 | % | 4.58 | % | 4.81 | % | 3.92 | % | ||||||||||
|
|
|
|
|
|
|
|
|
|
|
|||||||||||
3
Loss Experience of the Commercial Segment
Total Portfolio
(Dollars in Thousands)
| Year Ended December 31, | ||||||||||||||||||||
| 2011 | 2010(1) | 2009 | 2008 | 2007 | ||||||||||||||||
| Average Receivables Outstanding |
$ | 7,139,525 | $ | 6,300,405 | $ | 5,574,509 | $ | 7,064,448 | $ | 6,972,130 | ||||||||||
| Total Gross Charge-Offs |
$ | 95,790 | $ | 143,162 | $ | 165,944 | $ | 130,730 | $ | 97,528 | ||||||||||
| Total Recoveries |
44,110 | 48,347 | 32,613 | 27,213 | 21,790 | |||||||||||||||
|
|
|
|
|
|
|
|
|
|
|
|||||||||||
| Total Net Charge-Offs |
$ | 51,681 | $ | 94,815 | $ | 133,331 | $ | 103,518 | $ | 75,737 | ||||||||||
|
|
|
|
|
|
|
|
|
|
|
|||||||||||
| Total Gross Charge-Offs as a Percentage of Average Receivables Outstanding |
1.34 | % | 2.27 | % | 2.98 | % | 1.85 | % | 1.40 | % | ||||||||||
| Total Recoveries as a Percentage of Average Receivables Outstanding |
0.62 | 0.77 | 0.59 | 0.39 | 0.31 | |||||||||||||||
|
|
|
|
|
|
|
|
|
|
|
|||||||||||
| Total Net Charge-Offs as a Percentage of Average Receivables Outstanding |
0.72 | % | 1.50 | % | 2.39 | % | 1.47 | % | 1.09 | % | ||||||||||
|
|
|
|
|
|
|
|
|
|
|
|||||||||||
| (1) | As discussed above, in January 2010, the charge-off policy for all of TRS’ active commercial charge accounts was changed from a policy under which receivables are generally charged off after they have been approximately 330 days delinquent to a policy under which receivables are generally charged off after they have been approximately 180 days delinquent, resulting in the reclassification of receivables that had been outstanding for more than 180 days from delinquent status to charged-off status. |
The following tables set forth the delinquency experience for the Consumer and Small Business Segment and the Commercial Segment for each indicated period. The average receivables delinquent is the average of the month-end delinquent amounts, while the average receivables outstanding is the average of month-end receivables balances, each for the applicable period. The TRS, Centurion and FSB account servicing platform utilizes a “max aging” protocol such that to the extent any receivable in an account is delinquent, the entire account balance will be characterized as delinquent and all receivables in the account will be classified in the period shown in the table below that includes the most aged receivable in the account. We cannot provide any assurance that the delinquency experience for the receivables in any Segment in the future will be similar to the historical experience set forth below.
4
Average Receivables Delinquent as a Percentage of the Consumer and Small Business Segment
Total Portfolio
(Dollars in Thousands)
| Year Ended December 31, | ||||||||||||||||||||||||
| 2011 | 2010 | 2009 | ||||||||||||||||||||||
| Percentage of |
Percentage of | Percentage of | ||||||||||||||||||||||
| Average | Average | Average | ||||||||||||||||||||||
| Dollar | Receivables | Dollar | Receivables | Dollar | Receivables | |||||||||||||||||||
| Amount | Outstanding | Amount | Outstanding | Amount | Outstanding | |||||||||||||||||||
| Average Receivables Outstanding |
$ | 17,969,187 | 100.00 | % | $ | 16,373,987 | 100.00 | % | $ | 15,146,355 | 100.00 | % | ||||||||||||
| Average Receivables Delinquent: |
||||||||||||||||||||||||
| 31 to 60 Days |
$ | 129,164 | 0.72 | % | $ | 104,670 | 0.64 | % | $ | 131,309 | 0.87 | % | ||||||||||||
| 61 to 90 Days |
70,353 | 0.39 | 56,174 | 0.34 | 86,912 | 0.57 | ||||||||||||||||||
| 91 or More Days |
152,847 | 0.85 | 130,690 | 0.80 | 229,227 | 1.51 | ||||||||||||||||||
|
|
|
|
|
|
|
|
|
|
|
|
|
|||||||||||||
| Total |
$ | 352,364 | 1.96 | % | $ | 291,534 | 1.78 | % | 447,448 | 2.95 | % | |||||||||||||
|
|
|
|
|
|
|
|
|
|
|
|
|
|||||||||||||
| Year Ended December 31, | ||||||||||||||||||||||||
| 2008 | 2007 | |||||||||||||||||||||||
| Percentage of | Percentage of | |||||||||||||||||||||||
| Dollar | Average Receivables |
Dollar | Average Receivables |
|||||||||||||||||||||
| Amount | Outstanding | Amount | Outstanding | |||||||||||||||||||||
| Average Receivables Outstanding |
|
$ | 17,737,836 | 100.00 | % | $ | 18,501,059 | 100.00 | % | |||||||||||||||
| Average Receivables Delinquent: |
|
|||||||||||||||||||||||
| 31 to 60 Days |
|
$ | 244,689 | 1.38 | % | $ | 308,409 | 1.67 | % | |||||||||||||||
| 61 to 90 Days |
|
127,410 | 0.72 | 131,537 | 0.71 | |||||||||||||||||||
| 91 or More Days |
|
279,163 | 1.57 | 297,202 | 1.61 | |||||||||||||||||||
|
|
|
|
|
|
|
|
|
|||||||||||||||||
| Total |
|
$ | 651,262 | 3.67 | % | $ | 737,147 | 3.98 | % | |||||||||||||||
|
|
|
|
|
|
|
|
|
|||||||||||||||||
5
Average Receivables Delinquent as a Percentage of the Commercial Segment
Total Portfolio
(Dollars in Thousands)
| Year Ended December 31, | ||||||||||||||||||||||||
| 2011 | 2010(1) | 2009 | ||||||||||||||||||||||
| Percentage | Percentage | Percentage | ||||||||||||||||||||||
| of Average | of Average | of Average | ||||||||||||||||||||||
| Dollar | Receivables | Dollar | Receivables | Dollar | Receivables | |||||||||||||||||||
| Amount | Outstanding | Amount | Outstanding | Amount | Outstanding | |||||||||||||||||||
| Average Receivables Outstanding |
$ | 7,139,525 | 100.00 | % | $ | 6,300,405 | 100.00 | % | $ | 5,574,509 | 100.00 | % | ||||||||||||
| Average Receivables Delinquent: |
||||||||||||||||||||||||
| 31 to 60 Days |
$ | 87,365 | 1.22 | % | $ | 79,825 | 1.27 | % | $ | 75,768 | 1.36 | % | ||||||||||||
| 61 to 90 Days |
17,722 | 0.25 | 19,265 | 0.31 | 20,690 | 0.37 | ||||||||||||||||||
| 91 or More Days |
14,864 | 0.21 | 19,507 | 0.31 | 73,609 | 1.32 | ||||||||||||||||||
|
|
|
|
|
|
|
|
|
|
|
|
|
|||||||||||||
| Total |
$ | 119,951 | 1.68 | % | $ | 118,597 | 1.88 | % | $ | 170,067 | 3.05 | % | ||||||||||||
|
|
|
|
|
|
|
|
|
|
|
|
|
|||||||||||||
| Year Ended December 31, | ||||||||||||||||||||||||
| 2008 | 2007 | |||||||||||||||||||||||
| Percentage | Percentage | |||||||||||||||||||||||
| of Average | of Average | |||||||||||||||||||||||
| Dollar | Receivables | Dollar | Receivables | |||||||||||||||||||||
| Amount | Outstanding | Amount | Outstanding | |||||||||||||||||||||
| Average Receivables Outstanding |
$ | 7,064,448 | 100.00 | % | $ | 6,972,130 | 100.00 | % | ||||||||||||||||
| Average Receivables Delinquent: |
||||||||||||||||||||||||
| 31 to 60 Days |
$ | 138,193 | 1.96 | % | $ | 162,032 | 2.32 | % | ||||||||||||||||
| 61 to 90 Days |
33,366 | 0.47 | 34,268 | 0.49 | ||||||||||||||||||||
| 91 or More Days |
81,299 | 1.15 | 68,273 | 0.98 | ||||||||||||||||||||
|
|
|
|
|
|
|
|
|
|||||||||||||||||
| Total |
$ | 252,858 | 3.58 | % | $ | 264,573 | 3.79 | % | ||||||||||||||||
|
|
|
|
|
|
|
|
|
|||||||||||||||||
| (1) | As discussed above, in January 2010, the charge-off policy for all of TRS’ active commercial charge accounts was changed from a policy under which receivables are generally charged off after they have been approximately 330 days delinquent to a policy under which receivables are generally charged off after they have been approximately 180 days delinquent, resulting in the reclassification of receivables that had been outstanding for more than 180 days from delinquent status to charged-off status. |
The actual loss and delinquency experience of any Segment will vary month to month due to variations in accountholder charge and payment behavior, as well as the product mix within each segment.
Revenue Experience
Receivables generated under the accounts in the Total Portfolio, consisting of amounts charged by accountholders for merchandise and services, annual membership fees and certain other administrative fees billed to accountholders on the accounts, generally are not subject to monthly finance charge assessments. As a result, in order to provide yield to the issuance trust with respect to those receivables, pursuant to the
6
transfer and servicing agreement, on any Date of Processing, the receivables existing and arising in all or a specified portion of the accounts in the Trust Portfolio equal to the product of the Discount Option Percentage and the receivables for that Date of Processing are deemed to be Discount Option Receivables and treated as finance charge receivables and collections received with respect to such receivables are treated as Finance Charge Collections. The remainder of such receivables are treated as principal receivables and collections received with respect to such receivables are treated as Principal Collections.
The exercise of the discount option by the transferor results in a larger amount of finance charge receivables and a smaller amount of principal receivables, thereby reducing the likelihood that an early amortization event will occur with respect to the issuance trust’s series of notes due to insufficient Finance Charge Collections, but increasing the likelihood that the transferor will be required to transfer additional assets to the issuance trust. There is no guarantee that any account owner, the transferor or their affiliates would be able, or have enough receivables, to transfer to the issuance trust or the related master trusts or other securitization special purpose entities, or would be able to transfer additional collateral certificates to the issuance trust. This could result in an early amortization event with respect to the issuance trust’s series of notes and an acceleration of or reduction in payments on such notes.
The dollar amounts representing Finance Charge Collections in the tables below for the Consumer and Small Business Segment and the Commercial Segment have been derived by applying a Discount Option Percentage of 3% (which is, as of the date of this report the Discount Option Percentage under the transfer and servicing agreement) to historical monthly collections of receivables (excluding recoveries on charged-off receivables) in the accounts for each period shown. The average receivables outstanding for each indicated period is the average of the month-end receivables balances for that period. There can be no assurance that the revenues for any Segment in the future will be similar to the historical experience of each Segment set forth below.
Revenue Experience of the Consumer and Small Business Segment
Total Portfolio
(Dollars in Thousands)
| Year Ended December 31, | ||||||||||||||||||||
| 2011 | 2010 | 2009 | 2008 | 2007 | ||||||||||||||||
| Average Receivables Outstanding |
$ | 17,969,187 | $ | 16,373,987 | $ | 15,146,355 | $ | 17,737,836 | $ | 18,501,059 | ||||||||||
| Finance Charge Collections |
$ | 6,242,922 | $ | 5,712,948 | $ | 5,275,854 | $ | 5,932,127 | $ | 5,839,292 | ||||||||||
| Finance Charge Collections as a Percentage of Average Receivables Outstanding |
34.74 | % | 34.89 | % | 34.83 | % | 33.44 | % | 31.56 | % | ||||||||||
7
Revenue Experience of the Commercial Segment
Total Portfolio
(Dollars in Thousands)
| Year Ended December 31, |
||||||||||||||||||||
| 2011 | 2010 | 2009 | 2008 | 2007 | ||||||||||||||||
| Average Receivables Outstanding |
$ | 7,139,525 | $ | 6,300,405 | $ | 5,574,509 | $ | 7,064,448 | $ | 6,972,130 | ||||||||||
| Finance Charge Collections |
$ | 2,730,101 | $ | 2,351,462 | $ | 2,017,252 | $ | 2,411,323 | $ | 2,276,725 | ||||||||||
| Finance Charge Collections as a Percentage of Average Receivables Outstanding |
38.24 | % | 37.32 | % | 36.19 | % | 34.13 | % | 32.65 | % | ||||||||||
The actual revenue experience of any Segment will vary month to month due to variations in accountholder charge and payment behavior. Pursuant to the transfer and servicing agreement, the transferor has the ability to change the Discount Option Percentage, subject to the satisfaction of certain conditions, including satisfaction of the Rating Agency Condition. The transferor may not change the Discount Option Percentage if an early amortization event has occurred and is continuing or if, as a result of that change, the transferor reasonably expects that an early amortization event would occur.
Payment Rates
The accounts are designed for use as a method of payment for the purchase of merchandise and services and account balances generally are due in full each month. Therefore, accounts generally cannot be used by accountholders for the purpose of financing these purchases. In contrast to revolving credit plan products which do not require payment in full each month, the general requirement that account balances be paid in full each month creates a high monthly payment rate and, therefore, account balances turn over rapidly relative to charge volume. The following tables set forth the highest and lowest accountholder monthly payment rates for the Consumer and Small Business Segment and the Commercial Segment during any month in the period shown and the average accountholder monthly payment rates for all months during each period shown, calculated as the percentage equivalent of a fraction. The monthly payment rates are calculated as the amount of payments from accountholders (excluding recoveries on charged-off receivables) received during the applicable month divided by the aggregate amount of receivables outstanding as of the beginning of the applicable month. The actual monthly payment rate experience of any Segment will vary month to month due to variations in accountholder charge and payment behavior.
Accountholder Monthly Payment Rates of the Consumer and Small Business Segment
Total Portfolio
| Year Ended December 31, | ||||||||||||||||||||
| 2011 | 2010 | 2009 | 2008 | 2007 | ||||||||||||||||
| Lowest Month |
91.53 | % | 92.80 | % | 91.46 | % | 86.65 | % | 83.85 | % | ||||||||||
| Highest Month |
101.07 | % | 101.08 | % | 100.81 | % | 94.57 | % | 90.91 | % | ||||||||||
| Monthly Average |
97.28 | % | 97.68 | % | 96.75 | % | 91.48 | % | 87.85 | % | ||||||||||
8
Accountholder Monthly Payment Rates of the
Commercial Segment
Total Portfolio
| Year Ended December 31, | ||||||||||||||||||||
| 2011 | 2010 | 2009 | 2008 | 2007 | ||||||||||||||||
| Lowest Month |
95.82 | % | 95.26 | % | 91.51 | % | 88.59 | % | 86.70 | % | ||||||||||
| Highest Month |
113.95 | % | 110.29 | % | 106.27 | % | 97.58 | % | 96.81 | % | ||||||||||
| Monthly Average |
107.41 | % | 104.50 | % | 100.09 | % | 93.52 | % | 91.45 | % | ||||||||||
The Trust Portfolio
General
The primary assets of the issuance trust consist of receivables generated from time to time in a portfolio, referred to as the Trust Portfolio, of designated accounts in the Consumer and Small Business Segment and designated accounts in the Commercial Segment. Receivables arising in designated accounts in the Commercial Segment were first included in the Trust Portfolio in January 2009. As of December 31, 2011, 94.29% of the receivables in the Trust Portfolio arose in accounts in the Consumer and Small Business Segment and 5.71% of receivables in the Trust Portfolio arose in accounts in the Commercial Segment. There is, however, no limitation on the percentage of the Trust Portfolio comprised by any Segment and, as a result, the composition of the Trust Portfolio can and will change over time. The receivables consist of finance charge receivables, which are Discount Option Receivables, and principal receivables, which are all other receivables.
Loss and Delinquency Experience
The following tables set forth the loss and delinquency experience for the Trust Portfolio for each of the periods shown. The loss and delinquency rates at any time reflect, among other factors, the quality of the Trust Portfolio, the average seasoning of the accounts, the success of the account owners’ collection efforts and general economic conditions.
As of December 31, 2011, 77.28% of the receivables in the Trust Portfolio arose in consumer charge accounts, 17.01% of the receivables in the Trust Portfolio arose in small business charge accounts and 5.71% of the receivables in the Trust Portfolio arose in commercial accounts. There is, however, no limitation on the percentage of the Trust Portfolio comprised by consumer charge accounts, small business charge accounts or commercial charge accounts. As a result, in addition to the factors described above, the relative percentage of receivables of each of these two types of accounts within the Trust Portfolio will cause the loss and delinquency experience for the Trust Portfolio to change over time.
The following table sets forth the loss experience for the Trust Portfolio for each indicated period. Total gross charge-offs include charge-offs of principal receivables only, and do not include any charge-offs of finance charge receivables or the amount of any reductions in receivables due to a rebate, refund, error, fraudulent charge or other miscellaneous adjustment. If finance charge receivables that have been charged-off were included in total gross charge-offs, total gross charge-offs would be higher as an absolute number and as a percentage of the average
9
principal receivables outstanding during the periods indicated. Recoveries are collections received in respect of charged-off accounts in the Trust Portfolio during the period indicated in the following table. Total net charge-offs are an amount equal to total gross charge-offs minus total recoveries, each for the applicable period. Average principal receivables outstanding for each indicated period is the average of the month-end principal receivables balances for that period. We cannot provide any assurance that the loss experience for the receivables in the Trust Portfolio in the future will be similar to the historical experience set forth below.
Historical data for total gross charge-offs as reported with respect to the Trust Portfolio in the table below (i) unlike the calculation of total gross charge-offs in the “Loss Experience of the Consumer and Small Business Segment” and the “Loss Experience of the Commercial Segment” tables under “The Total Portfolio — Loss and Delinquency Experience,” does not include charge-offs of finance charge receivables and (ii) is calculated using the average principal receivables outstanding instead of the average receivables outstanding. Similarly, historical data for net charge-offs as reported with respect to the Trust Portfolio in the table below is calculated using the average principal receivables instead of the average receivables outstanding. As a result, there are limitations to any comparison of the historical data presented with respect to the Trust Portfolio in the table below and the historical data presented with respect to each Segment of the Total Portfolio in such other tables.
Loss Experience of the Trust Portfolio
(Dollars in Thousands)
| Year Ended December 31, | ||||||||||||||||||||
| 2011 | 2010(1) | 2009 | 2008(2) | 2007(2) | ||||||||||||||||
| Average Principal Receivables Outstanding |
$ | 7,169,953 | $ | 7,252,334 | $ | 7,149,394 | $ | 7,196,229 | $ | 7,922,079 | ||||||||||
| Total Gross Charge-Offs |
$ | 152,872 | $ | 165,780 | $ | 277,288 | $ | 277,121 | $ | 277,945 | ||||||||||
| Total Recoveries |
62,663 | 71,717 | 77,984 | 72,248 | 75,118 | |||||||||||||||
|
|
|
|
|
|
|
|
|
|
|
|||||||||||
| Total Net Charge-Offs |
$ | 90,209 | $ | 94,063 | $ | 199,305 | $ | 204,873 | $ | 202,827 | ||||||||||
| Total Gross Charge-Offs as a Percentage of Average Principal Receivables Outstanding |
2.13 | % | 2.29 | % | 3.88 | % | 3.85 | % | 3.51 | % | ||||||||||
| Total Recoveries as a Percentage of Average Principal Receivables Outstanding |
0.87 | 0.99 | 1.09 | 1.00 | 0.95 | |||||||||||||||
|
|
|
|
|
|
|
|
|
|
|
|||||||||||
| Total Net Charge-Offs as a Percentage of Average Principal Receivables Outstanding |
1.26 | % | 1.30 | % | 2.79 | % | 2.85 | % | 2.56 | % | ||||||||||
|
|
|
|
|
|
|
|
|
|
|
|||||||||||
| Number of Accounts Experiencing a Loss |
139,173 | 188,081 | 251,779 | 201,759 | 204,692 | |||||||||||||||
| Number of Accounts Experiencing a Recovery(3) |
161,675 | 179,422 | 162,693 | 186,306 | 240,816 | |||||||||||||||
| Average Net Loss per Account Experiencing a Loss(4) |
$ | 0.65 | $ | 0.50 | $ | 0.79 | $ | 1.02 | $ | 0.99 | ||||||||||
| (1) | As discussed above in “The Total Portfolio — Loss and Delinquency Experience,” in January 2010, the charge-off policy for all of TRS’ active commercial charge accounts was changed from a policy under which receivables are generally charged off after they have been approximately 330 days delinquent to a policy under which receivables are generally charged off after they have been approximately 180 days delinquent, resulting in the reclassification of receivables that had been outstanding for more than 180 days from delinquent status to charged-off status. |
| (2) | Prior to January 2009, the Trust Portfolio did not include any receivables arising in commercial charge accounts. |
| (3) | Calculated by totaling the number of accounts experiencing a recovery in each of the months during the indicated period. Therefore, an account that has experienced a recovery in multiple months during the indicated period will be counted more than once. |
| (4) | Calculated as Net Charge-Offs divided by Number of Accounts Experiencing a Loss. |
10
The following tables set forth the delinquency experience for the Trust Portfolio for each indicated period. With respect to the “Average Receivables Delinquent as a Percentage of the Trust Portfolio” table below, the average receivables delinquent is the average of the month-end delinquent amounts, while the average receivables outstanding is the average of month-end receivables balances, each for the applicable period. With respect to the “Average Number of Delinquent Accounts as a Percentage of the Trust Portfolio” table below, the average number of delinquent accounts is the average of the month-end delinquent accounts, while the average number of outstanding accounts is the average of month-end accounts, each for the applicable period. We cannot provide any assurance that the delinquency experience for the receivables in the Trust Portfolio in the future will be similar to the historical experience set forth below.
Average Receivables Delinquent as a Percentage of the Trust Portfolio
(Dollars in Thousands)
| Year Ended December 31, | ||||||||||||||||||||||||
| 2011 | 2010(1) | 2009 | ||||||||||||||||||||||
| Dollar Amount |
Percentage of Average Receivables Outstanding |
Dollar Amount |
Percentage
of Average Receivables Outstanding |
Dollar Amount |
Percentage of Average Receivables Outstanding |
|||||||||||||||||||
| Average Receivables Outstanding |
$ | 7,391,704 | 100.00 | % | $ | 7,476,633 | 100.00 | % | $ | 7,370,509 | 100.00 | % | ||||||||||||
| Average Receivables Delinquent: |
||||||||||||||||||||||||
| 31 to 60 Days |
$ | 50,955 | 0.69 | % | $ | 50,030 | 0.67 | % | $ | 61,366 | 0.83 | % | ||||||||||||
| 61 to 90 Days |
19,500 | 0.26 | 19,270 | 0.26 | 29,625 | 0.40 | ||||||||||||||||||
| 91 to 120 Days |
15,323 | 0.21 | 15,559 | 0.21 | 25,701 | 0.35 | ||||||||||||||||||
| 121 to 150 Days |
13,117 | 0.18 | 13,749 | 0.18 | 23,412 | 0.32 | ||||||||||||||||||
| 151 to 180 Days |
11,138 | 0.15 | 12,005 | 0.16 | 21,668 | 0.29 | ||||||||||||||||||
| 181 to 210 Days |
20 | * | 33 | * | 857 | 0.01 | ||||||||||||||||||
| 211 to 240 Days |
4 | * | 27 | * | 770 | 0.01 | ||||||||||||||||||
| 241 to 270 Days |
1 | * | 8 | * | 625 | 0.01 | ||||||||||||||||||
| 271 to 300 Days |
2 | * | 7 | * | 410 | 0.01 | ||||||||||||||||||
| 301 or More Days |
29 | * | 145 | * | 122 | * | ||||||||||||||||||
|
|
|
|
|
|
|
|
|
|
|
|
|
|||||||||||||
| Total |
$ | 110,089 | 1.49 | % | $ | 110,833 | 1.48 | % | $ | 164,556 | 2.23 | % | ||||||||||||
|
|
|
|
|
|
|
|
|
|
|
|
|
|||||||||||||
| Year Ended December 31, | ||||||||||||||||||||||||
| 2008(2) | 2007(2) | |||||||||||||||||||||||
| Dollar Amount |
Percentage of Average Receivables Outstanding |
Dollar Amount |
Percentage of Average Receivables Outstanding |
|||||||||||||||||||||
| Average Receivables Outstanding |
|
$ | 7,418,793 | 100.00 | % | $ | 8,167,092 | 100.00 | % | |||||||||||||||
| Average Receivables Delinquent: |
|
|||||||||||||||||||||||
| 31 to 60 Days |
|
$ | 97,584 | 1.32 | % | $ | 137,241 | 1.68 | % | |||||||||||||||
| 61 to 90 Days |
|
37,335 | 0.50 | 42,371 | 0.52 | |||||||||||||||||||
| 91 to 120 Days |
|
28,245 | 0.38 | 28,767 | 0.35 | |||||||||||||||||||
| 121 to 150 Days |
|
24,150 | 0.33 | 23,459 | 0.29 | |||||||||||||||||||
| 151 to 180 Days |
|
21,528 | 0.29 | 20,850 | 0.26 | |||||||||||||||||||
| 181 to 210 Days |
|
81 | 0.00 | 4,719 | 0.06 | |||||||||||||||||||
| 211 to 240 Days |
|
27 | 0.00 | 4,918 | 0.06 | |||||||||||||||||||
| 241 to 270 Days |
|
4 | 0.00 | 5,199 | 0.06 | |||||||||||||||||||
| 271 to 300 Days |
|
4 | 0.00 | 5,040 | 0.06 | |||||||||||||||||||
| 301 or More Days |
|
8 | 0.00 | 4,458 | 0.05 | |||||||||||||||||||
|
|
|
|
|
|
|
|
|
|||||||||||||||||
| Total |
$ | 208,967 | 2.82 | % | $ | 277,020 | 3.39 | % | ||||||||||||||||
|
|
|
|
|
|
|
|
|
|||||||||||||||||
| (1) | As discussed above in “The Total Portfolio — Loss and Delinquency Experience,” in January 2010, the charge-off policy for all of TRS’ active commercial charge accounts was changed from a policy under which receivables are generally charged off after they have been approximately 330 days delinquent to a policy under which receivables are generally charged off after they have been approximately 180 days delinquent, resulting in the reclassification of receivables that had been outstanding for more than 180 days from delinquent status to charged-off status. |
| (2) | Prior to January 2009, the Trust Portfolio did not include any receivables arising in commercial charge accounts. |
| * | Indicates a number that is greater than zero but less than 0.005%. |
11
Average Number of Accounts Delinquent as a Percentage of the Trust Portfolio
| Year Ended December 31, | ||||||||||||||||||||||||
| 2011 | 2010(1) | 2009 | ||||||||||||||||||||||
| Percentage of | Percentage of | Percentage of | ||||||||||||||||||||||
| Number of | Total Number | Number of | Total Number | Number of | Total Number | |||||||||||||||||||
| Accounts | of Accounts | Accounts | of Accounts | Accounts | of Accounts | |||||||||||||||||||
| Average Number of Accounts Outstanding |
6,092,425 | 100.00 | % | 6,595,810 | 100.00 | % | 6,721,288 | 100.00 | % | |||||||||||||||
| Average Number of Accounts Delinquent: |
||||||||||||||||||||||||
| 31 to 60 Days |
19,183 | 0.31 | % | 22,976 | 0.35 | % | 29,588 | 0.44 | % | |||||||||||||||
| 61 to 90 Days |
6,760 | 0.11 | 8,820 | 0.13 | 13,984 | 0.21 | ||||||||||||||||||
| 91 to 120 Days |
4,700 | 0.08 | 6,549 | 0.10 | 10,949 | 0.16 | ||||||||||||||||||
| 121 to 150 Days |
3,953 | 0.06 | 5,654 | 0.09 | 9,018 | 0.13 | ||||||||||||||||||
| 151 to 180 Days |
3,379 | 0.06 | 4,987 | 0.08 | 7,592 | 0.11 | ||||||||||||||||||
| 181 to 210 Days |
51 | * | 75 | * | 150 | * | ||||||||||||||||||
| 211 to 240 Days |
46 | * | 66 | * | 120 | * | ||||||||||||||||||
| 241 to 270 Days |
42 | * | 55 | * | 91 | * | ||||||||||||||||||
| 271 to 300 Days |
42 | * | 50 | * | 66 | * | ||||||||||||||||||
| 301 or More Days |
1,312 | 0.02 | 1,143 | 0.02 | 1,020 | 0.02 | ||||||||||||||||||
|
|
|
|
|
|
|
|
|
|
|
|
|
|||||||||||||
| Total |
39,469 | 0.65 | % | 50,376 | 0.76 | % | 72,577 | 1.08 | % | |||||||||||||||
|
|
|
|
|
|
|
|
|
|
|
|
|
|||||||||||||
| Year Ended December 31, | ||||||||||||||||||||||||
| 2008(2) | 2007(2) | |||||||||||||||||||||||
| Percentage of | Percentage of | |||||||||||||||||||||||
| Number of | Total Number | Number of | Total Number | |||||||||||||||||||||
| Accounts | of Accounts | Accounts | of Accounts | |||||||||||||||||||||
| Average Number of Accounts Outstanding |
6,432,416 | 100.00 | % | 6,941,678 | 100.00 | % | ||||||||||||||||||
| Average Number of Accounts Delinquent: |
||||||||||||||||||||||||
| 31 to 60 Days |
36,695 | 0.57 | % | 45,299 | 0.65 | % | ||||||||||||||||||
| 61 to 90 Days |
14,062 | 0.22 | 15,648 | 0.23 | ||||||||||||||||||||
| 91 to 120 Days |
9,616 | 0.15 | 9,564 | 0.14 | ||||||||||||||||||||
| 121 to 150 Days |
7,181 | 0.11 | 6,545 | 0.09 | ||||||||||||||||||||
| 151 to 180 Days |
5,789 | 0.09 | 5,280 | 0.08 | ||||||||||||||||||||
| 181 to 210 Days |
10 | * | 1,155 | 0.02 | ||||||||||||||||||||
| 211 to 240 Days |
6 | * | 1,170 | 0.02 | ||||||||||||||||||||
| 241 to 270 Days |
4 | * | 1,163 | 0.02 | ||||||||||||||||||||
| 271 to 300 Days |
5 | * | 1,128 | 0.02 | ||||||||||||||||||||
| 301 or More Days |
896 | 0.01 | 3,438 | 0.05 | ||||||||||||||||||||
|
|
|
|
|
|
|
|
|
|||||||||||||||||
| Total |
74,263 | 1.15 | % | 90,390 | 1.30 | % | ||||||||||||||||||
|
|
|
|
|
|
|
|
|
|||||||||||||||||
| (1) | As discussed above in “The Total Portfolio — Loss and Delinquency Experience,” in January 2010, the charge-off policy for all of TRS’ active commercial charge accounts was changed from a policy under which receivables are generally charged off after they have been approximately 330 days delinquent to a policy under which receivables are generally charged off after they have been approximately 180 days delinquent, resulting in the reclassification of receivables that had been outstanding for more than 180 days from delinquent status to charged-off status. |
| (2) | Prior to January 2009, the Trust Portfolio did not include any receivables arising in commercial charge accounts. |
| * | Indicates a number that is greater than zero but less than 0.005%. |
Revenue Experience
The following table sets forth the revenue experience for the Trust Portfolio for each indicated period. Finance Charge Collections consist entirely of Discount Option Receivables. Revenue experience from finance charge collections results from dividing finance charge collections by the average principal receivables outstanding. The average principal receivables outstanding for each indicated period is the average of the month-end principal receivables balances for that period.
Historical data for the revenue experience as reported with respect to the Trust Portfolio in the table below is calculated using the average principal receivables outstanding instead of the average receivables outstanding. As a result, there are limitations to any comparison of the historical data presented with respect to the Trust Portfolio in the table below and the historical data presented with respect to each Segment of the Total Portfolio in the “Revenue Experience of the Consumer and Small Business Segment” and “Revenue Experience of the Commercial Segment” tables under “The Total Portfolio — Revenue Experience.”
Revenue Experience of the Trust Portfolio
(Dollars in Thousands)
| Year Ended December 31, | ||||||||||||||||||||
| 2011 | 2010 | 2009 | 2008(1) | 2007(1) | ||||||||||||||||
| Average Principal Receivables Outstanding |
$ | 7,169,953 | $ | 7,252,334 | $ | 7,149,394 | $ | 7,196,229 | $ | 7,922,079 | ||||||||||
| Finance Charge Collections |
$ | 2,462,092 | $ | 2,501,146 | $ | 2,476,753 | $ | 2,434,414 | $ | 2,556,406 | ||||||||||
| Finance Charge Collections as a Percentage of Average Principal Receivables Outstanding |
34.34 | % | 34.49 | % | 34.64 | % | 33.83 | % | 32.27 | % | ||||||||||
| (1) | Prior to January 2009, the Trust Portfolio did not include any receivables arising in commercial charge accounts. |
12
Principal Payment Rates
The following table sets forth the highest and lowest accountholder monthly principal payment rates for the Trust Portfolio during any month in the period shown and the average accountholder monthly principal payment rates for all months during each period shown, calculated as the percentage equivalent of a fraction. The accounts are designed for use as a method of payment for the purchase of merchandise and services and account balances generally are due in full each month. Therefore, accounts generally cannot be used by accountholders for the purpose of financing these purchases. In contrast to revolving credit plan products which do not require payment in full each month, the general requirement that account balances be paid in full each month creates a high monthly payment rate and, therefore, account balances turn over rapidly relative to charge volume.
Historical data for the monthly principal payment rate as reported with respect to the Trust Portfolio in the table below (i) unlike the calculation of monthly payment rate in the “Accountholder Monthly Payment Rates the Consumer and Small Business Segment” and the “Accountholder Monthly Payment Rates of the Commercial Segment” tables under “The Total Portfolio — Payment Rates,” includes collections of principal receivables only and (ii) is calculated using that month’s opening principal receivables balance. As a result, there are limitations to any comparison of the historical data presented with respect to the Trust Portfolio in the table below and the historical data presented with respect to each Segment of the Total Portfolio in such other tables.
Accountholder Monthly Principal Payment Rates of the Trust Portfolio
| Year Ended December 31, | ||||||||||||||||||||
| 2011 | 2010 | 2009 | 2008(1) | 2007(1) | ||||||||||||||||
| Lowest Month |
86.95 | % | 88.73 | % | 89.35 | % | 85.47 | % | 82.82 | % | ||||||||||
| Highest Month |
96.14 | % | 95.61 | % | 95.88 | % | 91.69 | % | 89.35 | % | ||||||||||
| Monthly Average |
92.41 | % | 92.85 | % | 93.17 | % | 89.25 | % | 86.54 | % | ||||||||||
| (1) | Prior to January 2009, the Trust Portfolio did not include any receivables arising in commercial charge accounts. |
13
The Receivables
As of December 31, 2011, the receivables in the accounts included in the Trust Portfolio totaled $8,026,831,511 comprised of $7,786,026,566 of principal receivables and $240,804,945 of finance charge receivables.
The following tables, together with the paragraph under “— Composition by Geographic Distribution,” summarize the Trust Portfolio by various criteria as of December 31, 2011. As described under “The Trust Portfolio — General,” receivables arising in commercial charge accounts were first included in the Trust Portfolio in January 2009. Because the future composition of the Trust Portfolio may change over time, these tables are not necessarily indicative of the composition of the Trust Portfolio at any specific time in the future.
Composition by Account Balance
Trust Portfolio
| Account Balance Range |
Number of Accounts |
Percentage of Total Number of Accounts |
Receivables Outstanding |
Percentage of Total Receivables Outstanding |
||||||||||||
| Credit Balance |
83,513 | 1.50 | % | $ | (42,377,614 | ) | (0.53 | )% | ||||||||
| Zero Balance |
2,471,972 | 44.43 | 0 | 0.00 | ||||||||||||
| $0.01 to $1,000 |
1,706,267 | 30.67 | 576,025,642 | 7.18 | ||||||||||||
| $1,000.01 to $5,000 |
960,052 | 17.26 | 2,187,400,109 | 27.25 | ||||||||||||
| $5,000.01 to $10,000 |
193,021 | 3.47 | 1,341,426,732 | 16.71 | ||||||||||||
| $10,000.01 to $15,000 |
63,036 | 1.13 | 764,886,828 | 9.53 | ||||||||||||
| $15,000.01 to $20,000 |
28,975 | 0.52 | 498,790,724 | 6.21 | ||||||||||||
| $20,000.01 to $30,000 |
25,501 | 0.46 | 616,984,322 | 7.69 | ||||||||||||
| $30,000.01 to $40,000 |
11,184 | 0.20 | 385,398,082 | 4.80 | ||||||||||||
| $40,000.01 to $50,000 |
6,016 | 0.11 | 268,478,395 | 3.34 | ||||||||||||
| $50,000.01 or More |
13,715 | 0.25 | 1,429,818,289 | 17.81 | ||||||||||||
|
|
|
|
|
|
|
|
|
|||||||||
| Total |
5,563,252 | 100.00 | % | $ | 8,026,831,511 | 100.00 | % | |||||||||
|
|
|
|
|
|
|
|
|
|||||||||
The average account balance as of December 31, 2011 was $1,443 for all accounts and $2,597 for all accounts other than accounts with a zero balance as of that date.
Composition by Period of Delinquency
Trust Portfolio
| Period of Delinquency (Days Contractually Delinquent) |
Number of Accounts |
Percentage of Total Number of Accounts |
Receivables Outstanding |
Percentage of Total Receivables Outstanding |
||||||||||||
| Current to 30 Days |
5,528,764 | 99.38 | % | $ | 7,918,642,807 | 98.65 | % | |||||||||
| 31 to 60 Days |
14,069 | 0.25 | 42,095,426 | 0.52 | ||||||||||||
| 61 to 90 Days |
6,230 | 0.11 | 21,394,111 | 0.27 | ||||||||||||
| 91 to 120 Days |
5,138 | 0.09 | 18,323,810 | 0.23 | ||||||||||||
| 121 to 150 Days |
4,109 | 0.07 | 14,753,780 | 0.18 | ||||||||||||
| 151 to 180 Days |
3,384 | 0.06 | 11,603,577 | 0.14 | ||||||||||||
| 181 to 210 Days |
40 | * | 2,311 | * | ||||||||||||
| 211 to 240 Days |
41 | * | 2,869 | * | ||||||||||||
| 241 to 270 Days |
39 | * | 1,622 | * | ||||||||||||
| 271 to 300 Days |
35 | * | 267 | * | ||||||||||||
| 301 or More Days |
1,403 | 0.03 | 10,931 | * | ||||||||||||
|
|
|
|
|
|
|
|
|
|||||||||
| Total |
5,563,252 | 100.00 | % | $ | 8,026,831,511 | 100.00 | % | |||||||||
|
|
|
|
|
|
|
|
|
|||||||||
| * | Indicates a number that is greater than zero but less than 0.005%. |
14
Composition by Account Age
Trust Portfolio
| Account Age(1) |
Number of Accounts |
Percentage of Total Number of Accounts |
Receivables Outstanding |
Percentage of Total Receivables Outstanding |
||||||||||||
| Not More than 11 Months |
0 | 0.00 | % | $ | 0 | 0.00 | % | |||||||||
| 12 Months to 17 Months |
0 | 0.00 | 0 | 0.00 | ||||||||||||
| 18 Months to 23 Months |
0 | 0.00 | 0 | 0.00 | ||||||||||||
| 24 Months to 35 Months |
0 | 0.00 | 0 | 0.00 | ||||||||||||
| 36 Months to 47 Months |
51,030 | 0.92 | 57,717,250 | 0.72 | ||||||||||||
| 48 Months to 59 Months |
49,671 | 0.89 | 112,345,017 | 1.40 | ||||||||||||
| 60 Months to 71 Months |
49,524 | 0.89 | 54,261,283 | 0.68 | ||||||||||||
| 72 Months or More |
5,413,027 | 97.30 | 7,802,507,962 | 97.21 | ||||||||||||
|
|
|
|
|
|
|
|
|
|||||||||
| Total |
5,563,252 | 100.00 | % | $ | 8,026,831,511 | 100.00 | % | |||||||||
|
|
|
|
|
|
|
|
|
|||||||||
| (1) | For purposes of this table, the age of an account is rounded down to the nearest whole month. For example, the age of an account that has been in existence for eleven months and twenty days would be rounded down to eleven months, and that account would be included in the “Not More than 11 Months” age range. |
Composition by Geographic Distribution
Trust Portfolio
As of December 31, 2011, approximately 15.82%, 13.45%, 9.08%, 8.88% and 7.14% of the receivables related to accountholders having billing addresses in New York, California, Florida, Texas and New Jersey, respectively. Not more than 4% of the receivables relate to accountholders having billing addresses in any other single state.
Composition by Standardized Credit Score
Trust Portfolio
The following table sets forth the composition of the consumer and small business accounts included in the trust portfolio by FICO®** score ranges. To the extent available, FICO scores are obtained at origination and monthly thereafter. A FICO score is a measurement determined by Fair Isaac Corporation using information collected by the major credit bureaus to assess consumer credit risk. FICO risk scores rank-order consumers according to the likelihood that their credit obligations will be paid in accordance with the terms of their accounts. Although Fair Isaac Corporation discloses only limited information about the variables it uses to assess credit risk, those variables likely include, but are not limited to, debt level, credit history, payment patterns (including delinquency experience), and level of utilization of available credit. FICO scores of an individual may change over time, depending on the conduct of the individual, including the individual’s usage of his or her available credit, and changes in credit score technology used by Fair Isaac Corporation.
FICO scores are based on independent, third-party information, the accuracy of which we cannot verify. The account owners do not use standardized credit scores, such as a FICO score, alone to determine the amount of charges that should be approved on a charge card account. Rather, a FICO score is only one of many factors used by TRS, Centurion and FSB, as account owners, to assess an individual’s credit and default risk. In connection with their underwriting and authorization decisions, the account owners use proprietary scoring models, which they generally have found to be more accurate predictors of credit and default risk than any single standardized credit score such as FICO. The use of proprietary models also enables an account owner to extend credit to an accountholder with a lower FICO score without changing that account owner’s risk tolerance than would be the case if that account owner relied solely on FICO. The FICO scores presented below should not be used alone as a method of forecasting whether accountholders will make payments in accordance with the terms of their accounts. References to “Receivables Outstanding” in the following table include both finance charge receivables and principal receivables. Because the future composition of the Trust Portfolio may change over time, this table is not necessarily indicative of the composition of the Trust Portfolio at any specific time in the future.
| ** | FICO® is a federally registered servicemark of Fair, Isaac & Company. |
15
Composition by Standardized Credit Score(1)(2)
Trust Portfolio
| FICO Score Range |
Receivables Outstanding |
Percentage of Total Receivables Outstanding |
||||||
| Less than 560 |
$ | 37,564,208 | 0.47 | % | ||||
| 560-659 |
522,760,069 | 6.51 | ||||||
| 660-699 |
708,569,953 | 8.83 | ||||||
| 700-759 |
2,038,532,632 | 25.40 | ||||||
| 760 & above |
4,399,208,352 | 54.81 | ||||||
| Refreshed FICO Unavailable(3) |
320,196,297 | 3.99 | ||||||
|
|
|
|
|
|||||
| Total |
$ | 8,026,831,511 | 100.00 | % | ||||
|
|
|
|
|
|||||
| (1) | Standardized Credit Score defined as the FICO score in the most recent Monthly Period. |
| (2) | In May and June of 2010, American Express began using FICO scores based on a new version of the model developed by Fair Isaac Corporation to assess credit scores for the accounts included in the trust portfolio. Although the new version does result in different FICO scores for certain of the accounts in the trust portfolio when compared to the FICO scores from the prior version, the change in the average FICO score for the accounts has been insignificant. |
| (3) | As discussed above under “The Trust Portfolio — General,” receivables arising in designated accounts in the Commercial Segment were first included in the Trust Portfolio in January 2009. A substantial portion of the commercial charge accounts in the Commercial Segment do not have associated FICO scores. The inclusion in the Trust Portfolio of receivables arising in commercial charge accounts without associated FICO scores has contributed to an increase in the amount of receivables in the Trust Portfolio for which refreshed FICO scores are unavailable. |
16
Static Pool Information
The following tables present charge-off, delinquency, payment rate and revenue experience of the two segments of accounts in the Total Portfolio: (i) the Consumer and Small Business Segment, consisting of consumer and small business charge accounts and (ii) the Commercial Segment, consisting of commercial charge accounts. Data is presented in separate increments based on the year of origination of the accounts, each an “Origination Period.” Data is presented for accounts that were originated in 2001 or thereafter. For both Segments, data for accounts originated prior to 2001 is not presented since such data is not available and could not be obtained without unreasonable effort or expense. As of December 31, 2011, the accounts reflected in the following tables for the Consumer and Small Business Segment had receivables outstanding that were approximately 56.02% of the total receivables outstanding at such date in the total Consumer and Small Business Segment of the Total Portfolio. As of December 31, 2011, the accounts reflected in the following tables for the Commercial Segment had receivables outstanding that were approximately 91.39% of the total receivables outstanding at such date in the total Commercial Segment of the Total Portfolio. “N/A” in some of the following tables refers to data that is not available.
To the extent any information contained in this report is deemed to form a part of any prospectus supplement, the related prospectus or the related registration statement, all static pool information regarding the performance of receivables for periods prior to January 1, 2006 will not form a part of such prospectus supplement, prospectus or registration statement.
As used in the tables, the date of origination of an account is generally the date the account became effective. The account aging shows activity through the indicated age of the account (e.g., 0-12 months, 13-24 months), which is referred to in this report as the “performance period.” In the following tables, shaded data (or, in the case of the delinquency tables, the yellow- and green-colored data) is based on a full 12 months of activity for all accounts in the applicable Origination Period and, therefore, will not change in future disclosures. The data that is not shaded (or, in the case of the delinquency tables, the data that is colored blue) will change in future disclosures and, in some cases, will reflect activity in an account for less than 12 full months, depending on when the account is originated and when the data for that disclosure is generated.
For Monthly Periods ending after January 1, 2006, the method for reporting account activity for the Total Portfolio was changed. For any Monthly Period ending prior to January 1, 2006, account activity for the Total Portfolio is based on the activity that occurred within each such account during the related monthly billing cycle. We refer to data concerning account activity presented on this basis as “old methodology data.” Old methodology data, therefore, is based on account activity ending on different days throughout a Monthly Period.
For any Monthly Period ending after January 1, 2006, reported account activity for the Total Portfolio is based on the activity that occurred within each such account during such Monthly Period. We refer to data concerning account activity presented on this basis as “new methodology data.” New methodology data, therefore, is based on account activity ending on the last day of a Monthly Period.
Accordingly, for any Monthly Period ending prior to January 1, 2006, the reported delinquency status of a particular account for any Monthly Period is determined on the last day of such account’s billing cycle, while, for any Monthly Period ending after January 1, 2006, the reported delinquency status of all accounts for any Monthly Period is determined on the last day of such Monthly Period. Therefore, under the new methodology, if an amount that is past due as of the last day of the related account’s billing cycle has been paid in full on or prior to the last day of the related Monthly Period, then such account will not be reported as delinquent for such Monthly Period.
Also as a result of the transition from the old methodology to the new methodology, data for the Monthly Period ended December 24, 2005 does not include account activity for those days subsequent to each such account’s monthly billing cycle end date and prior to and including December 24, 2005.
This methodology change has reduced delinquencies reported for the Total Portfolio for Monthly Periods ending after January 1, 2006 as compared with delinquencies reported for Monthly Periods prior to that date and, therefore, we can offer no assurance as to how delinquencies reported prior to January 1, 2006 compare to delinquencies reported after January 1, 2006, and we caution investors to compare data only within the pre-January 1, 2006 period (during which data is presented consistently under the old methodology) or within the post-January 1, 2006 period (during which data is presented consistently under the new methodology) and not across such periods.
Because the Trust Portfolio is only a portion of the Total Portfolio, the actual performance of the receivables in the Trust Portfolio may be different from the performance reflected in the tables below. There can be no assurance that the performance of receivables in the future will be similar to the historical experience set forth below.
17
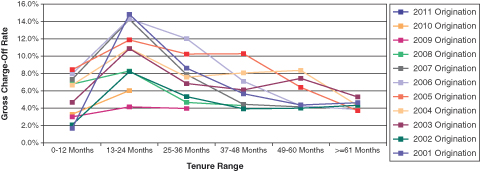
Gross Charge-Off Rates
Total gross charge-offs for any Origination Period include charge-offs of principal and certain fees, but do not include the amount of any reductions in receivables due to a rebate, refund, error, fraudulent charge or other miscellaneous adjustment. The gross charge-off rate, which is an annualized percentage, results from dividing total gross charge-offs by the average month-end receivables for each month in the applicable performance period, which is referred to in this report as the “average receivables outstanding.”
Gross Charge-Off Rate of the
Consumer and Small Business Segment
Total Portfolio
As of Date: December 31, 2011
| Origination Year |
0-12 Months |
13-24 Months |
25-36 Months |
37-48 Months |
49-60 Months |
>=61 Months | ||||||
| 2011 Origination |
1.67% |
|||||||||||
| 2010 Origination |
3.32% |
6.05% |
||||||||||
| 2009 Origination |
3.00% |
4.16% |
3.98% |
|||||||||
| 2008 Origination |
6.79% |
8.30% |
4.69% |
4.30% |
||||||||
| 2007 Origination |
7.33% |
14.25% |
7.91% |
4.47% |
4.16% |
|||||||
| 2006 Origination |
7.96% |
14.35% |
12.03% |
7.12% |
4.29% |
3.85% | ||||||
| 2005 Origination |
8.47% |
11.90% |
10.27% |
10.32% |
6.42% |
3.71% | ||||||
| 2004 Origination |
6.67% |
10.94% |
7.62% |
8.07% |
8.38% |
4.31% | ||||||
| 2003 Origination |
4.68% |
10.91% |
6.87% |
6.12% |
7.44% |
5.30% | ||||||
| 2002 Origination |
2.09% |
8.24% |
5.35% |
3.95% |
4.02% |
4.34% | ||||||
| 2001 Origination |
1.70% |
14.84% |
8.65% |
5.69% |
4.40% |
4.63% |
18
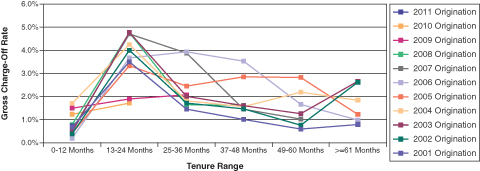
Gross Charge-Off Rate of the
Commercial Segment
Total Portfolio
As of Date: December 31, 2011
| 0-12 | 13-24 | 25-36 | 37-48 | 49-60 | >=61 | |||||||
| Origination Year |
Months |
Months |
Months |
Months |
Months |
Months | ||||||
| 2011 Origination |
0.88% |
|||||||||||
| 2010 Origination |
1.23% |
1.71% |
||||||||||
| 2009 Origination |
1.49% |
1.89% |
2.07% |
|||||||||
| 2008 Origination |
0.79% |
4.77% |
1.64% |
1.62% |
||||||||
| 2007 Origination |
0.54% |
4.71% |
3.87% |
1.46% |
1.03% |
|||||||
| 2006 Origination |
0.20% |
3.67% |
3.93% |
3.53% |
1.66% |
0.98% | ||||||
| 2005 Origination |
0.42% |
3.33% |
2.45% |
2.85% |
2.83% |
1.22% | ||||||
| 2004 Origination |
1.70% |
4.25% |
1.81% |
1.57% |
2.19% |
1.83% | ||||||
| 2003 Origination |
0.46% |
4.78% |
2.01% |
1.61% |
1.26% |
2.66% | ||||||
| 2002 Origination |
0.38% |
4.00% |
1.71% |
1.46% |
0.75% |
2.62% | ||||||
| 2001 Origination |
0.67% |
3.50% |
1.45% |
1.01% |
0.59% |
0.79% |
19
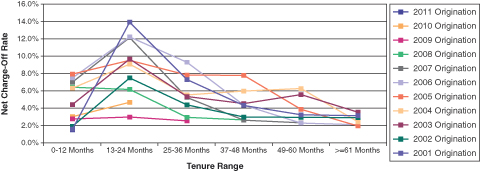
Net Charge-Off Rates
Total net charge-offs for any Origination Period are an amount equal to total gross charge-offs minus total recoveries. The net charge-off rate, which is an annualized percentage, results from dividing total net charge-offs by the average receivables outstanding.
Net Charge-Off Rate of the
Consumer and Small Business Segment
Total Portfolio
As of Date: December 31, 2011
| 0-12 | 13-24 | 25-36 | 37-48 | 49-60 | >=61 | |||||||
| Origination Year |
Months |
Months |
Months |
Months |
Months |
Months | ||||||
| 2011 Origination |
1.62% |
|||||||||||
| 2010 Origination |
3.14% |
4.79% |
||||||||||
| 2009 Origination |
2.86% |
3.08% |
2.65% |
|||||||||
| 2008 Origination |
6.53% |
6.28% |
3.06% |
2.76% |
||||||||
| 2007 Origination |
7.14% |
12.27% |
5.36% |
2.71% |
2.44% |
|||||||
| 2006 Origination |
7.61% |
12.33% |
9.40% |
4.46% |
2.39% |
2.21% | ||||||
| 2005 Origination |
8.05% |
9.64% |
7.95% |
7.90% |
3.99% |
2.05% | ||||||
| 2004 Origination |
6.41% |
9.20% |
5.65% |
6.10% |
6.39% |
2.54% | ||||||
| 2003 Origination |
4.54% |
9.80% |
5.46% |
4.65% |
5.68% |
3.66% | ||||||
| 2002 Origination |
2.03% |
7.59% |
4.51% |
3.09% |
3.05% |
3.04% | ||||||
| 2001 Origination |
1.67% |
14.06% |
7.42% |
4.41% |
3.33% |
3.24% |
20
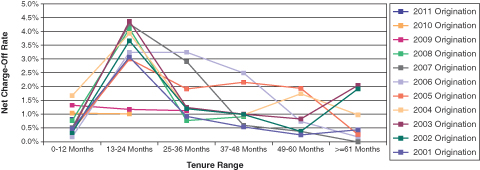
Net Charge-Off Rate of the
Commercial Segment
Total Portfolio
As of Date: December 31, 2011
| 0-12 | 13-24 | 25-36 | 37-48 | 49-60 | >=61 | |||||||
| Origination Year |
Months |
Months |
Months |
Months |
Months |
Months | ||||||
| 2011 Origination |
0.81% |
|||||||||||
| 2010 Origination |
1.04% |
1.02% |
||||||||||
| 2009 Origination |
1.33% |
1.17% |
1.13% |
|||||||||
| 2008 Origination |
0.77% |
4.10% |
0.77% |
0.90% |
||||||||
| 2007 Origination |
0.52% |
4.28% |
2.91% |
0.59% |
0.38% |
|||||||
| 2006 Origination |
0.18% |
3.25% |
3.24% |
2.49% |
0.73% |
0.18% | ||||||
| 2005 Origination |
0.40% |
3.00% |
1.91% |
2.16% |
1.94% |
0.27% | ||||||
| 2004 Origination |
1.67% |
3.92% |
1.22% |
0.98% |
1.74% |
0.98% | ||||||
| 2003 Origination |
0.43% |
4.37% |
1.25% |
1.00% |
0.83% |
2.04% | ||||||
| 2002 Origination |
0.33% |
3.66% |
1.19% |
0.99% |
0.38% |
1.91% | ||||||
| 2001 Origination |
0.48% |
3.06% |
0.91% |
0.54% |
0.25% |
0.43% |
21
30 Days+ Delinquency Rates
The 30 Days+ Delinquency Rate (i.e., accounts 31 days or more delinquent) is the result of dividing the average of the month-end delinquent amounts for each month in the applicable performance period by the average receivables outstanding.
30 Days+ Delinquency Rate of the
Consumer and Small Business Segment
Total Portfolio(1)
As of Date: December 31, 2011
| 0-12 | 13-24 | 25-36 | 37-48 | 49-60 | >=61 | |||||||
| Origination Year |
Months |
Months |
Months |
Months |
Months |
Months | ||||||
| 2011 Origination |
2.66% |
|||||||||||
| 2010 Origination |
2.87% |
3.76% |
||||||||||
| 2009 Origination |
2.21% |
2.29% |
2.45% |
|||||||||
| 2008 Origination |
4.86% |
3.58% |
2.52% |
2.45% |
||||||||
| 2007 Origination |
5.73% |
6.26% |
3.49% |
2.35% |
2.43% |
|||||||
| 2006 Origination |
6.93% |
7.23% |
5.67% |
3.22% |
2.33% |
2.38% | ||||||
| 2005 Origination |
7.55% |
7.25% |
5.98% |
5.25% |
3.00% |
2.17% | ||||||
| 2004 Origination |
7.45% |
7.99% |
5.73% |
4.77% |
4.23% |
2.21% | ||||||
| 2003 Origination |
8.35% |
8.75% |
7.12% |
5.22% |
4.55% |
2.75% | ||||||
| 2002 Origination |
5.83% |
7.11% |
5.95% |
5.09% |
4.03% |
2.57% | ||||||
| 2001 Origination |
9.11% |
11.06% |
7.92% |
6.35% |
5.67% |
3.13% |
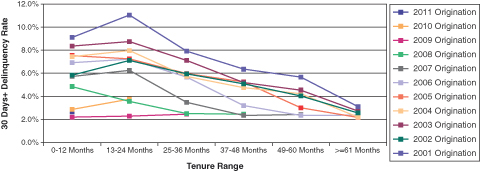
| (1) | As discussed in “Static Pool Information” in this report, for Monthly Periods ending after January 1, 2006, the method for reporting account activity for the Total Portfolio was changed and, as a result, delinquencies reported for the Total Portfolio for Monthly Periods ending after January 1, 2006 (as compared with delinquencies reported for Monthly Periods ending prior to that date) are lower. |
Data presented in each performance period in this delinquency table is color-coded based on the Monthly Periods during which the underlying account activity occurred.
| • | Delinquency data relating exclusively to Monthly Periods ending prior to January 1, 2006, during which data was collected consistently under the old methodology, appears in the yellow-colored performance periods. |
22
| • | Delinquency data relating exclusively to Monthly Periods ending after January 1, 2006, during which data was collected consistently under the new methodology, appears in the blue-colored performance periods. |
| • | Delinquency data relating to a combination of Monthly Periods ending both prior to and after January 1, 2006, during which, as to each account, data was collected to varying degrees under the old methodology and the new methodology (depending on when the account is originated relative to the period covered by the applicable performance period), appears in the green-colored performance periods. |
We can offer no assurance as to how delinquencies reported in the yellow-colored performance periods compare to delinquencies reported in the blue-colored performance periods, and we caution investors to compare data only within performance periods of the same color-coding and not across performance periods of different color-coding.
23
30 Days+ Delinquency Rate of the
Commercial Segment
Total Portfolio(1)
As of Date: December 31, 2011
| 0-12 | 13-24 | 25-36 | 37-48 | 49-60 | >=61 | |||||||
| Origination Year |
Months |
Months |
Months |
Months |
Months |
Months | ||||||
| 2011 Origination |
1.74% |
|||||||||||
| 2010 Origination |
1.82% |
1.93% |
||||||||||
| 2009 Origination |
1.99% |
1.94% |
1.83% |
|||||||||
| 2008 Origination |
3.51% |
2.72% |
1.65% |
1.74% |
||||||||
| 2007 Origination |
3.86% |
4.93% |
2.50% |
1.74% |
1.54% |
|||||||
| 2006 Origination |
4.18% |
5.23% |
4.39% |
2.60% |
1.74% |
1.68% | ||||||
| 2005 Origination |
5.68% |
4.93% |
3.95% |
3.92% |
2.40% |
1.63% | ||||||
| 2004 Origination |
8.62% |
7.52% |
4.14% |
3.74% |
3.40% |
1.77% | ||||||
| 2003 Origination |
8.14% |
10.41% |
6.74% |
3.87% |
3.46% |
2.65% | ||||||
| 2002 Origination |
7.92% |
8.62% |
7.88% |
5.74% |
3.22% |
2.83% | ||||||
| 2001 Origination |
8.84% |
9.40% |
7.69% |
7.35% |
5.36% |
2.43% |
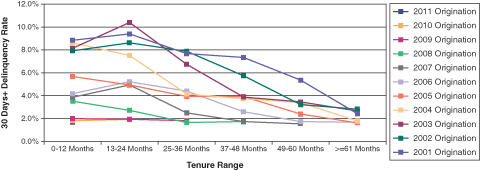
| (1) | As discussed in “Static Pool Information” in this report, for Monthly Periods ending after January 1, 2006, the method for reporting account activity for the Total Portfolio was changed and, as a result, delinquencies reported for the Total Portfolio for Monthly Periods ending after January 1, 2006 (as compared with delinquencies reported for Monthly Periods ending prior to that date) are lower. |
Data presented in each performance period in this delinquency table is color-coded based on the Monthly Periods during which the underlying account activity occurred.
| • | Delinquency data relating exclusively to Monthly Periods ending prior to January 1, 2006, during which data was collected consistently under the old methodology, appears in the yellow-colored performance periods. |
| • | Delinquency data relating exclusively to Monthly Periods ending after January 1, 2006, during which data was collected consistently under the new methodology, appears in the blue-colored performance periods. |
24
| • | Delinquency data relating to a combination of Monthly Periods ending both prior to and after January 1, 2006, during which, as to each account, data was collected to varying degrees under the old methodology and the new methodology (depending on when the account is originated relative to the period covered by the applicable performance period), appears in the green-colored performance periods. |
We can offer no assurance as to how delinquencies reported in the yellow-colored performance periods compare to delinquencies reported in the blue-colored performance periods, and we caution investors to compare data only within performance periods of the same color-coding and not across performance periods of different color-coding.
25
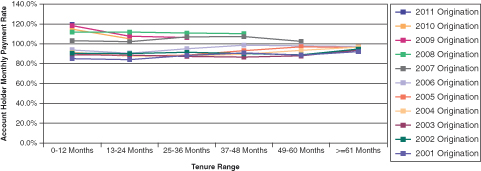
Monthly Payment Rates
The monthly payment rate results from dividing total collections received (excluding recoveries on charged-off receivables) during each month by that month’s opening total receivables balance.
Accountholder Monthly Payment Rates of the
Consumer and Small Business Segment
Total Portfolio
As of Date: December 31, 2011
| 0-12 | 13-24 | 25-36 | 37-48 | 49-60 | >=61 | |||||||
| Origination Year |
Months |
Months |
Months |
Months |
Months |
Months | ||||||
| 2011 Origination |
119.54% |
|||||||||||
| 2010 Origination |
114.64% |
104.91% |
||||||||||
| 2009 Origination |
118.40% |
107.72% |
106.32% |
|||||||||
| 2008 Origination |
111.84% |
111.94% |
111.00% |
110.07% |
||||||||
| 2007 Origination |
103.18% |
102.20% |
106.99% |
107.39% |
102.44% |
|||||||
| 2006 Origination |
93.86% |
90.62% |
95.02% |
98.70% |
97.79% |
97.41% | ||||||
| 2005 Origination |
90.55% |
87.63% |
88.60% |
93.13% |
97.09% |
96.27% | ||||||
| 2004 Origination |
91.38% |
87.59% |
87.96% |
89.50% |
93.53% |
96.78% | ||||||
| 2003 Origination |
88.98% |
88.67% |
87.35% |
86.61% |
87.74% |
93.85% | ||||||
| 2002 Origination |
90.53% |
90.14% |
91.41% |
90.00% |
88.95% |
94.77% | ||||||
| 2001 Origination |
84.88% |
84.16% |
88.28% |
90.68% |
88.55% |
92.06% |
26
Accountholder Monthly Payment Rates of the
Commercial Segment
Total Portfolio
As of Date: December 31, 2011
| 0-12 | 13-24 | 25-36 | 37-48 | 49-60 | >=61 | |||||||
| Origination Year |
Months |
Months |
Months |
Months |
Months |
Months | ||||||
| 2011 Origination |
115.58% |
|||||||||||
| 2010 Origination |
108.60% |
111.34% |
||||||||||
| 2009 Origination |
107.55% |
110.03% |
109.80% |
|||||||||
| 2008 Origination |
100.18% |
104.02% |
106.49% |
107.89% |
||||||||
| 2007 Origination |
92.74% |
94.12% |
101.06% |
103.08% |
104.50% |
|||||||
| 2006 Origination |
91.74% |
92.72% |
96.52% |
102.35% |
105.13% |
109.72% | ||||||
| 2005 Origination |
89.93% |
90.39% |
92.81% |
96.84% |
104.24% |
110.25% | ||||||
| 2004 Origination |
89.17% |
90.46% |
91.44% |
92.54% |
95.40% |
102.22% | ||||||
| 2003 Origination |
87.26% |
87.83% |
89.78% |
90.40% |
92.64% |
99.08% | ||||||
| 2002 Origination |
84.34% |
87.24% |
90.04% |
90.57% |
90.47% |
97.10% | ||||||
| 2001 Origination |
80.69% |
86.06% |
89.61% |
90.98% |
89.34% |
98.45% |
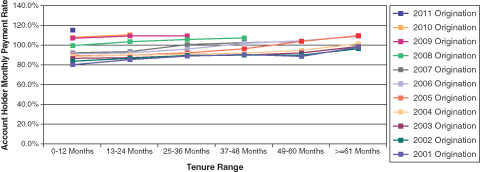
27
Revenue Experience
The percentages set forth in the tables below, which are annualized percentages, result from dividing finance charge collections by the average receivables outstanding. Finance charge collections include discount option receivables.
Revenue Experience of the
Consumer and Small Business Segment
Total Portfolio
As of Date: December 31, 2011
| 0-12 | 13-24 | 25-36 | 37-48 | 49-60 | >=61 | |||||||
| Origination Year |
Months |
Months |
Months |
Months |
Months |
Months | ||||||
| 2011 Origination |
35.18% |
|||||||||||
| 2010 Origination |
37.07% |
37.03% |
||||||||||
| 2009 Origination |
38.31% |
38.46% |
37.74% |
|||||||||
| 2008 Origination |
36.62% |
39.95% |
39.65% |
38.93% |
||||||||
| 2007 Origination |
33.78% |
37.35% |
38.23% |
38.41% |
36.28% |
|||||||
| 2006 Origination |
30.44% |
32.80% |
34.76% |
35.34% |
34.99% |
34.57% | ||||||
| 2005 Origination |
29.67% |
31.59% |
32.06% |
34.07% |
34.80% |
34.39% | ||||||
| 2004 Origination |
29.41% |
31.62% |
31.67% |
32.41% |
34.19% |
34.60% | ||||||
| 2003 Origination |
28.78% |
31.70% |
31.47% |
31.15% |
31.68% |
33.80% | ||||||
| 2002 Origination |
29.39% |
32.37% |
32.73% |
32.40% |
32.04% |
34.14% | ||||||
| 2001 Origination |
27.52% |
30.29% |
31.70% |
32.46% |
31.82% |
33.15% |
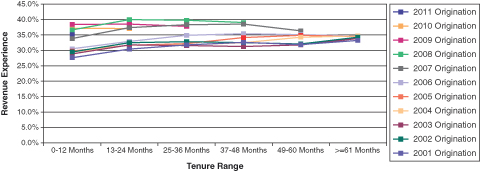
28
Revenue Experience of the
Commercial Segment
Total Portfolio
As of Date: December 31, 2011
| 0-12 | 13-24 | 25-36 | 37-48 | 49-60 | >=61 | |||||||
| Origination Year |
Months |
Months |
Months |
Months |
Months |
Months | ||||||
| 2011 Origination |
32.99% |
|||||||||||
| 2010 Origination |
35.45% |
40.76% |
||||||||||
| 2009 Origination |
34.99% |
39.94% |
40.11% |
|||||||||
| 2008 Origination |
33.10% |
37.60% |
38.59% |
39.36% |
||||||||
| 2007 Origination |
30.40% |
35.06% |
36.77% |
37.42% |
38.20% |
|||||||
| 2006 Origination |
30.03% |
33.93% |
36.16% |
37.17% |
38.07% |
40.15% | ||||||
| 2005 Origination |
29.45% |
32.99% |
34.05% |
36.30% |
37.84% |
40.11% | ||||||
| 2004 Origination |
29.08% |
32.96% |
33.35% |
33.81% |
35.70% |
37.03% | ||||||
| 2003 Origination |
28.48% |
31.99% |
32.64% |
32.95% |
33.83% |
36.36% | ||||||
| 2002 Origination |
27.64% |
31.89% |
32.93% |
32.90% |
33.02% |
35.53% | ||||||
| 2001 Origination |
26.55% |
31.61% |
32.68% |
33.20% |
32.51% |
36.06% |
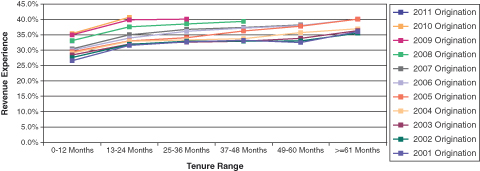
29
Glossary of Terms
“Additional Accounts” means any Eligible Accounts designated to be included in the Portfolio of the issuance trust and whose receivables are transferred to the issuance trust.
“Centurion” means American Express Centurion Bank, a Utah bank.
“Commercial Segment” has the meaning described in “The Total Portfolio — General” in this report.
“Consumer and Small Business Segment” has the meaning described in “The Total Portfolio — General” in this report.
“Date of Processing” means, for any transaction or receipt of collections, the Business Day after such transaction or receipt is first output, in written form pursuant to the servicer’s usual and customary data processing procedures, from the servicer’s computer file of accounts comparable to the accounts in the issuing entity’s Portfolio (regardless of the effective date of recordation).
“Defaulted Receivables” means, for any Monthly Period, principal receivables that were charged off as uncollectible in such Monthly Period in accordance with the account guidelines and the applicable servicer’s customary and usual servicing procedures for servicing receivables comparable to the receivables. For purposes of this definition, a principal receivable in any account becomes a Defaulted Receivable on the Date of Processing it is recorded as charged-off on such servicer’s computer file of accounts.
“Discount Option Percentage” has the meaning specified in “Sources of Funds to Pay the Notes — Discount Option” in this prospectus.
“Discount Option Receivables” means on any Date of Processing occurring in any Monthly Period following the Monthly Period in which a discount option date occurs, the product of (a) the Discount Option Percentage and (b) Receivables received on such Date of Processing.
“Eligible Accounts” means a charge account established pursuant to an account agreement and owned by an account owner and its successors and permitted assigns which, as of the respective selection date, is a charge account:
| • | in existence and maintained by an account owner or such successors or assigns; |
| • | is payable in United States dollars; |
| • | has not been identified by the servicer in its computer files as cancelled due to a related accountholder’s bankruptcy or insolvency; |
| • | has not been sold or pledged to any other party except for any other account owner that has entered into a receivables purchase agreement or the transferor; |
| • | does not have receivables which have been sold or pledged to any other party other than American Express Credit Corporation pursuant to the applicable receivables purchase agreement or the transferor; |
| • | has an accountholder who has provided as his or her most recent billing address an address located in the United States, its territories or possessions or a United States military address (provided, however, that, at any time, up to 3% of the aggregate amount of receivables may have accountholders who have provided as their most recent billing addresses, addresses outside of such jurisdictions); |
| • | has not been identified as an account with respect to which the related card has been lost or stolen (if such account is a charge card account); and |
| • | does not have receivables that are Defaulted Receivables and does not have any receivables that have been identified by the servicer as having been incurred as a result of fraudulent use of any related charge card. |
30
Eligible Accounts may include accounts, the receivables of which have been written off or which have been identified by the servicer in its computer files as cancelled due to a related accountholder’s bankruptcy or insolvency, in each case as of the applicable selection date; provided that:
| • | the balance of all receivables included in such accounts is reflected on the books and records of the related account owner (and is treated for purposes of the transfer and servicing agreement) as “zero,” and |
| • | charging privileges with respect to all such accounts have been canceled in accordance with the account guidelines. |
“Finance Charge Collections” means, for any Monthly Period, the sum of:
| • | with respect to receivables included in the issuance trust, collections of finance charge receivables (including collections received with respect to Discount Option Receivables, if any, for such Monthly Period) received by the servicer on behalf of the issuing entity; |
| • | with respect to a collateral certificate included in the issuance trust, collections of finance charge receivables allocable to the holder of that collateral certificate under the applicable securitization agreements for the related master trust or other securitization special purpose entity for such Monthly Period; |
| • | any amounts received by the issuer to be treated as Finance Charge Collections with respect to such series, class or tranche as described in the related prospectus supplement for such Monthly Period; and |
| • | the amount of investment earnings (net of losses and investment expenses), if any, on amounts in deposit in the collection account, the overconcentration account and the excess funding account for such Monthly Period. |
If so specified in the related prospectus supplement, Finance Charge Collections for any Monthly Period will include the issuer rate fee amount, if any, paid to the issuing entity with respect to such Monthly Period (to the extent received by the issuing entity and deposited into the collection account).
“FSB” means American Express Bank, FSB, a federal savings bank.
“Monthly Period” means the period beginning at the opening of business on the second day following the last day of the seventh billing cycle (of one of the account receivable platforms) of the second preceding calendar month and ending at the close of business on the day following the last day of the seventh billing cycle (of such account receivable platform) of the immediately following month. The last day of each such seventh monthly billing cycle generally occurs between the twenty-first (21st) day and the twenty-fifth (25th) day of each month. Therefore, the number of days in a Monthly Period generally may vary from a calendar month by up to four days.
“Origination Period” has the meaning described in “Static Pool Information” in this report.
“Portfolio” means (i) with respect to the issuing entity, certain accounts selected from a portfolio of accounts owned by TRS, Centurion, FSB or any of their affiliates and included in the issuance trust based on the eligibility criteria specified in the transfer and servicing agreement and (ii) with respect to any master trust or other securitization special purpose entity which has issued a collateral certificate included in the issuance trust, certain accounts selected from a portfolio of accounts owned by TRS, Centurion, FSB or any of their affiliates and included in that master trust or other securitization special purpose entity based on the eligibility criteria specified in the applicable trust agreement or pooling and servicing agreement.
“Principal Collections” means, with respect to any Monthly Period,
| • | with respect to receivables, collections other than those designated as Finance Charge Collections on designated accounts for such Monthly Period; |
| • | with respect to a collateral certificate, collections of principal receivables allocable to the holder of that collateral certificate under the applicable securitization agreements for the related master trust or other securitization special purpose entity for such Monthly Period; and |
31
| • | the amount of funds withdrawn from the excess funding account for such Monthly Period which are required to be deposited into the collection account and treated as Principal Collections during an accumulation period or an amortization period pursuant to the transfer and servicing agreement. |
“Rating Agency Condition” means, with respect to any action, that each rating agency that has rated any outstanding series, class or tranche of notes notifies the transferor, the servicer, the owner trustee and the indenture trustee in writing that such action will not result in a reduction in or withdrawal of the then-existing rating of any outstanding series, class or tranche of notes with respect to which it is a rating agency or, with respect to any outstanding series, class or tranche of notes not rated by any rating agency, as specified in the related indenture supplement.
“Segment” has the meaning described in “The Total Portfolio — General” in this report.
“Total Portfolio” means the portfolio of consumer, small business and commercial charge accounts owned by TRS, Centurion, FSB or any of their affiliates from which the accounts designated to be included in the Trust Portfolio are selected.
“TRS” means American Express Travel Related Services Company, Inc., a New York corporation.
“Trust Portfolio” means the initial accounts and any Additional Accounts selected from the Total Portfolio to have their receivables included in the issuance trust based on the eligibility criteria specified in the receivables purchase agreements and the transfer and servicing agreement.
32
Pursuant to the requirements of the Securities Exchange Act of 1934, as amended, the registrants have duly caused this report to be signed on their behalf by the undersigned hereunto duly authorized.
| American Express Receivables Financing Corporation V LLC, as originator of the Trust and Co-Registrant and as Transferor on behalf of the Trust as Co-Registrant | ||
| By: | /s/ Anderson Y. Lee | |
| Name: | Anderson Y. Lee | |
| Title: |
Vice President and Treasurer | |