Attached files
| file | filename |
|---|---|
| 8-K - FORM 8-K - ATHENAHEALTH INC | d302119d8k.htm |
| EX-99.1 - EX - 99.1 - ATHENAHEALTH INC | d302119dex991.htm |
Exhibit 99.2
| Fourth Quarter and Fiscal Year 2011 |

| |
| Prepared Remarks | February 15, 2012 | |
| Jonathan Bush, President, Chairman & Chief Executive Officer |
||
| Tim Adams, Senior Vice President, Chief Financial Officer |
About These Remarks
The following commentary is provided by management in conjunction with the fourth quarter and full year 2011 earnings press release issued by athenahealth, Inc. (the “Company” or “we”). These remarks represent management’s current views on the Company’s financial and operational performance and are provided to give investors and analysts more time to analyze and understand our performance in advance of the earnings conference call. These prepared remarks will not be read on the conference call. A complete reconciliation between GAAP and non-GAAP results as well as a summary of supplemental metrics and definitions is provided in the tables following these prepared remarks.
Earnings Conference Call Information
To participate in the Company’s live conference call and webcast, please dial 800-446-2782 (or 847-413-3235 for international calls) using conference code No. 31557729, or visit the Investors section of the Company’s web site at www.athenahealth.com. A replay will be available for one week following the conference call at 888-843-7419 (and 630-652-3042 for international calls) using conference code No. 31557729. A webcast replay will also be archived on the Company’s website.
Safe Harbor and Forward-Looking Statements
These remarks contain forward-looking statements, which are made pursuant to the safe harbor provisions of the Private Securities Litigation Reform Act of 1995, including statements reflecting management’s expectations for future financial and operational performance, growth, and business outlook; statements regarding the benefits of the Company’s service offerings, the Company’s research and development efforts, the further integration of the Company’s services and the resulting benefits, the anticipated changes in the types of providers and health care entities the Company serves and the range of tasks the Company performs for clients, the Company’s sales and marketing activities and plans, the potential for cross-sales among service offerings and sales involving multiple services, the Company’s implementation pipeline, the impact of the transition to the ANSI 5010 standard and the ICD-10 code set and the Company’s implementation thereof, and the creation of a sustainable market for health information exchange, a social network for health care, and a national health IT network; statements made during the Company’s 4th Annual Investor Summit; and statements found under the Company’s Reconciliation of Non-GAAP Financial Measures section of these remarks. The forward-looking statements in these remarks do not constitute guarantees of future performance. These statements are neither promises nor guarantees, and are subject to a variety of risks and uncertainties, many of which are beyond the Company’s control, which could cause actual results to differ materially from those contemplated in these forward-looking statements. In particular, the risks and uncertainties include, among other things: the Company’s fluctuating operating results; the Company’s variable sales and implementation cycles, which may result in fluctuations in its quarterly results; risks associated with the acquisition and integration of companies and new technologies, including those related to the Company’s ability to successfully integrate the athenaCoordinatorSM service and successfully scale the Proxsys services and technologies to achieve expected synergies; risks associated with its expectations regarding its ability to maintain profitability; the impact of increased sales and marketing expenditures, including whether increased expansion in revenues is attained and whether impact on margins and profitability is longer term than expected; changes in tax rates or exposure to additional tax liabilities; the highly competitive industry in which the Company operates and the relative immaturity of the market for its service offerings; and the evolving and complex governmental and regulatory compliance environment in which the Company and its clients operate. Existing and prospective investors are cautioned not to place undue reliance on these forward-looking statements, which speak only as of the date hereof. The Company undertakes no obligation to update or revise the information contained in these remarks, whether as a result of new information, future events or circumstances, or otherwise. For additional disclosure regarding these and other risks faced by the Company, see the disclosures contained in its public filings with the Securities and Exchange Commission, available on the Investors section of the Company’s website at http://www.athenahealth.com and on the SEC’s website at http://www.sec.gov.
1
Use of Non-GAAP Financial Measures
These remarks contain non-GAAP financial measures, as defined by SEC Regulation G. The GAAP financial measure most directly comparable to each non-GAAP financial measure used or discussed, and a reconciliation of the differences between each non-GAAP financial measure and the comparable GAAP financial measure, are included following these prepared remarks or can be found within the Company’s fourth quarter and full year 2011 earnings press release on the Investors section of the Company’s web site at http://www.athenahealth.com.
Opening Remarks
2011 was athenahealth’s 12th year of annual revenue growth in excess of 30% and marked our 12th year of consecutive quarterly revenue growth. We have aligned our financial success with our clients’ performance and have made significant strides in our vision of building a health information backbone that helps health care work as it should. We modified our mission statement from “medical groups’ most trusted business service” to “medical care givers’ most trusted service” to expand our market to include the retail clinics, urgent care centers, and hospital systems we now serve. The launch of our care coordination strategy with athenaCoordinator was a watershed event that broadened athenahealth’s market opportunity by positioning us to create a healthy, sustainable market for health information exchange. We have support from the U.S. Department of Health and Human Services, Office of Inspector General (OIG) to create a two-sided market in health care where we can now charge receivers for the electronic health information they consume.
We also increased our credibility with the market by delivering unparalleled compliance with the myriad of new standards for operation imposed upon health care of late. 66% of eligible athenahealth providers on our athenaClinicals® service had attested in Year 1, Stage 1 Meaningful Use (MU) as of December 3, 2011, compared to 18% nationally in the same time frame as reported by the Centers for Medicare and Medicaid Services (CMS) on December 7, 2011. As of January 14, 2012, 83% of eligible providers have attested, at rate well above the national average. 100% of our clients are already transmitting claims using the American National Standards Institute (ANSI) 5010 transaction format, and we are off to an incredible start with the conversion to International Statistical Classification of Diseases and Related Health Problems, 10th Revision (ICD-10) and expect to have 100% migrated to this code set for reporting diagnoses and procedures to payers well in advance of the October 1, 2013, deadline. We believe that having technology that could be used by practices and hospitals to comply with the standard is not the same thing as having compliance. With MU, ANSI 5010, ICD-10, and other ever-changing care delivery and reimbursement models, the health care environment has become even more complex for our clients to operate in. In short, due to our cloud-based service business model, athenahealth is in a unique position to guide medical care givers of all kinds to the result of full compliance and profitability within health care’s complex web of rules and standards. While today this makes us unique, we believe that this capability will in the future be a minimum requirement for any provider of health care information technology.
Results Overview
athenahealth’s top line results for Q4 and fiscal year (FY) 2011 reflect strong annual revenue growth:
| • | Total revenue: |
| • | $92.5 million in Q4 2011, representing 33% growth over $69.4 million in Q4 2010 |
| • | $324.1 million in FY 2011, representing 32% growth over $245.5 million in FY 2010 |
Our bottom line results for Q4 and FY 2011, consistent with our growth strategy, demonstrate strong sales and marketing investments and a focus on operating leverage:
| • | Non-GAAP Adjusted Gross Profit: |
| • | $59.4 million, or 64.2% of total revenue, in Q4 2011, an increase of 29% over $46.0 million, or 66.3% of total revenue, in Q4 2010 |
2
| • | $206.7 million, or 63.8% of total revenue, in FY 2011, an increase of 35% over $153.1 million, or 62.4% of total revenue, in FY 2010 |
| • | GAAP selling and marketing expense: |
| • | $23.2 million, or 25.1% of total revenue, in Q4 2011, an increase of 58% over $14.7 million, or 21.2% of total revenue, in Q4 2010 |
| • | $79.8 million, or 24.6% of total revenue, in FY 2011, an increase of 51% over $52.7 million, or 21.5% of total revenue, in FY 2010 |
| • | GAAP research and development expense: |
| • | $7.0 million, or 7.5% of total revenue, in Q4 2011, versus $4.9 million, or 7.1% of total revenue, in Q4 2010 |
| • | $23.3 million, or 7.2% of total revenue, in FY 2011, versus $18.4 million, or 7.5% of total revenue, in FY 2010 |
| • | GAAP general and administrative expense: |
| • | $13.4 million, or 14.5% of total revenue, in Q4 2011, versus $9.6 million, or 13.9% of total revenue, in Q4 2010 |
| • | $48.7 million, or 15.0% of total revenue, in FY 2011, versus $43.1 million, or 17.6% of total revenue, in FY 2010 |
| • | Non-GAAP Adjusted EBITDA: |
| • | $20.7 million, or 22.4% of total revenue, in Q4 2011, an increase of 3% from $20.2 million, or 29.1% of total revenue, in Q4 2010 |
| • | $70.6 million or 21.8% of total revenue in FY 2011, an increase of 38% over $51.0 million or 20.8% of total revenue in FY 2010 |
| • | Non-GAAP Adjusted Net Income: |
| • | $9.3 million, or $0.26 per diluted share, in Q4 2011, a decline of 5% from $9.8 million, or $0.28 per diluted share, in Q4 2010 |
| • | $31.8 million, or $0.88 per diluted share, in FY 2011, an increase of 40% from $22.6 million, or $0.64 per diluted share, in FY 2010 |
We believe that the Company’s underlying drivers of long-term success remain strong, but more focus is needed on average client days in accounts receivable (DAR):
| • | Employee engagement at 4.0 out of 5.0 in Q4 2011 versus 4.0 in Q4 2010 |
| • | Client satisfaction at 87.3% in Q4 2011 versus 87.6% in Q4 2010 |
| • | Average client DAR of 38.9 days in Q4 2011 versus 38.8 days in Q4 2010 |
| • | Client collection rate was on average 96.1% during FY 2011. The client collection rate is defined as the percentage of charges that are not written off to bad debt. Our goal for the client collection rate in 2012 is 96%, consistent with 2011 results. |
athenahealth’s client base continues to expand while client adoption of other services in the athenahealth service suite grows rapidly.
During Q4 2011:
| • | 73% of all new athenaCollector® deals included athenaClinicals, up from 58% in Q4 2010 |
| • | 44% of all new athenaCollector deals included both athenaClinicals and athenaCommunicator®, up from 17% in Q4 2010 |
3
| • | Net new physicians and providers added to the network were as follows: |
| athenaCollector | athenaClinicals | athenaCommunicator | ||||||||||||||||||||||
| Active physicians and providers: | Physicians | Providers | Physicians | Providers | Physicians | Providers | ||||||||||||||||||
| Beginning balance (Q3 2011) |
22,477 | 31,675 | 4,202 | 5,849 | 2,931 | 4,117 | ||||||||||||||||||
| Q4 2011 net new additions |
733 | 1,065 | 460 | 676 | 1,167 | 1,713 | ||||||||||||||||||
| Ending balance (Q4 2011) |
23,210 | 32,740 | 4,662 | 6,525 | 4,098 | 5,830 | ||||||||||||||||||
| Sequential growth % |
3 | % | 3 | % | 11 | % | 12 | % | 40 | % | 42 | % | ||||||||||||
During FY 2011, net new physicians and providers added to the network were as follows:
| athenaCollector | athenaClinicals | athenaCommunicator | ||||||||||||||||||||||
| Active physicians and providers: | Physicians | Providers | Physicians | Providers | Physicians | Providers | ||||||||||||||||||
| Beginning balance (Q4 2010) |
19,197 | 27,114 | 2,383 | 3,348 | 736 | 1,213 | ||||||||||||||||||
| FY 2011 net new additions |
4,013 | 5,626 | 2,279 | 3,177 | 3,362 | 4,617 | ||||||||||||||||||
| Ending balance (Q4 2011) |
23,210 | 32,740 | 4,662 | 6,525 | 4,098 | 5,830 | ||||||||||||||||||
| Y/Y growth % |
21 | % | 21 | % | 96 | % | 95 | % | 457 | % | 381 | % | ||||||||||||
athenaCollector network performance metrics were as follows for Q4 2011:
| • | $1,990,373,883 posted in total client collections, up 23% from Q4 2010 |
| • | 16,368,172 total claims submitted, up 25% from Q4 2010 |
| • | 77.9% electronic remittance advice (ERA) rate, an improvement of over two points from Q4 2010 |
| • | 93.7% first pass resolution (FPR) rate, down slightly from Q4 2010 |
Product Development Discussion
Product development at athenahealth is organized around the goal of being the best in the world at getting medical care givers paid for doing the right thing. In order to fulfill this mission, we deliver services backed by cloud-based software, proprietary knowledge, and robust back-office services.
athenaCollector Service Offering
athenaCollector is our cloud-based medical billing and practice management solution. It is the foundation of our service portfolio and entered general availability in 2000.
All of our preparation on behalf of our clients for the transition to ANSI 5010 is paying off, and as of early February 2012, athenahealth has been transacting approximately 93% of all of our electronic transactions in compliance with the new standard. We believe that successful ANSI 5010 adoption, the precursor to the ICD-10 code set to rollout on October 1, 2013, will be indicative of ICD-10 success. However, as a cloud-based service model, we are acutely aware that not all payers are ready, and we will continue to convert these other payers as they become ready. athenahealth will continue to submit clean ANSI 4010 claims to payers that were unable to meet the transaction deadline, and we will continue to actively manage these transitions to minimize any disruption to our clients’ collections during the first half of 2012. During 2012, the team will continue to manage 5010 transactions for our clients while also preparing for the ICD-10 code set conversion in 2013. You can read more about our efforts to prepare for ANSI 5010 in the recent blog post “ANSI 5010: Are You Blowing Off the Deadline?”.
The athenaCollector team is driven by our mission to be medical care givers’ most trusted service and is continually focused on expanding the value delivered by athenaCollector for two reasons: to increase the value proposition of the athenaCollector service offering across the market by taking on more administrative work and to help us expand our client base beyond the traditional medical practice. For example, we are exploring the addition of new services, including provider credentialing and handling patient-insurance-related denials, to our athenaCollector service offering. Provider credentialing will be a natural extension of our existing provider enrollment service (which aligns athenaNet® with payer data and enables electronic transactions) but will now shift responsibility for registering providers with payers
4
to ensure proper contract adherence. Handling patient-insurance-related denials will extend our claim submission responsibilities to help our clients repair rejected claims that fail due to faulty insurance data. These expanded services will significantly improve the return on investment of the athenaCollector service offering while leveraging our existing operations strengths. In addition, as we expand our market beyond the traditional ambulatory office-based physician practice, we are adapting our service offerings to meet the varied needs of the broader market, including urgent care and ambulance transport companies. The product development and operations teams will be focused on expanding our athenaCollector service offerings for both traditional and non-traditional health care providers during 2012.
Our athenaCollector service offering allows our clients to profit by doing the right thing. The experience of our newest clients on the network continues to validate our value proposition. The latest cohort of newly implemented clients showed an average 12% increase in collections and 35% decrease in client DAR, compared to the last twelve months prior to their go-live. Average client DAR across our entire client base dropped almost one day from 39.7 in Q3 2011 to 38.9 in Q4 2011, but it still remains higher than our internal goal. The combination of our expanding services and our consulting services team delivered a significant impact early in the fourth quarter, reducing client DAR below 38 in November 2011. The progress made in reducing client DAR mid-quarter was partly attributed to the automated appeals process introduced in Q3 2011. However, during December, athenahealth was hit with a series of ANSI 5010 obstacles driven by clearinghouses bundling clean athenahealth claims with incorrectly formatted claims from other sources, which drove up the quarterly result. We anticipate the transition to ANSI 5010 will continue to have a short-term negative impact on client DAR driven by processing delays at clearinghouses. The athenaCollector team will continue to monitor the impact of ANSI 5010 and is pursuing a number of initiatives aimed at improving average client DAR during 2012. The launch of the expanded services and other R&D initiatives will attempt to improve approximately 30% of the client DAR (approximately 9.7 days) that is associated with client workflows. Understanding denials allows us to construct rules to avoid future denials across our entire client base, which will help drive down client DAR and assist us in reaching our goal of 37.5 days in 2012.
Finally, athenaCollector performed very well in the 2011 KLAS rankings, winning second place in the Practice Management segments for 1 to 10 physicians and 11 to 75 physicians. It is also important to note that, while athenaCollector did not have enough surveys to qualify for a ranking in the 75+ segment, athenaCollector’s preliminary score was the second highest for all products in that segment.
athenaClinicals Service Offering
athenaClinicals is our cloud-based electronic health record (EHR) management service. It entered general availability in 2006 and was made available as a stand-alone service in 2010.
Our athenaClinicals service offering has experienced tremendous growth in 2011, with the number of total active providers live on the network almost doubling from 3,348 in FY 2010 to 6,525 in FY 2011. Over the past three years, athenaClinicals providers have grown over 100%:
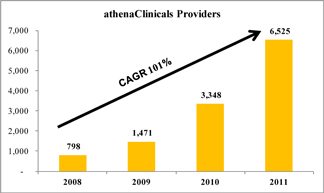
5
Along with the rapid adoption rates, our athenaClinicals service offering expanded its breadth and depth of specialties and size of clients served. The success of athenaClinicals during 2011 was further validated by the 2011 #1 Best in KLAS ranking of athenaClinicals for the ambulatory EHR segment (11 to 75 physicians) and the second place ranking in the 1 to 10 physicians segment. This recognition is a testament to athenahealth’s ability to provide a full-service EHR solution that removes the pain points of traditional EHR software and helps physicians more easily qualify and reap the benefits of pay-for-performance programs.
During Q3 2011, athenahealth demonstrated the power of the cloud-based services model and our ability to understand and measure client performance at the point of care with the launch of our MU performance dashboard. The dashboard reflects performance across the 25 MU measures under Stage 1 of the Health Information Technology for Economic and Clinical Health Act (HITECH Act), 20 of which must be fulfilled in order for a physician to receive incentive payments. This data is refreshed every two weeks in order to provide a near real-time view into performance, and the dashboard will evolve to reflect future MU requirements.
As of January 14, 2012, 83% of athenaClinicals providers pursuing Medicare MU during 2011 have attested for Medicare MU, which is well above the national average success rate. This compares to data released by the Centers for Medicare and Medicaid Services (CMS) in early January showing 27% (or 33,240 of 123,923) eligible physicians who registered for the Medicare MU program have successfully attested. athenahealth’s clients account for a disproportionate share of physicians who have successfully achieved Stage 1 MU, a remarkable achievement when compared to traditional software EHR vendors and their purported ambulatory EHR market share.
The MU dashboard is just one of many examples of how we are building a nationwide learning platform in health care. The MU dashboard provides visibility into our clients’ performance in real time, and we have used this knowledge to successfully change our clients’ behavior at the point of care and to assist them in achieving MU. However, MU to athenahealth is not just about successful fulfillment of the Medicare MU measures; it is also about making MU meaningful and improving patient care. One of the core objectives of the MU program is to improve public health. In order for providers to demonstrate Stage 1 of MU, they are required to exchange electronic data with their state immunization or public health registry. To assist our clients in meeting this important public health measure requirement, athenahealth built a single connection with each state immunization registry, where possible, and created the nation’s first immunization registry hub. Our single-instance platform allows all existing and future athenaClinicals clients to benefit from this newly created immunization registry and helps them connect to their state registry at no additional cost. As it relates to this initiative, the athenahealth team has built connections with 30 state immunization registries to date and has determined that connections with the remaining registries are either not possible at this time or athenahealth does not have clients administering immunizations in those states. Notably, 46% of our participating physicians satisfied the public health measure, while the remaining 54% were excluded from the public health measure as their states did not have the infrastructure in place to test or the physicians did not perform immunizations in 2011. This compares to an average of 34% of Medicare providers who successfully performed the test per the CMS data reported on January 10, 2012. You can read more about athenahealth’s utilization of the cloud-based services model to drive MU in the recent blog posts “Meaningful Use Dashboard Update: What a Difference a Cloud Makes,” “Meaningful Use Dashboard Update: It Takes Teamwork,” and “Meaningful Use Dashboard Update: An Opportunity to Expand a National Health Information Backbone”.
Our success with MU is a bellwether for our broader ability to use our knowledge-based platform to change the behavior of our providers at the point of care. We continue to build our centralized payer reimbursement rules by learning from the collective experience of our client network, as well as through proactive outreach to payers. athenahealth continues to adapt to rapidly changing reimbursement rules by
6
expanding our clinical Quality Management EngineTM to ensure that medical care givers are coordinating care by following the right protocols to get paid for doing the right thing. As a physician is seeing a patient, the clinical Quality Management Engine surfaces rules that apply based on that patient’s insurance, previous medical history, and other factors. We then prepare and submit quality reporting on behalf of clients and, more importantly, track down related payments. Our ability to identify and match collections associated with incentive programs requires high coordination between our operations and technology teams and enables our clients to understand exactly where they stand. This level of clarity is very difficult to obtain from traditional EHR and revenue cycle management software platforms and will become more critical as Pay-For-Reporting, Pay-For-Performance (P4P), and other bonus programs proliferate.
We differentiate the athenaClinicals service offering from traditional software EHR products through our services and the athenaClinicals Quality Management Engine. The combination of software, knowledge, and service has improved our clients’ productivity and financial performance, which is demonstrated by a client average 3.8% improvement in patient throughput, 1,329 clinical documents processed on average per physician per month, and increased P4P collections. The recognition from KLAS and from our larger enterprise clients demonstrates that our athenaClinicals service offering is the right solution for medical groups of all sizes. We are poised for continued growth in 2012 and beyond as the need for care coordination and more integrated delivery models becomes even more critical for medical care givers to succeed.
athenaCommunicator Service Offering
athenaCommunicator is our cloud-based patient communication management service. It entered general availability in 2010 and, at this time, requires adoption of athenaCollector or athenaClinicals.
2011 represented athenaCommunicator’s first full year in the market. athenaCommunicator has been well received, as medical care givers have been able to understand the value proposition of this service offering, which includes reducing practice staff workloads, boosting patient engagement, and maximizing practice revenue. The success of this service offering to date is proven by an 18% penetration rate into the athenaCollector physician base in less than two years. athenaCommunicator has demonstrated successful management of patient communications, with an average 16% reduction in patient no-show rates (as compared to 11% in 2010), increased patient interactions on the patient portal, and improved collections in patient payments. The patient portal performs a variety of functions for a practice that reduce administrative work, allowing the practice to spend more time seeing patients and performing more value-added activities. At this time, more than 330,000 patients use the portal, representing an average of 27% of an established client’s active patient base (an established client is one that has been live on athenaCommunicator for more than six months).
In our continuing efforts to be the best in the world at sourcing new patients for our clients and fully automating the patient registration and scheduling processes, athenahealth expanded its pilot program with Vitals.com. VitalsSM is a cloud-based, comprehensive resource of medical information on doctors nationwide. Under this pilot program, athenaCommunicator clients benefit from preferred placement on Vitals.com search results. Additionally, our work to automate the registration and scheduling processes for new patients resulted in 17,000 patients completing the new-patient registration process through the athenaCommunicator patient portal during 2011.
Having just completed its first full year in the marketplace, athenaCommunicator has quickly increased the value proposition of our integrated suite of services by improving schedule density, self-pay collections, and overall practice efficiency. athenaCommunicator has also been integral in assisting our clients to achieve Patient-Centered Medical Home (PCMH) recognition and several MU measures because it relates to patient communications, including sending reminders to patients for
7
preventative/follow-up care, providing patients with an electronic copy of their health information, providing patients with timely electronic access to their health information (including lab and test results), and enabling a user to provide clinical summaries to patients for each office visit. The 2012 product roadmap includes several initiatives aimed at continuing our efforts to increase patient self-service, reduce administrative work at our clients’ practices, and maximize our clients’ market share by increasing new patient volume.
athenaCoordinator Service Offering
athenaCoordinator is our cloud-based care coordination service for order transmission, insurance pre-certification, and patient registration among physicians and hospitals, surgical centers, and imaging centers. It entered general availability in 2011 following the acquisition of Proxsys LLC.
It has been more than five months since the acquisition of Proxsys LLC, and integration has been a key area of focus for the athenahealth and Proxsys teams. There has been a three-pronged approach to the integration of the new service, comprised of organizational and cultural, product and technology, and sales force integration. The teams are now completely aligned, and the Proxsys service offering has been re-branded as athenaCoordinator.
From a product integration perspective, much of the work performed in Q4 2011 was focused on re-writing Proxsys’ existing web-based application into athenaNet, setting the foundation for further product automation and integration efforts planned for 2012 and beyond. These initiatives will ensure tighter integration between senders and receivers on athenaNet and support our goal of building the connective tissue required for improved care coordination. The 2012 product roadmap includes, among other initiatives, the following:
| • | Complete the re-writing of the application within athenaNet |
| • | Integrate athenaCollector and athenaClinicals ordering functionality with athenaCoordinator |
| • | Expand athenahealth’s patented billing Rules Engine to include pre-certification work flows |
| • | Build work flow distribution tools to further streamline and scale key operational processes |
| • | Apply athenahealth’s automated eligibility checking engine to athenaCoordinator workflows |
And, finally, we have re-aligned our sales force to capitalize on the two-sided revenue stream created by athenaCoordinator. The launch of athenaCoordinator has enabled athenahealth to provide a service offering for the in-patient market and other receivers of complex referrals. Our sales force will “coordinate” around key physician influencers in these markets to identify targeted receiver prospects and expand athenaCoordinator adoption. In addition, the sales team will have direct access to medical practices affiliated with our existing athenaCoordinator clients who utilize our free transmission portal on a regular basis. The goal is to leverage these existing relationships and benefits provided by athenaCoordinator to cross-sell our suite of ambulatory service offerings back into these medical practices.
Today, athenaCoordinator serves over 90 client facilities ranging from small rural hospitals to large academic medical centers and health systems. Over time, we plan to evolve and expand the service to include other health care entities, such as independent labs, pharmacies, durable medical equipment companies, ambulance services, and more. The favorable opinion from the OIG enabling transaction-based pricing for the exchange of health information paves the way for this expansion. The OIG Advisory Opinion also knocks down another barrier to athenahealth’s creation of a health information backbone. It clears the way for new, innovative pricing structures that charge receivers for the successful exchange of health information data.
8
In summary, athenaCoordinator builds the foundation for improved care coordination across the health care supply chain and opens up new growth opportunities for athenahealth in both the ambulatory and in-patient markets. The launch of athenaCoordinator combined with the favorable OIG Advisory Opinion places athenahealth at the forefront of developing a sustainable, profitable model for health information exchange.
Anodyne Analytics Service Offering
Anodyne Analytics is our cloud-based business intelligence service for health care professionals. The service has been generally available since 2004 through Anodyne Health Partners, Inc., which athenahealth acquired in October of 2009. Anodyne Analytics is being integrated with athenahealth’s other service offerings and can be adopted as a stand-alone service.
Anodyne product development remains focused on delivering an expert resource to decision-makers at large medical groups and health systems, as well as providing a powerful return on investment. Use of Anodyne Analytics continues to grow, and, as with our other service offerings, we are focused on product enhancements and automation to drive gross margin improvements. As mentioned during the investor summit on December 15, 2011, Anodyne Analytics gross margins are currently below the corporate average, and there are several programs in place to make the Anodyne Analytics offering more scalable and profitable. With this goal in mind, one critical milestone completed in 2011 was the full integration of Anodyne with athenaCollector. The 2012 product roadmap includes delivering a complete and seamless integration with athenaClinicals, expanding analytical functionality to support different payment models, and adding predictive analytics that will proactively illuminate problems in the practice. Anodyne will be prominently featured at the athenahealth 2012 User Conference in April 2012.
Revenue Discussion
Our total revenue of $92.5 million in Q4 2011 grew by 33% (or $23.1 million) over Q4 2010. Our total revenue of $324.1 million for FY 2011 grew by 32% (or $78.5 million) over FY 2010. Our revenue growth is primarily driven by athenaCollector client base expansion and growth in our athenaClinicals and athenaCommunicator services.
In terms of trends in our recurring revenue base, same-store analysis of claims created—a proxy for physician office utilization—indicates that physician office activity in Q4 2011 increased modestly over physician office activity during Q4 2010.
Client Base Discussion
The total number of physicians who have gone live on athenaCollector, our core service offering, is the metric we use to define our client base and market share. Annual growth in total revenue continues to outpace growth in our physician base. We believe that this trend will continue as athenaClinicals and athenaCommunicator are included in a growing portion of new deals and as adoption of these services spreads across our existing client base.
During Q4 2011, 73% of all new athenaCollector deals included athenaClinicals, and 44% of all new athenaCollector deals included both athenaCommunicator and athenaClinicals, up from 58% and 17%, respectively, during Q4 2010. Among “live” (i.e., implemented and active) clients, adoption of athenaClinicals and athenaCommunicator continues to grow rapidly and resulted in continued growth to our installed base across all of our service offerings.
9
athenahealth Service Offering Adoption
athenaCollector Clients
During Q4 2011, total active physicians on athenaCollector grew by 21% year-over-year to 23,210. On a sequential basis, we added 733 net new active physicians on athenaCollector versus 624 in Q4 2010. Our quarterly net new physician additions may vary widely due to the number and size of clients that go live in a particular quarter. During FY 2011, we added 4,013 net new active physicians on athenaCollector versus 3,478 in FY 2010.
athenaClinicals Clients
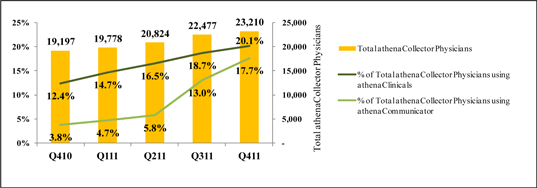
We continue to experience rapid growth in client adoption of athenaClinicals. Total active physicians live on athenaClinicals grew by 96% year-over-year to 4,662. On a sequential basis, we added 460 net new active physicians on athenaClinicals versus 391 in Q4 2010. This equates to an overall adoption rate of 20% of total athenaCollector physicians, up from 12% in Q4 2010. During FY 2011, we added 2,279 net new active physicians on athenaClinicals versus 1,463 in FY 2010. We expect the athenaClinicals client base to increase significantly over time due to cross-selling within our existing base and growth in the volume of combined deals.
athenaCommunicator Clients
Our athenaCommunicator client base is also growing rapidly. Total active physicians live on athenaCommunicator grew by an impressive 457% year-over-year to 4,098. On a sequential basis, we added 1,167 net new active physicians on athenaCommunicator versus 111 in Q4 2010. This equates to an overall adoption rate of 18% of total athenaCollector physicians, up from 4% in Q4 2010. During FY 2011, we added 3,362 net new active physicians on athenaCommunicator versus 736 in FY 2010, the year we launched the service offering. We expect the athenaCommunicator client base to increase significantly over time due to cross-selling within our existing base and growth in the volume of combined deals.
New Deals
On November 18, 2011, we announced that OhioHealth, an enterprise athenaCollector client, selected athenaCommunicator for its employed physician organization. OhioHealth is a family of not-for-profit hospitals and health care organizations consisting of more than 900 physicians serving patients throughout a 40-county area in Ohio since 1891. The implementation of athenaCommunicator was completed in Q3 2011.
We also sold three new enterprise deals in December 2011. Due to confidentiality reasons, we are not able to release any details regarding these new deals at this time.
10
Client Implementations
In terms of our publicly disclosed implementation pipeline as of December 31, 2011, the athenaCollector implementation at Summit Medical Group (~170 physicians; ~230 providers) was completed. We continue to progress on athenaCollector implementations at St. Vincent’s HealthCare (~120 physicians/providers) and Detroit Medical Center (DMC) (~125 physicians; ~400 Providers). The athenaClinicals implementations are ongoing at Steward Health Care System LLC (f/k/a Caritas Christi - ~375 physicians; ~500 providers) and nearly complete at Capella Healthcare (~90 physicians; ~130 providers), and are underway at Alexian Brothers Health System (~80 physicians; ~100 providers) and Harbin Clinic (~140 physicians; ~210 Providers). Finally, implementations of all three services are well underway at HealthStar Physicians (~40 physicians; ~60 Providers), and are largely complete at CHRISTUS Health (~150 physicians/providers). University Hospitals (UH) academic medical center, comprised of more than 1,000 medical providers (~850 physicians), is expected to go live on athenaCollector by means of a phased implementation throughout 2012.
Non-GAAP Adjusted Gross Margin Discussion
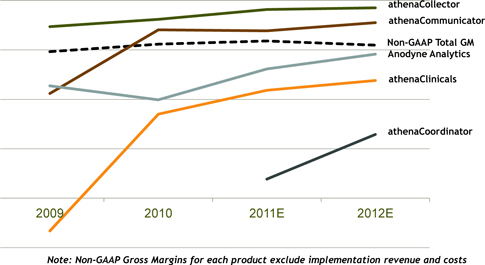
Our Non-GAAP Adjusted Gross Margin was 64.2% for Q4 2011, down 2.1 points from 66.3% in Q4 2010. It is important to note that Q4 2010 is a difficult comparison period as the Non-GAAP Adjusted Gross Margin results during that quarter were favorably impacted by hiring delays as well as an adjustment to our annual bonus calculation. In addition, Q4 2011 represented our first full quarter with the athenaCoordinator service offering, which compressed margin by approximately two points. Our Non-GAAP Adjusted Gross Margin was 63.8% for FY 2011, up from 62.4% in FY 2010. This year-over-year expansion was supported primarily by operating efficiencies within our athenaCollector service organization. In addition, we continued to reduce the cost of processing clinical documents by driving operational efficiencies within our athenaClinicals service organization and also improved the profitability of athenaCommunicator and Anodyne Analytics.
We presented the gross margin graph below at our 4th Annual Investor Summit held on December 15, 2011. While we do not report our gross margins by individual service offering, this graph illustrates a consistent track record of improving gross margins on a service-line basis. However, the expansion of our new service offerings, such as athenaCoordinator, will serve as a headwind to margin expansion until these newer services become more automated and scalable. Furthermore, we balance margin expansion with the desire to expand the capabilities of our existing service offerings, which can impact the margin of our core business in any given period.
11
Selling and Marketing Discussion
As an innovative, high growth company with a relatively small share of a very large market opportunity, our business model is still very new to health care, and market awareness remains our biggest challenge. To improve awareness, we remain focused on expanding and enhancing our selling and marketing activities. These activities incur both fixed and variable costs, as they range from investment in personnel and infrastructure to spending on new advertising campaigns and paid search terms. We continue to experiment with and expand upon our awareness-building efforts as quickly as we deem them to be effective. The productivity of these investments is largely measured over the long term, particularly as it may take six to nine months of implementation before new clients fully contribute to revenue and join the ranks of our active client base.
Selling Update
The athenahealth sales organization includes all quota-carrying sales representatives as well as our sales team leaders, channel sales team, and sales training and development organization.
As of December 31, 2011, we have a total of 99 quota-carrying sales representatives, up 29% from 77 quota-carrying sales representatives on December 31, 2010. Of the 22 quota-carrying sales representatives we added during FY 2011, 19 are in the small and group practice segments, where the majority of U.S. ambulatory physicians practice medicine.
Beyond this core quota-carrying sales force, we are also leveraging the Anodyne quota-carrying sales team, the athenaCoordinator team’s resources, and the channel partner teams in order to drive sales growth. In addition to expanding our service offerings, the Anodyne and Proxsys acquisitions provide us with access to more than 25,000 ambulatory providers. Cross-sell activity into the Anodyne base continued to increase during 2011 and will remain an important sales channel in 2012. Cross-sell activity into the Proxsys network has continued to progress post-acquisition. We are utilizing our market intelligence and leveraging the relationships with existing athenaCoordinator clients and their ordering provider base to help launch our “Coordinate” strategy in 2012.
In early 2012, we aligned all sales and channel partner teams into three regions and six territories to facilitate tighter coordination in targeting and winning care coordination communities from the enterprise space down to the smaller physician practices. We believe that this sales alignment, coupled with the dramatic expansion of the regional flywheel and awareness lead-generation marketing programs, will improve the productivity of our overall geographic attack strategy and drive adoption across all of our service offerings. As part of this coordinate strategy, we also introduced, at our annual sales meeting earlier this month, new pricing for athenaOneSM and athenaClinicals to include a $1 care coordination transaction fee. This is an important first step in creating a market for health information exchange. athenaOne is our new integrated pricing program that combines athenaCollector and athenaClinicals with order-based pricing and athenaCommunicator.
Marketing Update
The athenahealth marketing organization encompasses our growth and sales operations, event and partner marketing, inside sales agents (ISAs), advertising, corporate communications, and product marketing teams. This organization executes in-market investments in an effort to generate new business opportunities for athenahealth.
Leveraging our strong top line growth and profitability during the first half of 2011, we continued to invest aggressively in marketing initiatives during Q4 2011. Awareness-building and lead generation activities were the primary points of focus for the marketing team. In particular, online marketing (paid search as well as social media and online advertising), regional flywheels (which involve geographically targeted marketing and dinner seminars) and partner marketing and training initiatives are among the
12
most impactful sources of new leads. These incremental investments paid off with increased awareness, loading of the sales pipeline, and a strong finish to bookings at year-end across all sales segments. Notably, athenahealth’s national physician awareness increased from 21% in 2010 to 29% in 2011 and awareness in the focused flywheel markets was even higher at 35%. As we look forward to 2012 and beyond, our marketing investment strategy remains both short-term focused on lead and meeting generation and long-term focused on awareness, education, and service offering differentiation in order to continue our 30% growth trajectory goals.
Balance Sheet and Cash Flow Highlights
Our cash, cash equivalents, and available-for-sale investments totaled $138.5 million at December 31, 2011. The Company does not have any outstanding debt obligations. Operating cash flow was $21.5 million in Q4 2011, up 11% from $19.4 million in Q4 2010. Operating cash flow was $60.8 million in FY 2011, up 36% from $44.7 million in FY 2010. Our capital expenditures, including capitalized software development, were $9.8 million (or 10.6% of total revenue) in Q4 2011 and $24.5 million (or 7.6% of total revenue) in FY 2011.
Fiscal Year 2012 Outlook
athenahealth is not making any changes to the outlook presented at the Company’s 4th Annual Investor Summit on December 15, 2011. While athenahealth does not provide quarterly guidance, it is important to note that each first quarter (ending March 31st) is characterized by higher expense levels and weaker collections activity following the holiday season. More specifically, the reset of FICA payroll taxes, bonus and vacation accruals, and sales and marketing events, such as the Healthcare Information and Management Systems Society (HIMSS) Annual Conference and our Annual Sales Meeting, contribute to higher expense levels. In addition, discretionary use of physician services declines during the holiday season, which leads to a decline in collections by our physician clients approximately 38 days later.
Closing Remarks
athenahealth once again met with success in 2011 as a leading disruptive innovator in health care. We gained credibility with our client base with the launch of our MU dashboard and received recognition for our service offerings with high rankings from KLAS. With the acquisition of Proxsys LLC, we launched our fifth service offering with athenaCoordinator and are now recognized as a multi-service company supporting a wide array of medical care givers and receivers. Looking forward to 2012, we are uniquely positioned to capitalize on a two-sided market and will continue to monitor and measure our success against our execution strategies.
13
Stock-Based Compensation Expense, Summary of Cash Balance and Reconciliation of Non-GAAP Financial Measures
athenahealth, Inc.
STOCK-BASED COMPENSATION EXPENSE
(Unaudited, in thousands)
Set forth below is a breakout of stock-based compensation expense for the three and twelve months ended December 31, 2011 and 2010:
| Three months ended December 31, | Twelve months ended December 31, | |||||||||||||||
| Stock-based compensation expense charged to: | 2011 | 2010 | 2011 | 2010 | ||||||||||||
| Direct operating |
$ | 948 | $ | 577 | $ | 3,173 | $ | 2,298 | ||||||||
| Selling and marketing |
1,721 | 969 | 5,645 | 3,509 | ||||||||||||
| Research and development |
815 | 542 | 2,311 | 2,014 | ||||||||||||
| General and administrative |
2,385 | 1,934 | 7,772 | 6,656 | ||||||||||||
|
|
|
|
|
|
|
|
|
|||||||||
| Total |
$ | 5,869 | $ | 4,022 | $ | 18,901 | $ | 14,477 | ||||||||
|
|
|
|
|
|
|
|
|
|||||||||
athenahealth, Inc.
CASH, CASH EQUIVALENTS, AND AVAILABLE-FOR-SALE INVESTMENTS
(Unaudited, in thousands)
Set forth below is a breakout of total cash, cash equivalents, and available-for-sale investments as of December 31, 2011 and 2010:
| December 31, 2011 |
December 31, 2010 |
|||||||
| Cash, cash equivalents |
$ | 57,781 | $ | 35,944 | ||||
| Short-term investments |
62,084 | 80,231 | ||||||
| Long-term investments* |
18,619 | 5,592 | ||||||
|
|
|
|
|
|||||
| Total |
$ | 138,484 | $ | 121,767 | ||||
|
|
|
|
|
|||||
| * | In 2010, the Company began purchasing certain available-for-sale investments that had a maturity date longer than one-year, which it classifies in investments and other assets on the consolidated balance sheet. |
14
athenahealth, Inc.
RECONCILIATION OF NON-GAAP FINANCIAL MEASURES
TO COMPARABLE GAAP MEASURES
(Unaudited, in thousands, except per share amounts)
The following is a reconciliation of the non-GAAP financial measures used by the Company to describe the Company’s financial results determined in accordance with accounting principles generally accepted in the United States of America (GAAP). An explanation of these measures is also included below under the heading “Explanation of Non-GAAP Financial Measures.”
While management believes that these non-GAAP financial measures provide useful supplemental information to investors regarding the underlying performance of the Company’s business operations, investors are reminded to consider these non-GAAP measures in addition to, and not as a substitute for, financial performance measures prepared in accordance with GAAP. In addition, it should be noted that these non-GAAP financial measures may be different from non-GAAP measures used by other companies, and management may utilize other measures to illustrate performance in the future. Non-GAAP measures have limitations in that they do not reflect all of the amounts associated with the Company’s results of operations as determined in accordance with GAAP.
Please note that these figures may not sum exactly due to rounding.
Non-GAAP Adjusted Gross Margin
Set forth below is a presentation of the Company’s “Non-GAAP Adjusted Gross Profit” and “Non-GAAP Adjusted Gross Margin,” which represents Non-GAAP Adjusted Gross Profit as a percentage of total revenue.
| (unaudited, in thousands) | Three Months Ended December 31 |
Twelve Months Ended December 31 |
||||||||||||||
| 2011 | 2010 | 2011 | 2010 | |||||||||||||
| Total revenue |
$ | 92,512 | $ | 69,366 | $ | 324,067 | $ | 245,538 | ||||||||
| Direct operating expense |
34,810 | 24,419 | 122,795 | 96,582 | ||||||||||||
|
|
|
|
|
|
|
|
|
|||||||||
| Total revenue less direct operating expense |
57,702 | 44,947 | 201,272 | 148,956 | ||||||||||||
| Add: Stock-based compensation expense allocated to direct operating expense |
948 | 577 | 3,173 | 2,298 | ||||||||||||
| Add: Amortization of purchased intangibles |
761 | 460 | 2,230 | 1,840 | ||||||||||||
|
|
|
|
|
|
|
|
|
|||||||||
| Non-GAAP Adjusted Gross Profit |
$ | 59,411 | $ | 45,984 | $ | 206,675 | $ | 153,094 | ||||||||
|
|
|
|
|
|
|
|
|
|||||||||
| Non-GAAP Adjusted Gross Margin |
64.2 | % | 66.3 | % | 63.8 | % | 62.4 | % | ||||||||
15
Non-GAAP Adjusted EBITDA
Set forth below is a reconciliation of the Company’s “Non-GAAP Adjusted EBITDA” and “Non-GAAP Adjusted EBITDA Margin,” which represents Non-GAAP Adjusted EBITDA as a percentage of total revenue.
| (unaudited, in thousands) | Three Months Ended December 31 |
Twelve Months Ended December 31 |
||||||||||||||
| 2011 | 2010 | 2011 | 2010 | |||||||||||||
| Total revenue |
$ | 92,512 | $ | 69,366 | $ | 324,067 | $ | 245,538 | ||||||||
| GAAP net income |
5,329 | 7,303 | 19,046 | 12,704 | ||||||||||||
| Add: Provision for income taxes |
3,999 | 5,330 | 13,834 | 10,396 | ||||||||||||
| Add: Total other (income) expense |
(49 | ) | (100 | ) | (147 | ) | 497 | |||||||||
| Add: Stock-based compensation expense |
5,869 | 4,022 | 18,901 | 14,477 | ||||||||||||
| Add: Depreciation and amortization |
4,826 | 3,171 | 16,710 | 11,117 | ||||||||||||
| Add: Amortization of purchased intangibles |
761 | 460 | 2,230 | 1,840 | ||||||||||||
|
|
|
|
|
|
|
|
|
|||||||||
| Non-GAAP Adjusted EBITDA |
$ | 20,735 | $ | 20,186 | $ | 70,574 | $ | 51,031 | ||||||||
|
|
|
|
|
|
|
|
|
|||||||||
| Non-GAAP Adjusted EBITDA Margin |
22.4 | % | 29.1 | % | 21.8 | % | 20.8 | % | ||||||||
Non-GAAP Adjusted Operating Income
Set forth below is a reconciliation of the Company’s “Non-GAAP Adjusted Operating Income” and “Non-GAAP Adjusted Operating Income Margin,” which represents Non-GAAP Adjusted Operating Income as a percentage of total revenue.
| (unaudited, in thousands) | Three Months Ended December 31 |
Twelve Months Ended December 31 |
||||||||||||||
| 2011 | 2010 | 2011 | 2010 | |||||||||||||
| Total revenue |
$ | 92,512 | $ | 69,366 | $ | 324,067 | $ | 245,238 | ||||||||
| GAAP net income |
5,329 | 7,303 | 19,046 | 12,704 | ||||||||||||
| Add: Provision for income taxes |
3,999 | 5,330 | 13,834 | 10,396 | ||||||||||||
| Add: Total other (income) expense |
(49 | ) | (100 | ) | (147 | ) | 497 | |||||||||
| Add: Stock-based compensation expense |
5,869 | 4,022 | 18,901 | 14,477 | ||||||||||||
| Add: Amortization of purchased intangibles |
761 | 460 | 2,230 | 1,840 | ||||||||||||
|
|
|
|
|
|
|
|
|
|||||||||
| Non-GAAP Adjusted Operating Income |
$ | 15,909 | $ | 17,015 | $ | 53,864 | $ | 39,914 | ||||||||
|
|
|
|
|
|
|
|
|
|||||||||
| Non-GAAP Adjusted Operating Income Margin |
17.2 | % | 24.5 | % | 16.6 | % | 16.3 | % | ||||||||
16
Non-GAAP Adjusted Net Income
Set forth below is a reconciliation of the Company’s “Non-GAAP Adjusted Net Income” and “Non-GAAP Adjusted Net Income per Diluted Share.”
| (unaudited, in thousands except per share amounts) | Three Months Ended December 31 |
Twelve Months Ended December 31 |
||||||||||||||
| 2011 | 2010 | 2011 | 2010 | |||||||||||||
| GAAP net income |
$ | 5,329 | $ | 7,303 | $ | 19,046 | $ | 12,704 | ||||||||
| Add: (Gain) loss on interest rate derivative contract |
— | (276 | ) | 73 | 199 | |||||||||||
| Add: Stock-based compensation expense |
5,869 | 4,022 | 18,901 | 14,477 | ||||||||||||
| Add: Amortization of purchased intangibles |
761 | 460 | 2,230 | 1,840 | ||||||||||||
|
|
|
|
|
|
|
|
|
|||||||||
| Sub-total of tax deductible items |
6,630 | 4,206 | 21,204 | 16,516 | ||||||||||||
| (Less): Tax impact of tax deductible items (1) |
(2,652 | ) | (1,682 | ) | (8,482 | ) | (6,606 | ) | ||||||||
|
|
|
|
|
|
|
|
|
|||||||||
| Non-GAAP Adjusted Net Income |
$ | 9,307 | $ | 9,827 | $ | 31,768 | $ | 22,614 | ||||||||
|
|
|
|
|
|
|
|
|
|||||||||
| Weighted average shares - diluted |
36,492 | 35,278 | 36,050 | 35,204 | ||||||||||||
| Non-GAAP Adjusted Net Income per Diluted Share |
$ | 0.26 | $ | 0.28 | $ | 0.88 | $ | 0.64 | ||||||||
| (1) | - Tax impact calculated using a statutory tax rate of 40% |
| (unaudited, in thousands except per share amounts) | Three Months Ended December 31 |
Twelve Months Ended December 31 |
||||||||||||||
| 2011 | 2010 | 2011 | 2010 | |||||||||||||
| GAAP net income per share - diluted |
$ | 0.15 | $ | 0.21 | $ | 0.53 | $ | 0.36 | ||||||||
| Add: (Gain) loss on interest rate derivative contract |
— | (0.01 | ) | 0.00 | 0.01 | |||||||||||
| Add: Stock-based compensation expense |
0.16 | 0.12 | 0.52 | 0.41 | ||||||||||||
| Add: Amortization of purchased intangibles |
0.02 | 0.01 | 0.06 | 0.05 | ||||||||||||
|
|
|
|
|
|
|
|
|
|||||||||
| Sub-total of tax deductible items |
0.18 | 0.12 | 0.59 | 0.47 | ||||||||||||
| (Less): Tax impact of tax deductible items (1) |
(0.07 | ) | (0.05 | ) | (0.24 | ) | (0.19 | ) | ||||||||
|
|
|
|
|
|
|
|
|
|||||||||
| Non-GAAP Adjusted Net Income per Diluted Share |
$ | 0.26 | $ | 0.28 | $ | 0.88 | $ | 0.64 | ||||||||
|
|
|
|
|
|
|
|
|
|||||||||
| Weighted average shares - diluted |
36,492 | 35,278 | 36,050 | 35,204 | ||||||||||||
| (1) | - Tax impact calculated using a statutory tax rate of 40% |
17
Explanation of Non-GAAP Financial Measures
The Company reports its financial results in accordance with accounting principles generally accepted in the United States of America, or GAAP. However, management believes that, in order to properly understand the Company’s short-term and long-term financial and operational trends, investors may wish to consider the impact of certain non-cash or non-recurring items, when used as a supplement to financial performance measures in accordance with GAAP. These items result from facts and circumstances that vary in frequency and impact on continuing operations. Management also uses results of operations before such items to evaluate the operating performance of the Company and compare it against past periods, make operating decisions, and serve as a basis for strategic planning. These non-GAAP financial measures provide management with additional means to understand and evaluate the operating results and trends in the Company’s ongoing business by eliminating certain non-cash expenses and other items that management believes might otherwise make comparisons of the Company’s ongoing business with prior periods more difficult, obscure trends in ongoing operations, or reduce management’s ability to make useful forecasts. Management believes that these non-GAAP financial measures provide additional means of evaluating period-over-period operating performance. In addition, management understands that some investors and financial analysts find this information helpful in analyzing the Company’s financial and operational performance and comparing this performance to its peers and competitors.
Management defines “Non-GAAP Adjusted Gross Profit” as total revenue, less direct operating expense, plus (1) stock-based compensation expense allocated to direct operating expense and (2) amortization of purchased intangibles, and “Non-GAAP Adjusted Gross Margin” as Non-GAAP Adjusted Gross Profit as a percentage of total revenue. Management considers these non-GAAP financial measures to be important indicators of the Company’s operational strength and performance of its business and a good measure of its historical operating trends. Moreover, management believes that these measures enable investors and financial analysts to closely monitor and understand changes in the Company’s ability to generate income from ongoing business operations.
Management defines “Non-GAAP Adjusted EBITDA” as the sum of GAAP net income before provision for income taxes, total other (income) expense, stock-based compensation expense, depreciation and amortization, and amortization of purchased intangibles and “Non-GAAP Adjusted EBITDA Margin” as Non-GAAP Adjusted EBITDA as a percentage of total revenue. Management defines “Non-GAAP Adjusted Operating Income” as the sum of GAAP net income before provision for income taxes, total other (income) expense, stock-based compensation expense, and amortization of purchased intangibles, and “Non-GAAP Adjusted Operating Income Margin” as Non-GAAP Adjusted Operating Income as a percentage of total revenue. Management defines “Non-GAAP Adjusted Net Income” as the sum of GAAP net income before (gain) loss on interest rate derivative contract, stock-based compensation expense, amortization of purchased intangibles, and any tax impact related to these items, and “Non-GAAP Adjusted Net Income per Diluted Share” as Non-GAAP Adjusted Net Income divided by weighted average diluted shares outstanding. Management considers all of these non-GAAP financial measures to be important indicators of the Company’s operational strength and performance of its business and a good measure of its historical operating trends, in particular the extent to which ongoing operations impact the Company’s overall financial performance.
Management excludes each of the items identified below from the applicable non-GAAP financial measure referenced above for the reasons set forth with respect to that excluded item:
| • | Stock-based compensation expense — excluded because these are non-cash expenses that management does not consider part of ongoing operating results when assessing the performance of the Company’s business, and also because the total amount of expense is partially outside of the Company’s control because it is based on factors such as stock price, volatility and interest rates, which may be unrelated to the Company’s performance during the period in which the expense is incurred. |
18
| • | Amortization of purchased intangibles — purchased intangibles are amortized over their estimated useful life and generally cannot be changed or influenced by management after the acquisition. Accordingly, this item is not considered by management in making operating decisions. Thus, including such charge does not accurately reflect the performance of the Company’s ongoing operations for the period in which such charge is incurred. |
| • | Gains and losses on interest rate derivative contract — excluded because, until they are realized, to the extent these gains or losses impact a period presented, management does not believe that they reflect the underlying performance of ongoing business operations for such period. |
19
Supplemental Metrics and Definitions

Supplemental Metrics (unaudited)
Last Updated: December 31, 2011
| Fiscal Year 2010 | Fiscal Year 2011 | |||||||||||||||||||||||||||||||
| Q1 | Q2 | Q3 | Q4 | Q1 | Q2 | Q3 | Q4 | |||||||||||||||||||||||||
| Client Base |
||||||||||||||||||||||||||||||||
| Total Physicians on athenaCollector |
16,369 | 17,136 | 18,573 | 19,197 | 19,778 | 20,824 | 22,477 | 23,210 | ||||||||||||||||||||||||
| Total Providers on athenaCollector |
23,978 | 24,782 | 26,317 | 27,114 | 27,944 | 29,482 | 31,675 | 32,740 | ||||||||||||||||||||||||
| Total Physicians on athenaClinicals |
1,275 | 1,548 | 1,992 | 2,383 | 2,910 | 3,444 | 4,202 | 4,662 | ||||||||||||||||||||||||
| Total Providers on athenaClinicals |
1,867 | 2,256 | 2,818 | 3,348 | 4,161 | 4,848 | 5,849 | 6,525 | ||||||||||||||||||||||||
| Total Physicians on athenaCommunicator |
348 | 442 | 625 | 736 | 934 | 1,198 | 2,931 | 4,098 | ||||||||||||||||||||||||
| Total Providers on athenaCommunicator |
513 | 689 | 946 | 1,213 | 1,564 | 1,936 | 4,117 | 5,830 | ||||||||||||||||||||||||
| Client Performance |
||||||||||||||||||||||||||||||||
| Client Satisfaction |
86.6 | % | 86.1 | % | 85.7 | % | 87.6 | % | 86.2 | % | 85.9 | % | 85.6 | % | 87.3 | % | ||||||||||||||||
| Client Days in Accounts Receivable (DAR) |
40.0 | 38.8 | 38.8 | 38.8 | 41.0 | 39.1 | 39.7 | 38.9 | ||||||||||||||||||||||||
| First Pass Resolution (FPR) Rate |
93.1 | % | 93.4 | % | 94.2 | % | 94.4 | % | 94.1 | % | 93.4 | % | 93.8 | % | 93.7 | % | ||||||||||||||||
| Electronic Remittance Advice (ERA) Rate |
68.9 | % | 68.8 | % | 72.1 | % | 75.8 | % | 74.6 | % | 76.7 | % | 78.3 | % | 77.9 | % | ||||||||||||||||
| Total Claims Submitted |
11,175,099 | 11,312,806 | 11,837,095 | 13,075,933 | 13,651,586 | 14,361,876 | 14,854,109 | 16,368,172 | ||||||||||||||||||||||||
| Total Client Collections |
$ | 1,305,959,405 | $ | 1,421,347,731 | $ | 1,523,925,644 | $ | 1,613,043,890 | $ | 1,608,313,685 | $ | 1,811,067,978 | $ | 1,866,806,003 | $ | 1,990,373,883 | ||||||||||||||||
| Total Working Days |
61 | 64 | 64 | 61 | 62 | 64 | 64 | 61 | ||||||||||||||||||||||||
| Employees |
||||||||||||||||||||||||||||||||
| Direct |
630 | 675 | 690 | 691 | 719 | 771 | 1036 | 1068 | ||||||||||||||||||||||||
| Sales & Marketing |
157 | 168 | 186 | 199 | 217 | 236 | 247 | 276 | ||||||||||||||||||||||||
| Research & Development |
172 | 187 | 197 | 211 | 216 | 236 | 263 | 277 | ||||||||||||||||||||||||
| General & Administrative |
130 | 136 | 140 | 141 | 144 | 151 | 168 | 174 | ||||||||||||||||||||||||
| Total Employees |
1,087 | 1,166 | 1,212 | 1,241 | 1,296 | 1,393 | 1,713 | 1,795 | ||||||||||||||||||||||||
| Quota Carrying Sales Force |
||||||||||||||||||||||||||||||||
| Small Practice |
25 | 27 | 34 | 38 | 38 | 39 | 40 | 49 | ||||||||||||||||||||||||
| Group Practice |
20 | 23 | 22 | 25 | 26 | 29 | 28 | 33 | ||||||||||||||||||||||||
| Enterprise Segment |
5 | 6 | 7 | 7 | 7 | 8 | 8 | 10 | ||||||||||||||||||||||||
| Cross-Sell |
5 | 6 | 7 | 7 | 7 | 7 | 7 | 7 | ||||||||||||||||||||||||
| Total Quota Carrying Sales Representatives |
55 | 62 | 70 | 77 | 78 | 83 | 83 | 99 | ||||||||||||||||||||||||
20
Supplemental Metrics Definitions
| Client Base | ||
| Total Physicians on athenaCollector |
The number of physicians that have rendered a service which generated a medical claim that was billed during the last 91 days on the athenaCollector platform. Examples of physicians include Medical Doctors (MD) and Doctor of Osteopathic Medicine (DO). | |
| Total Providers on athenaCollector |
The number of providers, including physicians, that have rendered a service which generated a medical claim that was billed during the last 91 days on the athenaCollector platform. Examples of non-physician providers are Nurse Practitioners (NP) and Registered Nurses (RN). | |
| Total Physicians on athenaClinicals |
The number of physicians that have rendered a service through the athenaClinicals platform which generated a medical claim that was billed during the last 91 days on the athenaCollector platform. Examples of physicians include Medical Doctors (MD) and Doctor of Osteopathic Medicine (DO). | |
| Total Providers on athenaClinicals |
The number of providers, including physicians, that have rendered a service through the athenaClinicals platform which generated a medical claim that was billed during the last 91 days on the athenaCollector platform. Examples of non-physicians are Nurse Practitioners (NP) and Registered Nurses (RN). | |
| Total Physicians on athenaCommunicator |
The number of physicians that have rendered a service which generated a medical claim that was billed during the last 91 days on the athenaCollector platform and whose practice is actively using athenaCommunicator. | |
| Total Providers on athenaCommunicator |
The number of providers, including physicians, that have rendered a service which generated a medical claim that was billed during the last 91 days on the athenaCollector platform and whose practice is actively using athenaCommunicator. | |
| Client Performance | ||
| Client Satisfaction |
The percentage of athenaCollector clients who chose 4 or 5 on a scale of 1 to 5 when asked if they would recommend athenahealth to a trusted friend or colleague. These responses are generated from a “client listening” survey that the company conducts for two segments of its client base twice per year. | |
| Client Days in Accounts Receivable (DAR) |
The average number of days that it takes outstanding balances on claims to be resolved, e.g. paid, for clients on athenaCollector. Clients that have been live less than 90 days are excluded, as well as clients who are terminating services. | |
| First Pass Resolution (FPR) Rate |
Approximates the percentage of primary claims that are favorably adjudicated and closed after a single submission during the period. Currently, the FPR rate is calculated on a monthly basis, and certain practices are excluded (e.g. those that have been live for less than 90 days). | |
| Electronic Remittance Advice (ERA) Rate |
Remittance refers to the information about payments (a/k/a explanations of benefits) received from insurance companies during the period. The ERA rate reflects the percentage of total charges that were posted using electronic remittance. | |
| Total Claims Submitted |
The number of claims billed through athenaNet during the period. | |
| Total Client Collections |
The dollar value of collections posted on behalf of clients during the period. | |
| Total Working Days |
The total number of days during the quarter minus weekends and U.S. Post Office holidays. | |
| Employees | ||
| Direct |
The total number of full time equivalent individuals (FTEs) employed by the Company to support its service operations as of quarter end. This team includes production systems, enrollment services, paper claim submission, claim resolution, clinical operations, professional services, account management, and client services. | |
| Sales & Marketing |
The total number of FTEs employed by the Company to support its sales and marketing efforts as of quarter end. This team includes sales representatives, business development staff and the marketing team. | |
| Research & Development |
The total number of FTEs employed by the Company to support its research and development efforts as of quarter end. This team includes product development and product management. | |
| General & Administrative |
The total number of FTEs employed by the Company to support its general and administrative functions as of quarter end. This team includes finance, human resources, compliance, learning and development, internal audit, corporate technology, recruiting, facilities, and legal. | |
| Total Employees |
The total number of FTEs employed by the Company as of quarter end. This number excludes interns and seasonal employees. | |
| Quota-Carrying Sales Force | ||
| Small Practice |
Quota-carrying sales representatives assigned to bring in net new annual recurring revenue from the small practice segment (organizations with 1-3 physicians) as of quarter end. | |
| Group Practice |
Quota-carrying sales representatives assigned to bring in net new annual recurring revenue from the group practice segment (organizations with 4-150 physicians) as of quarter end. | |
| Enterprise Segment |
Quota-carrying sales representatives assigned to bring in net new annual recurring revenue from the enterprise market segment (organizations with150+ physicians) as of quarter end. | |
| Cross-Sell |
Quota-carrying sales representatives assigned to bring in net new annual recurring revenue from the sale of additional services to existing athenaCollector clients as of quarter end. | |
| Total Quota Carrying Sales Representatives |
The total number of sales representatives who carry quota for net new annual recurring revenue as of quarter end. | |
21