Attached files
| file | filename |
|---|---|
| 8-K - 8-K - ARCH RESOURCES, INC. | a12-3905_48k.htm |
Exhibit 99.1
|
|
Arch Coal Investor Presentation February 2012 |

|
|
Slide 2 This presentation contains “forward-looking statements” – that is, statements related to future, not past, events. In this context, forward-looking statements often address our expected future business and financial performance, and often contain words such as “expects,” “anticipates,” “intends,” “plans,” “believes,” “seeks,” or “will.” Forward-looking statements by their nature address matters that are, to different degrees, uncertain. For us, particular uncertainties arise from changes in the demand for our coal by the domestic electric generation industry; from legislation and regulations relating to the Clean Air Act and other environmental initiatives; from operational, geological, permit, labor and weather-related factors; from fluctuations in the amount of cash we generate from operations; from future integration of acquired businesses (including the ICG business); and from numerous other matters of national, regional and global scale, including those of a political, economic, business, competitive or regulatory nature. These uncertainties may cause our actual future results to be materially different than those expressed in our forward-looking statements. We do not undertake to update our forward-looking statements, whether as a result of new information, future events or otherwise, except as may be required by law. For a description of some of the risks and uncertainties that may affect our future results, you should see the risk factors described from time to time in the reports we file with the Securities and Exchange Commission. Forward-Looking Information |
|
|
Outlook for Coal Markets |

|
|
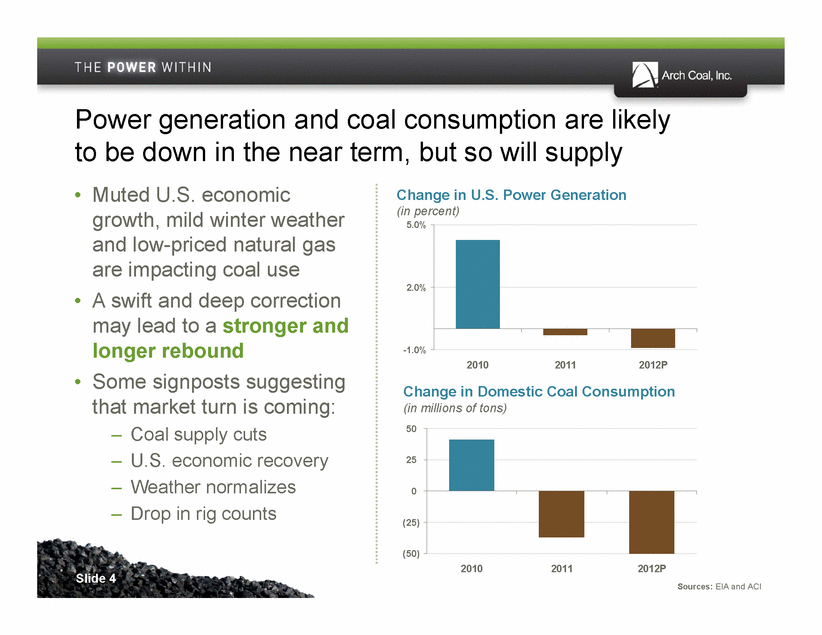
Power generation and coal consumption are likely to be down in the near term, but so will supply Slide 4 Change in Domestic Coal Consumption (in millions of tons) • Muted U.S. economic growth, mild winter weather and low-priced natural gas are impacting coal use • A swift and deep correction may lead to a stronger and longer rebound • Some signposts suggesting that market turn is coming: – Coal supply cuts – U.S. economic recovery – Weather normalizes – Drop in rig counts Change in U.S. Power Generation (in percent) -1.0% 2.0% 5.0% 2010 2011 2012P (50) (25) 0 25 50 2010 2011 2012P Sources: EIA and ACI |
|
|
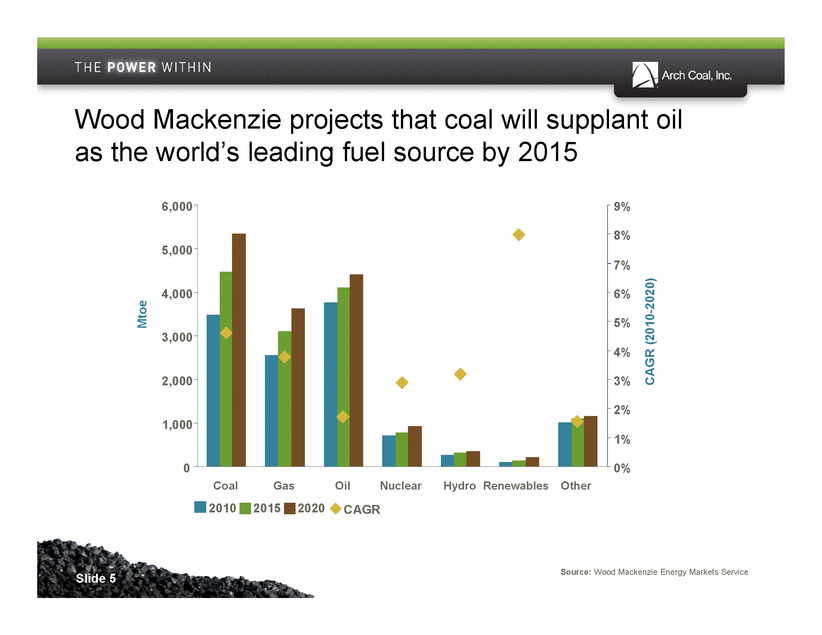
Wood Mackenzie projects that coal will supplant oil as the world’s leading fuel source by 2015 Slide 5 0 1,000 2,000 3,000 4,000 5,000 6,000 Coal Gas Oil Nuclear Hydro Renewables Other Mtoe 0% 1% 2% 3% 4% 5% 6% 7% 8% 9% CAGR (2010-2020) 2010 2015 2020 CAGR Source: Wood Mackenzie Energy Markets Service |
|
|
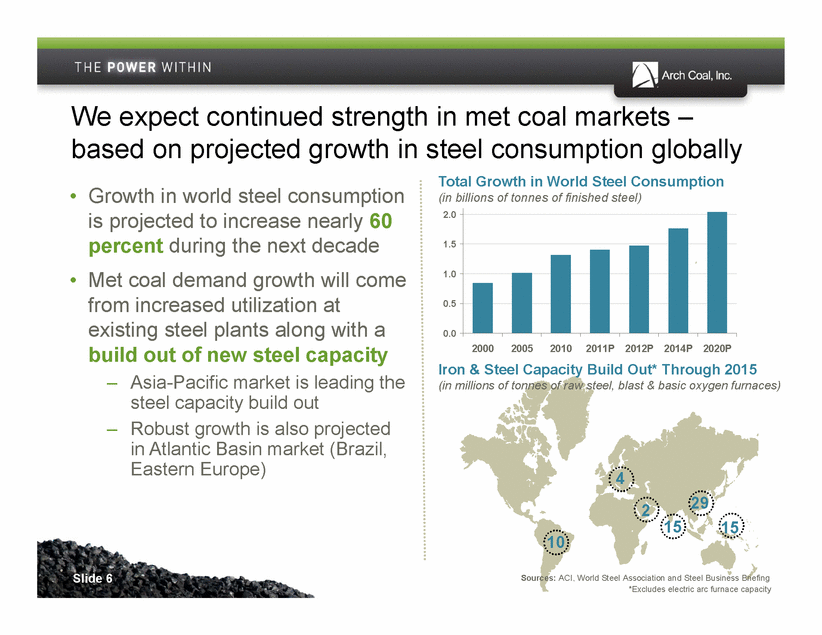
We expect continued strength in met coal markets – based on projected growth in steel consumption globally Slide 6 10 4 2 15 29 15 Total Growth in World Steel Consumption (in billions of tonnes of finished steel) 0.0 0.5 1.0 1.5 2.0 2000 2005 2010 2011P 2012P 2014P 2020P Iron & Steel Capacity Build Out* Through 2015 (in millions of tonnes of raw steel, blast & basic oxygen furnaces) Sources: ACI, World Steel Association and Steel Business Briefing *Excludes electric arc furnace capacity • Growth in world steel consumption is projected to increase nearly 60 percent during the next decade • Met coal demand growth will come from increased utilization at existing steel plants along with a build out of new steel capacity – Asia-Pacific market is leading the steel capacity build out – Robust growth is also projected in Atlantic Basin market (Brazil, Eastern Europe) |
|
|
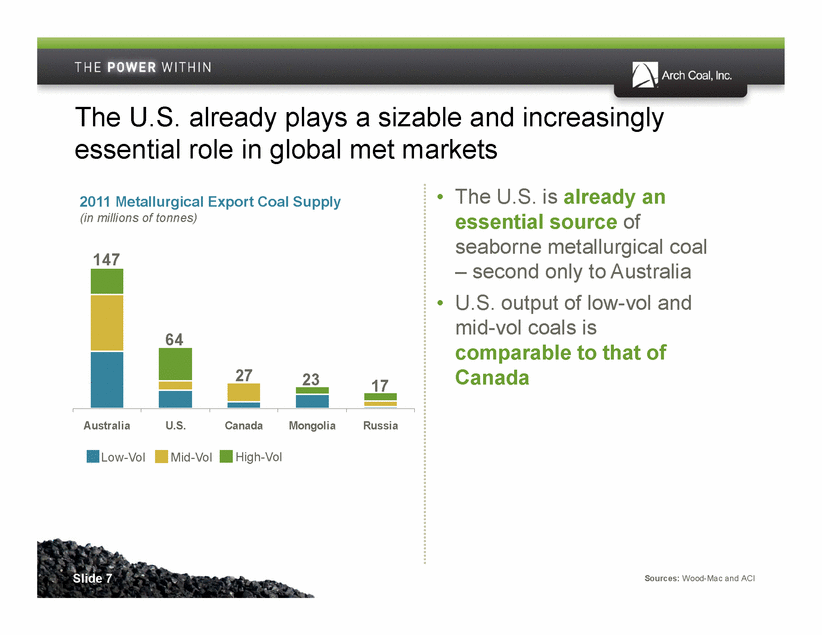
Australia U.S. Canada Mongolia Russia • The U.S. is already an essential source of seaborne metallurgical coal – second only to Australia • U.S. output of low-vol and mid-vol coals is comparable to that of Canada Sources: Wood-Mac and ACI The U.S. already plays a sizable and increasingly essential role in global met markets 2011 Metallurgical Export Coal Supply (in millions of tonnes) 147 64 27 23 17 Low-Vol Mid-Vol High-Vol Slide 7 |
|
|
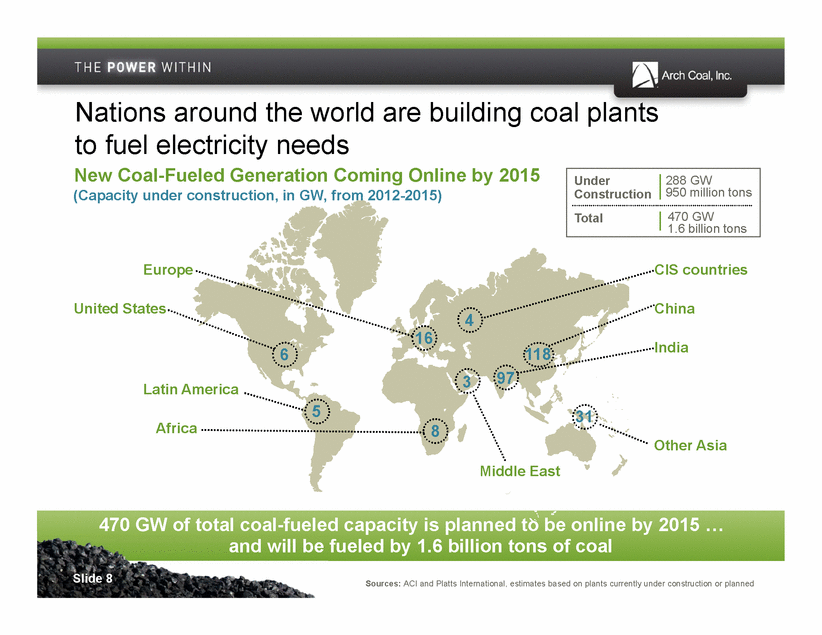
470 GW 1.6 billion tons Africa Europe Nations around the world are building coal plants to fuel electricity needs 470 GW of total coal-fueled capacity is planned to be online by 2015 and will be fueled by 1.6 billion tons of coal New Coal-Fueled Generation Coming Online by 2015 United States Middle East Latin America CIS countries China Other Asia India 16 8 3 6 5 97 31 118 4 (Capacity under construction, in GW, from 2012-2015) Sources: ACI and Platts International, estimates based on plants currently under construction or planned Under Construction 288 GW 950 million tons Total Slide 8 ... |
|
|
-100 -75 -50 -25 0 Growth in seaborne coal demand should outpace growth in seaborne coal supply over the next four years Projected Deficit in Seaborne Coal Supply Trade (in millions of metric tonnes) 2013P 2014P 2015P 2016P Slide 9 • We project growing coal consumption worldwide – and ongoing production and transportation constraints in traditional coal export nations • Internal forecasts suggest that global seaborne coal markets will be under-supplied through at least 2016 – Cumulative deficit of nearly 300 million short tons from 2013-2016 – Roughly 60 percent of projected deficit is in met coal markets; 40 percent relates to thermal coal Metallurgical coal Thermal coal |

|
|
Traditional supply sources are struggling to keep pace with demand, making U.S. coal increasingly competitive Slide 10 • Depleting own reserves at unprecedented (and accelerating) rate • Production is migrating further from population centers • Imported coal often offers significant quality and environmental advantages China Australia • New reserve areas have higher costs – and greater infrastructure needs • Demand continuously runs ahead of investment • Government, regulatory and community impediments are on rise Indonesia • Coal quality is declining and infrastructure is a huge challenge • Capital required to open new reserve areas is substantial • Growing domestic demand could ultimately constrain export growth • India faces quality, land use, environmental and infrastructure challenges • South Africa is increasingly mature and infrastructure needs are great • Russia faces reserve depletion in West and infrastructure needs in East • Mongolia and Mozambique have coal but no roads, rail, ports or miners Other Supply Regions Supply pressures |

|
|
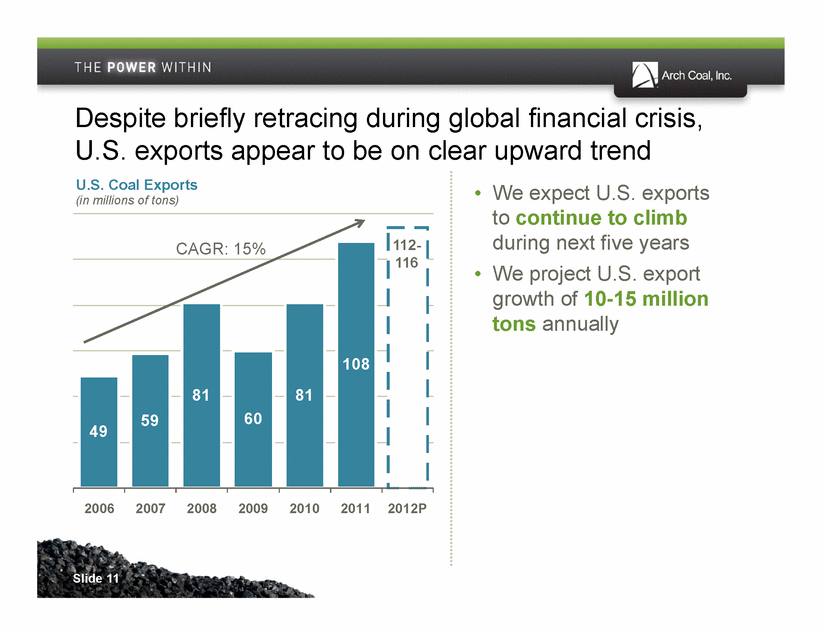
Despite briefly retracing during global financial crisis, U.S. exports appear to be on clear upward trend U.S. Coal Exports Slide 11 • We expect U.S. exports to continue to climb during next five years • We project U.S. export growth of 10-15 million tons annually 49 59 81 60 81 108 2006 2007 2008 2009 2010 2011 2012P (in millions of tons) 112- 116 CAGR: 15% |
|
|
Planned U.S. port expansions could support a more than doubling of coal exports by 2016 East Coast Capacity Port 2015P NS/Lamberts 32 DTA 20 CNX Marine 16 Pier IX 14 PA 9 CSX/Curtis Bay 9 East Coast 100 West Coast Capacity Port 2015P Ridley** 4 Westshore** 4 MBT 15 SSA Marine 15 Other Northwest 10 CA 2 West Coast 50 Gulf Capacity Midwest Capacity Port 2015P Great Lakes 8 Southeast Capacity Port 2015P Mobile 18 Other AL 5 Charleston 8 Southeast 31 2011A* 2016P 108 million tons 270 million tons Sources: ACI, NMA, Port Terminal Presentations * Includes overland shipments to Canada/Mexico 2010A* 81 million tons Slide 12 Projected Export Capacity ** Capacity available for U.S. sourced volumes Port 2015P IMT 17 United 11 Burnside 10 Convent 8 Mid-streaming 20 Gulf 66 Port 2015P Deepwater 10 Other Texas 5 Southwest 15 Southwest Capacity |

|
|
We expect U.S. coal to play an increasingly important role in the Pacific Basin in the coming decade Source: Wood Mackenzie Energy Market Service Slide 13 • Approximately 10 million tons of coal moved off the West Coast into Asia in 2011 • Most of that tonnage moved through Canada, but plans are underway to add U.S. throughput capacity • We expect West Coast exports to grow significantly over the next five years • Two major port projects – and several smaller ones – are in the permitting process • We believe the appetite for U.S. coal in Asia is immense U.S West Coast Port Potential Gray’s Harbor Cherry Point Longview Coos Bay Port of St. Helens Ridley Island Port of Morrow |

|
|
Slide 14 The New Arch Coal |
|
|
Leading Met Coal Supplier 1. 2nd largest U.S. (top 10 global) met producer Blending synergies will optimize met franchise Significant reserve expansion opportunities Growth Profile 2. Boost in reserves to become #2 U.S. coal reserve holder Met coal volumes to grow to 15 million tons by 2015 Build out of thermal platform in new basins and for export Market Leverage 3. Major producer in under-supplied met markets Growing player in robust seaborne thermal markets Levered to domestic thermal markets Most Diversified U.S. Producer 4. Operations in every major supply basin Strategically balanced met/thermal portfolio #1 or #2 position in core operating regions Low-Cost Operations 5. Low-cost mines in every major domestic supply basin Leader in safety and environmental performance Productive workforce with minimal legacy liabilities We’re building a U.S. coal industry powerhouse – and a world-class global and metallurgical coal franchise Compelling Valuation 6. Free cash flow generation Focused on reducing leverage Trough multiples and equity price Slide 15 |

|
|
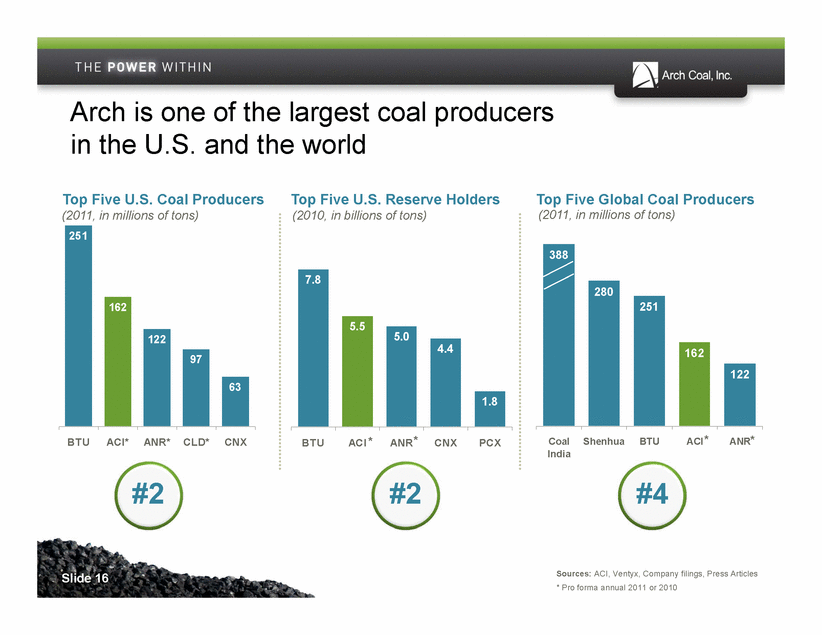
122 97 63 251 162 BTU ACI* ANR* CLD* CNX 280 251 162 122 388 Coal India Shenhua BTU ACI ANR 4.4 1.8 5.0 5.5 7.8 BTU ACI ANR CNX PCX Sources: ACI, Ventyx, Company filings, Press Articles * Pro forma annual 2011 or 2010 Top Five U.S. Coal Producers (2011, in millions of tons) Top Five Global Coal Producers (2011, in millions of tons) Top Five U.S. Reserve Holders (2010, in billions of tons) * * * * #2 #2 #4 Slide 16 Arch is one of the largest coal producers in the U.S. and the world |
|
|
Western Bituminous Southern Powder River Basin Illinois Basin Appalachia 1,353 million 1,905 million 455 million 653 million 431 million 736 million 5.5-Billion-Ton Reserve Base (pro forma reserves at 12/31/10) Thermal reserves Met/PCI reserves Northern Powder River Basin Slide 17 • Operations now extend to every major coal-supply basin • Control a robust U.S. product slate, with representation in all major segments Arch is the most diversified U.S. coal producer, and the No. 2 reserve holder in the nation |

|
|
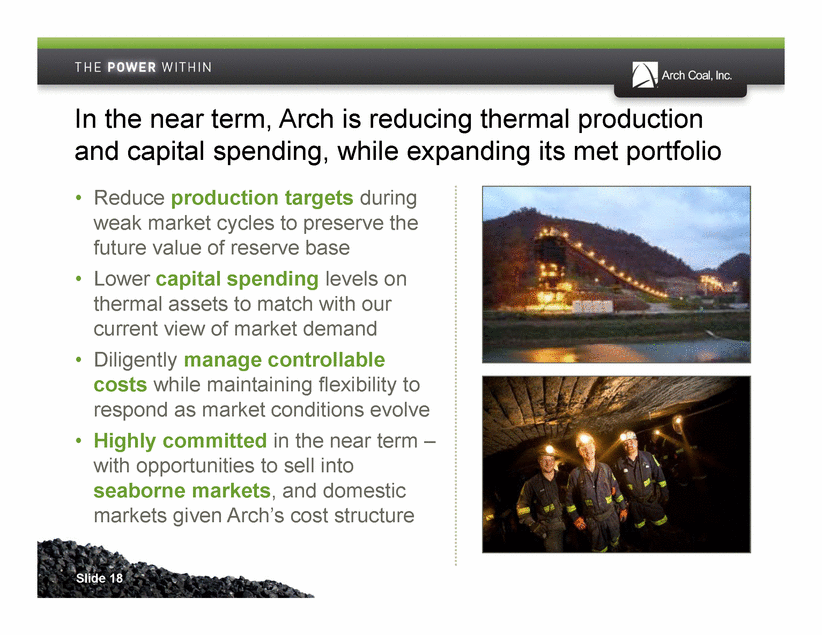
Slide 18 In the near term, Arch is reducing thermal production and capital spending, while expanding its met portfolio • Reduce production targets during weak market cycles to preserve the future value of reserve base • Lower capital spending levels on thermal assets to match with our current view of market demand • Diligently manage controllable costs while maintaining flexibility to respond as market conditions evolve • Highly committed in the near term – with opportunities to sell into seaborne markets, and domestic markets given Arch’s cost structure |
|
|
0.0 3.0 6.0 9.0 12.0 15.0 2011 By 2014 By 2015 ACI Expected Metallurgical Coal Volumes (in millions of tons) Our “15 by ’15” plan – to grow met volumes to at least 15 million tons by 2015 – is well underway Tygart Valley #2, #3 Slide 19 • Accelerated development of Tygart Valley (longwall production expected in mid-2013) will add 3.5 million tons to our met production profile • Upgrades to Beckley and Sentinel preparation plants will increase efficiencies and yield of higher-quality met coal • Increased PCI sales from the expanded Lone Mountain complex • Other opportunities for expansion on existing reserves |

|
|
Slide 20 Arch is building a world-class, high-vol “A” mining complex on former ICG reserves Expected Future Metallurgical Quality 10% PCI 10% 35% High Vol “B” 35% 20% Low Vol 10% High Vol “A” 45% • Large, undeveloped reserve block could support build-out of multiple low-cost, high-vol “A” met coal mines |

|
|
East Coast Gulf Coast West Coast • Own 22% interest in DTA in Newport News, VA which has throughput capacity of ~20 million tpy • In final discussions with Kinder Morgan for port space at KMP-owned facilities on East Coast • Ownership and throughput rights at river facilities in Kentucky and Illinois • Long-term throughput agreement with Kinder Morgan that supports expansion of Gulf Coast export facilities • Own 38% interest in Millennium Bulk Terminals in Washington state • Agreement with Ridley Terminals in Canada • Commitments to move Western Bituminous coals through ports in California Arch will play a growing role in the global seaborne met and thermal coal trade Slide 21 |

|
|
Slide 22 Arch’s cash cost structure remains one of the lowest in the Appalachian region $46.32 $63.21 $71.06 $69.59 $84.35 CNX ACI* PCX ANR* JRCC Public Companies’ Reported Appalachian Cash Costs (Weighted average, last 12 months ended 12/31/11, $/ton) • Lowest cost producer among predominantly CAPP operators • One of the lowest cost producers in the overall Appalachian region • Combined with ICG, Arch’s cost structure remains advantageous – despite continued pressures in the region Sources: SEC filings, MSHA * Twelve months ended 9/30/11 100% 82% 18% 80% 20% 78% 22% 16% 84% NAPP CAPP (% of production) CNX ACI PCX ANR JRCC * * |

|
|
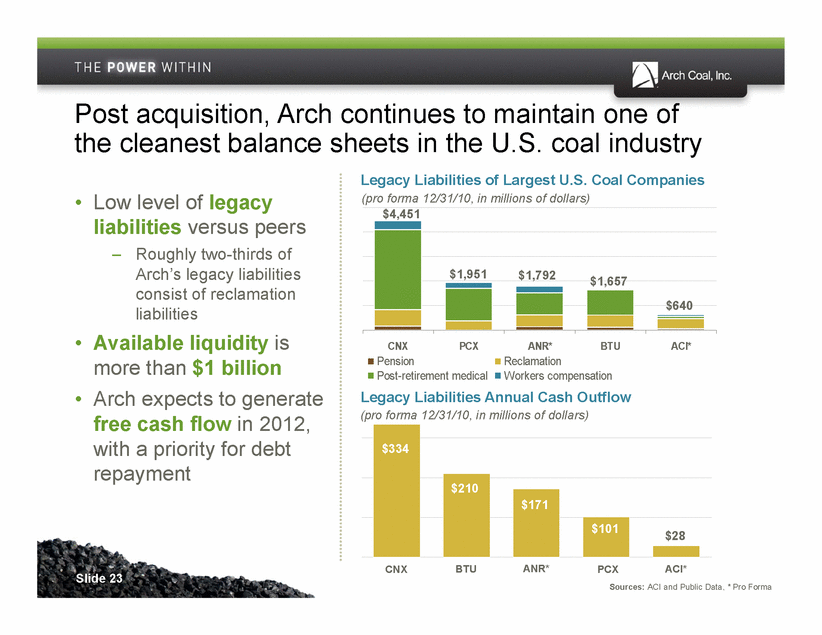
Slide 23 • Low level of legacy liabilities versus peers – Roughly two-thirds of Arch’s legacy liabilities consist of reclamation liabilities • Available liquidity is more than $1 billion • Arch expects to generate free cash flow in 2012, with a priority for debt repayment CNX PCX ANR* BTU ACI* Pension Reclamation Post-retirement medical Workers compensation $4,451 $1,792 $1,951 $1,657 $640 Legacy Liabilities of Largest U.S. Coal Companies (pro forma 12/31/10, in millions of dollars) Post acquisition, Arch continues to maintain one of the cleanest balance sheets in the U.S. coal industry Sources: ACI and Public Data, * Pro Forma Legacy Liabilities Annual Cash Outflow (pro forma 12/31/10, in millions of dollars) CNX BTU ANR* PCX ACI* $334 $210 $171 $101 $28 |
|
|
Arch Coal Investor Presentation February 2012 |
