Attached files
| file | filename |
|---|---|
| EX-99.1 - PDF - FIRST MIDWEST BANCORP INC | exhibit99.pdf |
| 8-K - FORM 8-K - FIRST MIDWEST BANCORP INC | feb138k.htm |

Sterne Agee
Financial Institutions Investor Conference
February 13, 2012

Forward Looking Statements &
Additional Information
Additional Information
This presentation may contain, and during this presentation our management may make statements that may constitute
“forward-looking statements” within the meaning of the safe harbor provisions of the Private Securities Litigation Reform Act
of 1995. Forward-looking statements are not historical facts but instead represent only our beliefs regarding future events,
many of which, by their nature, are inherently uncertain and outside our control. Forward-looking statements include, among
other things, statements regarding our financial performance, business prospects, future growth and operating strategies,
objectives and results. Actual results, performance or developments could differ materially from those expressed or implied by
these forward-looking statements. Important factors that could cause actual results to differ from those in the forward-looking
statements include, among others, those discussed in our Annual Report on Form 10-K, the preliminary prospectus supplement
and other reports filed with the Securities and Exchange Commission, copies of which will be made available upon request.
With the exception of fiscal year end information previously included in the audited financial statements in our Annual Report
on Form 10-K, the information contained herein is unaudited. Except as required by law, we undertake no duty to update the
contents of this presentation after the date of this presentation.
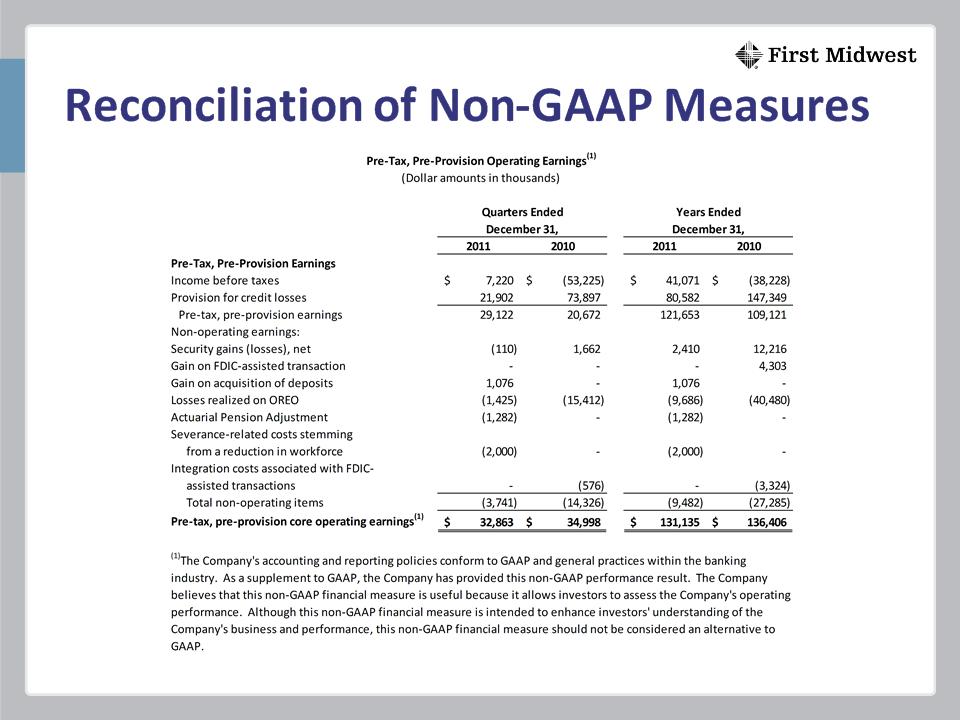
The Company’s accounting and reporting policies conform to U.S. generally accepted accounting principles (“GAAP”) and
general practice within the banking industry. As a supplement to GAAP, the Company has provided non-GAAP performance
results. The Company believes that these non-GAAP financial measures are useful because they allow investors to assess the
Company’s operating performance. Although the non-GAAP financial measures are intended to enhance investors’
understanding of the Company’s business and performance, these non-GAAP financial measures should not be considered an
alternative to GAAP.
2

Presentation Index
Who We Are
Operating Performance
Credit and Capital
Going Forward
3

Who Are We
4

Overview Of First Midwest
Note: Information as of December 31, 2011.
1 Includes $261mm in covered loans stemming from three FDIC-assisted transactions since September 30, 2009.
2 Source: SNL Financial. Non-downtown ranking and market share based on total deposits in Chicago MSA less deposits in the city of Chicago. Data as of June 30, 2011 reflects acquisitions
post June 30, 2011.
3Defined as total deposits less time deposits.
5
Headquartered In Suburban Chicago
$8.0bn Assets
$5.3bn Loans1
$6.5bn Deposits
74% Transactional3
$5.0 bn AUM Wealth Management
$70mm Avg Deposits Per Branch
#8 in Market Share in Non-
Downtown Chicago MSA2
Downtown Chicago MSA2

6

Operating Performance
7

8
Significant Fourth Quarter Events
Organizational Realignment
Elimination Of Approximately 100 Positions
Resulted In Severance-Related Costs Of $2.0 Million
Redeemed $193.0 Million Of TARP Preferred Shares
Redeemed Related Common Stock Warrants
Resulted In One-time, $1.5 Million/$0.02 Per Share 4Q Charge
Eliminates Preferred Dividends Of $10.3 Million Annually
Acquired $106.7 Million In Deposits
Approximately $70 Million Of Core Deposits
Resulted In A Gain Of $1.1 Million

|
|
|
Quarters Ended
|
|
|
Years Ended
|
|
||
|
|
|
December 31,
|
|
|
December 31,
|
|
||
|
|
|
2011
|
2010
|
Change
|
|
2011
|
2010
|
Change
|
|
|
|
|
|
|
|
|
|
|
|
Net Income
|
|
$ 6.9
|
$ (28.2)
|
NA
|
|
$ 36.6
|
$ (9.7)
|
NA
|
|
|
|
|
|
|
|
|
|
|
|
PTPP Core Operating Earnings2
|
|
$ 32.9
|
$ 35.0
|
(6%)
|
|
$ 131.1
|
$ 136.4
|
(4%)
|
|
|
|
|
|
|
|
|
|
|
|
Total Fee Based Revenue
|
|
$ 23.9
|
$ 22.4
|
7%
|
|
$ 94.2
|
$ 86.8
|
9%
|
|
|
|
|
|
|
|
|
|
|
|
Net Interest Margin
|
|
3.95%
|
4.02%
|
(2%)
|
|
4.04%
|
4.13%
|
(2%)
|
|
|
|
|
|
|
|
|
|
|
|
Efficiency Ratio
|
|
61.42%
|
59.08%
|
4%
|
|
61.29%
|
58.84%
|
4%
|
Improved Overall Earnings
Stable Core And Margin
1Dollar amounts in millions.
2PTPP represents Pre-Tax, Pre-Provision earnings, which is a non-GAAP financial measure. For reconciliation to GAAP measure, please refer to the appendix.
9
Performance Highlights
Key Operating Metrics1

|
|
|
As Of
|
|
|
|
|
|
|
December 31,
|
|
Change
|
|
|
|
|
2011
|
2010
|
|
YoY
|
|
|
|
|
|
|
|
|
Loans, End Of Period2
|
|
$ 5,349
|
$ 5,472
|
|
(2%)
|
|
|
|
|
|
|
|
|
YTD Avg. Core Transactional
Deposits3 |
|
$ 4,755
|
$ 4,322
|
|
10%
|
|
|
|
|
|
|
|
|
Tier 1 Common
|
|
10.26%
|
9.81%
|
|
5%
|
|
|
|
|
|
|
|
|
YTD Charge-Offs
|
|
$ 103.7
|
$ 147.1
|
|
(30%)
|
|
|
|
|
|
|
|
|
NPAs + 90 Days Past Due
|
|
$ 248.4
|
$ 269.5
|
|
(8%)
|
|
|
|
|
|
|
|
|
Loans 30-89 Days Past Due
|
|
$ 27.5
|
$ 23.6
|
|
17%
|
Performance Highlights
Balance Sheet Metrics1
Strong Capital And Liquidity
Credit Metrics Improving
1Dollar amounts in millions.
2Includes covered loans acquired from FDIC-assisted transactions totaling $261 million, and $372 million as of 31-Dec-11, and 31-Dec-10, respectively.
3Defined as total deposits less time deposits.
10
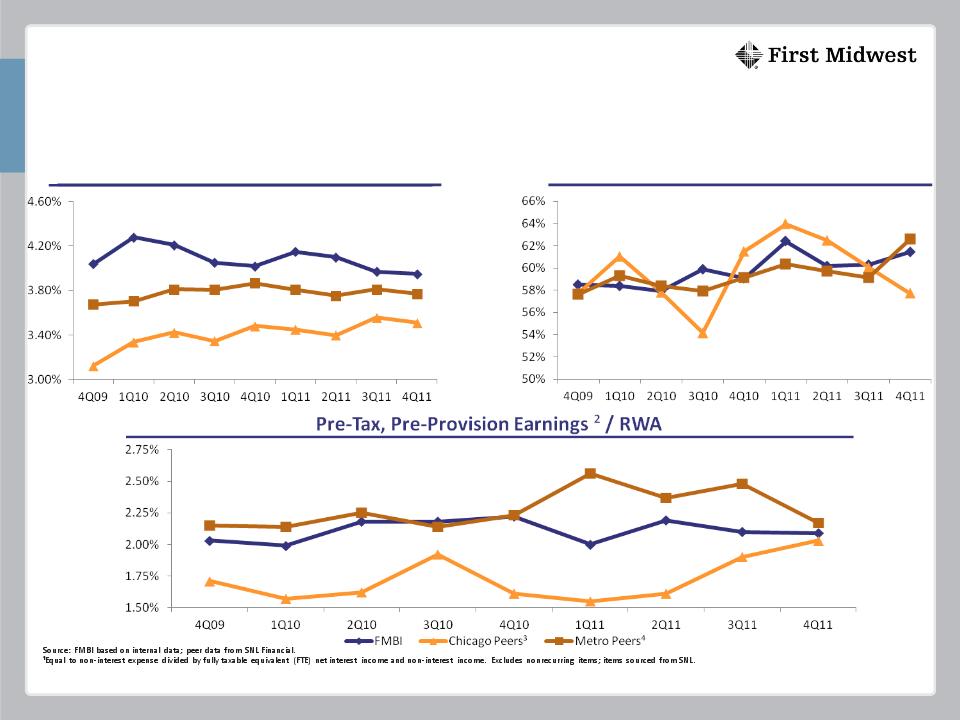
Core Business Is Solid
11
²This is a non-GAAP financial measure. For reconciliation to GAAP measure, please refer to the appendix.
³Chicago Peers based on median of MBFI, PVTB, TAYC and WTFC.
4Metro Peers based on median of CATY, CBSH, CFR, FCF, FMER, FULT, MBFI, ONB, PVTB, SUSQ, TRMK, UMPQ, VLY, and WTFC.
Net Interest Margin
Efficiency Ratio1
12
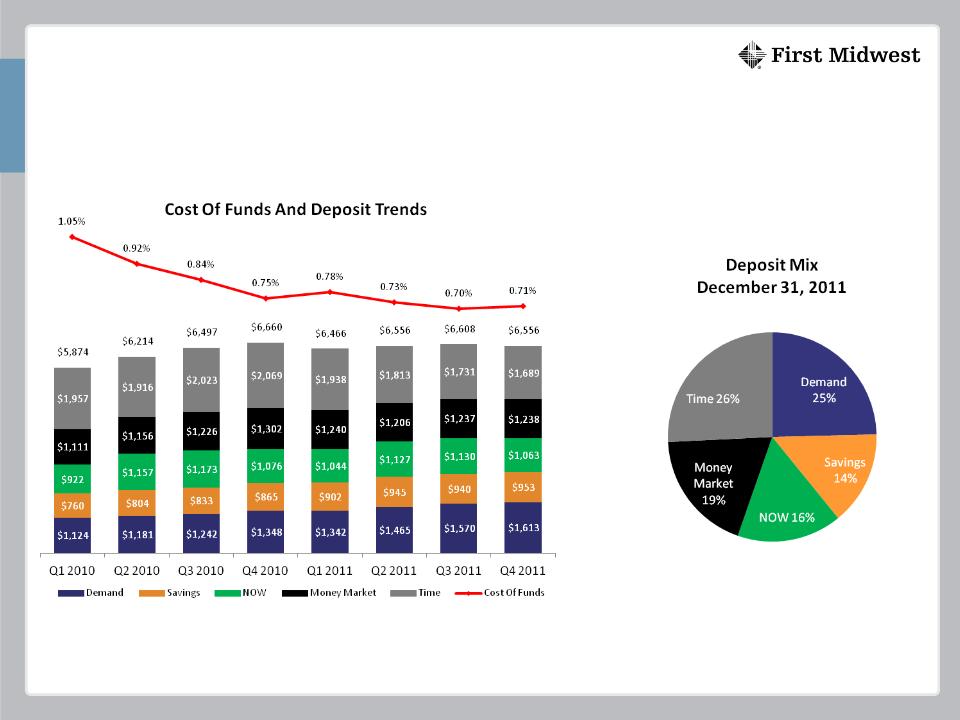
Dollar amounts in millions.
1 Based on quarterly average deposit mix as of December 31, 2011.
Strong Deposit Mix1
Total Deposits = $6.6bn

Credit and Capital

14
Branch originated
Home equity dominated
~95% in footprint
83% of portfolio, 51% CRE
Diversified + granular
Most have personal guarantees
36% of CRE is owner-occupied
Consumer Loans = $660mm
Commercial Loans = $4.4bn
Total Loans = $5.3bn
Note: Loan data as of December 31, 2011.
Covered Loans = $261 mm
Performing Better Than Originally Expected
Losses Mitigated By Loss-Share

|
|
Dec. 31
|
|
% of
|
|
Dec. 31
|
|
% of
|
|
%
|
|
Loan Type1
|
2011
|
|
Total
|
|
2009
|
|
Total
|
|
Chg.
|
|
Commercial and Industrial
|
$ 1,458
|
|
29%
|
|
$ 1,438
|
|
28%
|
|
1%
|
|
Agricultural
|
244
|
|
5%
|
|
210
|
|
4%
|
|
16%
|
|
Office, Retail, Industrial
|
1,299
|
|
26%
|
|
1,213
|
|
23%
|
|
7%
|
|
Multi-Family
|
288
|
|
6%
|
|
334
|
|
6%
|
|
(14%)
|
|
Residential Construction
|
106
|
|
2%
|
|
314
|
|
6%
|
|
(66%)
|
|
Commercial Construction
|
145
|
|
3%
|
|
231
|
|
4%
|
|
(37%)
|
|
Other Commercial Real Estate
|
888
|
|
17%
|
|
799
|
|
15%
|
|
11%
|
|
Subtotal Commercial
|
4,428
|
|
87%
|
|
4,539
|
|
87%
|
|
(2%)
|
|
|
|
|
|
|
|
|
|
|
|
|
1-4 Family Mortgages
|
201
|
|
4%
|
|
140
|
|
3%
|
|
44%
|
|
Consumer
|
459
|
|
9%
|
|
524
|
|
10%
|
|
(12%)
|
|
Total
|
$ 5,088
|
|
100%
|
|
$ 5,203
|
|
100%
|
|
(2%)
|
Greater Commercial And Owner-Occupied CRE
Reduced Construction, Re-entry To 1-4 Family
15
Changing Loan Mix
Note: Excludes covered loans acquired in FDIC-assisted transactions.
1 Dollar amounts in millions.

Significant Credit Improvement
16
Strong Capital, Proactive Remediation
($ in millions)
|
NPAs + 90s / TCE + LLR
|
54.9%
|
32.2%
|
34.7%
|
27.8%
|
31.0%
|
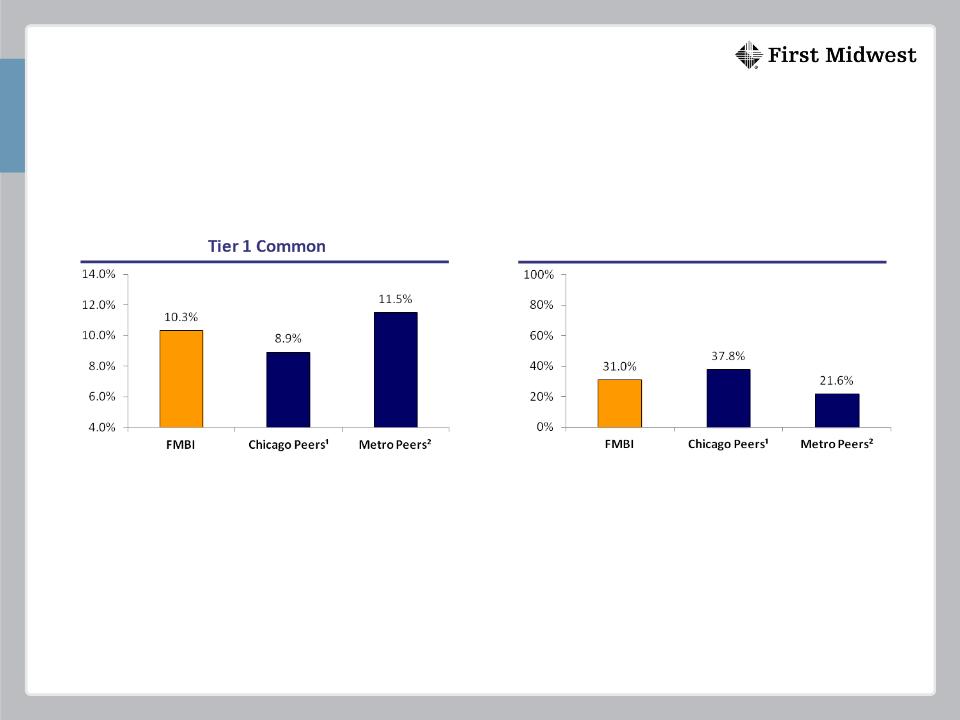
Source: Company data and SNL Financial. FMBI as of December 31, 2011, Peer data as of September 30, 2011.
1Chicago Peers based on median of MBFI, PVTB, TAYC and WTFC.
2Metro Peers based on median of CATY, CBSH, CFR, FCF, FMER, FULT, MBFI, ONB, PVTB, SUSQ, UMPQ, VLY, WTFC, and TRMK.
NPA + 90 / TCE + LLR
Strong Capital Foundation
First Midwest vs. Peers
First Midwest vs. Peers
17

TARP Repurchase Completed
Overview
Overview
Repurchased $193 million of preferred stock and
outstanding warrants
outstanding warrants
One-time, $1.5 million/$0.02 per share 4Q charge
Eliminates preferred dividends of $10.3 million or $0.08 per share
annually, net of additional borrowing costs
annually, net of additional borrowing costs
Recognizes credit and operating performance
Funded through senior notes and cash on hand
$115 million, 5 year notes @ 5.875%
No equity component
Advantageous To Shareholders
Maintains Capital Flexibility
18

Going Forward

Remediate Liquidate & Originate Originate
Positioning
FDIC FDIC & M&A M&A
Defensive Offensive

Priorities Refocusing, Improving Execution
Delivering On Multiple Fronts
1. Asset Formation
3. Efficiency
2. Fee Income/Deposits
4. Investment In Core
21
New Mortgage Sales Platform
Asset-Based Lending Team
Commercial Sales Team
Wealth Management
Core Deposit Growth
Organizational Realignment
Remediation Costs
Market Entry - Downtown Chicago, Dupage
Internet And ATM Platform
High Customer And Employee Satisfaction
Market Disruption
Environment Creates Opportunities
In Greater Chicago Area
~ 30 Failures Since Start Of 2009
~ 40 Institutions ($19 Billion) With Texas Ratio > 100%
Well Positioned To Benefit
Strong Capital Position
Solid Reputation: In Marketplace 70+ Years
Expanded Sales Force
Experienced Management

Selective Criteria
Ability To Strengthen The Company
Leverages Our Skills
Local Market Knowledge
Core Competency
Experienced And Successful Acquirer
7 Deals, $2.7bn Since 2003
FDIC-Assisted Deals Becoming More Competitive
Deals Likely Smaller
Eventual Shift From Assisted To Unassisted
Acquisition Opportunities
23

Why Invest in First Midwest…
Premier Community Banking Franchise
Investing in Our Business
Working Through Cycle
Solid Capital; Liquidity
Experienced Management Team
Market Opportunities Available
Positioned For Long-term Success
24

Questions

Appendix
26
27