Attached files
| file | filename |
|---|---|
| 8-K - PPL CORPORATION FORM 8-K - PPL Corp | form8k.htm |
| EX-99.1 - EXHIBIT 99.1 - PPL Corp | exhibit99-1.htm |

©PPL Corporation 2012
1
4th Quarter Earnings Call
PPL Corporation
February 10, 2012
©PPL Corporation 2012
Exhibit 99.2

©PPL Corporation 2012
2
Cautionary Statements and Factors
That May Affect Future Results
That May Affect Future Results
Any statements made in this presentation about future
operating results or other future events are forward-looking
statements under the Safe Harbor Provisions of the Private
Securities Litigation Reform Act of 1995. Actual results may
differ materially from such forward-looking statements. A
discussion of factors that could cause actual results or events
to vary is contained in the Appendix to this presentation and
in the Company’s SEC filings.

©PPL Corporation 2012
3
J. H. Miller
W. H. Spence
P. A. Farr
Agenda
2011 Earnings Results
2011 Operational Overview and 2012
Earnings Forecast
Earnings Forecast
2011 Segment Results and Financial
Overview
Overview
Q&A
©PPL Corporation 2012
4
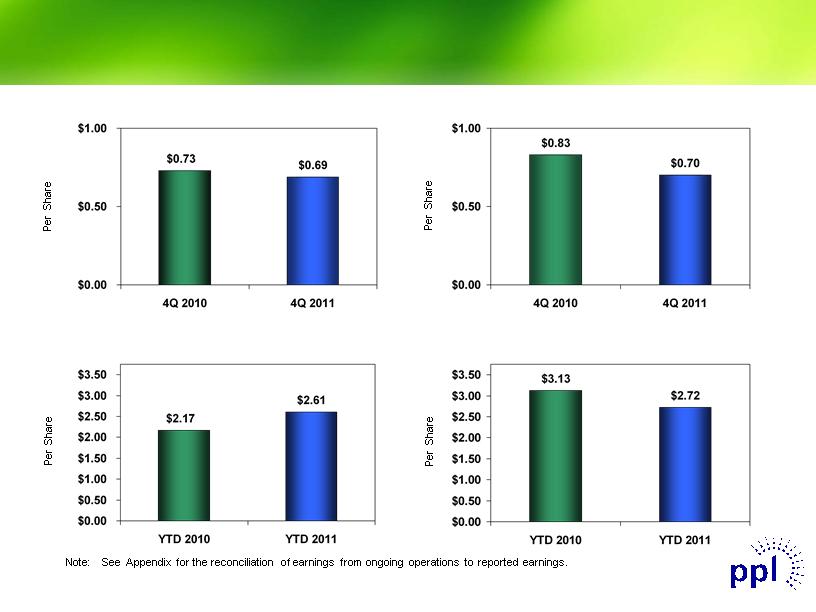
Fourth Quarter
Reported Earnings
Fourth Quarter
Earnings from Ongoing Operations
Year-to-Date
Reported Earnings
Year-to-Date
Earnings from Ongoing Operations
Earnings Results

©PPL Corporation 2012
5
PPL Well-Positioned for Future Success
Increased mix of rate-regulated earnings provides stability in weak
economic environment
economic environment
Approximately 70% of projected 2012 EPS from regulated businesses
Substantial organic growth in rate base: ~8% CAGR from 2012-2016
Business Risk Profile rated “Excellent” by S&P
Secure dividend with strong platform for continued growth
Highly attractive competitive generation fleet with diverse fuel mix allows
for significant upside when power markets recover
for significant upside when power markets recover
Strong baseload footprint in PJM complemented by flexible gas-fired units
No major exposure to currently proposed environmental regulations
Strong management team with track record of execution
UK team already showing meaningful improvement in Midlands operations
ECR approval received in Kentucky
Successfully hedging competitive generation and locking in margins in a challenging
market
market

©PPL Corporation 2012
6
2011 Operational Review
Midlands Integration
Kentucky ECR approval
Pennsylvania storm restorations
Overcame Susquehanna outages
Supply rail contract negotiation

©PPL Corporation 2012
7
International Regulated Segment
Investment Highlights
Investment Highlights
Highly attractive rate-regulated business with significant growth
prospects
prospects
Regulator-approved 5-year forward-looking revenues based on future business plan,
including capital expenditures and O&M plus adjustments for inflation
including capital expenditures and O&M plus adjustments for inflation
Real-time return of and return on capital investment - no lag
No volumetric risk
Additional incentives for operational efficiency and high-quality service
Top performing electricity distribution business in the U.K.
Leader in capital and operating cost efficiency, customer service and reliability
Over $380 million in incentive revenues earned over past 7 years
Highest percentage of bonus revenue among peers
Best-in-class U.K. management team
Experienced team with record of delivering results
Completely transformed acquired Midlands operation in 9 months
Strong potential to earn additional incentive revenues
Consistent pattern of dividend repatriation to U.S. parent

©PPL Corporation 2012
8
Kentucky Regulated Segment
Investment Highlights
Investment Highlights
Efficient, well-run utility focused on safety, reliability and customer
service
service
Projected rate base CAGR of 9.6% through 2016
Constructive regulatory environment that provides a timely return on a
substantial amount of planned capex over the next 5 years
substantial amount of planned capex over the next 5 years
Environmental Cost Recovery (ECR): ~$2.3 billion plan approved by the KPSC with a
10.1% ROE; ~$500 million remaining under prior plan at 10.63% ROE - virtually no
regulatory lag
10.1% ROE; ~$500 million remaining under prior plan at 10.63% ROE - virtually no
regulatory lag
Other supportive recovery mechanisms include Construction Work In Process, Fuel
Adjustment Clause, Gas Supply Clause Adjustment and Demand Side Management
recovery
Adjustment Clause, Gas Supply Clause Adjustment and Demand Side Management
recovery
Very competitive retail rates that attract energy-intensive businesses

©PPL Corporation 2012
9
Pennsylvania Regulated Segment
Investment Highlights
Investment Highlights
Significant growth in transmission portion of business which
earns a favorable rate of return on a near real-time basis
earns a favorable rate of return on a near real-time basis
CAGR of 21.7% in transmission rate base through 2016 driven by
initiatives to improve aging infrastructure and Susquehanna-Roseland
Project
initiatives to improve aging infrastructure and Susquehanna-Roseland
Project
ROE of 11.68% earned through FERC Formula Rate Mechanism
Susquehanna-Roseland Project earns an incentive 12.93% ROE and earns
a return on construction work-in-progress
a return on construction work-in-progress
Projected CAGR of 6.0% in distribution rate base through
2016 driven by initiatives to improve aging infrastructure
2016 driven by initiatives to improve aging infrastructure
Alternative ratemaking bill passed state legislature and is
before the Governor for approval
before the Governor for approval
Intended to provide for more timely recovery of eligible distribution plant
costs that improve and maintain safety and reliability
costs that improve and maintain safety and reliability

©PPL Corporation 2012
10
Supply Segment
Investment Highlights
Investment Highlights
Very well-positioned competitive generation
PJM assets:
Low marginal cost nuclear and hydro facilities
Efficient supercritical coal units with fuel switching optionality
Attractive gas-fired assets that capture market opportunity and back-stop base load unit availability
Montana assets:
Low marginal cost coal and hydro units that are critical to infrastructure supporting load in the Northwest
Considerable upside from potential expansion of export capability to Alberta and the Dakotas in support of
rapidly growing unconventional oil production activities
rapidly growing unconventional oil production activities
Substantially in compliance with new emissions standards without further major
investments
investments
Generation fleet will benefit from multiple factors
Tightening reserve margins
Forced retirement of less efficient stations due to tightening emissions standards
Firming of demand driven by general economic recovery
General firming of natural gas prices
Among the strongest forward hedge profiles in industry
Wholesale generation increasingly augmented by growing competitive retail
activities across commercial, industrial and residential customer classes
activities across commercial, industrial and residential customer classes

©PPL Corporation 2012
11
Capacity revenues are expected to be $385 million and $590 million for 2012 and 2013, respectively.
As of January 31, 2012
(1) Represents expected sales of Supply segment based on current business plan assumptions.
(2) The 2012 average hedge energy prices are based on the fixed price swaps as of January 31, 2012; the prior collars have all been converted to fixed swaps.
(3) The 2013 ranges of average energy prices for existing hedges were estimated by determining the impact on the existing collars resulting from 2013 power prices at the 5th
and 95th percentile confidence levels.
(4) Includes contract with Southern Montana Electric Generation and Transmission Cooperative, Inc., which filed for bankruptcy protection on October 21, 2011.
|
|
|
|
2012
|
|
2013
|
|
|
|
Baseload
|
|
|
|
|
|
|
|
|
Expected Generation(1) (Million MWhs)
|
|
|
53.7
|
|
53.1
|
|
|
|
East
|
|
|
45.5
|
|
44.8
|
|
|
|
West
|
|
|
8.2
|
|
8.3
|
|
|
|
Current Hedges (%)
|
|
|
95-99%
|
|
80-84%
|
|
|
|
East
|
|
|
94-98%
|
|
80-84%
|
|
|
|
West (4)
|
|
|
98-102%
|
|
82-86%
|
|
|
|
Average Hedged Price (Energy Only) ($/MWh)(2) (3)
|
|
|
|
|
|
|
|
|
East
|
|
|
$54-55
|
|
$49-52
|
|
|
|
West (4)
|
|
|
$50-52
|
|
$47-50
|
|
|
|
Current Coal Hedges (%)
|
|
|
98%
|
|
89%
|
|
|
|
East
|
|
|
98%
|
|
93%
|
|
|
|
West
|
|
|
100%
|
|
79%
|
|
|
|
Average Hedged Consumed Coal Price (Delivered $/Ton)
|
|
|
|
|
|
|
|
|
East
|
|
|
$75-78
|
|
$82-86
|
|
|
|
West
|
|
|
$23-28
|
|
$23-29
|
|
|
|
Intermediate/Peaking
|
|
|
|
|
|
|
|
|
Expected Generation(1) (Million MWhs)
|
|
|
6.9
|
|
7.0
|
|
|
|
Current Hedges (%)
|
|
|
49%
|
|
6%
|
|
|
Enhancing Value Through Active Hedging
©PPL Corporation 2012
12
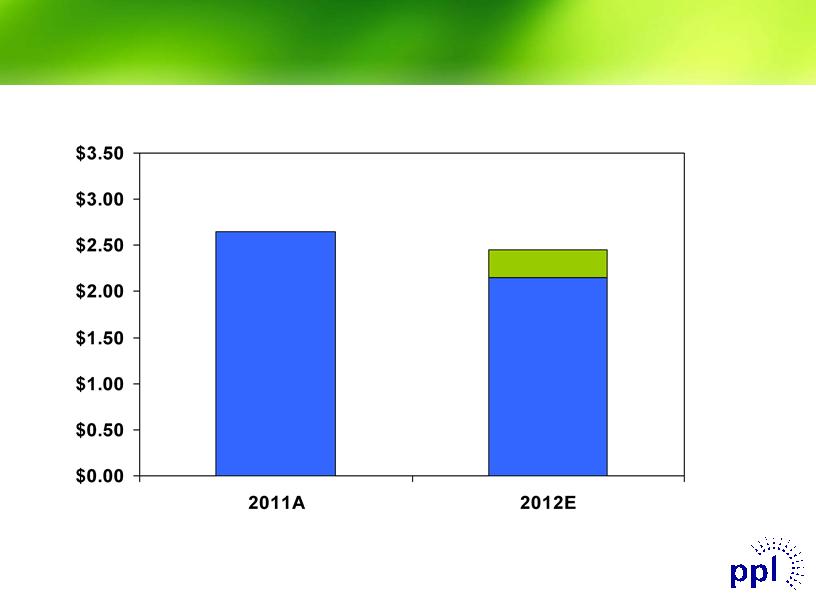
$2.72
$/Share
Note: See appendix for reconciliation of earnings from ongoing operations to reported earnings.
$2.45
$2.15
2012 Earnings Forecast

©PPL Corporation 2012
13
($0.13)
$0.83
$0.70
Total
(0.38)
0.64
0.26
Supply
0.05
0.05
0.10
Pennsylvania Regulated
0.21
0.07
0.28
International Regulated
($0.01)
$0.07
$0.06
Kentucky Regulated
Change
Q4 2010
Q4 2011
|
Note: See Appendix for the reconciliation of earnings from ongoing operations to reported earnings.
|
($0.41)
$3.13
$2.72
Total
(1.13)
2.27
1.14
Supply
0.04
0.27
0.31
Pennsylvania Regulated
0.34
0.53
0.87
International Regulated
$0.34
$0.06
$0.40
Kentucky Regulated
Change
2010
2011
Ongoing Earnings Overview

©PPL Corporation 2012
14
|
Note: See Appendix for the reconciliation of earnings from ongoing operations to reported earnings.
(1) Includes interest expense from the 2011 equity units and Bridge Facility borrowings.
|
|
|
2011
|
|
|
2010 EPS - Ongoing Earnings
|
|
$0.53
|
|
Midlands(1)
|
0.50
|
|
|
Delivery revenue
|
0.13
|
|
|
O&M
|
(0.02)
|
|
|
Income taxes & other
|
(0.06)
|
|
|
Effect of exchange rates
|
0.03
|
|
|
Dilution
|
(0.24)
|
|
|
Total
|
|
0.34
|
|
2011 EPS - Ongoing Earnings
|
|
$0.87
|
International Regulated Segment
Earnings Drivers
Earnings Drivers

©PPL Corporation 2012
15
|
Note: See Appendix for the reconciliation of earnings from ongoing operations to reported earnings.
|
|
|
2011
|
|
|
2010 EPS - Ongoing Earnings
|
|
$0.27
|
|
Electric Delivery Margins
|
0.09
|
|
|
O&M
|
0.01
|
|
|
Income taxes & other
|
0.03
|
|
|
Dilution
|
(0.09)
|
|
|
Total
|
|
0.04
|
|
2011 EPS - Ongoing Earnings
|
|
$0.31
|
Pennsylvania Regulated Segment
Earnings Drivers
Earnings Drivers

©PPL Corporation 2012
16
|
Note: See Appendix for the reconciliation of earnings from ongoing operations to reported earnings.
|
|
|
2011
|
|
|
2010 EPS - Ongoing Earnings
|
|
$2.27
|
|
Margins
|
(0.55)
|
|
|
O&M
|
(0.10)
|
|
|
Income taxes & other
|
(0.17)
|
|
|
Dilution
|
(0.31)
|
|
|
Total
|
|
(1.13)
|
|
2011 EPS - Ongoing Earnings
|
|
$1.14
|
Supply Segment Earnings Drivers
©PPL Corporation 2012
17
O&M: ($0.08)
Other: ($0.05)
Margins: $0.04
Midlands: $0.28(1)
Revenue: $0.14
O&M: ($0.06)
Other: ($0.11)
Currency: ($0.02)
Margins: ($0.19)
O&M: ($0.10)
Other: ($0.10)
O&M: ($0.07)
Other: ($0.03)
Margins: $0.06
(1) 4 months of Midlands operating results, net of interest expense associated with equity units.
(2) Earnings from ongoing operations.
Note: See Appendix for the reconciliation of earnings from ongoing operations to reported earnings.
(2)
(2)
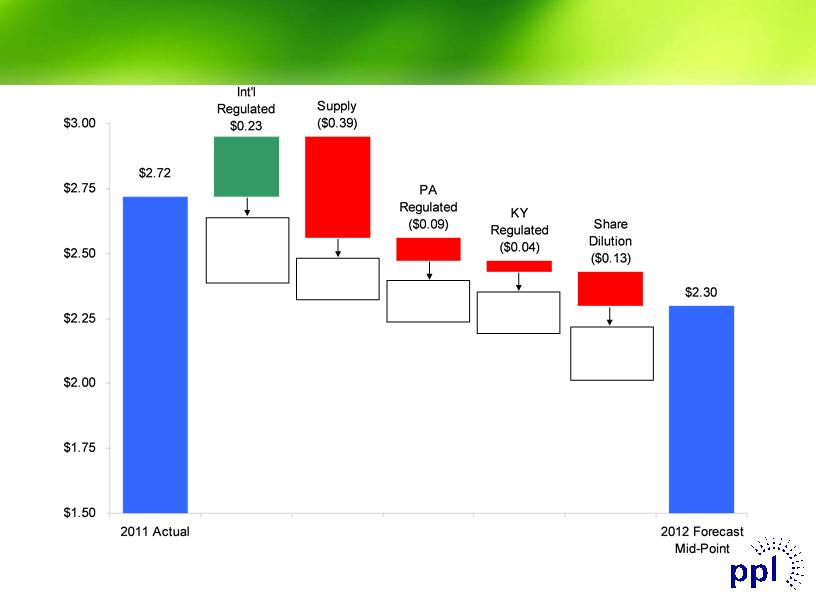
Int’l Reg: ($0.06)
KY Reg: ($0.02)
PA Reg: ($0.01)
Supply: ($0.04)
2011A to 2012E Earnings Walk
©PPL Corporation 2012
18
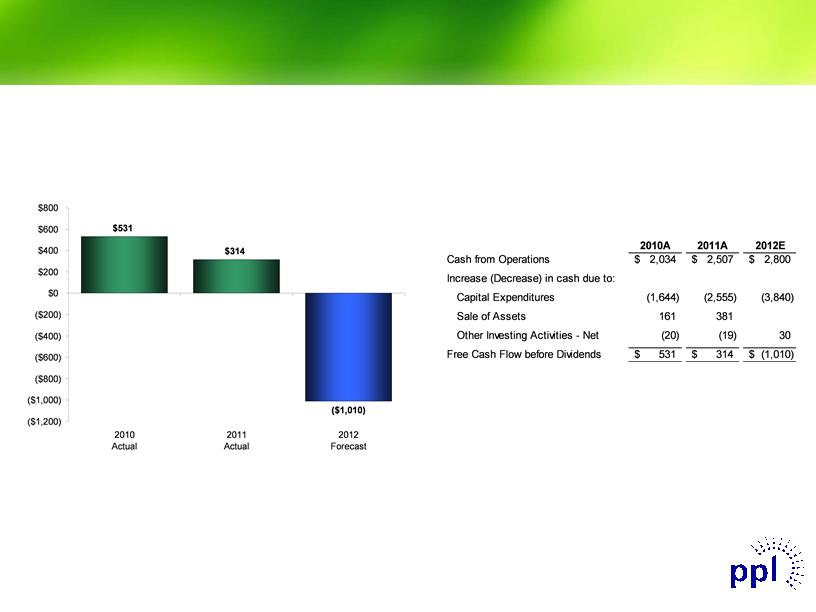
Free Cash Flow before
Dividends
Dividends
(Millions of Dollars)
(1) 2010 Free Cash Flow includes two months of the results of the Kentucky Regulated segment.
(1)
Reconciliation of Cash from
Operations to Free Cash Flow
before Dividends
Operations to Free Cash Flow
before Dividends
(Millions of Dollars)
Free Cash Flow before Dividends
©PPL Corporation 2012
19
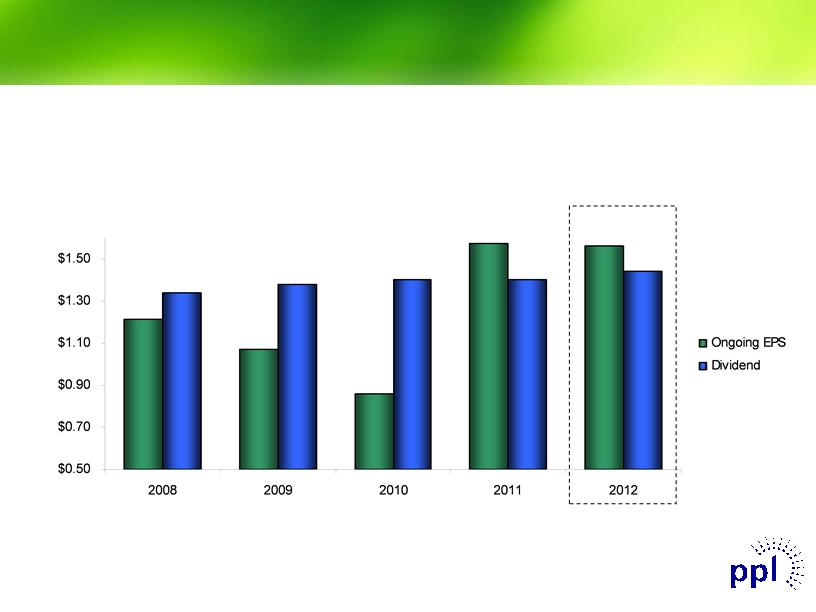
Continued Dividend Increases
A significantly more rate-regulated business mix provides strong
support for current dividend and a platform for future growth
support for current dividend and a platform for future growth
(1) Ongoing EPS based on mid-point of forecast. Annualized dividend based on 2/10/2012 announced increase. Actual dividends to be determined by Board of
Directors.
Directors.
(2) From only regulated segments.
$/Share
Annualized
(2)
(1)
2.9%
Dividend
Increase

©PPL Corporation 2012
20
Appendix
©PPL Corporation 2012
21
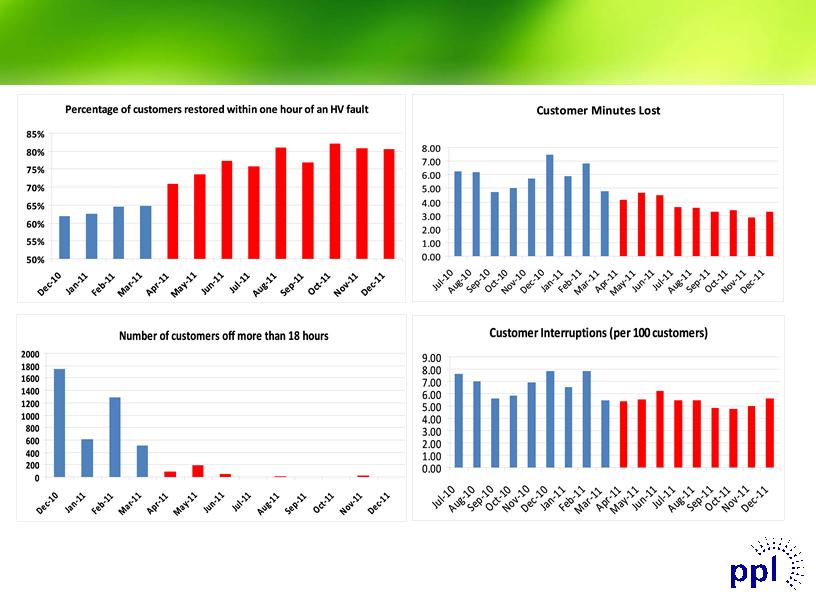
Midlands Integration - Improved
Network Performance
Network Performance
©PPL Corporation 2012
22
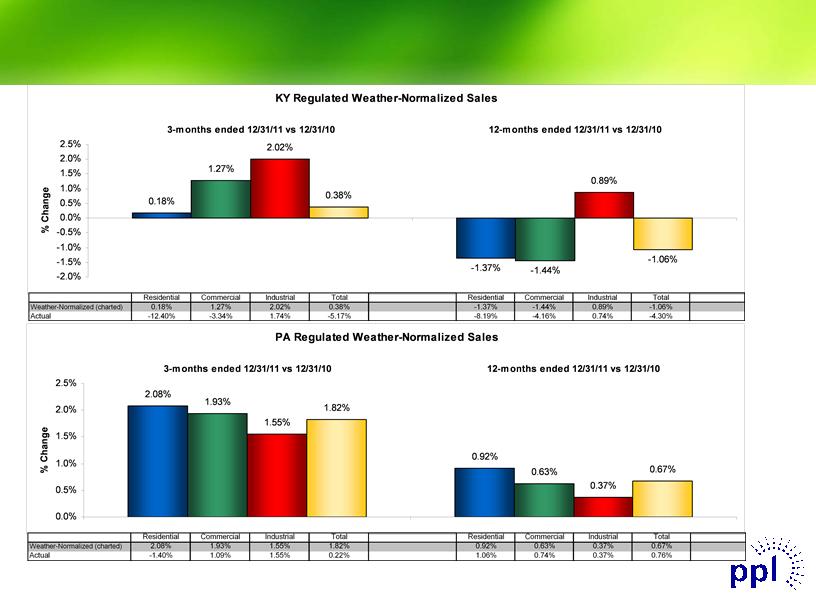
Note: Total includes Residential, Commercial and Industrial customer classes as well as “Other”, which is not depicted on the charts above.
Regulated Volume Variances
©PPL Corporation 2012
23
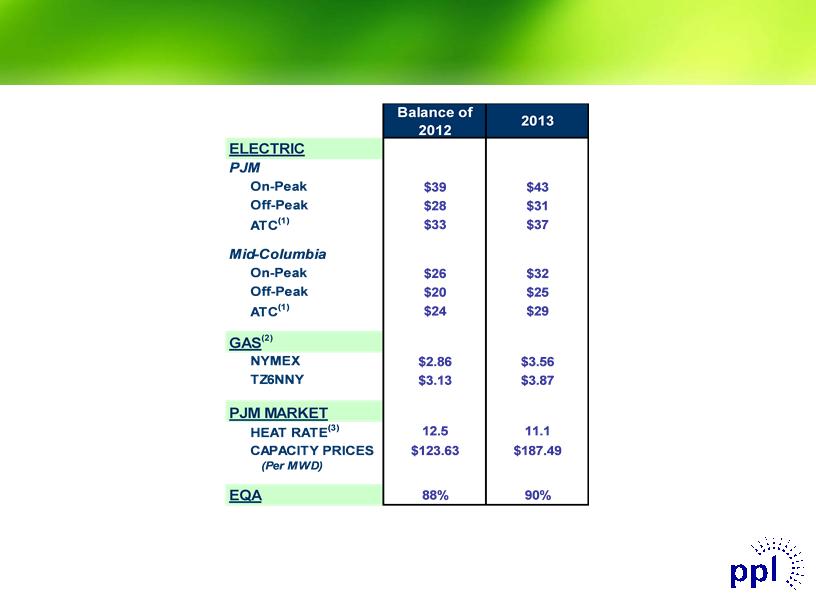
Market Prices
|
(1)
|
24-hour average.
|
|
(2)
|
NYMEX and TZ6NNY forward gas prices on 12/31/2011.
|
|
(3)
|
Market Heat Rate = PJM on-peak power price divided by TZ6NNY gas price.
|
©PPL Corporation 2012
24
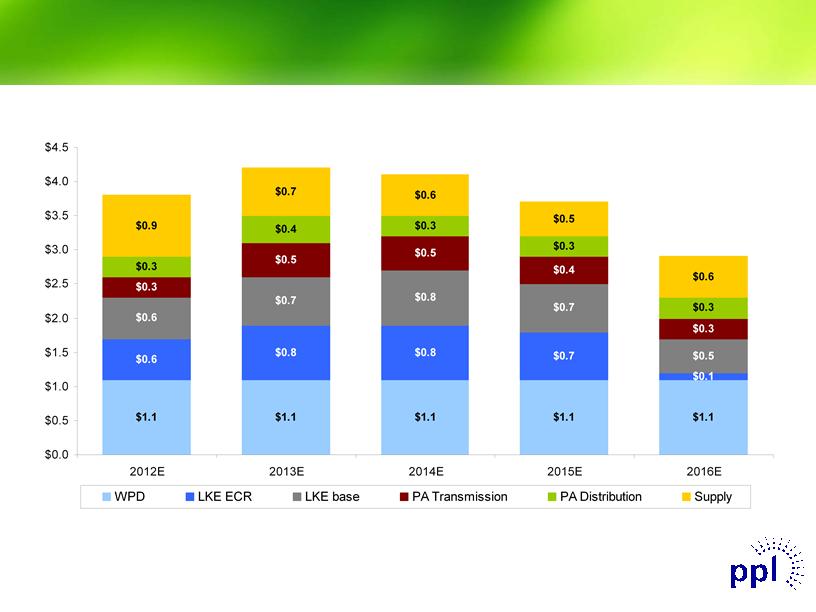
Capital Expenditures
($ in billions)
(1) Includes capex for WPD Midlands. Figures based on assumed exchange rate of $1.57 / GBP.
(2) Expect between 80% and 90% to receive timely returns via ECR mechanism based on historical experience and future projections.
(1)
(2)
$3.8
$4.2
$4.1
$3.7
$2.9
©PPL Corporation 2012
25
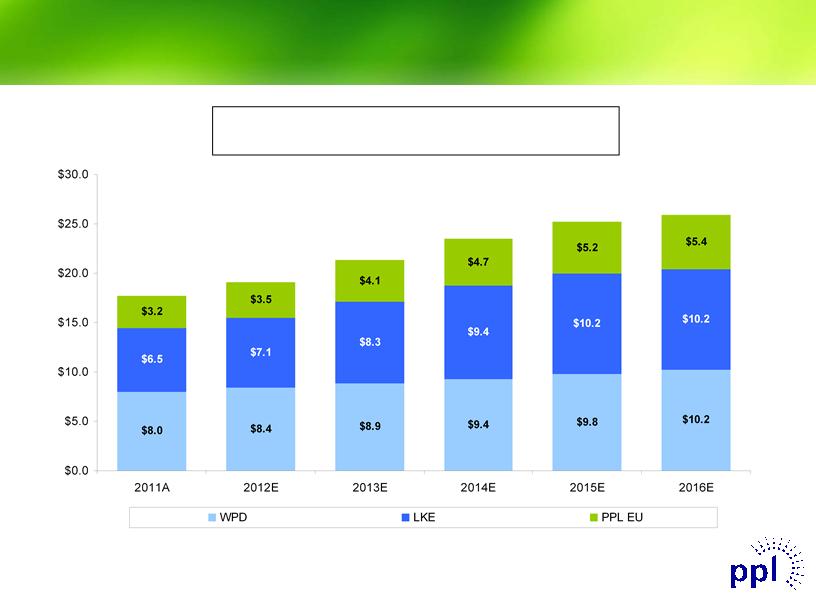
Regulated Rate Base Growth
($ in billions)
(1) Represents capitalization for LKE, as LG&E and KU rate constructs are based on capitalization. Represents Regulatory Asset Value (RAV) for WPD.
(2) Includes RAV for WPD Midlands. Figures based on assumed exchange rate of $1.57 / GBP and are as of year-end December 31.
$19.0
$21.3
$23.5
$25.2
(2)
2012E - 2016E Regulatory Asset Base(1) CAGR: 7.8%
$17.7
$25.8
©PPL Corporation 2012
26
Note: As of December 31, 2011
(1) Excludes $1.15 billion of junior subordinated notes due 2018 that are a component of PPL’s 2010 Equity Units and
may be put back to PPL Capital Funding if the remarketing in 2013 is not successful.
may be put back to PPL Capital Funding if the remarketing in 2013 is not successful.
(2) Excludes $978 million of junior subordinated notes due 2019 that are a component of PPL’s 2011 Equity Units and
may be put back to PPL Capital Funding if the remarketing in 2014 is not successful.
may be put back to PPL Capital Funding if the remarketing in 2014 is not successful.
(3) Bonds defeased in substance in 2008 by depositing sufficient funds with the trustee.
(4) Represents REset Put Securities due 2035 that are required to be put by the holders in October 2015 either for (a)
purchase and remarketing by a remarketing dealer or (b) repurchase by PPL Energy Supply.
purchase and remarketing by a remarketing dealer or (b) repurchase by PPL Energy Supply.
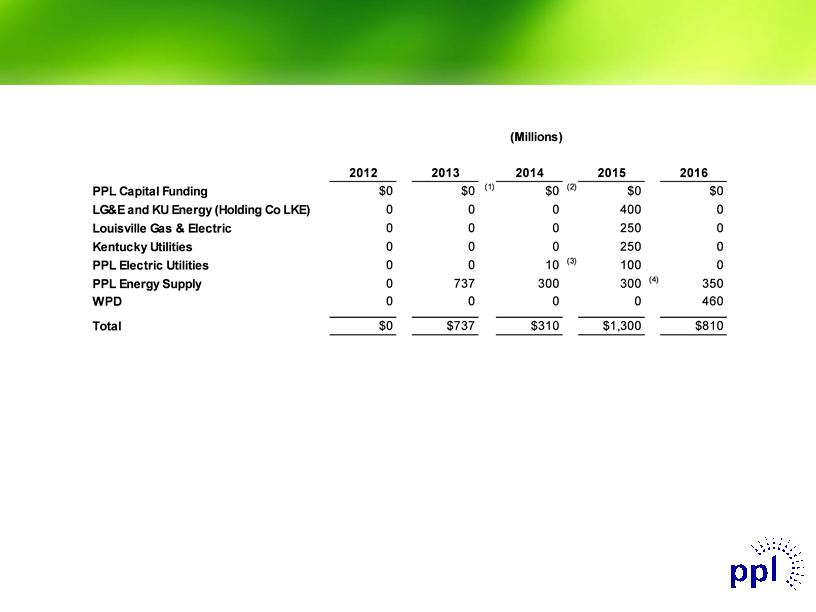
Debt Maturities
Debt Maturities Debt Maturities Debt Maturities ( Millions) PPL Capital Funding LG& E and KU Energy ( Holding Co LKE) Louisville Gas & Electric Kentucky Utilities PPL Electric Utilities PPL Energy Supply WPD 2012 $0 0 0 0 0 0 0 2013 $ 0 0 0 0 0 737 0 (1) 2014 $0 (2) 0 0 0 10 (3) 300 0 2015 $0 400 250 250 100 300 (4) 0 2016 $ 0 0 0 0 0 350 460 Total $0 $737 $310 $1,300 $810 Note: As of December 31, 2011 ( 1) Excludes $1.15 billion of junior subordinated notes due 2018 that are a component of PPL’s 2010 Equity Units and may be put back to PPL Capital Funding if the remarketing in 2013 is not successful. ( 2) Excludes $978 million of junior subordinated notes due 2019 that are a component of PPL’s 2011 Equity Units and may be put back to PPL Capital Funding if the remarketing in 2014 is not successful. ( 3) Bonds defeased in substance in 2008 by depositing sufficient funds with the trustee. ( 4) Represents REset Put Securities due 2035 that are required to be put by the holders in October 2015 either for (a) purchase and remarketing by a remarketing dealer or (b) repurchase by PPL Energy Supply. ©PPL Corporation 2012 26
©PPL Corporation 2012
27
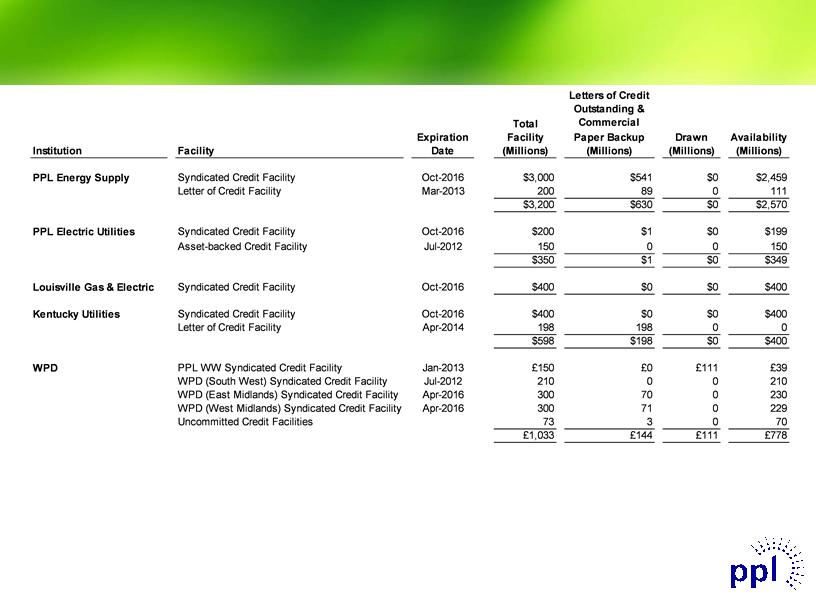
Note: As of December 31, 2011
· Credit facilities consist of a diverse bank group, with no bank and its affiliates providing an aggregate commitment of more than
9% of the total committed capacity for the domestic facilities and 17% of the total committed capacity for WPD’s facilities.
9% of the total committed capacity for the domestic facilities and 17% of the total committed capacity for WPD’s facilities.
(1) In January 2012, WPD (South West) entered into a £245 million syndicated credit facility to replace its existing £210 million
syndicated credit facility.
syndicated credit facility.
(1)
(1)
Liquidity Profile
©PPL Corporation 2012
28
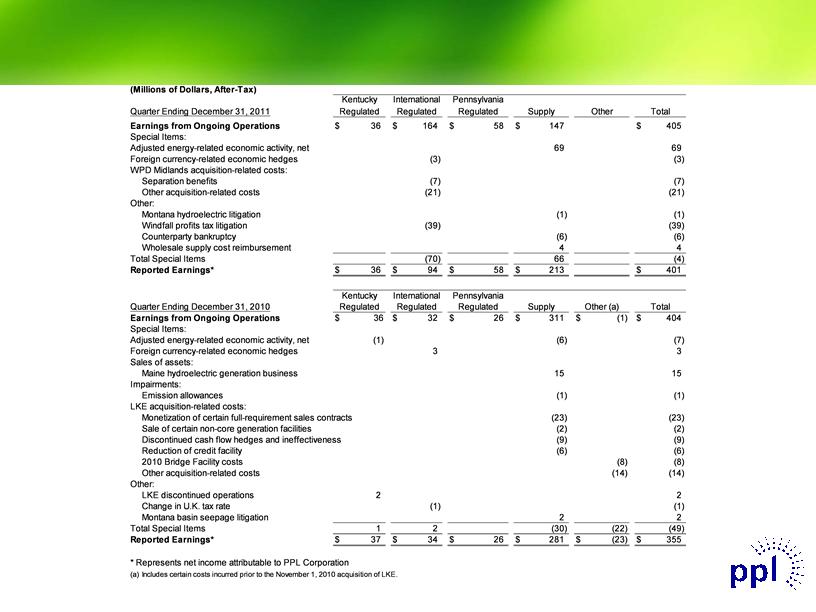
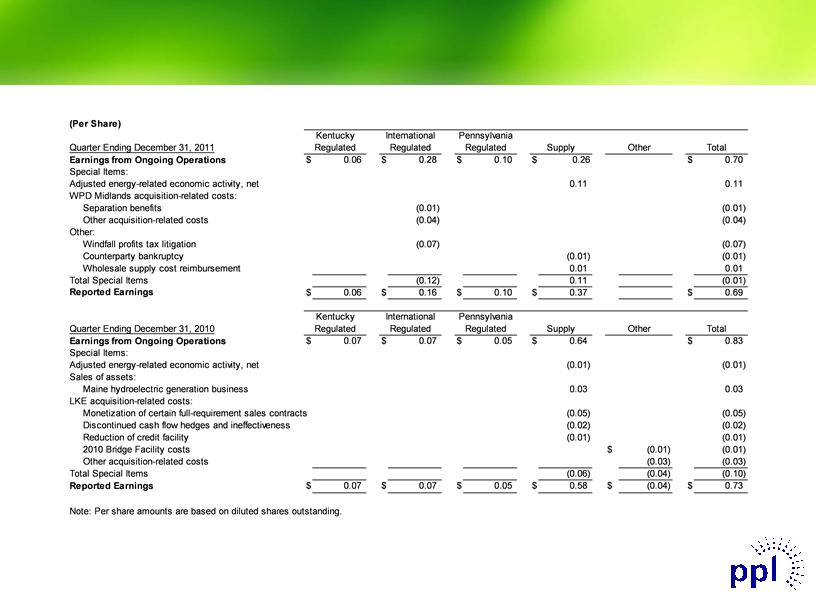
Reconciliation of Fourth Quarter Earnings from
Ongoing Operations to Reported Earnings
Ongoing Operations to Reported Earnings
Reconciliation of Fourth Quarter Earnings from Reconciliation of Fourth Quarter Earnings from Reconciliation of Fourth Quarter Earnings from Ongoing Operations to Reported Earnings Ongoing Operations to Reported Earnings Ongoing Operations to Reported Earnings (Millions of Dollars, After-Tax) Kentucky International Pennsylvania Quarter Ending December 31, 2011 Regulated Regulated Regulated Supply Other Total Earnings from Ongoing Operations $ 36 $ 164 $ 58 $ 147 $ 405 Special Items: Adjusted energy-related economic activity, net 69 69 Foreign currency-related economic hedges (3) (3) WPD Midlands acquisition-related costs: Separation benefits ( 7) (7) Other acquisition-related costs (21) (21) Other: Montana hydroelectric litigation (1) (1) Windfall profits tax litigation (39) (39) Counterparty bankruptcy (6) (6) Wholesale supply cost reimbursement 4 4 Total Special Items (70) 66 (4) Reported Earnings* $ 36 $ 94 $ 58 $ 213 $ 401 Pennsylvania International Kentucky Quarter Ending December 31, 2010 Other (a) Regulated Regulated Supply Regulated Total Earnings from Ongoing Operations $ 36 $ 32 $ 26 $ 311 $ (1) $ 404 Special Items: Adjusted energy-related economic activity, net (1) ( 6) (7) Foreign currency-related economic hedges 3 3 Sales of assets: Maine hydroelectric generation business 15 15 Impairments: Emission allowances (1) (1) LKE acquisition- related costs: Monetization of certain full-requirement sales contracts ( 23) (23) Sale of certain non-core generation facilities (2) (2) Discontinued cash flow hedges and ineffectiveness (9) (9) Reduction of credit facility (6) (6) 2010 Bridge Facility costs (8) (8) Other acquisition-related costs (14) (14) Other: LKE discontinued operations 2 2 Change in U.K. tax rate (1) (1) Montana basin seepage litigation 2 2 Total Special Items 1 2 (30) (22) (49) Reported Earnings* $ 37 $ 34 $ 26 $ 281 $ (23) $ 355 * Represents net income attributable to PPL Corporation (a) Includes certain costs incurred prior to the November 1, 2010 acquisition of LKE. ©PPL Corporation 2012 28
©PPL Corporation 2012
29
Reconciliation of Fourth Quarter Earnings from
Ongoing Operations to Reported Earnings
Ongoing Operations to Reported Earnings
©PPL Corporation 2012
30
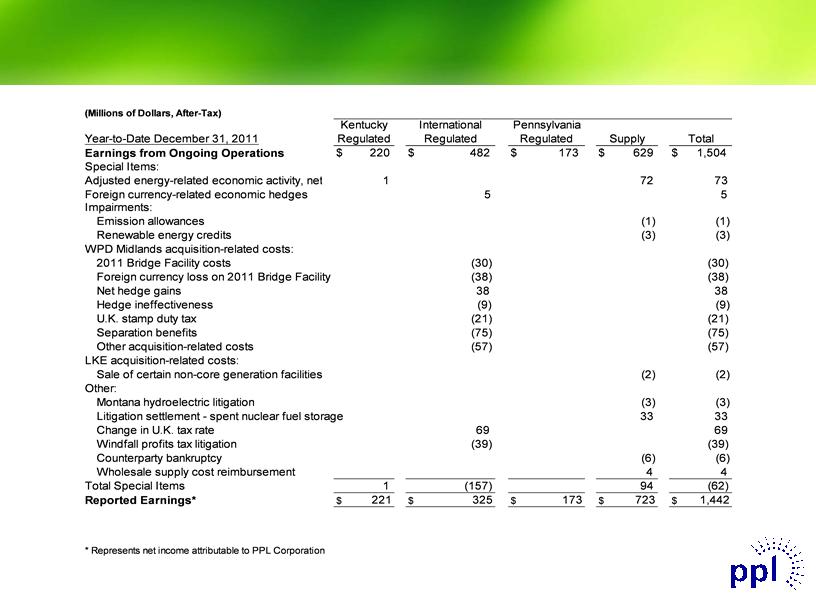
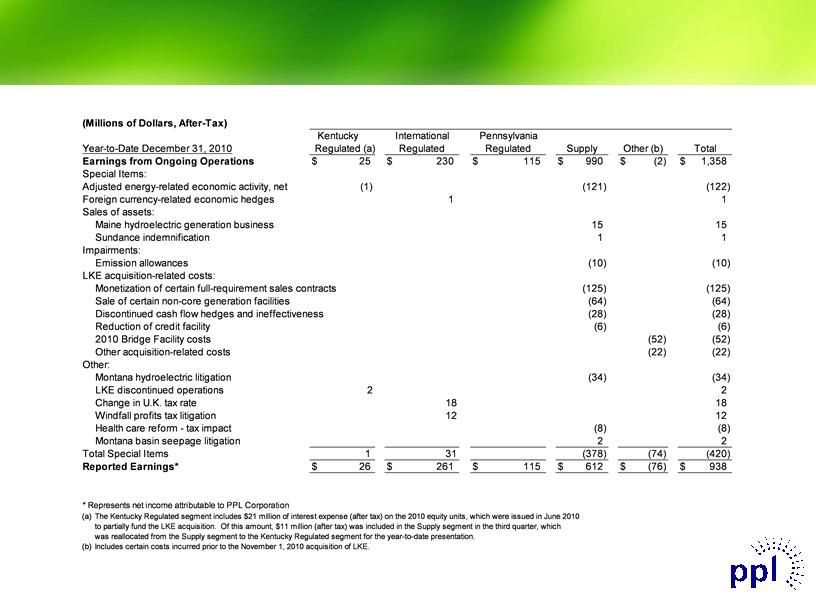
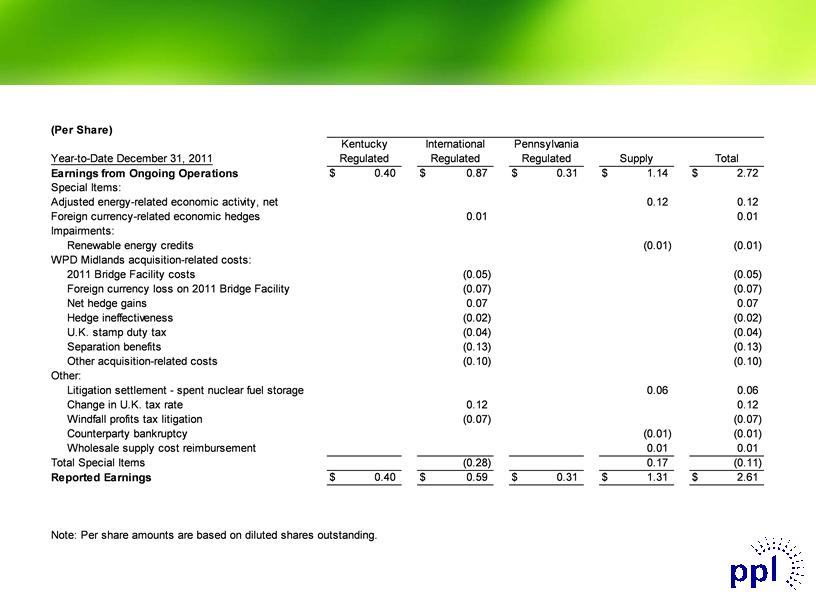
Reconciliation of Year-to-Date Earnings from
Ongoing Operations to Reported Earnings
Ongoing Operations to Reported Earnings
Reconciliation of Year Reconciliation of Year-- to to-- Date Earnings from Date Earnings from Ongoing Operations to Reported Earnings Ongoing Operations to Reported Earnings Reconciliation of Year Reconciliation of Year-- to to-- Date Earnings from Date Earnings from Ongoing Operations to Reported Earnings Ongoing Operations to Reported Earnings ( Millions of Dollars, After- Tax) Kentucky International Pennsylvania Year-to- Date December 31, 2011 Regulated Regulated Regulated Supply Total Earnings from Ongoing Operations $ 220 $ 482 $ 173 $ 629 $ 1,504 Special Items: Adjusted energy-related economic activity, net 1 72 73Foreign currency-related economic hedges 5 5 Impairments: Emission allowances (1) (1) Renewable energy credits (3) (3) WPD Midlands acquisition-related costs: 2011 Bridge Facility costs ( 30) ( 30) Foreign currency loss on 2011 Bridge Facility ( 38) ( 38) Net hedge gains 38 38 Hedge ineffectiveness ( 9) ( 9) U. K. stamp duty tax (21) (21) Separation benefits (75) (75) Other acquisition- related costs (57) (57) LKE acquisition-related costs: Sale of certain non-core generation facilities ( 2) ( 2) Other: Montana hydroelectric litigation ( 3) ( 3) Litigation settlement - spent nuclear fuel storage 33 33 Change in U. K. tax rate 69 69 Windfall profits tax litigation (39) (39) Counterparty bankruptcy (6) (6) Wholesale supply cost reimbursement 4 4 Total Special Items 1 (157) 94 (62) Reported Earnings* $ 221 $ 325 $ 173 $ 723 $ 1,442 * Represents net income attributable to PPL Corporation ©PPL Corporation 2012 30
©PPL Corporation 2012
31
Reconciliation of Year-to-Date Earnings from
Ongoing Operations to Reported Earnings
Ongoing Operations to Reported Earnings
Reconciliation of Year Reconciliation of Year-- to to-- Date Earnings from Date Earnings from Ongoing Operations to Reported Earnings Ongoing Operations to Reported Earnings Reconciliation of Year Reconciliation of Year-- toto-- Date Earnings fromDate Earnings from Ongoing Operations to Reported Earnings Ongoing Operations to Reported Earnings Kentucky (Millions of Dollars, After-Tax) International Pennsylvania Regulated ( a) Year-to- Date December 31, 2010 Regulated Regulated Supply Other (b) Total $ 25 Special Items: Earnings from Ongoing Operations $ 230 $ 115 $ 990 $ (2) $ 1,358 (1) Adjusted energy-related economic activity, net (121) (122) Foreign currency-related economic hedges 1 1 Sales of assets: Maine hydroelectric generation business 15 15 Sundance indemnification 1 1 Impairments: Emission allowances (10) (10) LKE acquisition- related costs: Monetization of certain full- requirement sales contracts ( 125) (125) Sale of certain non- core generation facilities ( 64) (64) Discontinued cash flow hedges and ineffectiveness ( 28) (28) Reduction of credit facility (6) (6) 2010 Bridge Facility costs (52) (52) Other acquisition-related costs (22) (22) Other: Montana hydroelectric litigation (34) (34) LKE discontinued operations 2 2 Change in U.K. tax rate 18 18 Windfall profits tax litigation 12 12 Health care reform - tax impact (8) (8) Montana basin seepage litigation 2 2 1Total Special Items 31 (378) (74) (420) $ 26Reported Earnings $ 261 $ 115 $ 612 $ (76) $ 938 * Represents net income attributable to PPL Corporation (a) The Kentucky Regulated segment includes $21 million of interest expense ( after tax) on the 2010 equity units, which were issued in June 2010 to partially fund the LKE acquisition. Of this amount, $11 million ( after tax) was included in the Supply segment in the third quarter, which was reallocated from the Supply segment to the Kentucky Regulated segment for the year- to- date presentation. (b) Includes certain costs incurred prior to the November 1, 2010 acquisition of LKE. ©PPL Corporation 2012 31
©PPL Corporation 2012
32
Reconciliation of Year-to-Date Earnings from
Ongoing Operations to Reported Earnings
Ongoing Operations to Reported Earnings
Reconciliation of Year Reconciliation of Year Reconciliation of Year Reconciliation of Year Reconciliation of Year- -- to to to- -- Date Earnings from Date Earnings from Date Earnings from Ongoing Operations to Reported Earnings Ongoing Operations to Reported Earnings Ongoing Operations to Reported Earnings (Per Share) Kentucky International Pennsylvania Year-to-Date December 31, 2011 Regulated Regulated Regulated Supply Total Earnings from Ongoing Operations $ 0.40 $ 0.87 $ 0.31 $ 1.14 $ 2.72 Special Items: Adjusted energy-related economic activity, net 0.12 0.12 Foreign currency-related economic hedges 0.01 0.01 Impairments: Renewable energy credits (0.01) (0.01) WPD Midlands acquisition-related costs: 2011 Bridge Facility costs (0.05) (0.05) Foreign currency loss on 2011 Bridge Facility (0.07) (0.07) Net hedge gains 0.07 0.07 Hedge ineffectiveness ( 0.02) (0.02) U. K. stamp duty tax (0.04) (0.04) Separation benefits (0.13) (0.13) Other acquisition-related costs (0.10) (0.10) Other: Litigation settlement - spent nuclear fuel storage 0.06 0.06 Change in U. K. tax rate 0.12 0.12 Windfall profits tax litigation (0.07) (0.07) Counterparty bankruptcy (0.01) (0.01) Wholesale supply cost reimbursement 0.01 0.01 Total Special Items (0.28) 0.17 (0.11) Reported Earnings $ 0.40 $ 0.59 $ 0.31 $ 1.31 $ 2.61 Note: Per share amounts are based on diluted shares outstanding. ©PPL Corporation 2012 32
©PPL Corporation 2012
33
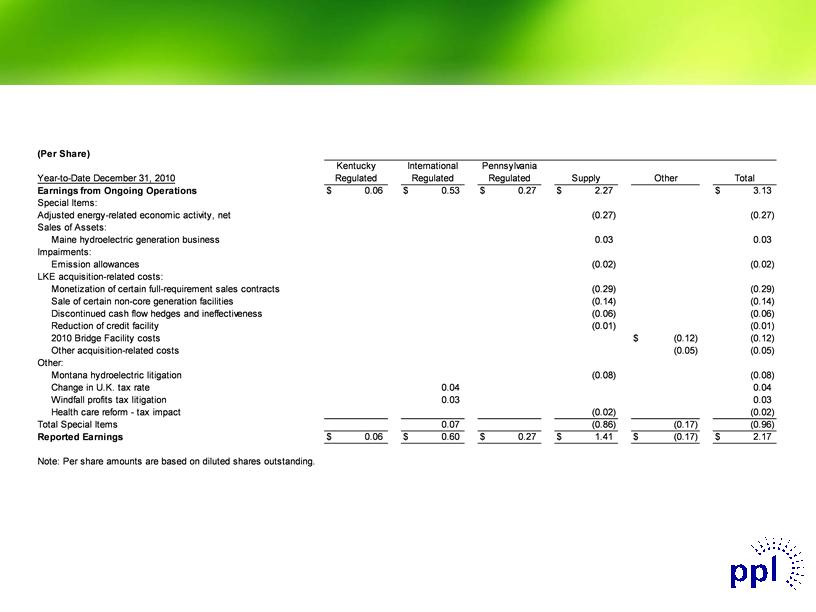
Reconciliation of Year-to-Date Earnings from
Ongoing Operations to Reported Earnings
Ongoing Operations to Reported Earnings
Reconciliation of Year Reconciliation of Year-- to to-- Date Earnings from Date Earnings from Ongoing Operations to Reported Earnings Ongoing Operations to Reported Earnings Reconciliation of Year Reconciliation of Year-- to to-- Date Earnings from Date Earnings from Ongoing Operations to Reported Earnings Ongoing Operations to Reported Earnings (Per Share) Sales of Assets: Maine hydroelectric generation business Emission allowances Monetization of certain full-requirement sales contracts Sale of certain non-core generation facilities Discontinued cash flow hedges and ineffectiveness Reduction of credit facility 2010 Bridge Facility costs Other acquisition-related costs LKE acquisition- related costs: Earnings from Ongoing Operations Special Items: Adjusted energy-related economic activity, net Year- to-Date December 31, 2010 Impairments: Other: $ 0.06 Kentucky Regulated $ 0.53 International Regulated $ 0.27 Pennsylvania Regulated $ 2.27 (0.27) 03 (0.02) (0.29) (0.14) (0.06) (0.01) Supply $ ( 0.12) (0.05) Other $ 3.13 (0.27) 0.03 (0.02) (0.29) (0.14) (0.06) (0.01) (0.12) (0.05) Total Montana hydroelectric litigation Change in U. K. tax rate Windfall profits tax litigation Health care reform - tax impact Total Special Items Reported Earnings $ 0.06 0.04 0.03 0.07 $ 0.60 $ 0.27 $ (0.08) (0.02) (0.86) 1.41 $ (0.17) (0.17) $ (0.08) 0.04 0.03 (0.02) (0.96) 2.17 Note: Per share amounts are based on diluted shares outstanding. ©PPL Corporation 2012 33
©PPL Corporation 2012
34
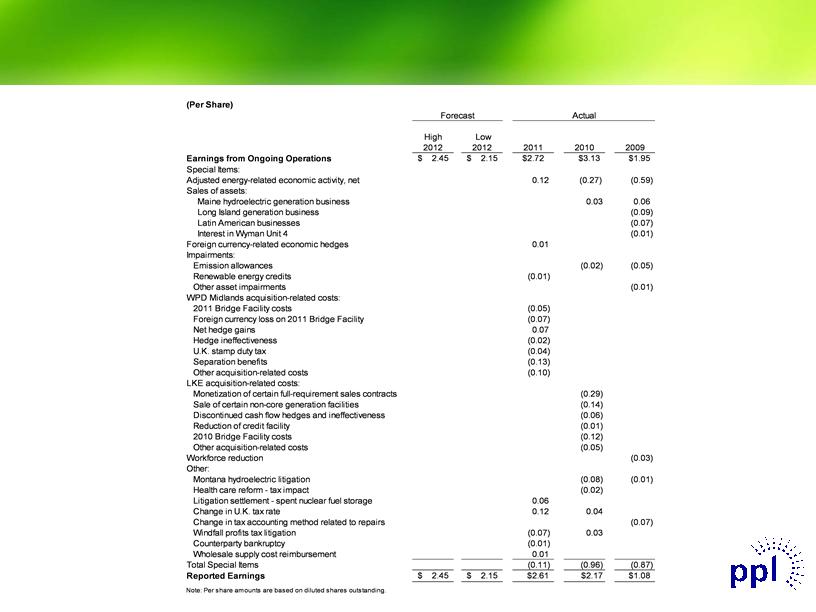
Reconciliation of PPL’s Earnings from Ongoing
Operations to Reported Earnings
Operations to Reported Earnings
Reconciliation of PPL Reconciliation of PPL Reconciliation of PPL Reconciliation of PPL Reconciliation of PPL’ ’’ s Earnings from Ongoing s Earnings from Ongoings Earnings from Ongoing Operations to Reported Earnings Operations to Reported Earnings Operations to Reported Earnings (Per Share) Forecast Actual High Low 2012 2012 2011 2010 2009 Earnings from Ongoing Operations $ 2.45 $ 2.15 $2.72 $3.13 $1.95 Special Items: Adjusted energy-related economic activity, net 0.12 ( 0.27) (0.59) Sales of assets: Maine hydroelectric generation business 0.03 0.06 Long Island generation business (0.09) Latin American businesses (0.07) Interest in Wyman Unit 4 (0.01) Foreign currency-related economic hedges 0.01 Impairments: Emission allowances ( 0.02) ( 0.05) Renewable energy credits ( 0.01) Other asset impairments (0.01) WPD Midlands acquisition-related costs: 2011 Bridge Facility costs ( 0.05) Foreign currency loss on 2011 Bridge Facility ( 0.07) Net hedge gains 0.07 Hedge ineffectiveness ( 0.02) U. K. stamp duty tax ( 0.04) Separation benefits ( 0.13) Other acquisition-related costs ( 0.10) LKE acquisition-related costs: Monetization of certain full- requirement sales contracts ( 0.29) Sale of certain non-core generation facilities ( 0.14) Discontinued cash flow hedges and ineffectiveness ( 0.06) Reduction of credit facility ( 0.01) 2010 Bridge Facility costs ( 0.12) Other acquisition-related costs ( 0.05) Workforce reduction (0.03) Other: Montana hydroelectric litigation ( 0.08) (0.01) Health care reform - tax impact ( 0.02) Litigation settlement - spent nuclear fuel storage 0.06 Change in U. K. tax rate 0.12 0.04 Change in tax accounting method related to repairs (0.07) Windfall profits tax litigation ( 0.07) 0.03 Counterparty bankruptcy ( 0.01) Wholesale supply cost reimbursement 0.01 Total Special Items ( 0.11) ( 0.96) ( 0.87) Reported Earnings $ 2.45 $ 2.15 $2.61 $2.17 $1.08 ©PPL Corporation 2012 Note: Per share amounts are based on diluted shares outstanding. 34
©PPL Corporation 2012
35
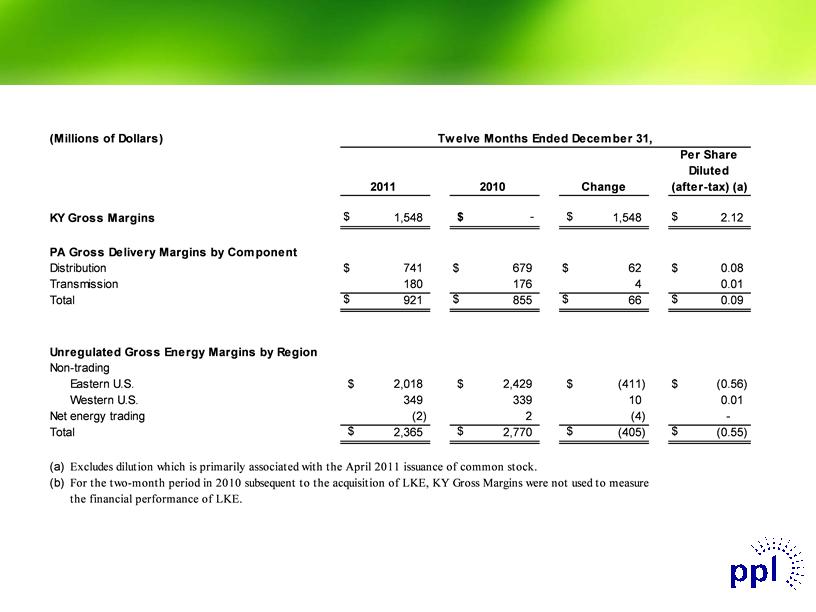
Gross Margins Summary
Gross Margins Summary Gross Margins Summary Gross Margins Summary Gross Margins Summary ( Millions of Dollars) Twelve Months Ended December 31, Per Share Diluted 2011 2010 Change (after-tax) (a) KY Gross Margins $ 1,548 $ - $ 1,548 $ 2.12 PA Gross Delivery Margins by Component Distribution $ 741 $ 679 $ 62 $ 0.08 Transmission 180 176 4 0.01 Total $ 921 $ 855 $ 66$ 0.09 Unregulated Gross Energy Margins by Region Non- trading Eastern U. S. $ 2,018 $ 2,429 $ ( 411) $ ( 0.56) Western U. S. 349 339 10 0.01 Net energy trading (2) 2 (4) Total $ 2,365 $ 2,770 $ (405) $ (0.55) ( a) Excludes dilution which is primarily associated with the April 2011issuance of common stock. ( b) For the tw o- month period in 2010 subsequent to the acquisition of LKE, KY Gross Margins w ere not used to measure the financial performance of LKE. ©PPL Corporation 2012 35
©PPL Corporation 2012
36
Reconciliation of Year-to-Date
Operating Income to Margins
Operating Income to Margins
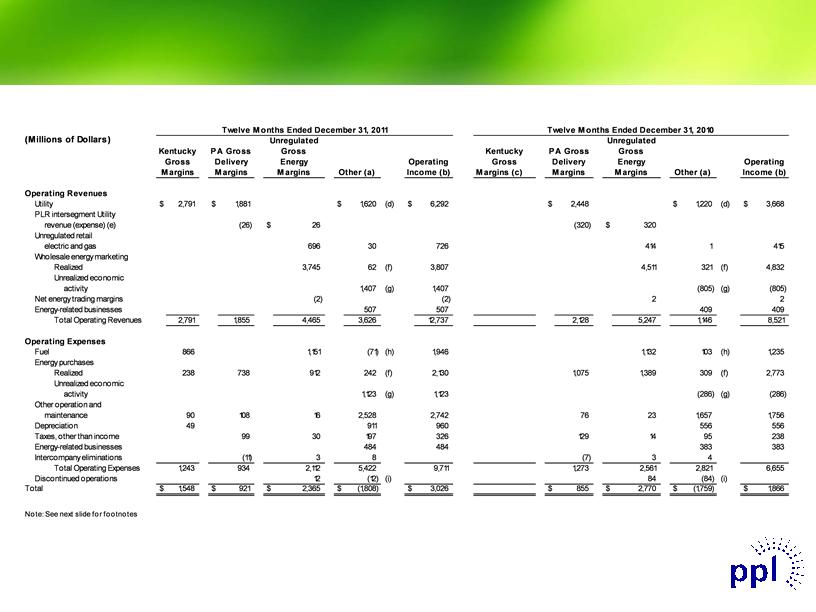
Reconciliation of Year Reconciliation of Year-to to-Date Date Operating Income to Margins Operating Income to Margins Reconciliation of Year Reconciliation of Year-- to to-- Date Date Operating Income to Margins Operating Income to Margins Twelve Months Ended December 31, 2011 Twelve Months Ended December 31, 2010 ( Millions of Dollars) Unregulated Unregulated Kentucky PA Gross Gross Kentucky PA Gross Gross Gross Delivery Energy Operating Gross Delivery Energy Operating Margins Margins Margins Other ( a) Income ( b) Margins ( c) Margins Margins Other ( a) Income ( b) Operating Revenues Utility $ 2,791 $ 1,881 $ 1,620 ( d) $ 6,292 $ 2,448 $ 1,220 ( d) $ 3,668 PLR intersegment Utility revenue (expense) ( d) ( 26) $ 26 (320) $ 320 Unregulated retail 415 415 electric and gas 696 30 726 414 (414) Wholesale energy marketing Realized 3,745 62 ( f) 3,807 4,511 321 ( f) 4,832 Unrealized economic activity 1,407 ( g) 1,407 (805) (g) (805) Net energy trading margins (2) (2) 2 2 Energy- related businesses 507 507 409 409 Total Operating Revenues 2,791 1,855 4,465 3,626 12,737 2,128 5,247 1,146 8,521 Operating Expenses Fuel 866 1,151 (71) ( h) 1,946 1,132 103 ( h) 1,235 Energy purchases Realized 238 738 912 242 ( f) 2,130 1,075 1,389 309 ( f) 2,773 Unrealized economic activity 1,123 ( g) 1,123 (286) (g) (286) Other operation and maintenance 90 108 16 2,528 2,742 76 23 1,657 1,756 Depreciation 49 911 960 556 556 Taxes, other than income 99 30 197 326 129 14 95 238 Energy- related businesses 484 484 383 383 Intercompany eliminations (11) 3 8 (7) 3 4 Total Operating Expenses 1,243 934 2,112 5,422 9,711 1,273 2,561 2,821 6,655 Discontinued operations 12 (12) (i) 84 (84) (i) Total $ 1,548 $ 921 $ 2,365 $ (1,808) $ 3,026 $ 855 $ 2,770 $ ( 1,759) $ 1,866 Note: See next slide for footnotes ©PPL Corporation 2012 36

©PPL Corporation 2012
37
Margins Footnotes
a) Represents amounts that are excluded from Margins.
b) As reported on the Statement of Income.
c) Kentucky Gross Margins were not used to measure the financial performance of LKE for the
two-month period subsequent to the acquisition in 2010.
two-month period subsequent to the acquisition in 2010.
d) Primarily represents WPD's utility revenue. 2010 also includes LKE’s utility revenues.
e) Primarily related to PLR supply sold by PPL EnergyPlus to PPL Electric.
f) Represents energy-related economic activity as described in "Commodity Price Risk (Non-
trading) - Economic Activity" within Note 19 to the Financial Statements. For 2011,
“Wholesale energy marketing - Realized” and "Energy purchases - Realized" include a net
pre-tax gain of $19 million related to the amortization of option premiums and a net pre-tax
loss of $216 million related to the monetization of certain full-requirement sales contracts.
2010 includes a net pre-tax gain of $32 million related to the amortization of option
premiums and a net pre-tax gain of $37 million related to the monetization of certain full-
requirement sales contracts. 2009 includes a net pre-tax loss of $54 million related to the
amortization of option premiums.
g) Represents energy-related economic activity as described in "Commodity Price Risk (Non-
trading) - Economic Activity" within Note 19 to the Financial Statements.
trading) - Economic Activity" within Note 19 to the Financial Statements.
h) Includes economic activity related to fuel. 2011 includes credits of $57 million for the spent
nuclear fuel litigation settlement.
nuclear fuel litigation settlement.
i) Represents the net of certain revenues and expenses associated with certain businesses
that are classified as discontinued operations. These revenues and expenses are not
reflected in "Operating Income" on the Statements of Income.
that are classified as discontinued operations. These revenues and expenses are not
reflected in "Operating Income" on the Statements of Income.

©PPL Corporation 2012
38
Statements contained in this presentation, including statements with respect to future earnings, cash flows, financing, regulation and
corporate strategy are "forward-looking statements" within the meaning of the federal securities laws. Although PPL Corporation
believes that the expectations and assumptions reflected in these forward-looking statements are reasonable, these statements are
subject to a number of risks and uncertainties, and actual results may differ materially from the results discussed in the statements.
The following are among the important factors that could cause actual results to differ materially from the forward-looking statements:
market demand and prices for energy, capacity and fuel; weather conditions affecting customer energy usage and operating costs;
competition in power markets; the effect of any business or industry restructuring; the profitability and liquidity of PPL Corporation, its
subsidiaries and customers; new accounting requirements or new interpretations or applications of existing requirements; operating
performance of plants and other facilities; the length of scheduled and unscheduled outages at our generating plants; environmental
conditions and requirements and the related costs of compliance, including environmental capital expenditures and emission
allowance and other expenses; system conditions and operating costs; development of new projects, markets and technologies;
performance of new ventures; asset or business acquisitions and dispositions, and PPL Corporation’s ability to realize the expected
benefits from acquired businesses, including the 2010 acquisition of Louisville Gas and Electric Company and Kentucky Utilities
Company and the 2011 acquisition of the Central Networks electricity distribution businesses in the U.K.; any impact of hurricanes or
other severe weather on our business, including any impact on fuel prices; receipt of necessary government permits, approvals, rate
relief and regulatory cost recovery; capital market conditions and decisions regarding capital structure; the impact of state, federal or
foreign investigations applicable to PPL Corporation and its subsidiaries; the outcome of litigation against PPL Corporation and its
subsidiaries; stock price performance; the market prices of equity securities and the impact on pension income and resultant cash
funding requirements for defined benefit pension plans; the securities and credit ratings of PPL Corporation and its subsidiaries;
political, regulatory or economic conditions in states, regions or countries where PPL Corporation or its subsidiaries conduct business,
including any potential effects of threatened or actual terrorism or war or other hostilities; foreign exchange rates; new state, federal or
foreign legislation, including new tax legislation; and the commitments and liabilities of PPL Corporation and its subsidiaries. Any such
forward-looking statements should be considered in light of such important factors and in conjunction with PPL Corporation's Form 10-
K and other reports on file with the Securities and Exchange Commission.
Forward-Looking Information Statement

©PPL Corporation 2012
39
“Earnings from ongoing operations” should not be considered as an alternative to reported earnings, or net income attributable to PPL, which is an
indicator of operating performance determined in accordance with generally accepted accounting principles (GAAP). PPL believes that “earnings from
ongoing operations,” although a non-GAAP financial measure, is also useful and meaningful to investors because it provides management’s view of
PPL’s fundamental earnings performance as another criterion in making investment decisions. PPL’s management also uses “earnings from ongoing
operations” in measuring certain corporate performance goals. Other companies may use different measures to present financial performance.
“Earnings from ongoing operations” is adjusted for the impact of special items. Special items include:
• Energy-related economic activity (as discussed below).
• Foreign currency-related economic hedges.
• Gains and losses on sales of assets not in the ordinary course of business.
• Impairment charges (including impairments of securities in the company’s nuclear decommissioning trust funds).
• Workforce reduction and other restructuring impacts.
• Acquisition-related costs and charges.
• Other charges or credits that are, in management’s view, not reflective of the company’s ongoing operations.
Energy-related economic activity includes the changes in fair value of positions used economically to hedge a portion of the economic value of PPL’s
generation assets, full-requirement sales contracts and retail activities. This economic value is subject to changes in fair value due to market price
volatility of the input and output commodities (e.g., fuel and power) prior to the delivery period that was hedged. Also included in energy-related
economic activity is the ineffective portion of qualifying cash flow hedges, the monetization of certain full-requirement sales contracts and premium
amortization associated with options. This economic activity is deferred, with the exception of the full-requirement sales contracts that were
monetized, and included in earnings from ongoing operations over the delivery period of the item that was hedged or upon realization. Management
believes that adjusting for such amounts provides a better matching of earnings from ongoing operations to the actual amounts settled for PPL’s
underlying hedged assets. Please refer to the Notes to the Financial Statements and MD&A in PPL Corporation’s periodic filings with the Securities
and Exchange Commission for additional information on energy-related economic activity.
Free cash flow before dividends is derived by deducting capital expenditures and other investing activities-net, from cash flow from operations. Free
cash flow before dividends should not be considered as an alternative to cash flow from operations, which is determined in accordance with GAAP.
PPL believes that free cash flow before dividends, although a non-GAAP measure, is an important measure to both management and investors, as it
is an indicator of the company's ability to sustain operations and growth without additional outside financing beyond the requirement to fund maturing
debt obligations. Other companies may calculate free cash flow before dividends in a different manner.
Definitions of Non-GAAP Financial Measures

©PPL Corporation 2012
40
"Kentucky Gross Margins" is a single financial performance measure of the Kentucky Regulated segment's electricity generation, transmission and
distribution operations as well as its distribution and sale of natural gas. In calculating this measure, utility revenues and expenses associated with
approved cost recovery tracking mechanisms are offset. Certain costs associated with these mechanisms, primarily ECR and DSM, are recorded as
"Other operation and maintenance" expense and the depreciation associated with ECR equipment is recorded as "Depreciation" expense. These
mechanisms allow for recovery of certain expenses, returns on capital investments and performance incentives. As a result, this measure
represents the net revenues from the Kentucky Regulated segment's operations.
"Pennsylvania Gross Delivery Margins" is a single financial performance measure of the Pennsylvania Regulated segment's electric delivery
operations, which includes transmission and distribution activities. In calculating this measure, utility revenues and expenses associated with
approved recovery mechanisms, including energy provided as a PLR, are offset with minimal impact on earnings. Costs associated with these
mechanisms are recorded in "Energy purchases," "Other operation and maintenance," which is primarily Act 129 costs, and in "Taxes, other than
income," which is primarily gross receipts tax. This performance measure includes PLR energy purchases by PPL Electric from PPL EnergyPlus,
which are reflected in "PLR intersegment Utility revenue (expense)." These mechanisms allow for recovery of certain expenses; therefore, certain
expenses and revenues offset with minimal impact on earnings. As a result, this measure represents the net revenues from the Pennsylvania
Regulated segment's electric delivery operations.
"Unregulated Gross Energy Margins" is a single financial performance measure of the Supply segment's competitive energy non-trading and trading
activities. In calculating this measure, the Supply segment's energy revenues, which include operating revenues associated with certain Supply
segment businesses that are classified as discontinued operations, are offset by the cost of fuel, energy purchases, certain other operation and
maintenance expenses, primarily ancillary charges, gross receipts tax, which is recorded in "Taxes, other than income," and operating expenses
associated with certain Supply segment businesses that are classified as discontinued operations. This performance measure is relevant to PPL
due to the volatility in the individual revenue and expense lines on the Statements of Income that comprise "Unregulated Gross Energy Margins."
This volatility stems from a number of factors, including the required netting of certain transactions with ISOs and significant swings in unrealized
gains and losses. Such factors could result in gains or losses being recorded in either "Wholesale energy marketing" or "Energy purchases" on the
Statements of Income. This performance measure includes PLR revenues from energy sales to PPL Electric by PPL EnergyPlus, which are
reflected in "PLR intersegment Utility revenue (expense)." PPL excludes from "Unregulated Gross Energy Margins" the Supply segment's energy-
related economic activity, which includes the changes in fair value of positions used to economically hedge a portion of the economic value of PPL's
competitive generation assets, full-requirement sales contracts and retail activities. This economic value is subject to changes in fair value due to
market price volatility of the input and output commodities (e.g., fuel and power) prior to the delivery period that was hedged. Also included in this
energy-related economic activity is the ineffective portion of qualifying cash flow hedges, the monetization of certain full-requirement sales contracts
and premium amortization associated with options. This economic activity is deferred, with the exception of the full-requirement sales contracts that
were monetized, and included in unregulated gross energy margins over the delivery period that was hedged or upon realization.
Definitions of Non-GAAP Financial Measures