Attached files
| file | filename |
|---|---|
| 8-K - FORM 8-K - MALVERN FEDERAL BANCORP INC | t72475_8k.htm |
 |
M A L V E R N
Annual Meeting
February 9, 2012
|
 |
M A L V E R N
Forward-Looking Statements
Certain comments in this presentation contain certain forward looking statements (as defined in the Securities Exchange Act of 1934 and the regulations hereunder). Forward looking statements are not historical facts but instead represent only the beliefs, expectations or opinions of Malvern Federal Bancorp, Inc. and its management regarding future events, many of which, by their nature, are inherently uncertain. Forward looking statements may be identified by the use of such words as: “believe”, “expect”, “anticipate”, “intend”, “plan”, “estimate”, or words of similar meaning, or future or conditional terms such as “will”, “would”, “should”, “could”, “may”, “likely”, “probably”, or “possibly.” Forward looking statements include, but are not limited to, financial projections and estimates and their underlying assumptions; statements regarding plans, objectives and expectations with respect to future operations, products and services; and statements regarding future performance. Such statements are subject to certain risks, uncertainties and assumption, many of which are difficult to predict and generally are beyond the control of Malvern Federal Bancorp, Inc. and its management, that could cause actual results to differ materially from those expressed in, or implied or projected by, forward looking statements. The following factors, among others, could cause actual results to differ materially from the anticipated results or other expectations expressed in the forward looking statements: (1) economic and competitive conditions which could affect the volume of loan originations, deposit flows and real estate values; (2) the levels of non-interest income and expense and the amount of loan losses; (3) competitive pressure among depository institutions increasing significantly; (4) changes in the interest rate environment causing reduced interest margins; (5) general economic conditions, either nationally or in the markets in which Malvern Federal Bancorp, Inc. is or will be doing business, being less favorable than expected;(6) political and social unrest, including acts of war or terrorism; or (7) legislation or changes in regulatory requirements adversely affecting the business in which Malvern Federal Bancorp, Inc. is engaged. Malvern Federal Bancorp, Inc. undertakes no obligation to update these forward looking statements to reflect events or circumstances that occur after the date on which such statements were made.
As used in this report, unless the context otherwise requires, the terms “we,” “our,” “us,” or the “Company” refer to Malvern Federal Bancorp, Inc., a Federal corporation, and the term the “Bank” refers to Malvern Federal Savings Bank, a federally chartered savings bank and wholly owned subsidiary of the Company. In addition, unless the context otherwise requires, references to the operations of the Company include the operations of the Bank.
For a more detailed description of the factors that may affect Malvern Federal Bancorp’s operating results or the outcomes described in these forward-looking statements, we refer you to our filings with the Securities and Exchange Commission, including our annual report on Form 10-K for the year ended September 30, 2011. Malvern Federal Bancorp assumes no obligation to update the forward-looking statements made during this presentation. For more information, please visit our Web site www.malvernfederal.com.
2
|
 |
M A L V E R N
Company Overview
|
 |
M A L V E R N
Overview of Malvern Federal Bancorp, Inc.
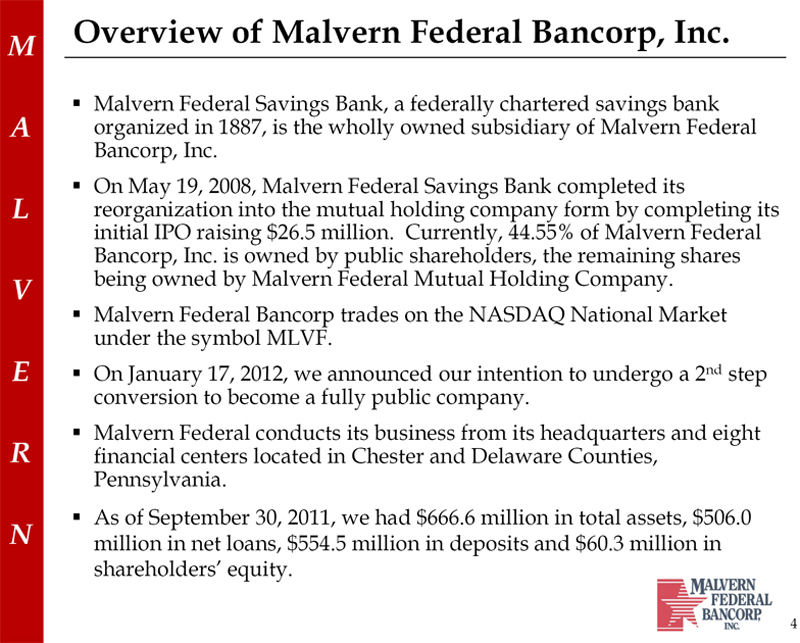
Malvern Federal Savings Bank, a federally chartered savings bank organized in 1887, is the wholly owned subsidiary of Malvern Federal Bancorp, Inc.
On May 19, 2008, Malvern Federal Savings Bank completed its reorganization into the mutual holding company form by completing its initial IPO raising $26.5 million. Currently, 44.55% of Malvern Federal Bancorp, Inc. is owned by public shareholders, the remaining shares being owned by Malvern Federal Mutual Holding Company.
Malvern Federal Bancorp trades on the NASDAQ National Market under the symbol MLVF.
On January 17, 2012, we announced our intention to undergo a 2nd step conversion to become a fully public company.
Malvern Federal conducts its business from its headquarters and eight financial centers located in Chester and Delaware Counties, Pennsylvania.
As of September 30, 2011, we had $666.6 million in total assets, $506.0 million in net loans, $554.5 million in deposits and $60.3 million in shareholders’ equity.
4
|
 |
M A L V E R N
Malvern Federal Savings Bank Branch Locations
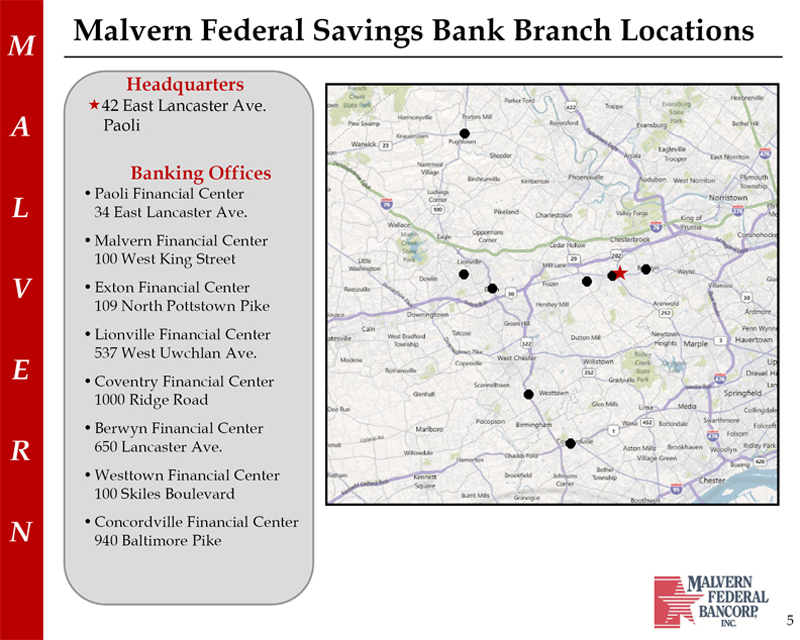
Headquarters
42 East Lancaster Ave.
Paoli
Banking Offices
• Paoli Financial Center 34 East Lancaster Ave.
• Malvern Financial Center 100 West King Street
• Exton Financial Center 109 North Pottstown Pike
• Lionville Financial Center 537 West Uwchlan Ave.
• Coventry Financial Center 1000 Ridge Road
• Berwyn Financial Center 650 Lancaster Ave.
• Westtown Financial Center 100 Skiles Boulevard
• Concordville Financial Center 940 Baltimore Pike
5
|
 |
M A L V E R N
Market Share in Chester County
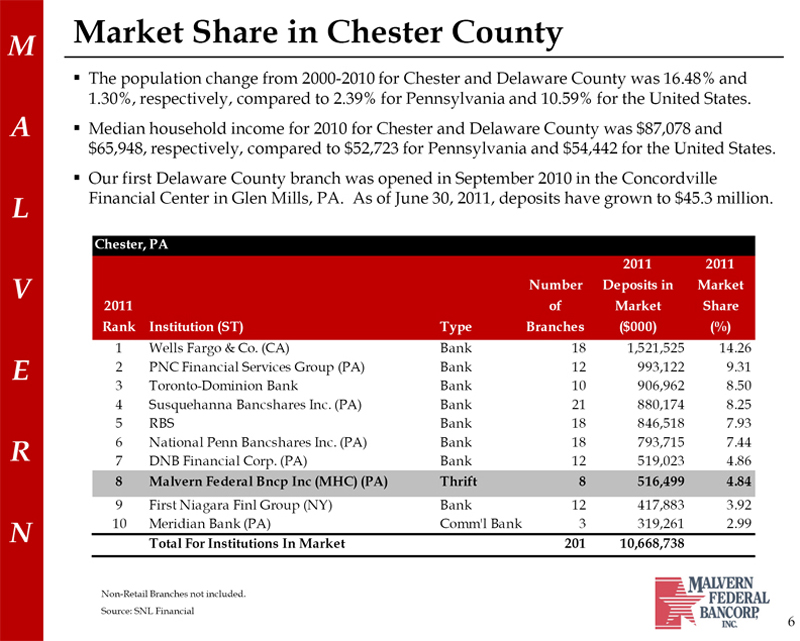
The population change from 2000-2010 for Chester and Delaware County was 16.48% and 1.30%, respectively, compared to 2.39% for Pennsylvania and 10.59% for the United States.
Median household income for 2010 for Chester and Delaware County was $87,078 and $65,948, respectively, compared to $52,723 for Pennsylvania and $54,442 for the United States.
Our first Delaware County branch was opened in September 2010 in the Concordville
Financial Center in Glen Mills, PA. As of June 30, 2011, deposits have grown to $45.3 million.
Chester, PA
2011 2011 Number Deposits in Market 2011 of Market Share Rank Institution (ST) Type Branches ($000) (%)
1 Wells Fargo & Co. (CA) Bank 18 1,521,525 14.26
2 PNC Financial Services Group (PA) Bank 12 993,122 9.31
3 Toronto-Dominion Bank Bank 10 906,962 8.50
4 Susquehanna Bancshares Inc. (PA) Bank 21 880,174 8.25
5 RBS Bank 18 846,518 7.93
6 National Penn Bancshares Inc. (PA) Bank 18 793,715 7.44
7 DNB Financial Corp. (PA) Bank 12 519,023 4.86
8 Malvern Federal Bncp Inc (MHC) (PA) Thrift 8 516,499 4.84
9 First Niagara Finl Group (NY) Bank 12 417,883 3.92
10 Meridian Bank (PA) Comm'l Bank 3 319,261 2.99
Total For Institutions In Market 201 10,668,738
Non-Retail Branches not included.
Source: SNL Financial
6
|
 |
M A L V E R N
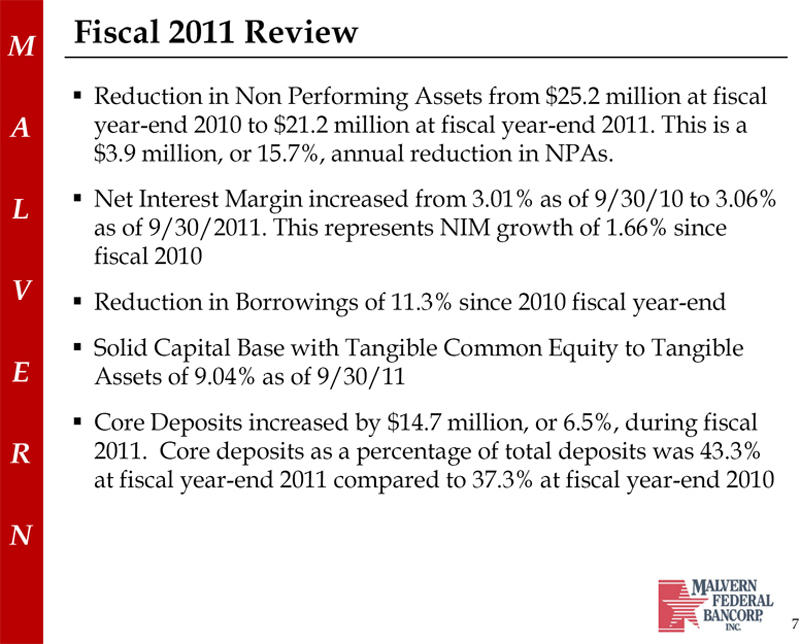
Fiscal 2011 Review
Reduction in Non Performing Assets from $25.2 million at fiscal year-end 2010 to $21.2 million at fiscal year-end 2011. This is a $3.9 million, or 15.7%, annual reduction in NPAs.
Net Interest Margin increased from 3.01% as of 9/30/10 to 3.06% as of 9/30/2011. This represents NIM growth of 1.66% since fiscal 2010
Reduction in Borrowings of 11.3% since 2010 fiscal year-end
Solid Capital Base with Tangible Common Equity to Tangible Assets of 9.04% as of 9/30/11
Core Deposits increased by $14.7 million, or 6.5%, during fiscal 2011. Core deposits as a percentage of total deposits was 43.3% at fiscal year-end 2011 compared to 37.3% at fiscal year-end 2010
7
|
 |
M A L V E R N
Fiscal 2012 Business Strategy
Our business strategy currently is focused on reducing the level of our non-performing assets, monitoring and overseeing our performing classified assets and troubled debt restructurings in an effort to reduce the number of non-performing assets in future periods, complying with the provisions of the Supervisory Agreements and conducting our traditional community-oriented banking business within these constraints.
Below are the highlights of our business strategy in recent years:
Managing the Loan Portfolio with an Emphasis on Retail Lending Growth.
Increasing Our Core Deposits.
Improving Asset Quality.
Continuing to Provide Exceptional Customer Service.
8
|
 |
M A L V E R N
Financial Highlights
|
 |
M A L V E R N
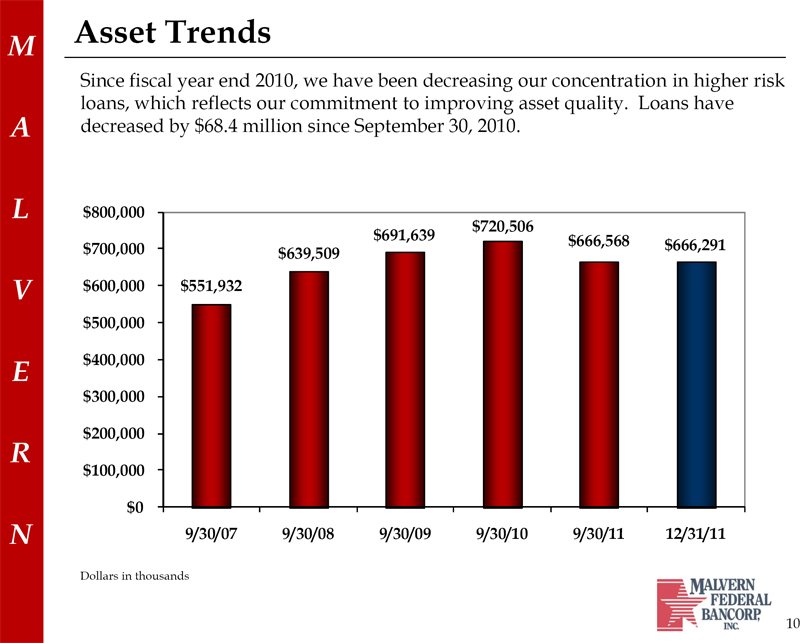
Asset Trends
Since fiscal year end 2010, we have been decreasing our concentration in higher risk loans, which reflects our commitment to improving asset quality. Loans have decreased by $68.4 million since September 30, 2010.
$800,000 $720,506 $691,639
$666,568 $700,000 $666,291
$639,509
$600,000 $551,932 $500,000
$400,000 $300,000 $200,000
$100,000
$0
9/30/07 9/30/08 9/30/09
9/30/10 9/30/11 12/31/11
Dollars in thousands
10
|
 |
M A L V E R N
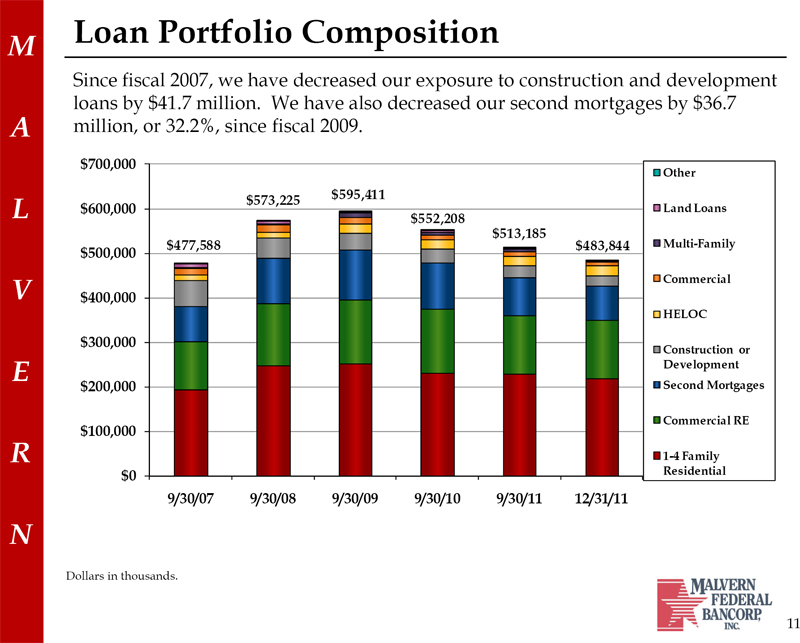
Loan Portfolio Composition
Since fiscal 2007, we have decreased our exposure to construction and development loans by $41.7 million. We have also decreased our second mortgages by $36.7 million, or 32.2%, since fiscal 2009.
$700,000
Other
$595,411 $573,225 $600,000
Land Loans $552,208
$513,185 $477,588 $483,844
Multi-Family $500,000
Commercial
$400,000
HELOC
$300,000
Construction or Development
$200,000 Second Mortgages
Commercial RE
$100,000
1-4 Family
$0 Residential
9/30/07 9/30/08 9/30/09
9/30/10 9/30/11 12/31/11
Dollars in thousands.
11
|
 |
M A L V E R N
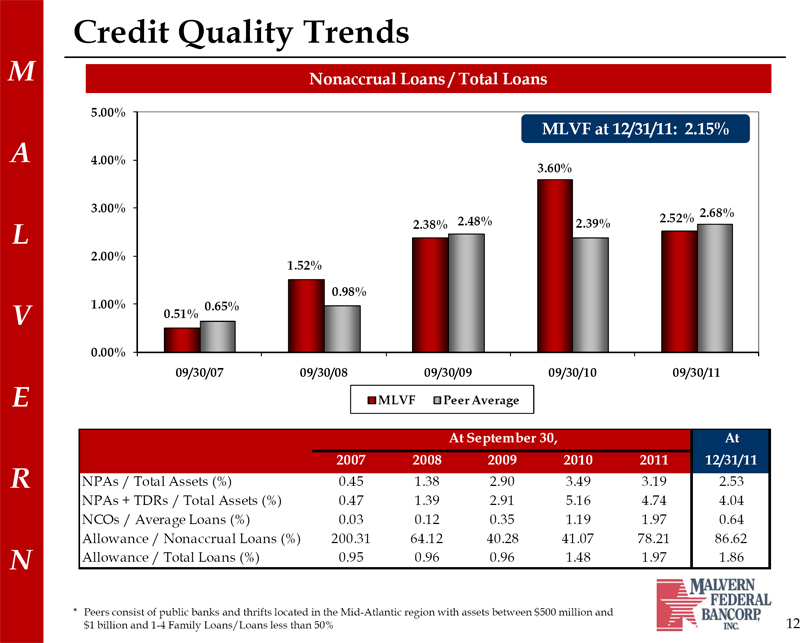
Credit Quality Trends
Nonaccrual Loans / Total Loans
5.00%
MLVF at 12/31/11: 2.15%
4.00%
3.60%
3.00% 2.68% 2.48% 2.52%
2.38% 2.39%
2.00%
1.52%
0.98% 1.00% 0.65% 0.51%
0.00%
09/30/07 09/30/08 09/30/09
09/30/10 09/30/11
MLVF Peer Average
At September 30, At 2007 2008 2009 2010
2011 12/31/11
NPAs / Total Assets (%) 0.45 1.38 2.90 3.49
3.19 2.53 NPAs + TDRs
/ Total Assets (%) 0.47
1.39 2.91 5.16
4.74 4.04 NCOs /
Average Loans (%) 0.03
0.12 0.35 1.19
1.97 0.64 Allowance /
Nonaccrual Loans (%) 200.31 64.12 40.28
41.07 78.21 86.62 Allowance / Total Loans (%) 0.95 0.96 0.96 1.48
1.97 1.86
* Peers consist of public banks and thrifts located in the Mid-Atlantic region with assets between $500 million and 14 $1 billion and 1-4 Family Loans/Loans less than 50% 12
|
 |
M A L V E R N
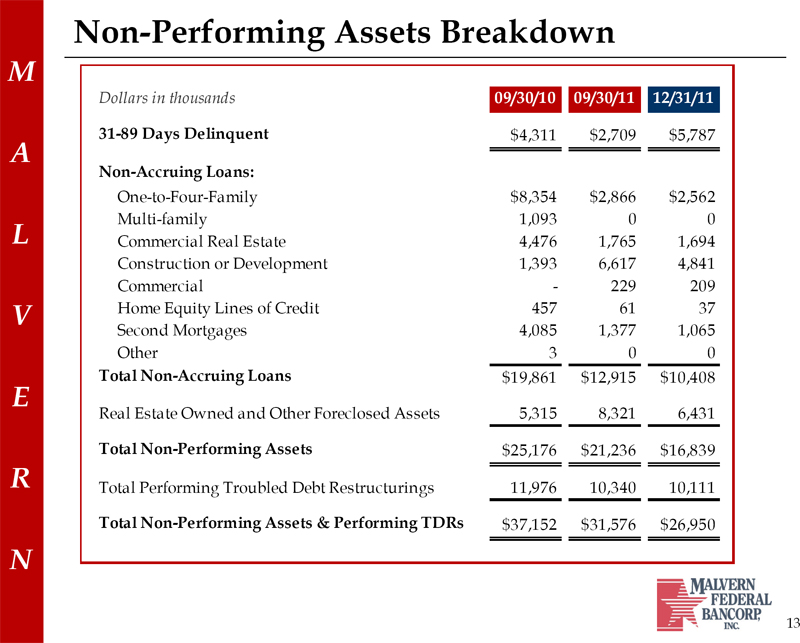
Non-Performing Assets Breakdown
Dollars in thousands 09/30/10 09/30/11 12/31/11
31-89 Days Delinquent
$4,311 $2,709
$5,787
Non-Accruing Loans:
One-to-Four-Family
$8,354 $2,866
$2,562 Multi-family
1,093 0 0 Commercial Real Estate 4,476 1,765
1,694 Construction or Development 1,393
6,617 4,841
Commercial - 229
209 Home Equity Lines of Credit 457 61 37
Second Mortgages 4,085
1,377 1,065 Other 3 0 0
Total Non-Accruing
Loans $19,861
$12,915 $10,408
Real Estate Owned
and Other Foreclosed Assets 5,315 8,321 6,431
Total Non-Performing Assets $25,176
$21,236 $16,839
Total Performing
Troubled Debt Restructurings 11,976
10,340 10,111
Total Non-Performing
Assets & Performing TDRs $37,152 $31,576
$26,950
13
|
 |
M A L V E R N
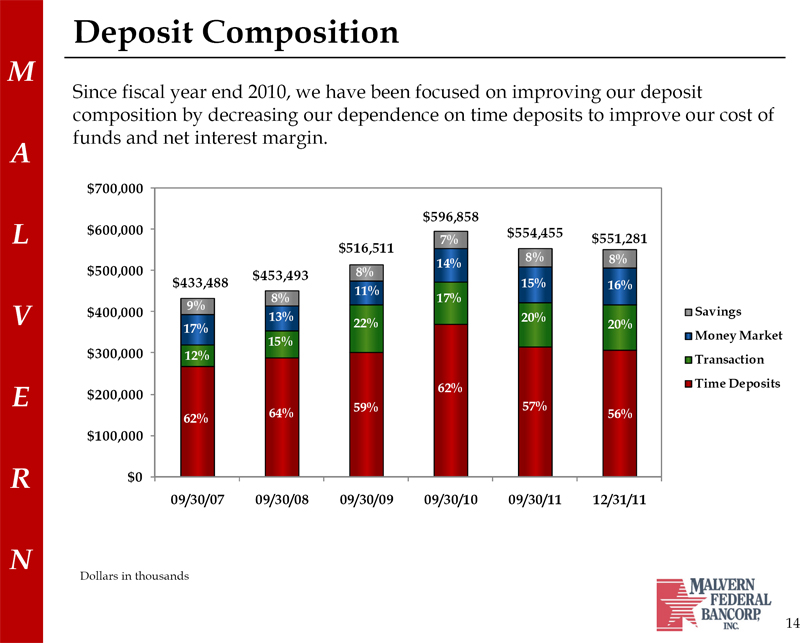
Deposit Composition
Since fiscal year end 2010, we have been focused on improving our deposit composition by decreasing our dependence on time deposits to improve our cost of funds and net interest margin.
$700,000
$596,858 $600,000
$554,455
7% $551,281 $516,511
8% 8% 14% $500,000
$453,493 8% $433,488
15% 16% 11%
8% 17% 9% $400,000
Savings 13% 20% 22%
20% 17% Money Market
15% $300,000 12% Transaction
62% Time Deposits
$200,000
59% 57%
64% 56% 62% $100,000
$0
09/30/07 09/30/08
09/30/09 09/30/10
09/30/11 12/31/11
Dollars in thousands
14
|
 |
M A L V E R N
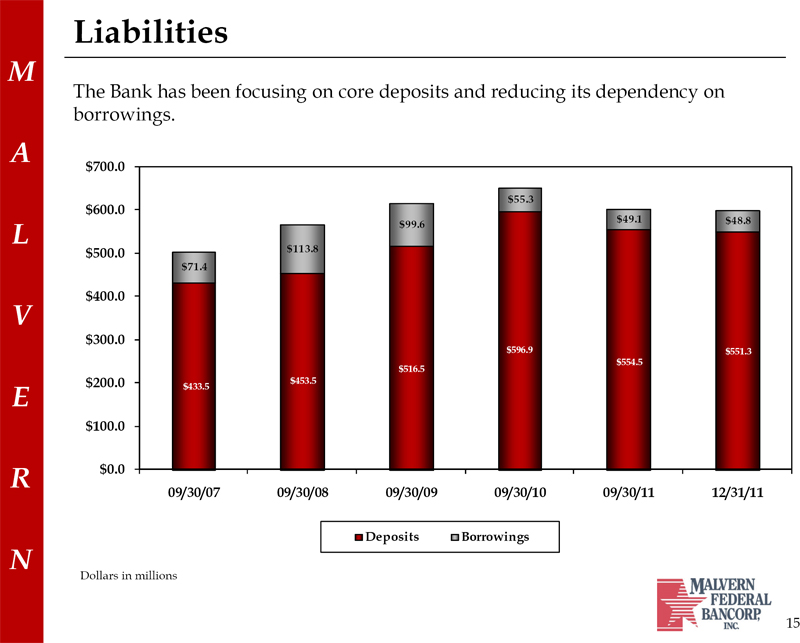
Liabilities
The Bank has been focusing on core deposits and reducing its dependency on borrowings.
$700.0
$55.3
$600.0
$49.1 $48.8 $99.6
$500.0 $113.8
$71.4
$400.0
$300.0
$596.9 $551.3 $554.5
$516.5
$200.0 $453.5
$433.5
$100.0
$0.0
09/30/07 09/30/08
09/30/09 09/30/10
09/30/11 12/31/11
Deposits
Borrowings
Dollars in millions
15
|
 |
M A L V E R N
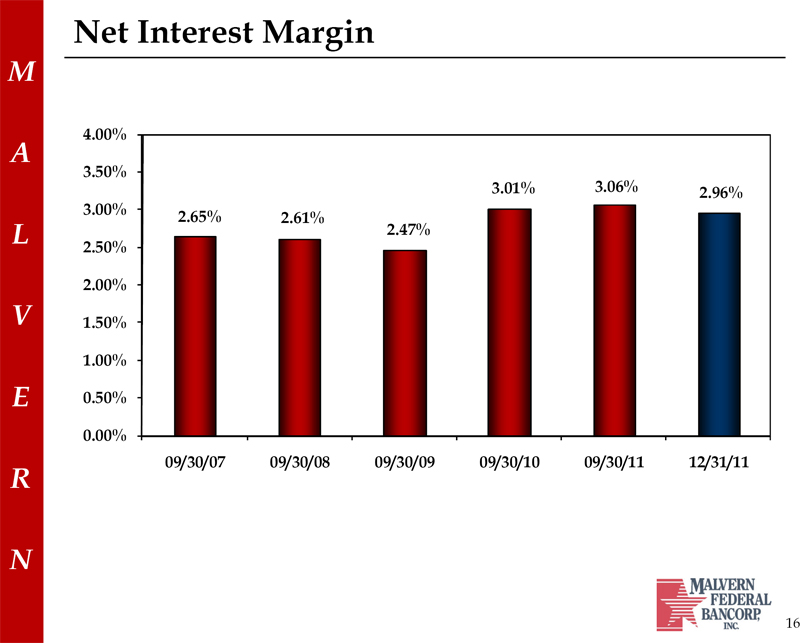
Net Interest Margin
4.00%
3.50%
3.01% 3.06%
2.96% 3.00% 2.65%
2.61% 2.47% 2.50%
2.00% 1.50% 1.00% 0.50%
0.00%
09/30/07 09/30/08
09/30/09 09/30/10
09/30/11 12/31/11
16
|
 |
M A L V E R N
Net Loss – Fiscal Year 2011
Factors contributing to the decrease in net income for fiscal year 2011:
An increase in the provision for loan losses of $3.0 million as well as a $1.5 million increase in other expenses, which was partially offset by a $1.7 million increase in income tax benefit.
The increase in other expenses primarily was the result of a $907,000 increase in other real estate owned expense and a $795,000 increase in professional fees.
17
|
 |
M A L V E R N
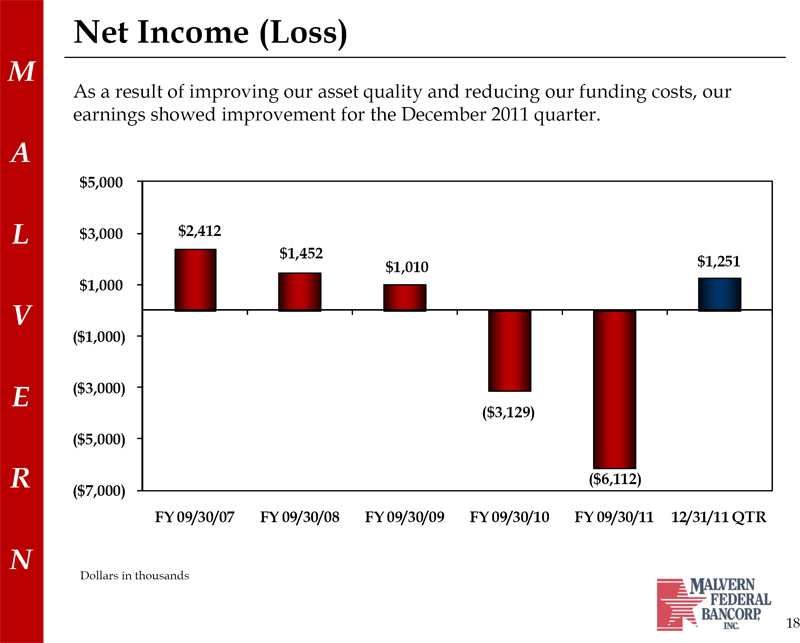
Net Income (Loss)
As a result of improving our asset quality and reducing our funding costs, our earnings showed improvement for the December 2011 quarter.
$5,000
$3,000 $2,412 $1,452 $1,251 $1,010 $1,000
($1,000)
($3,000)
($3,129)
($5,000)
($6,112) ($7,000)
FY 09/30/07 FY 09/30/08 FY 09/30/09 FY 09/30/10 FY 09/30/11 12/31/11 QTR
Dollars in thousands
18
|
 |
M A L V E R N
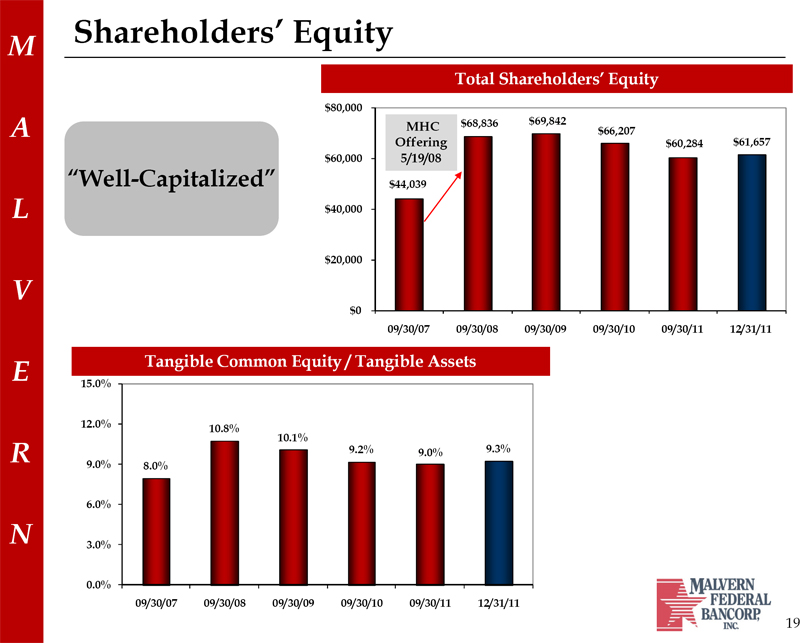
Shareholders’ Equity
Total Shareholders’ Equity
$80,000 $68,836 $69,842
MHC $66,207
Offering $60,284
$61,657 $60,000 5/19/08
“Well-Capitalized”
$44,039
$40,000
$20,000
$0
09/30/07 09/30/08
09/30/09
09/30/10 09/30/11
12/31/11
Tangible Common Equity /
Tangible Assets
15.0%
12.0%
10.8%
10.1%
9.2% 9.0% 9.3% 9.0% 8.0%
6.0%
3.0%
0.0%
09/30/07 09/30/08
09/30/09
09/30/10 09/30/11
12/31/11
19
|
 |
M A L V E R N
Market Statistics
|
 |
M A L V E R N
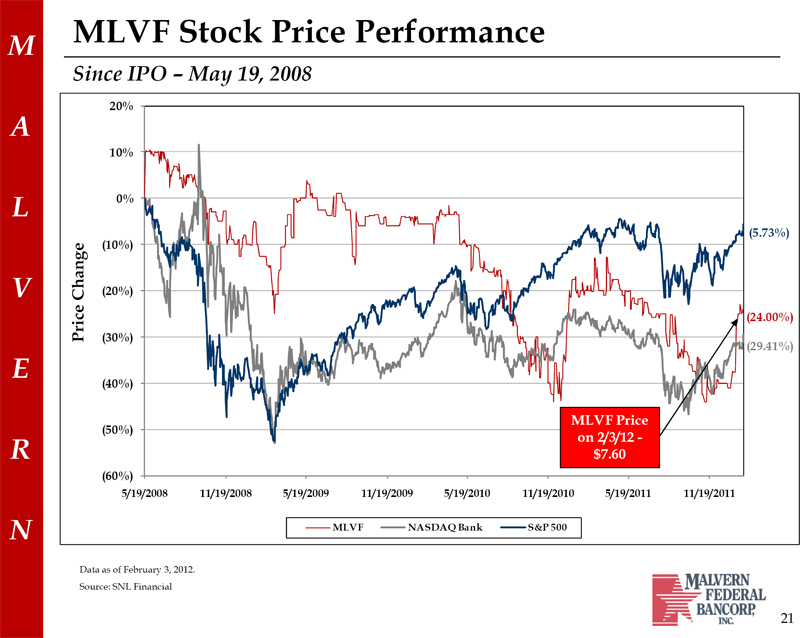
MLVF Stock
Price Performance
Since IPO – May 19, 2008
20%
10%
0%
(5.73%) (10%)
Change (20%)
(24.00%)
Price (30%)
(29.41%)
(40%)
MLVF Price
(50%) on 2/3/12 -$7.60
(60%)
5/19/2008 11/19/2008
5/19/2009 11/19/2009
5/19/2010 11/19/2010
5/19/2011 11/19/2011
MLVF NASDAQ Bank S&P 500
Data as of February 3, 2012.
Source: SNL Financial
21
|
 |
M A L V E R N
Fiscal 2012 Outlook
Continue to improve asset quality through aggressive loan monitoring, collection and workout processes in dealing with delinquent or problem loans
Reduce operating expenses
Increase capital through a second step offering
Improve deposit composition by adding additional deposit products and services as part of our efforts to increase core deposits
Continue to increase net interest margin Improve profitability Build franchise value for Malvern shareholders
22
|
 |
Questions? |