Attached files
| file | filename |
|---|---|
| 8-K - FORM 8-K - PLAINS EXPLORATION & PRODUCTION CO | d294466d8k.htm |
| EX-99.1 - PRESS RELEASE - PLAINS EXPLORATION & PRODUCTION CO | d294466dex991.htm |
 Credit
Suisse 2012 Energy Summit
February 2012
Exhibit 99.2 |
 1
Corporate Headquarters
Contacts
Plains Exploration & Production Company
700 Milam, Suite 3100
Houston, Texas 77002
Forward-Looking Statements
This presentation is not for reproduction or distribution to others without PXP’s
consent. Corporate Information
James C. Flores –
Chairman, President & CEO
Winston M. Talbert –
Exec. Vice President & CFO
Hance V. Myers, III –
Vice President
Joanna Pankey –
Manager, Shareholder Services
Phone: 713-579-6000
Toll Free: 800-934-6083
Email:
investor@pxp.com
Web Site: www.pxp.com
Except for the historical information contained herein, the matters discussed in
this
presentation
are
“forward-looking
statements”
as
defined
by
the
Securities
and Exchange Commission. These statements involve certain assumptions
PXP made based on its experience and perception of historical trends, current
conditions, expected future developments and other factors it believes are
appropriate under the circumstances.
The forward-looking statements are subject to a number of known and
unknown risks, uncertainties and other factors that could cause our actual
results to differ materially. These risks and uncertainties include, among other
things, uncertainties inherent in the exploration for and development and
production
of
oil
and
gas
and
in
estimating
reserves,
the
timing
and
closing
of
acquisitions and divestments, unexpected future capital expenditures, general
economic conditions, oil and gas price volatility, the success of our risk
management
activities,
competition,
regulatory
changes
and
other
factors
discussed in PXP’s filings with the SEC.
References to quantities of oil or natural gas may include amounts that the
Company believes will ultimately be produced, but that are not yet classified as
"proved reserves" under SEC definitions.
Corporate
Information
Director |
 2
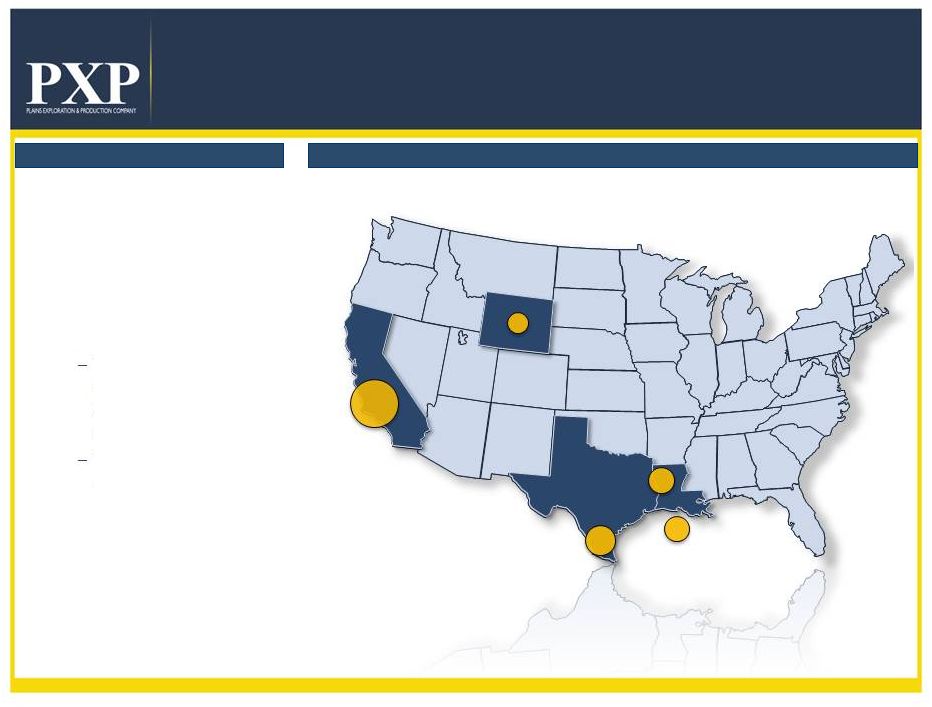
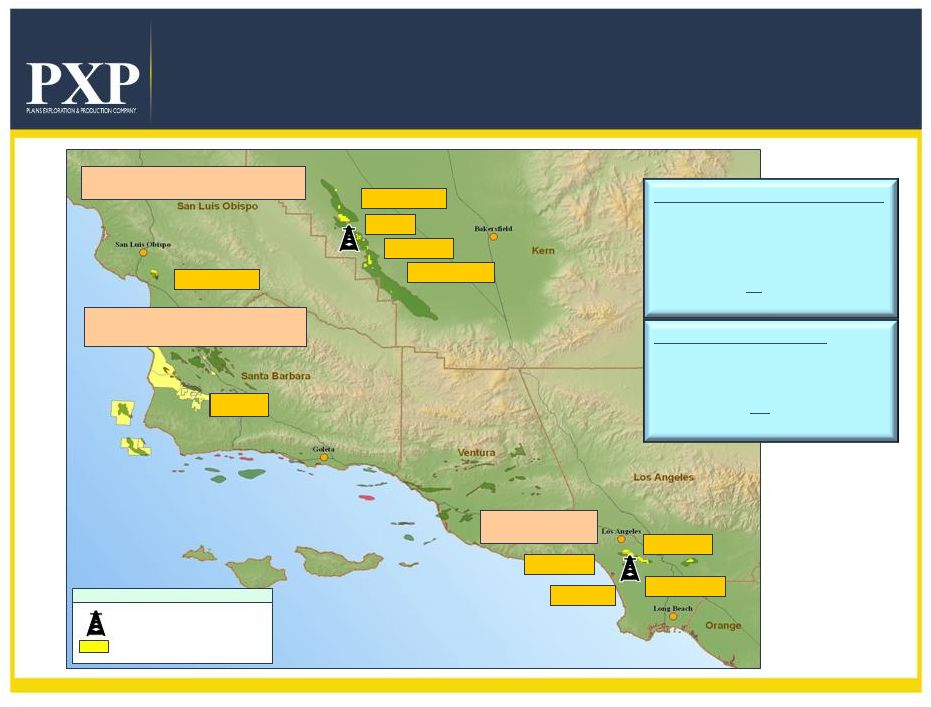
Core Asset Areas
Overview and Background
•
PXP is an independent oil and gas
company primarily engaged in
acquiring, developing, exploring and
producing oil and gas properties
•
Assets in PXP’s principal focus
areas include:
Mature properties with
long-lived reserves and
significant development
opportunities
Newer properties with
development and
exploration potential
•
PXP is headquartered in Houston,
TX with operations located in the
continental United States
Overview
Background and Operations
Madden
Haynesville
Gulf of Mexico
San Joaquin Valley
Arroyo Grande
Santa Maria Basin
Los Angeles Basin
Eagle Ford |
 3
2011 Highlights
•
Consistently Strong Quarterly Operating Results
•
Exceptional Eagle Ford Development Results
•
Improved Eagle Ford and California Pricing Mechanisms
•
Improved Hedge Position Volumes and Pricing
•
GOM Financing and Lucius Sanctioning
•
Divested South Texas and Texas Panhandle Assets
•
Issued $600MM 6 5/8% Senior Notes Due 2021
•
Issued $1,000MM 6 3/4% Senior Notes Due 2022
•
Retired $1,324MM in Higher Cost Senior Notes |
 4
2011 Operational Results
•
411 MMBOE Proved Reserves YE 2011
•
Reserve Replacement Ratio of 222%
•
16% Reserve Growth year-over-year pro forma for
asset sales
•
18% Reserve Growth in oil/liquids pro forma for asset
sales
•
Oil/Liquids 59% of total proved, up from 54% in 2010
•
12.2 Year Proved R/P
(1)
(1) Pro forma for 2011 asset sales. |
 5
2011 Production & Revenue Analysis
•
98.9 MBOE per day Production in 2011, a 12% increase over
2010 and 23% pro forma for asset sales
•
82.2 MBOE per day pro forma Production in 2011, reflects
16.7 MBOE per day impact of fourth-quarter asset sales
•
Expect approximate 30% increase in 2012(E) oil/liquids revenue
compared to 2011(E) oil/liquids revenue
•
Increase reflects impact of higher estimated oil/liquids
volumes and stronger pricing associated with new
marketing contracts
•
Oil/Liquids sales as a percentage of total revenue
2012(E) 90%±
2011(E) 78%
2010 74%
•
98% estimated Brent pricing for crude oil in 2012 |
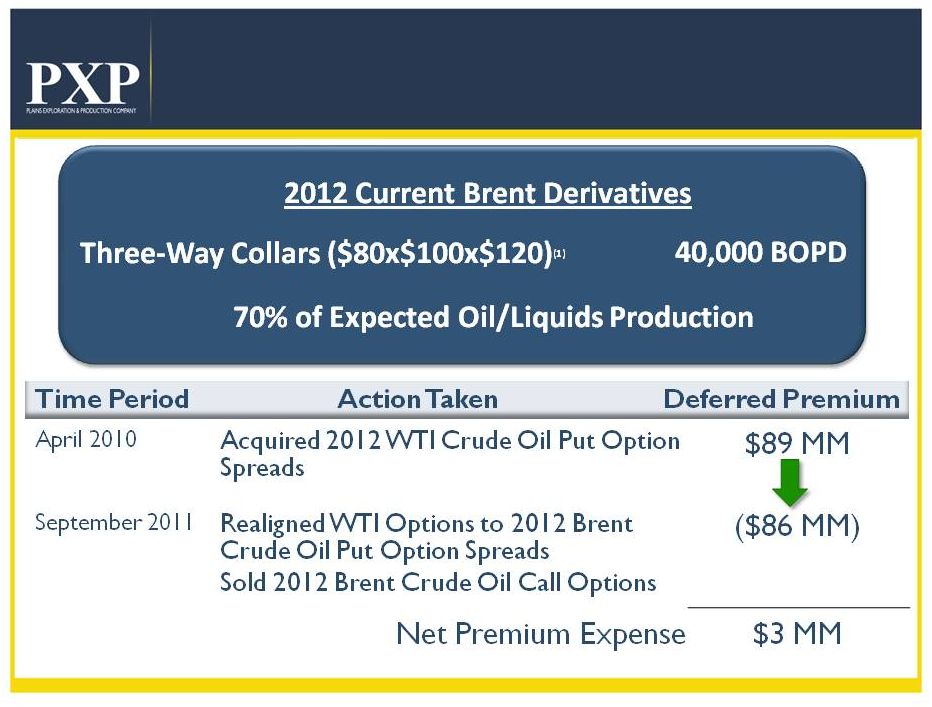 6
2012 Oil Hedge Program
“Costless Deferred Premium Strategy”
(1) Weighted average price, see detailed pricing in addendum.
|
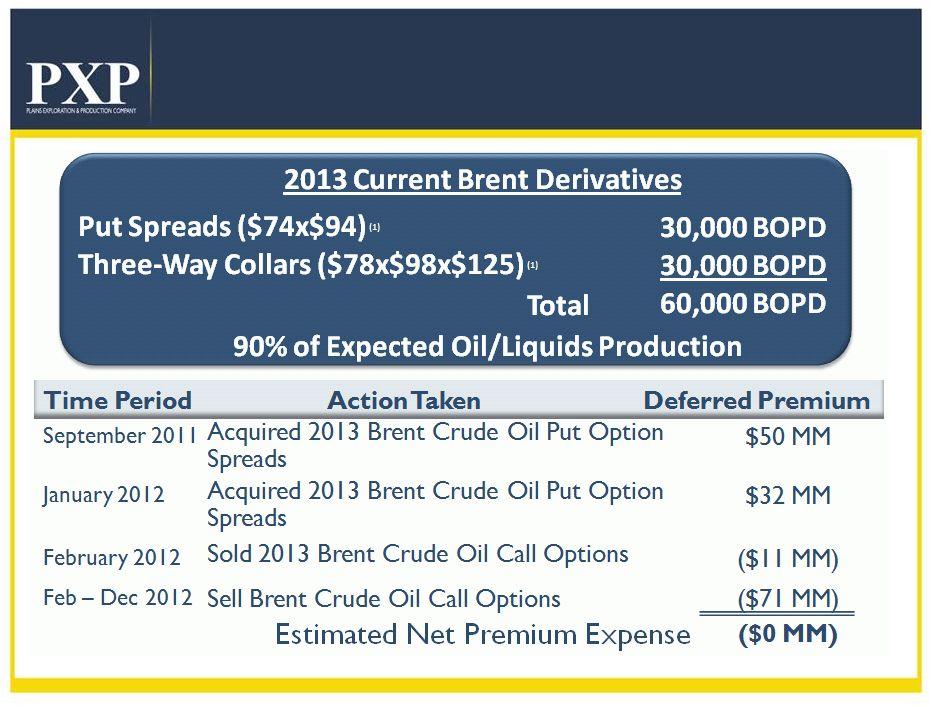 7
2013 Oil Hedge Program
“Costless Deferred Premium Strategy”
(1) Weighted average price, see detailed pricing in addendum.
|
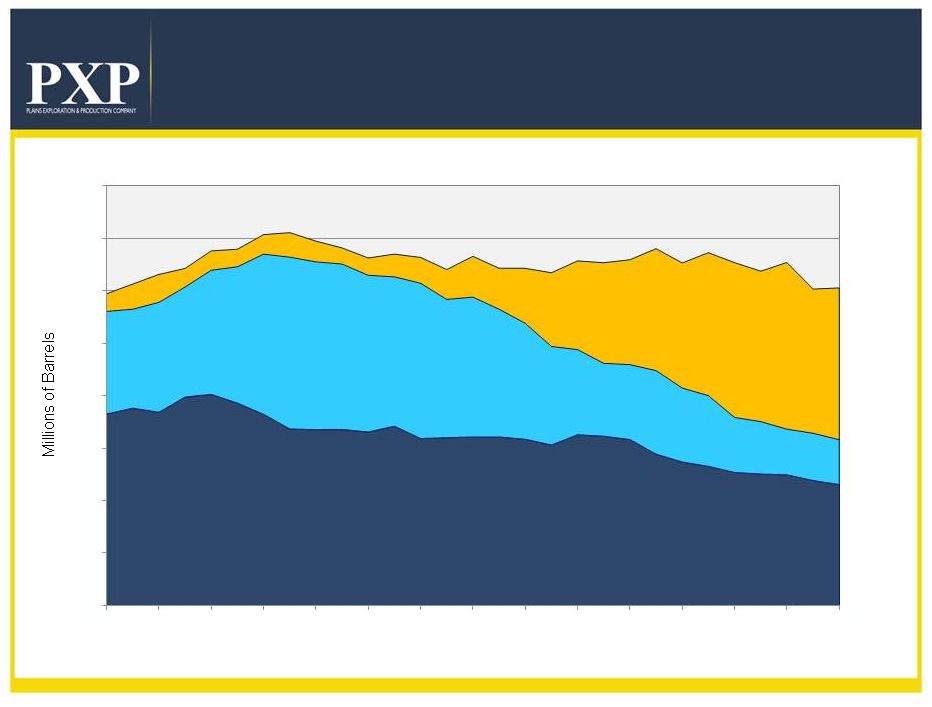 8
California Oil Supply Sources
Source: The California Energy Commission.
100
200
300
400
500
600
700
800
1982
1984
1986
1988
1990
1992
1994
1996
1998
2000
2002
2004
2006
2008
2010
California
Alaska
Foreign |
 9
PXP
Operational Plan at $110 Brent Oil
Oil & Gas Capital
Cash Flow
Production
GOM Capital
PXP Net Production
Oil & Gas Cash Flow
(1)(2)
GOM Oil Production
Starts 2014
Eagle Ford
Oil Growth
(1) Oil and Gas revenues minus lease expenses.
(2) Assumes $108/Bbl Brent based oil pricing and natural gas pricing of $3.70/MMBtu in
2012 and $110/Bbl Brent based oil pricing and natural gas pricing of $4.00/MMBtu
2013 and beyond.
|
 10
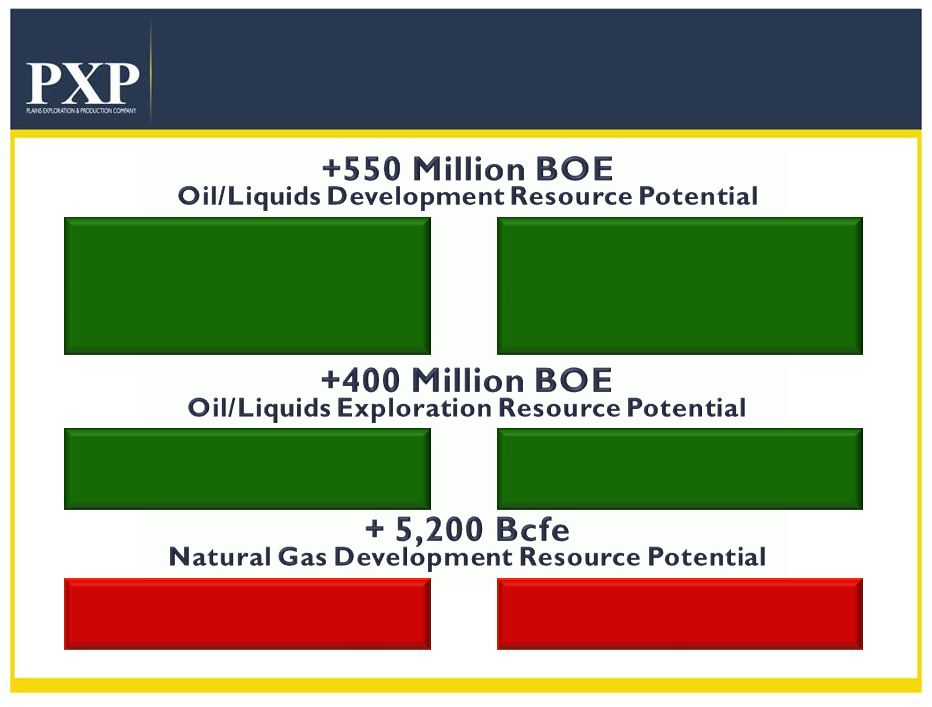
+1.8 Billion BOE
Undeveloped Resource Potential
Potential Reserves
283 MMBOE
162 MMBOE
106 MMBOE
Region
California
Eagle Ford
Gulf of Mexico
Potential Reserves
409 MMBOE
Region
Gulf of Mexico
5,200 Bcfe
40 Bcfe
Haynesville/Bossier
Madden |
 11
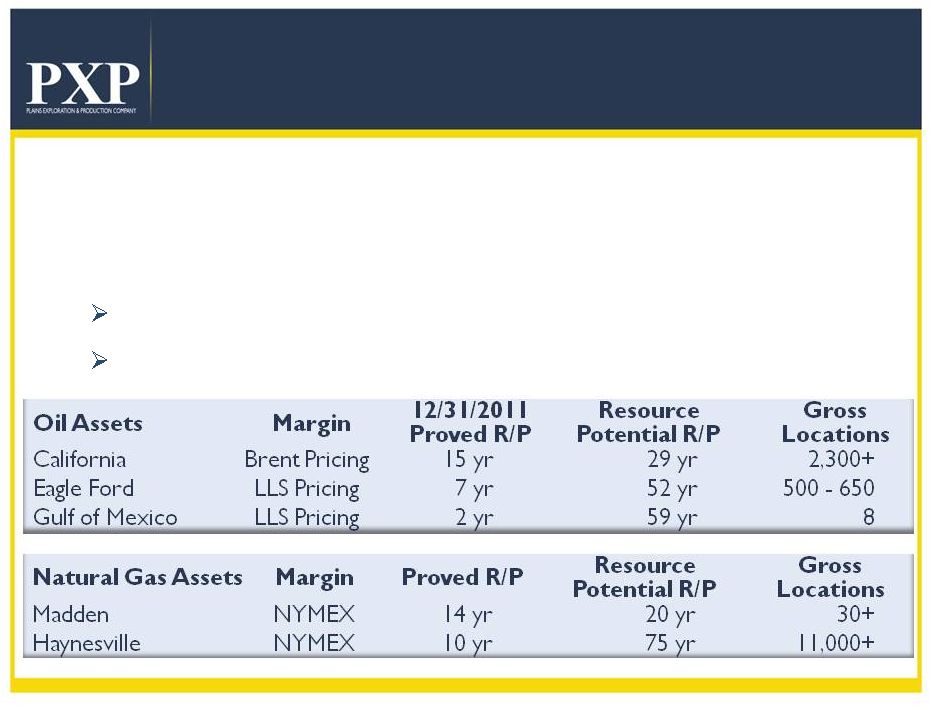
Strong Asset Intensity
11
Asset Intensity
•
High Margins
•
Durability
Proved Reserves R/P 12.2 years
(1)
Resource R/P 62 years
(1)
(1) Pro forma for 2011 asset sales. |
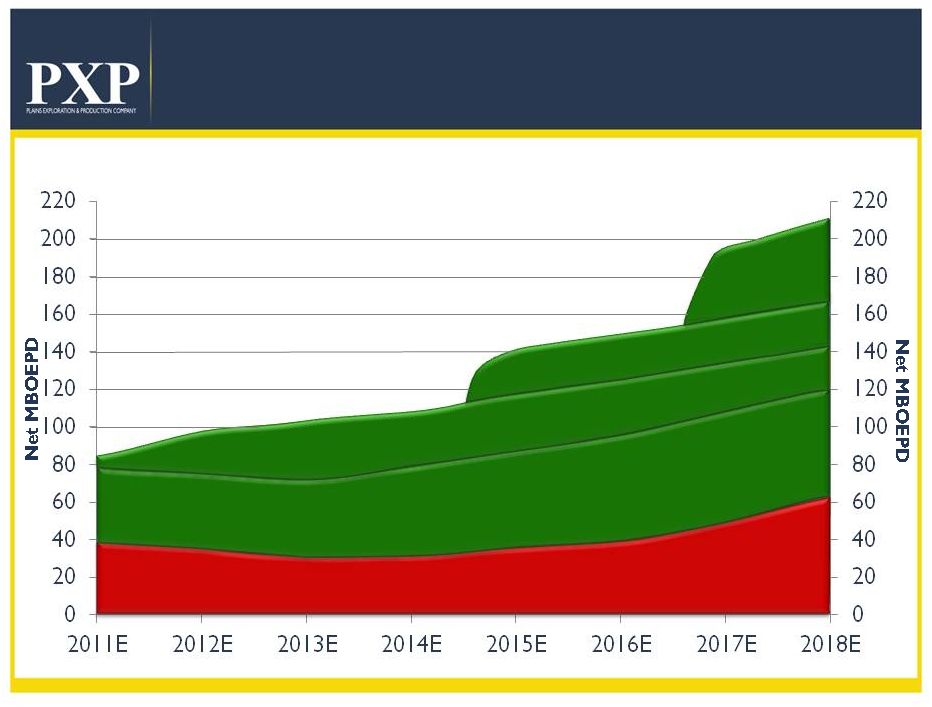
 12
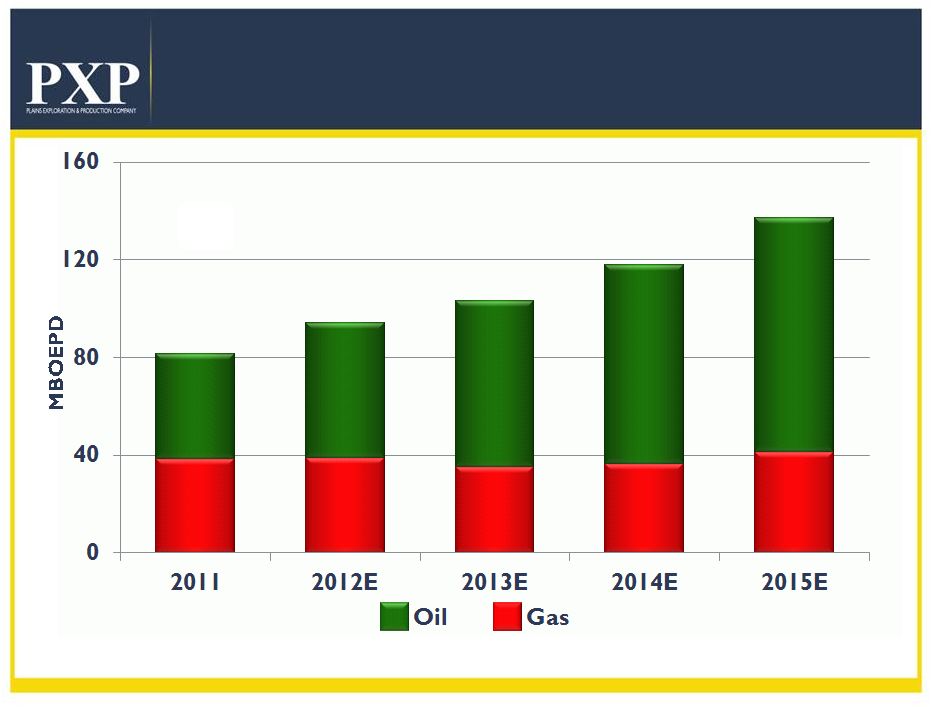
Multi Year Oil Growth
Production Growth Targets
42%
42%
58%
58%
34%
34%
66%
66%
30%
30%
70%
70%
31%
31%
69%
69%
47%
47%
53%
53%
94
(2)
103
(2)
118
(2)
137
(2)
82
(1)
(1)
Pro forma for asset sales.
(2) Assumes
$108/Bbl
Brent
based
oil
pricing
and
natural
gas
pricing
of
$3.70/MMBtu
in
2012
and
$110/Bbl
Brent
based
oil
pricing
and
natural
gas
pricing of $4.00/MMBtu 2013 and beyond. |
 13
Asset Production Target Profile
Haynesville/Madden
Haynesville/Madden
California
California
Eagle Ford
Eagle Ford
GOM-Lucius
GOM-Lucius
GOM Risked
GOM Risked
Exploration
Exploration
Success
Success |
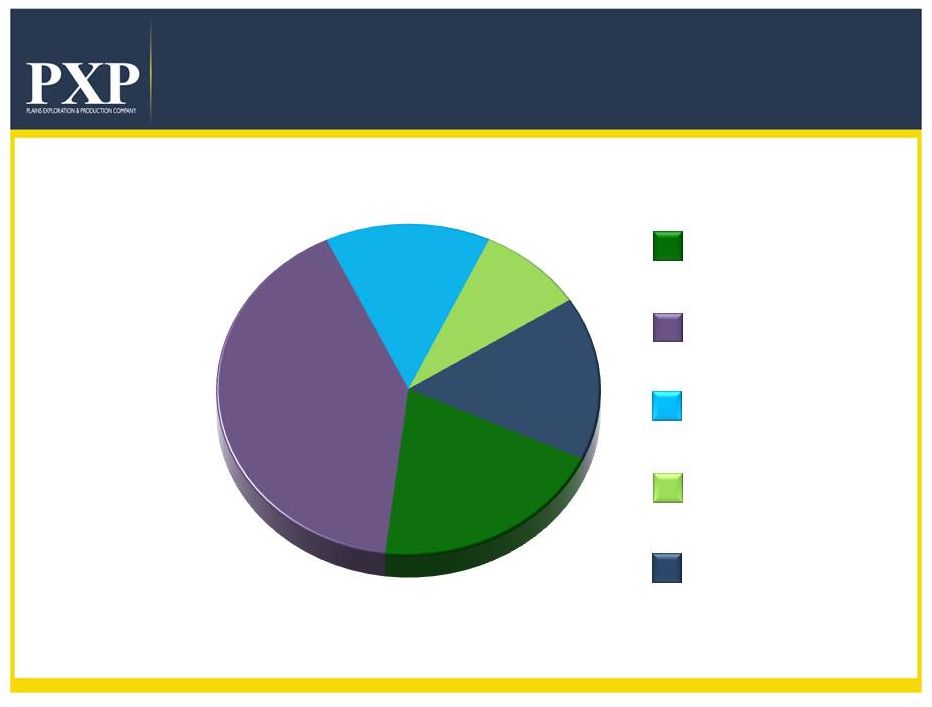 14
Capital Allocation
2012 Capital Program
(1)
Includes
development,
exploitation,
real
estate,
capitalized
interest
and
G&A
costs
but
does
not
include
additional
capital
for
exploratory
successes.
Exploration
capital
is
defined
as
discovery
and
dry
hole
costs.
2012E
$1.6 Billion
(1)
20%
14%
9%
16%
California
Eagle Ford
GOM
Haynesville
Other
41% |
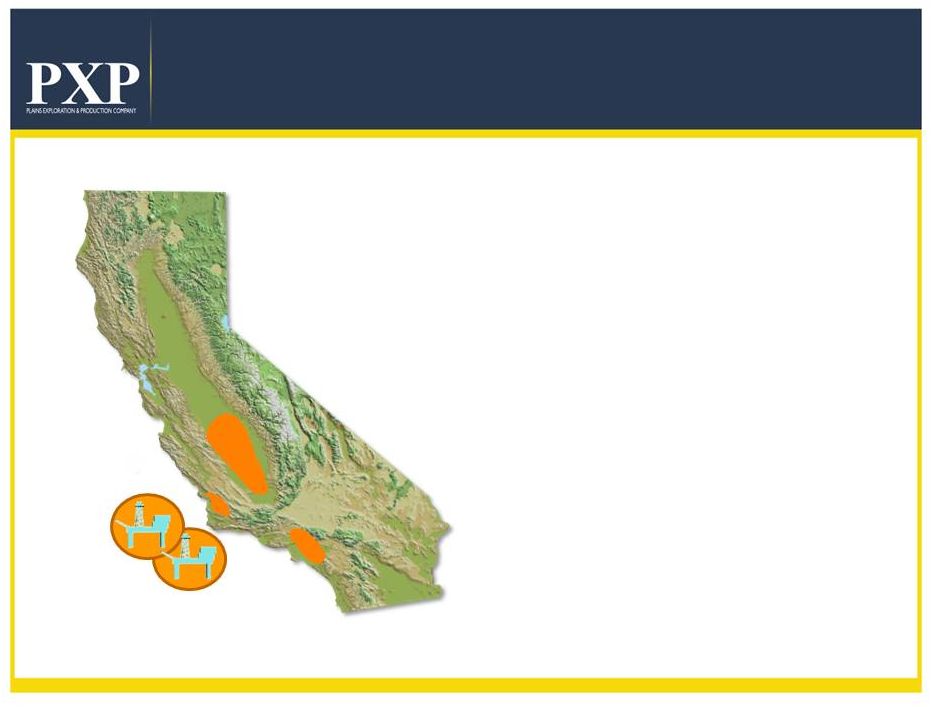 15
California Oil
Onshore/Offshore
Los
Angeles
Basin
San Joaquin
Valley
Arroyo
Grande
Pt Pedernales
Pt Arguello
•
217 MMBOE Proved Reserves
•
431 MMBOE Total Resource
Potential
•
68% Proved Developed
•
14.6
yr
Proved
R/P,
28.9
yr
Potential
R/P
•
2,300+ Future Well Locations
The shaded areas are for illustrative purposes only and do not reflect actual leasehold
acreage. Resource |
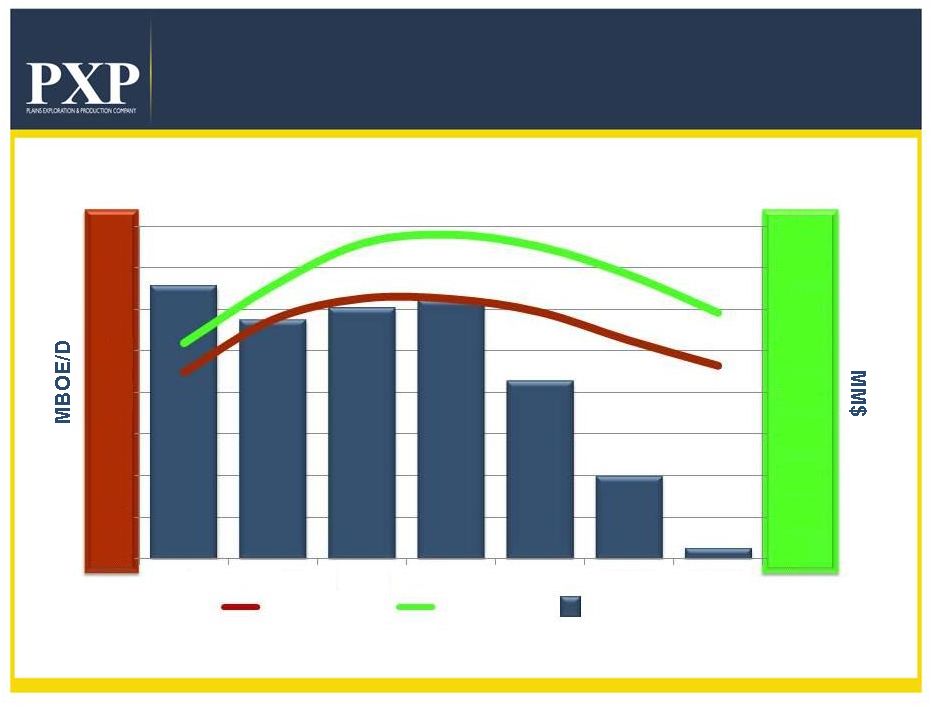
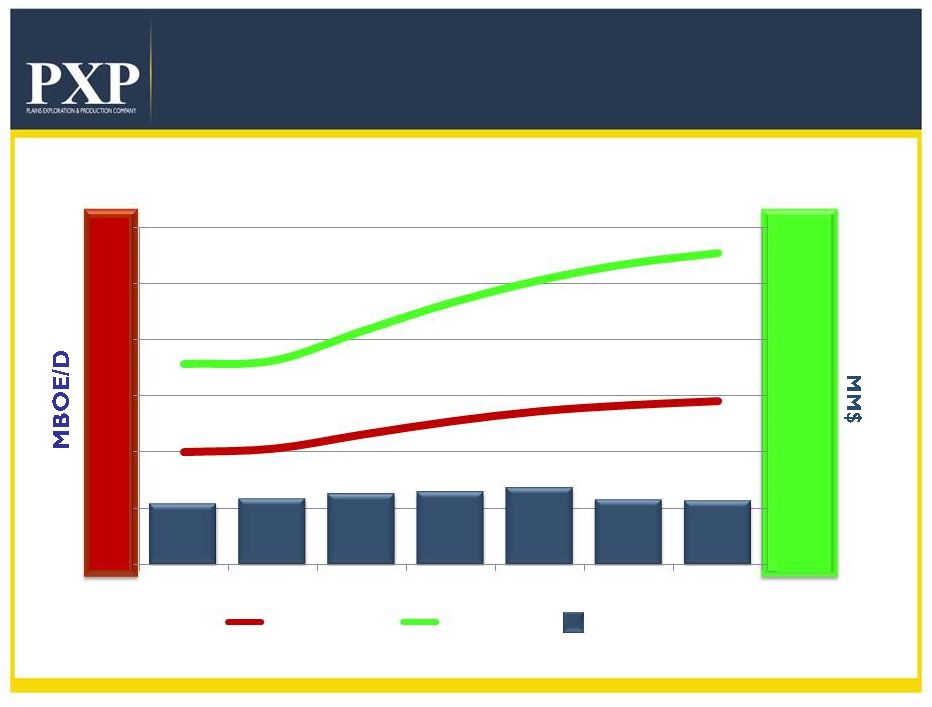 16
California Oil
Operational Plan
PXP Net Production
Oil & Gas Cash Flow
(1)(2)
Capital
Cash Flow
Production
$321 MM
$349 MM
$371 MM
$381 MM
$405 MM
$341 MM
$334 MM
$0
$300
$600
$900
$1,200
$1,500
$1,800
0
20
40
60
80
100
120
2012E
2013E
2014E
2015E
2016E
2017E
2018E
(1) Oil and Gas revenues minus lease expenses.
(2) Assumes $108/Bbl Brent based oil pricing and natural gas pricing of $3.70/MMBtu in
2012 and $110/Bbl Brent based oil pricing and natural gas pricing of $4.00/MMBtu
2013 and beyond.
|
 17
San Joaquin Valley
Legend
PXP LEASES
Santa
Maria
Basin
LA Basin
Arroyo Grande
Midway Sunset
Cymric
South Belridge
McKittrick
Montebello
Inglewood
Urban Area
Las Cienegas
Onshore California
Lompoc
2012 Activity Map
PXP
2012
Gross
Well
Activity
•
82
Planned Wells
•
3 Planned Wells
•
LAB
30
Planned Wells
•
SMB
5
Planned Wells
Total 120 Planned
Wells PXP ACTIVE DRILLS
Total Future Locations
•
SJV 1900
•
LAB
400
•
SMB
10
Total
2310
SJV
SJV Explor |
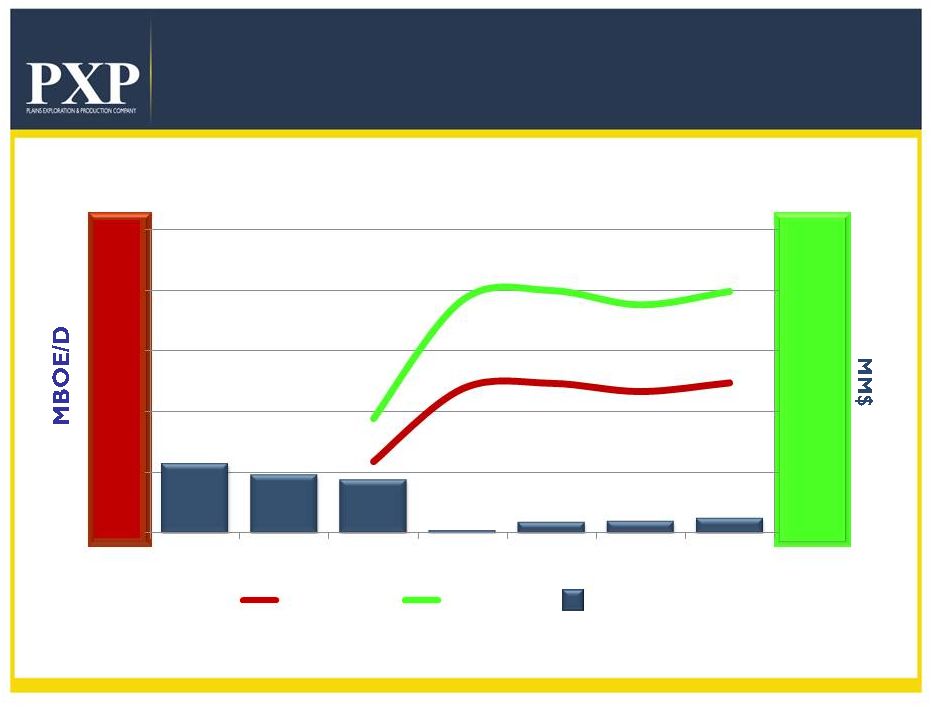
 18
Eagle Ford Horizontal Oil Play
Operational Plan
PXP Net Production
Oil & Gas Cash Flow
(1)(2)
(1) Oil and Gas revenues minus lease expenses.
(2) Assumes
$108/Bbl
Brent
based
oil
pricing
and
natural
gas
pricing
of
$3.70/MMBtu
in
2012
and
$110/Bbl
Brent
based
oil
pricing
and
natural
gas
pricing of $4.00/MMBtu 2013 and beyond.
Capital
Cash Flow
Production
$0
$100
$200
$300
$400
$500
$600
$700
$800
0
5
10
15
20
25
30
35
40
2012E
2013E
2014E
2015E
2016E
2017E
2018E
$655 MM
$575 MM
$602 MM
$623 MM
$427 MM
$200 MM
$27 MM |
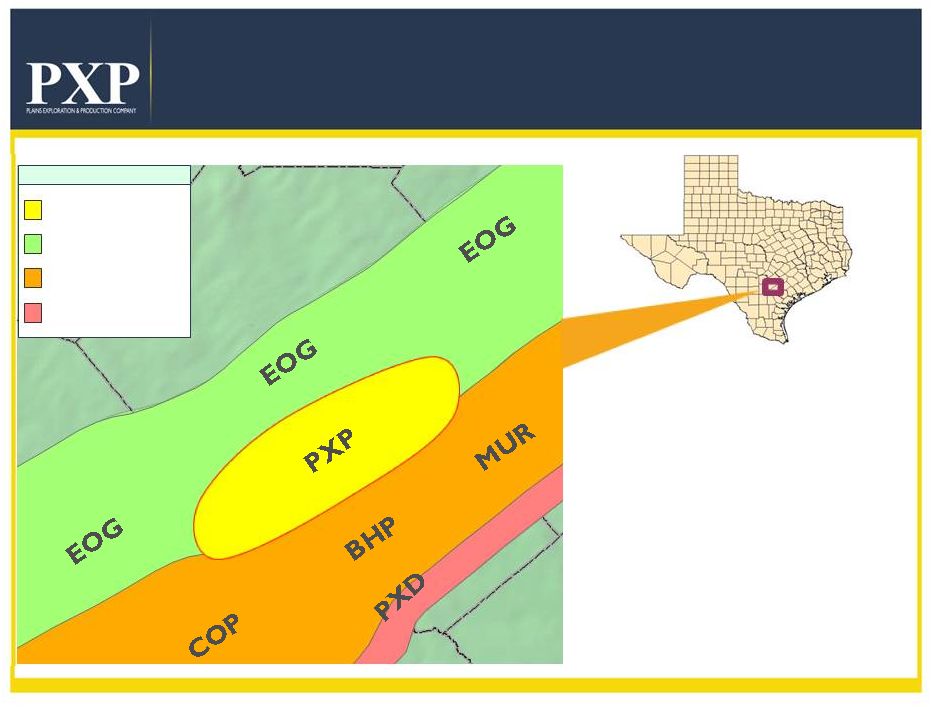 19
Eagle Ford Horizontal Oil Play
WILSON
ATASCOSA
Legend
PXP ACREAGE
OIL WINDOW
GAS CONDENSATE
WINDOW
DRY GAS WINDOW
The shaded area is for illustrative purposes only and does not reflect actual leasehold
acreage. •
PXP acreage position
•
~60,000 net acres
•
7 to 9 rigs running in 2012
•
Depth to Eagle Ford Top
•
~9,500' -
11,500' TVD
•
172 MMBOE Total Resource
Potential, 51.7 yr R/P
•
14 MBOE/D current rate
•
50+% 2011-2015 CAGR
•
500+ future locations |
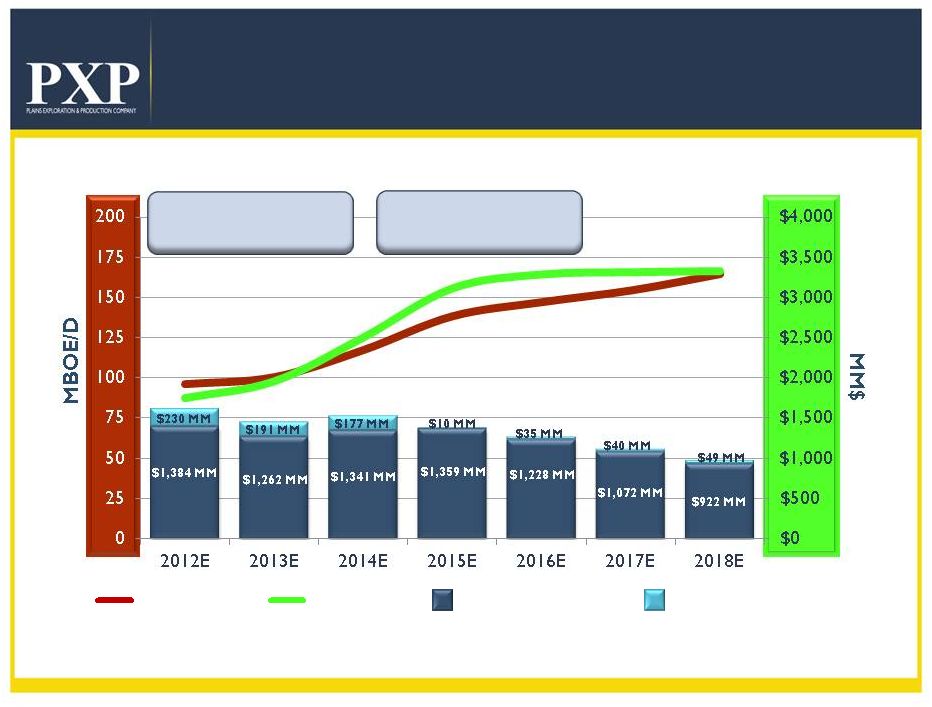
 20
Gulf of Mexico
Operational Plan
Net Production
Oil & Gas Cash Flow
(1)(2)
Capital
Cash Flow
Production
$230 MM
$191 MM
$177 MM
$10 MM
$35 MM
$40 MM
$49 MM
$0
$200
$400
$600
$800
$1,000
0
10
20
30
40
50
2012E
2013E
2014E
2015E
2016E
2017E
2018E
(1) Oil and Gas revenues minus lease expenses.
(2) Assumes $108/Bbl Brent based oil pricing and natural gas pricing of $3.70/MMBtu in
2012 and $110/Bbl Brent based oil pricing and natural gas pricing of $4.00/MMBtu
2013 and beyond.
|
 21
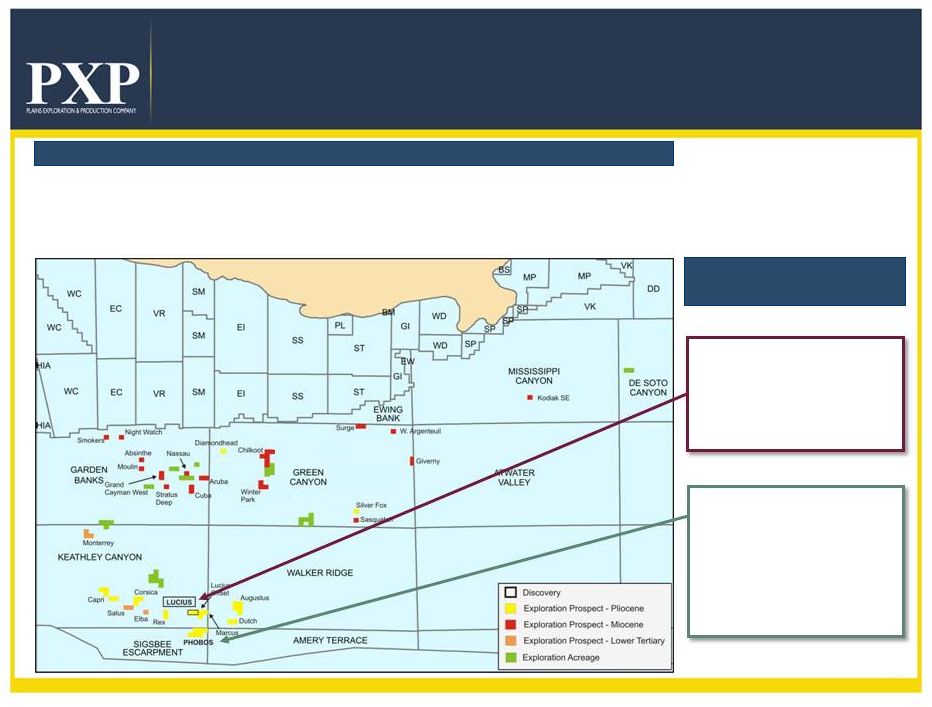
Gulf of Mexico Portfolio
•
1 Discovery
•
29 Exploration Prospects
•
37 blocks of Exploration Acreage
•
Interest in 102 blocks
•
570,000 gross acres / 191,000 net acres
Deepwater Leasehold
High-Quality Deepwater
GOM Assets
•
Lucius discovery made PXP an
early mover in Pliocene play
–
Acquisition of substantial
additional acreage at
favorable terms in the March
2010 lease sale
•
Phobos prospect located in the
same Pliocene hydrocarbon
complex as the Lucius
discovery
–
Analogous characteristics
to Lucius discovery well
–
Additional upside potential
in the Lower Tertiary play |
 22
Lucius Oil Development
•
Lucius oil project commercial sanction announced in 2011
with additional production targeted for 2nd half 2014
•
“Gross resource potential in the Lucius field is approximately
300+ MMBOE”
(1)
•
The Hadrian 5 (KC 919-3) well, that is part of the Lucius
unitization agreement, initially “encountered 475 feet of net oil
pay”
and “drilling ahead to deeper objectives, encountered an
additional 250 feet of net oil pay”
(2)
•
600+ MMBOE net resource potential from Phobos and
additional Pliocene, Miocene and Lower Tertiary prospects
(1) Source: Anadarko Petroleum Corporation (APC).
(2) Exxon Mobil Corporation (XOM) Q2 2011 Earnings Call Transcript.
|
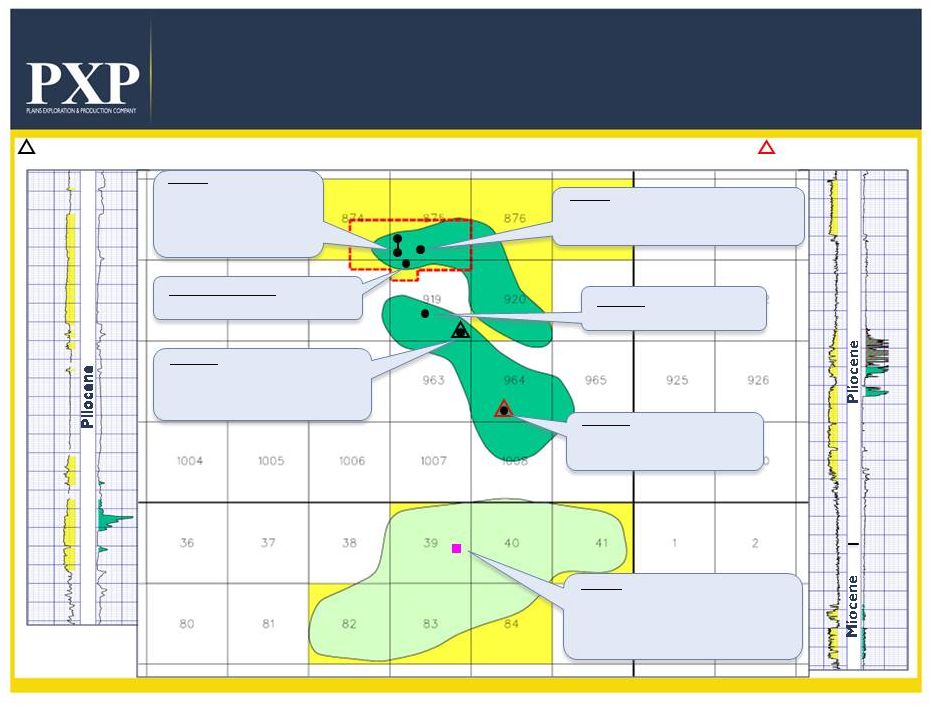 23
Lucius / Hadrian / Phobos Oil Complex
500 MMBOE of Discovered Resource;
1+ BBOE Exploration Upside
LUCIUS Discovery
PHOBOS Prospect
Lucius 1
Lucius 1ST
Lucius 2
Hadrian 3
Hadrian 1
Hadrian 2
Phobos 1
•
Potential 2012 drill
•
25,000 acres higher than oil pay at
Hadrian 2
•
Pliocene, Miocene and Wilcox potential
•
Structure mapped on seismic
Hadrian 2
•
Over 1,000 feet of net sand
with over 400 feet of net oil
and gas pay
Hadrian 1
Lucius 2
Lucius 1
Hadrian 3
•
Over 500 feet of net oil pay
Hadrian 5 (KC 919-3)
•
Over 700 feet of net oil pay
Hadrian 5
HADRIAN Discovery
ExxonMobil / Hadrian 2
KC 964 OCSG-21451 #1
Source: Wood Mackenzie,
Plains Offshore estimates,
ExxonMobil and BOEMRE
ExxonMobil / Hadrian 1
KC 919 OCSG-21447 #1
•
Over 600 feet of net high- quality oil pay
with further gas condensate pay
•
Successful flow test
complete
•
Over 900 feet of net sand with over 100 feet of net
oil and gas pay •
Kicked off additional delineation drilling in the
complex •
Over 600 feet of net oil pay in three primary oil
pays •
Deeper targets remaining to be drilled |
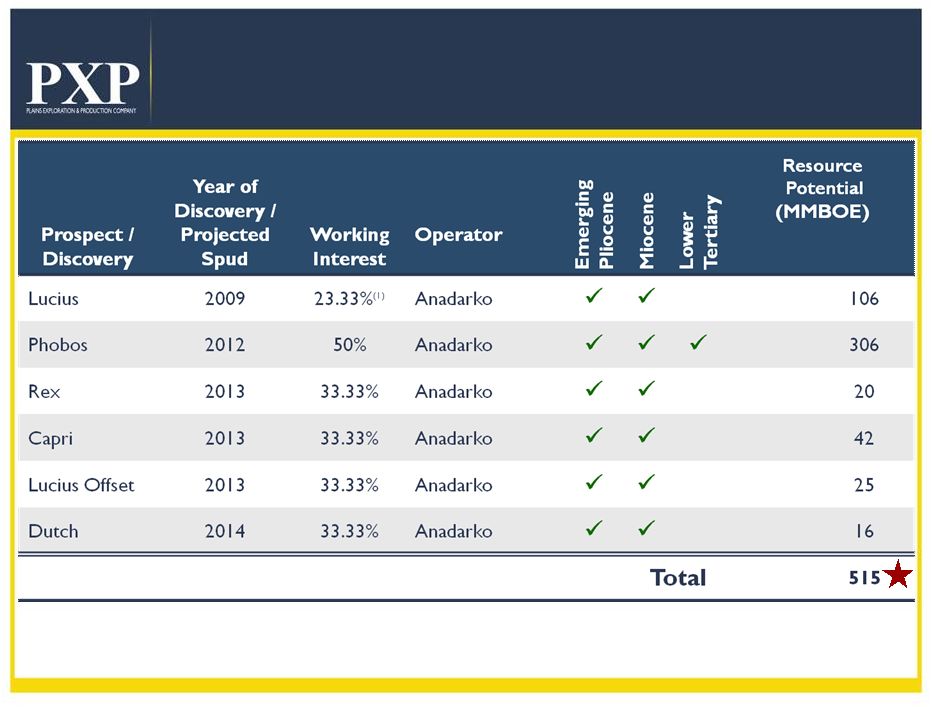 24
2012 –
2014 Operational Plan
Existing Discoveries and Near-Term Exploration
(1) Lucius working interest post unitization; remaining working interests reflective of
existing leasehold ownership. Recent OCS Lease Sale High Bidder on Additional
Inventory 24 |
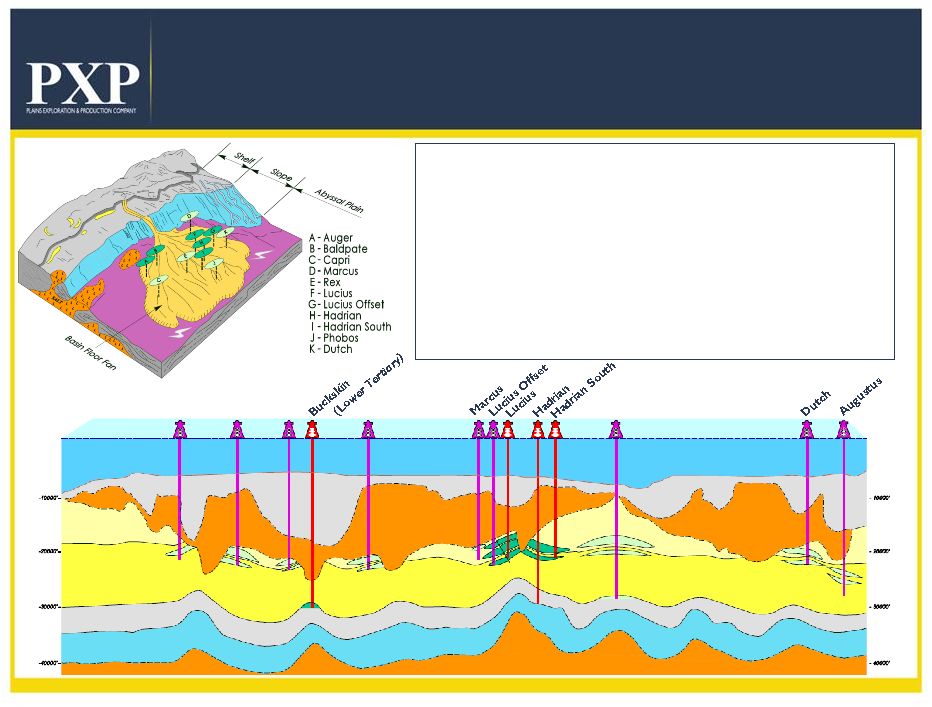 25
Premium Emerging Pliocene Position
Pleistocene
Pliocene
Miocene
Lower Tertiary
Cretaceous Jurassic
Louann Salt
Allochthonous
Salt
Allochthonous
Salt
Sea Floor
Capri
Elba
Rex
Phobos
Pliocene
**Figure not to scale**
Corsica
•
Lucius discovery and derisked drilling inventory makes Plains
Offshore a leader in Pliocene trend
•
Excellent reservoir characteristics in thick unrestricted turbidite fan
sandstones
•
Miocene and Wilcox provides upside
•
Lucius
•
•
Completed flow test
•
1 oil expected 2H2014
•
Significant exploration upside:
•
Phobos, Lucius offset, Capri, Rex, Dutch and Marcus
High-quality oil discovery
st |
 26
Natural Gas Portfolio
Projected Dry Gas Scenario at $4.00 Mcf
•
Closely
align
Natural
Gas
focused
CapEx
with
Natural
Gas generated operating cash flow at $4.00/Mcf
2012 Projected Operating Cash Flow at $4.00/Mcf
Projected Dry Gas Cash Flow
$ 143 MM
2012 Projected Capital Allocation at $4.00/Mcf
Haynesville
$ 139 MM
Madden
$ 7 MM
$ 146 MM
($ 3) MM |
 27
2012 Objectives
•
Strong Quarterly Operating Results
•
15%+ Production Growth
•
Eagle Ford Oil Development Growth Focus
•
Continue Lucius Oil Development Build
Out with Third Party Funding
•
Drill Phobos Exploration Well with 300+
MMBOE Net Potential |
 28
Addendum |
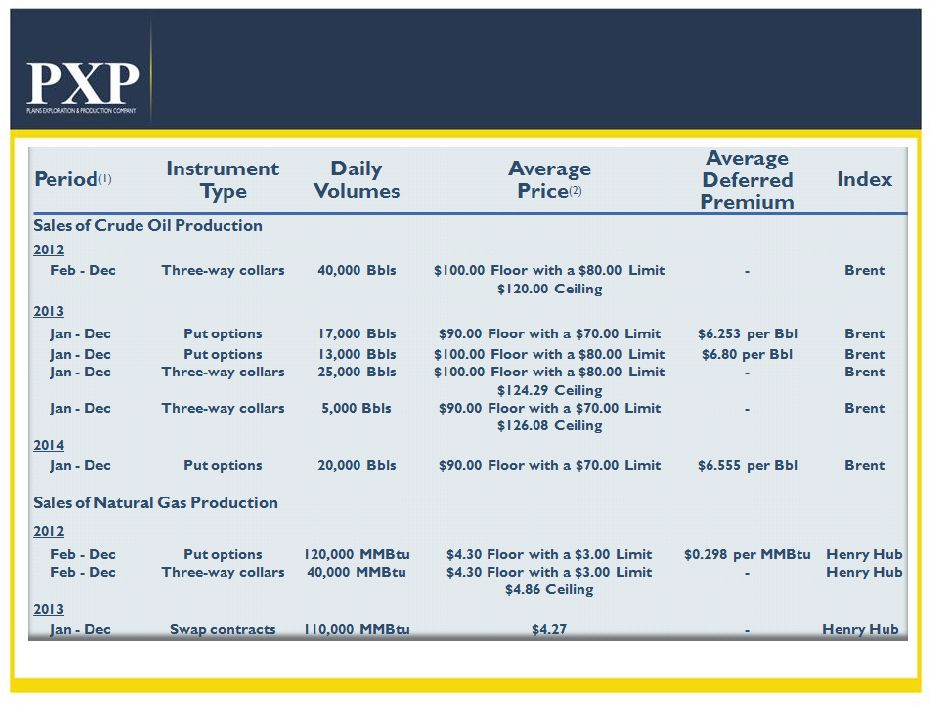 29
Updated Hedging Position
Derivative Instruments
(1)
All of our derivatives are settled monthly.
(2)
The average strike price does not reflect the cost to purchase the put options or
collars. |
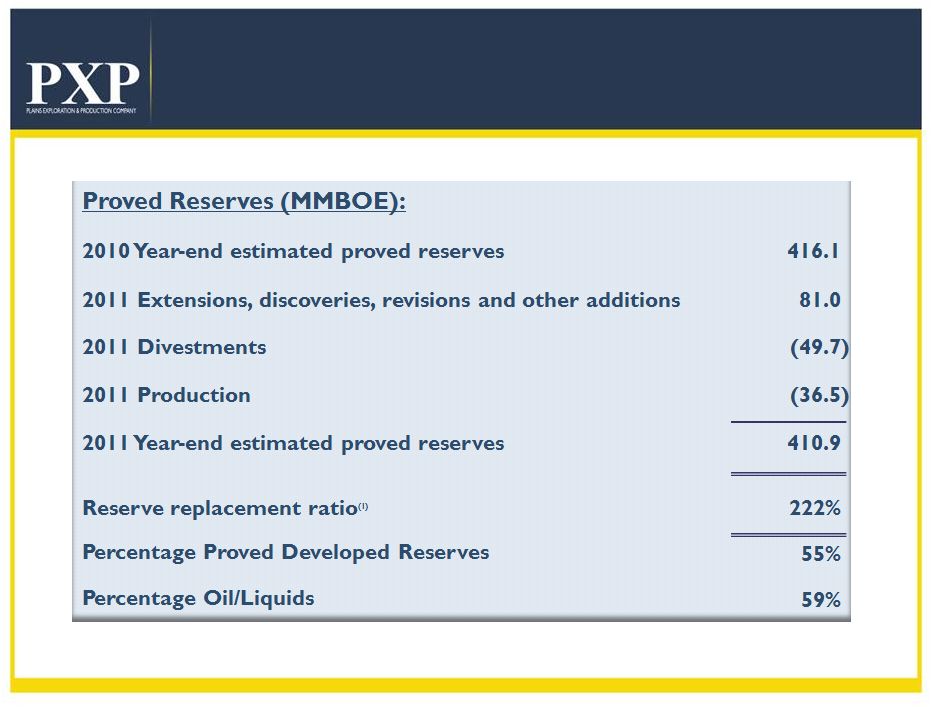 30
2011 Proved Reserves Reconciliation
(1) The Reserve Replacement Ratio is an indicator of our ability to replace annual
production volume and grow our reserves. It is important to economically find and develop new reserves that will
offset produced volumes and provide for future production given the inherent decline of
hydrocarbon reserves as they are produced. This statistical indicator has limitations, including its
predictive and comparative value. As such, this metric should not be considered in
isolation or as a substitute for an analysis of our performance as reported under GAAP. Furthermore, this
metric may not be comparable to similarly titled measurements used by other companies. |
 “People building value together to find and produce
energy resources safely, reliably and efficiently”
|