Attached files
| file | filename |
|---|---|
| 8-K - FORM 8-K - CONSUMERS ENERGY CO | d294701d8k.htm |

Growing Forward
Credit Suisse 2012 Energy Summit February 7, 2012
This presentation is made as of the date hereof and contains “forward-looking statements” as defined in Rule 3b-6 of the Securities Exchange Act of 1934, as amended, Rule 175 of the Securities Act of 1933, as amended, and relevant legal decisions. The forward-looking statements are subject to risks and uncertainties. They should be read in conjunction with “FORWARD-LOOKING STATEMENTS AND INFORMATION” and “RISK FACTORS” sections of CMS Energy’s and Consumers Energy’s Form 10-K for the year ended December 31 and as updated in subsequent 10-Qs. CMS Energy’s and Consumers Energy’s “FORWARD-LOOKING
STATEMENTS AND INFORMATION” and “RISK FACTORS” sections are incorporated herein by reference and discuss important factors that could cause CMS Energy’s and Consumers Energy’s results to differ materially from those anticipated in such statements. CMS Energy and Consumers Energy undertake no obligation to update any of the information presented herein to reflect facts, events or circumstances after the date hereof.
The presentation also includes non-GAAP measures when describing CMS Energy’s results of operations and financial performance. A reconciliation of each of these measures to the most directly comparable GAAP measure is included in the appendix and posted on our website at www.cmsenergy.com.
Reported earnings could vary because of several factors, such as legacy issues associated with prior asset sales. Because of those uncertainties, the company is not providing reported earnings guidance.
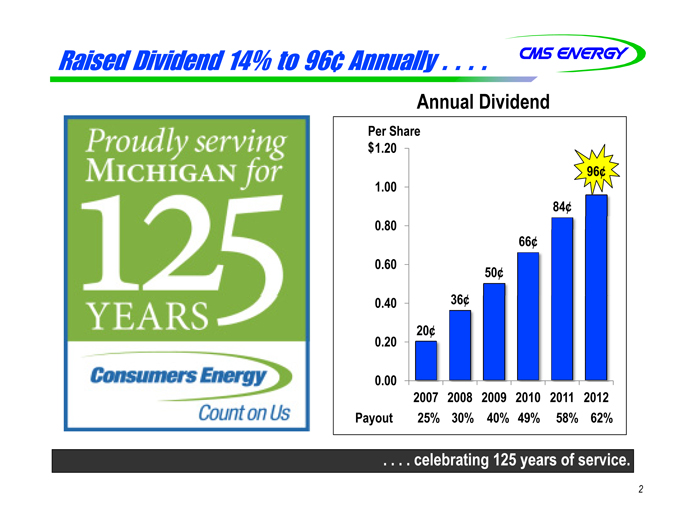
Raised Dividend 14% to 96¢ Annually . . . .
Annual Dividend
Per Share
$1.20
1.00
0.80 0.60 0.40 0.20 0.00
Payout
20¢
36¢
50¢
66¢
84¢
96¢
2007 2008 2009 2010 2011 2012 25% 30% 40% 49% 58% 62%
. . . . celebrating 125 years of service.
2
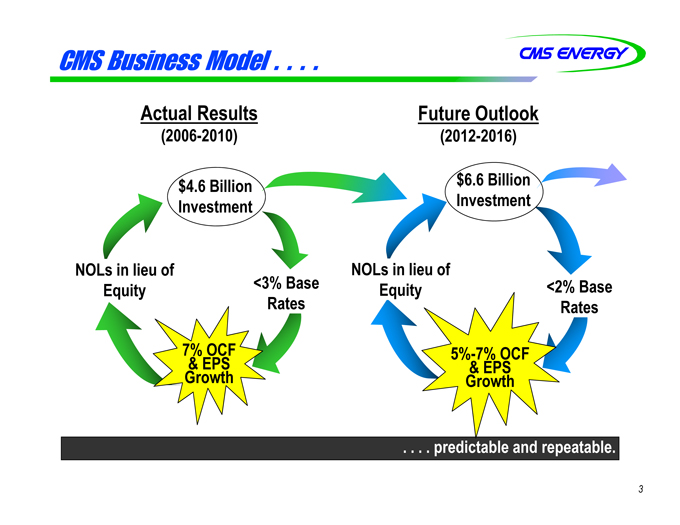
CMS Business Model . . . .
Actual Results
(2006-2010)
$4.6 Billion Investment
NOLs in lieu of Equity
<3% Base Rates
7% OCF
& EPS
Growth
Future Outlook
(2012-2016)
$6.6 Billion Investment
NOLs in lieu of Equity
<2% Base Rates
5%-7% OCF
& EPS
Growth
. . . . predictable and repeatable.
3
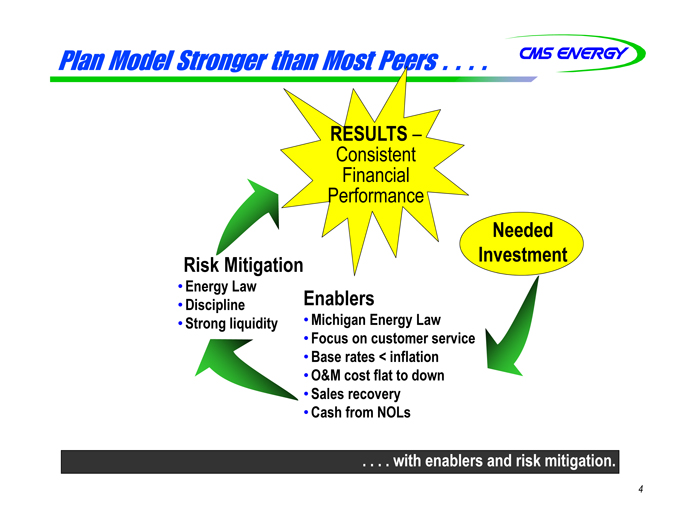
Plan Model Stronger than Most Peers . . . .
RESULTS –
Consistent Financial Performance
Risk Mitigation
• Energy Law
• Discipline
• Strong liquidity
Needed Investment
Enablers
• Michigan Energy Law
• Focus on customer service
• Base rates < inflation
• O&M cost flat to down
• Sales recovery
• Cash from NOLs
. . . . with enablers and risk mitigation.
4
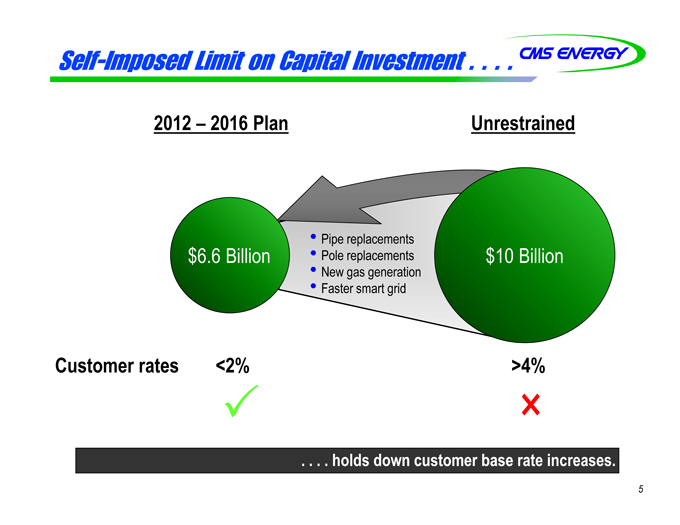
Self-Imposed Limit on Capital Investment . . . .
2012 – 2016 Plan
Unrestrained
$6.6 Billion
• Pipe replacements
• Pole replacements
• New gas generation
• Faster smart grid
$10 Billion
Customer rates
<2%
>4%
. . . . holds down customer base rate increases.
5
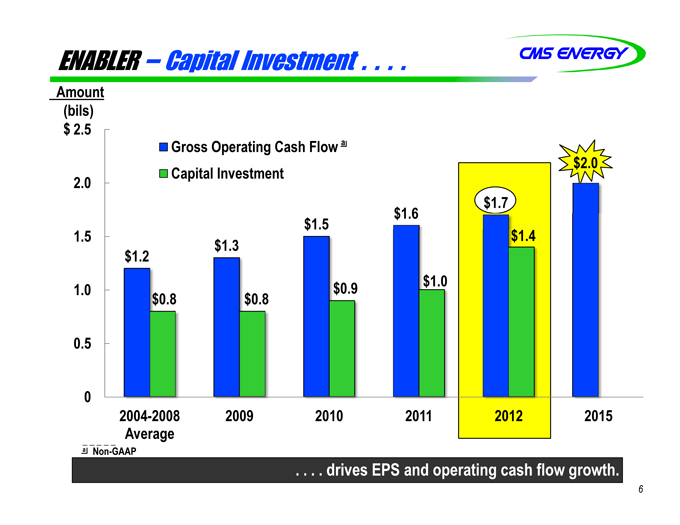
ENABLER – Capital Investment . . . .
Amount (bils) $ 2.5
2.0 1.5 1.0 0.5 0.0
Gross Operating Cash Flow a Capital Investment
$1.2
$0.8
$1.3
$0.8
$1.5
$0.9
$1.6
$1.0
$1.7
$1.4
$2.0
2004-2008 Average
2009
2010 2011
2012
2015
a Non-GAAP
. . . . drives EPS and operating cash flow growth.
| 6 |
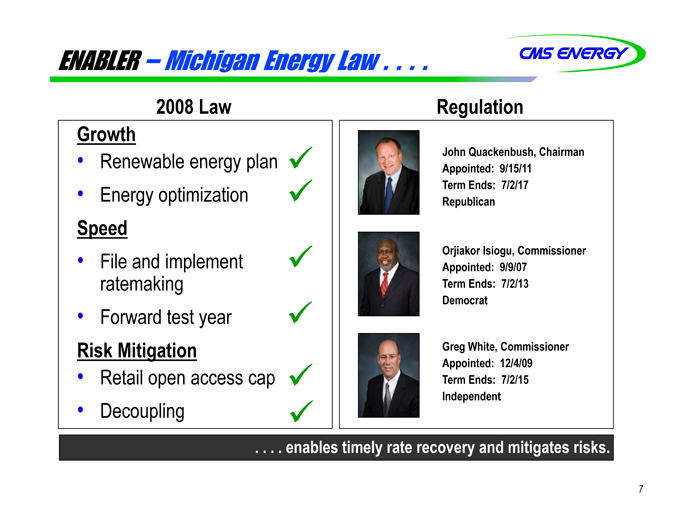
ENABLER – Michigan Energy Law . . . .
2008 Law
Regulation
Growth
• Renewable energy plan
• Energy optimization
Speed
• File and implement ratemaking
• Forward test year
Risk Mitigation
• Retail open access cap
• Decoupling
John Quackenbush, Chairman Appointed: 9/15/11 Term Ends: 7/2/17 Republican
Orjiakor Isiogu, Commissioner Appointed: 9/9/07 Term Ends: 7/2/13 Democrat
Greg White, Commissioner Appointed: 12/4/09 Term Ends: 7/2/15 Independent
. . . . enables timely rate recovery and mitigates risks.
7
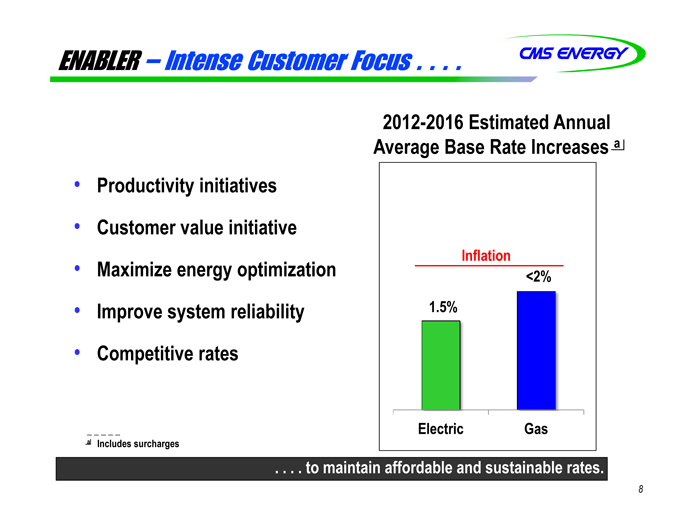
ENABLER – Intense Customer Focus . . . .
Productivity initiatives Customer value initiative Maximize energy optimization Improve system reliability Competitive rates
2012-2016 Estimated Annual Average Base Rate Increases a
Inflation
1.5%
<2%
Electric Gas
a Includes surcharges
. . . . to maintain affordable and sustainable rates.
8
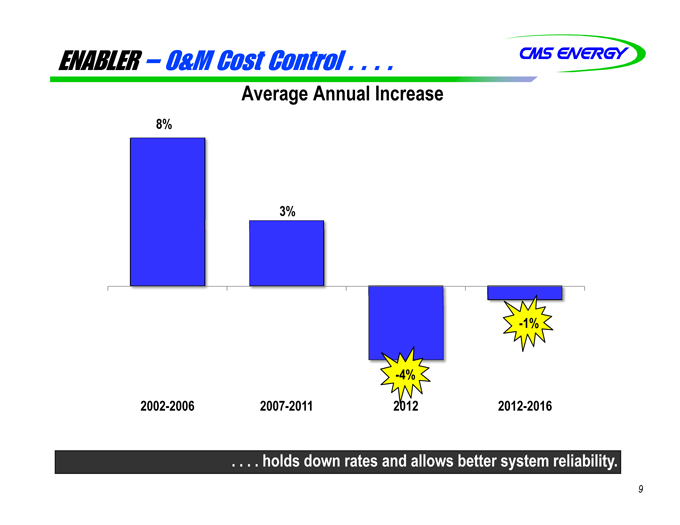
ENABLER – O&M Cost Control . . . .
Average Annual Increase
8%
3%
-4%
-1%
2002-2006 2007-2011
2012
2012-2016
. . . . holds down rates and allows better system reliability.
9
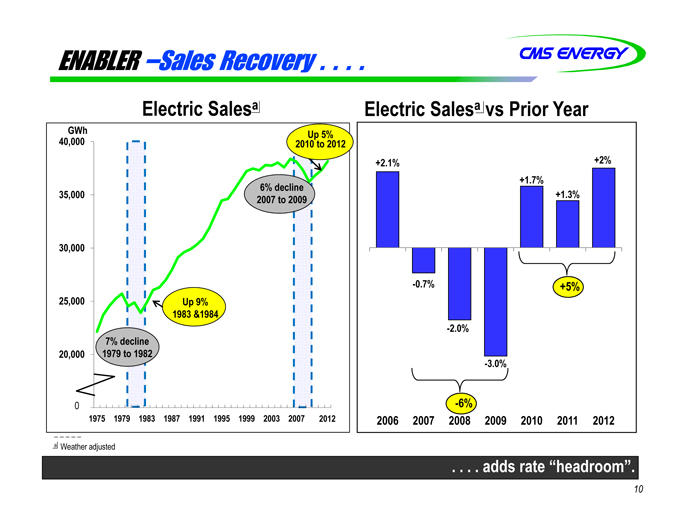
ENABLER –Sales Recovery . . . .
Electric Salesa
GWh 40,000
35,000 30,000 25,000 20,000 15,000 0
7% decline 1979 to 1982
Up 9% 1983 &1984
6% decline 2007 to 2009
2010 Up to 5% 2012
1975 1979 1983 1987 1991 1995 1999 2003 2007 2011 2012
Electric Salesa vs Prior Year
+2.1%
-0.7%
-2.0%
-3.0%
-6%
+1.7%
+1.3%
+2%
+5%
2006 2007
2008 2009 2010 2011 2012
a Weather adjusted
. . . . adds rate “headroom”.
10
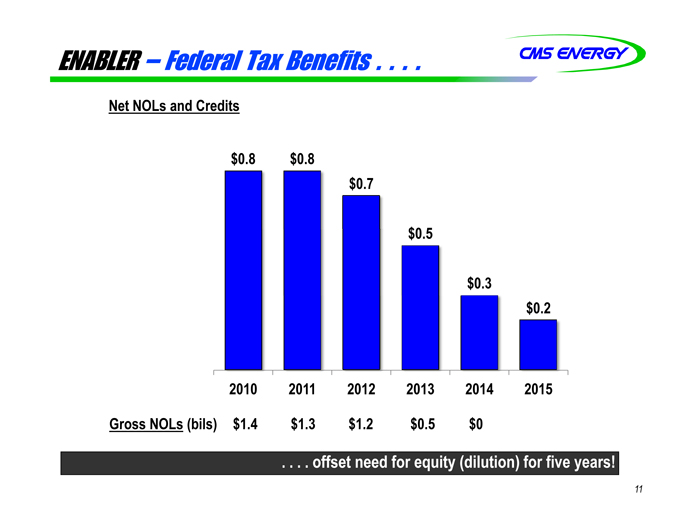
ENABLER – Federal Tax Benefits . . . .
Net NOLs and Credits
$0.8
$0.8
$0.7
$0.5
$0.3
$0.2
2010 2011 2012 2013 2014 2015
Gross NOLs (bils) $1.4 $1.3 $1.2 $0.5 $0
. . . . offset need for equity (dilution) for five years!
11
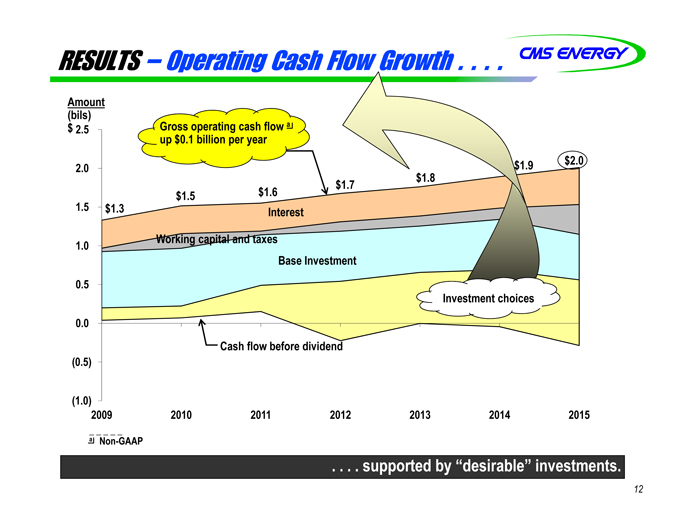
RESULTS – Operating Cash Flow Growth . .
Amount (bils) $ 2.5
2.0 1.5 1.0 0.5 0.0 (0.5) (1.0)
Gross operating cash flow a up $0.1 billion per year
$1.3
$1.5
$1.6
Interest
$1.7
$1.8
$1.9
$2.0
Base Investment
Working capital and taxes
Investment choices
Cash flow before dividend
2009 2010 2011 2012 2013 2014 2015
a Non-GAAP
. . . . supported by “desirable” investments.
12
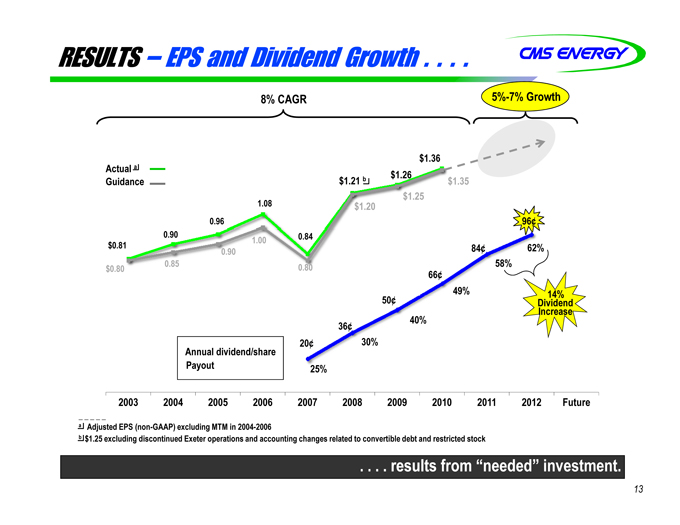
RESULTS – EPS and Dividend Growth . . . .
8% CAGR
5%-7% Growth
Actual a Guidance
$0.81
0.90
0.96
1.08
0.84
$1.21 b
$1.26
$1.36
$0.80
0.85
0.90
1.00
0.80
$1.20
$1.25
$1.35
Annual dividend/share Payout
20¢
36¢
50¢
66¢
84¢
96¢
25%
30%
40%
49%
58%
62%
14% Dividend Increase
2003 2004 2005 2006 2007 2008 2009 2010 2011 2012 Future
a Adjusted EPS (non-GAAP) excluding MTM in 2004-2006 b $1.25 excluding discontinued Exeter operations and accounting changes related to convertible debt and restricted stock
. . . . results from “needed” investment.
13
Investment Consideration . . . .
Dividend yield (4%) and EPS growth (5% to 7%) provide attractive total return Transparent, long-term earnings growth Constructive regulatory environment and good energy law
Upcoming Events
Earnings Call February 23 NYSE February 29
. . . . predictable, affordable, and sustainable.
14

Appendix
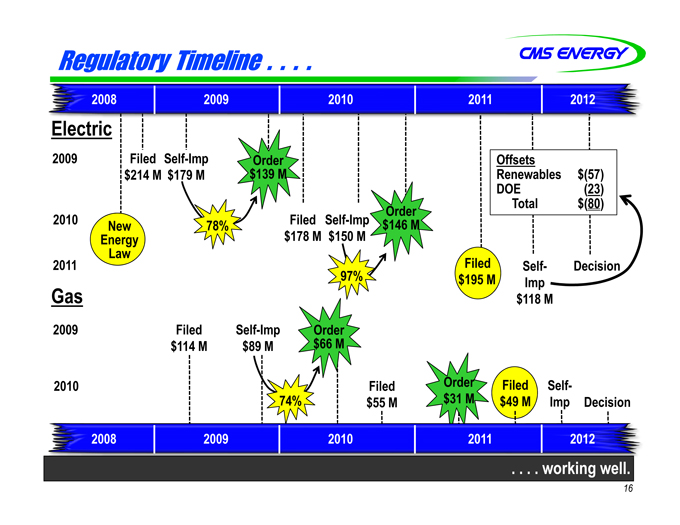
Regulatory Timeline . .
2008
2009
2010
2011
2012
Electric
2009
2010
2011
Filed Self-Imp $214 M $179 M
New Energy Law
78%
Order $139 M
Filed Self-Imp $178 M $150 M
97%%
Order $146 M
Filed $195 M
Offsets
Renewables $(57)
DOE(23)
Total $(80)
Self-Imp $118 M
Decision
Gas
2009
2010
Filed $114 M
Self-Imp
$89 M
74%
Order
$66 M
Filed
$55 M
Order
$31 M
Filed
$49 M
Self-Imp
Decision
2008
2009
2010
2011
2012
. . . . working well.
16

ELECTRIC RATE CASE U-16794*
On June 10, 2011, Consumers Energy filed an application with the Michigan Public Service Commission seeking an increase in its electric generation and distribution rates based on a test year of 12 months ending September 2012. On November 15, 2011, the MPSC Staff filed their position, recommending a rate increase of $39 million with a 9.95% return on equity. The variance between Consumers’ filed position and the MPSC Staff’s filed position is detailed below. On December 8, the Company self-implemented a rate increase of $118 million.
| Item |
Company (Mils) |
MPSC Staff (Mils) |
MPSC
Staff B/(W) (Mils) |
Explanation of Variance | ||||||||||
| 1. Rate Base |
$ | 81 | $ | 60 | $ | (21 | ) | Environmental, reliability, other Capex: ($20) Return on clean coal plant: ($1) | ||||||
| 2. Depreciation/ Property Taxes |
70 | 18 | (52 | ) | New depreciation rates: ($28) Coal plant amortization: ($7) Federal income taxes, other: ($17) | |||||||||
| 3. O&M |
(4 | ) | (44 | ) | (40 | ) | Uncollectibles (LIHEAP): ($14) Forestry: ($12) Generation O&M, other: ($14) | |||||||
| 4. Rate of Return |
(2 | ) | (45 | ) | (43 | ) | Lower return on equity: ($39) Lower debt cost: ($4) | |||||||
|
|
|
|
|
|
|
|||||||||
| 5. Sub-total |
$ | 145 | $ | (11 | ) | $ | (156 | ) | ||||||
| 6. Gross Margin |
50 | 50 | 0 | |||||||||||
|
|
|
|
|
|
|
|||||||||
| 7. Total |
$ | 195 | $ | 39 | $ | (156 | ) | |||||||
|
|
|
|
|
|
|
|||||||||
| Ratemaking Capital Structure % |
Existing (U-16191) |
Consumers Filing |
MPSC Staff Filing |
|||||||||
| Long Term Debt |
40.63 | % | 39.39 | % | 39.39 | % | ||||||
| Short Term Debt |
1.51 | 1.75 | 1.75 | |||||||||
| Preferred Stock |
0.44 | 0.42 | 0.42 | |||||||||
| Common Equity |
41.59 | 42.07 | (1) | 42.07 | ||||||||
| Deferred FIT |
15.30 | 15.89 | 15.89 | |||||||||
| JDITC/Other |
0.53 | 0.48 | 0.48 | |||||||||
|
|
|
|
|
|
|
|||||||
| 100.00 | % | 100.00 | % | 100.00 | % | |||||||
|
|
|
|
|
|
|
|||||||
| Rate Base and Return Percentage |
Existing (U-16191) |
Consumers Filing |
MPSC Staff Filing |
|||||||||
| Rate Base (billions) |
$ | 6.87 | $ | 7.54 | $ | 7.31 | ||||||
| Return on Rate Base |
6.98 | % | 6.92 | % | 6.55 | % | ||||||
| Return on Equity |
10.70 | % | 10.70 | % | 9.95 | % | ||||||
| (1) | Equivalent to 51.38% on a financial basis. |
ELECTRIC RATE CASE SCHEDULE
| Cross of all Witnesses |
December 13-22, 2011 | |
| Initial Briefs |
January 24, 2012 | |
| Reply Briefs |
February 14, 2012 | |
| Proposal for Decision |
March 30, 2012 (target) | |
| * | Electric Rate Case U-16794 can be accessed at the Michigan Public Service Commission’s website. |
| http://efile.mpsc.cis.state.mi.us/efile/electric.html |
17
GAS RATE CASE U-16855*
On September 2, 2011, Consumers Energy filed an application with the Michigan Public Service Commission seeking an increase in its gas delivery and transportation rates based on a 12 month ending December, 2012 test year. The request seeks authorization to implement an uncollectible accounts expense tracker as well as OPEB and Pension trackers. The proposed capital structure includes a 10.70% authorized return on equity. If approved, the request would add about $1.80 per month, or about 2.2%, to the typical residential customer’s average monthly bill. The $49 million revenue deficiency is detailed below.
| Item |
$ Millions | Explanation | ||||
| 1. Investment |
$ | 22 | Net plant (reliability & safety, regulatory compliance, deliverability): $17 Working capital: $11 Taxes and AFUDC: $(6) | |||
| 2. Gross Margin |
2 | Sales mix: $(4) Reduced miscellaneous revenues: $6 | ||||
| 3. O&M |
15 | Uncollectible accounts expense (reduced LIHEAP funding): $19 Reduced benefits/increased productivity: $(14) Gas pipeline integrity and safety: $10 | ||||
| 4. Cost of Capital |
10 | Return on Equity (10.70% vs. 10.50%): $4 Other capitalization costs: $6 | ||||
|
|
|
|||||
| Total |
$ | 49 | ||||
|
|
|
|||||
| Ratemaking Capital Structure |
Existing (U-16418) |
As Filed Percent of Total |
Annual Cost | After-Tax Weighted Costs |
||||||||||||
| Long Term Debt |
41.12 | % | 39.58 | % | 5.83 | % | 2.31 | % | ||||||||
| Short Term Debt |
2.36 | 2.20 | 3.91 | 0.10 | ||||||||||||
| Preferred Stock |
0.41 | 0.40 | 4.46 | 0.02 | ||||||||||||
| Common Equity |
40.10 | 41.55 | (1) | 10.70 | 4.45 | |||||||||||
| Deferred Taxes |
15.50 | 15.80 | 0.00 | 0.00 | ||||||||||||
| JDITC/Other |
0.51 | 0.47 | 8.27 | 0.02 | ||||||||||||
|
|
|
|
|
|
|
|||||||||||
| 100.00 | % | 100.00 | % | 6.90 | %(2) | |||||||||||
|
|
|
|
|
|
|
|||||||||||
| Rate Base and Return Percentage |
Existing (U-16418) |
As Filed | ||||||
| Rate Base ($ billions) |
$ | 2.86 | $ | 3.07 | ||||
| Return on Rate Base |
6.69 | % | 6.90 | % | ||||
| Return on Equity |
10.50 | % | 10.70 | % | ||||
| (1) | Equivalent to 50.96% on financial basis. |
| (2) | Equivalent to 9.76% pre-tax basis. |
GAS RATE CASE SCHEDULE
| Staff & Intervenors File Testimony |
February 3, 2012 | |
| Rebuttal Testimony |
February 21, 2012 | |
| Self-implementation Date |
March 1, 2012 | |
| Cross of all Witnesses |
March 12 through March 23 | |
| Initial Briefs |
April 20, 2012 | |
| Reply Briefs |
May 11, 2012 | |
| Proposal for Decision |
June 22, 2012 (Target) | |
| Commission Order |
Not later than Friday, August 31, 2012 | |
| * | Gas Rate Case U-16855 can be accessed at the Michigan Public Service Commission’s website. |
18
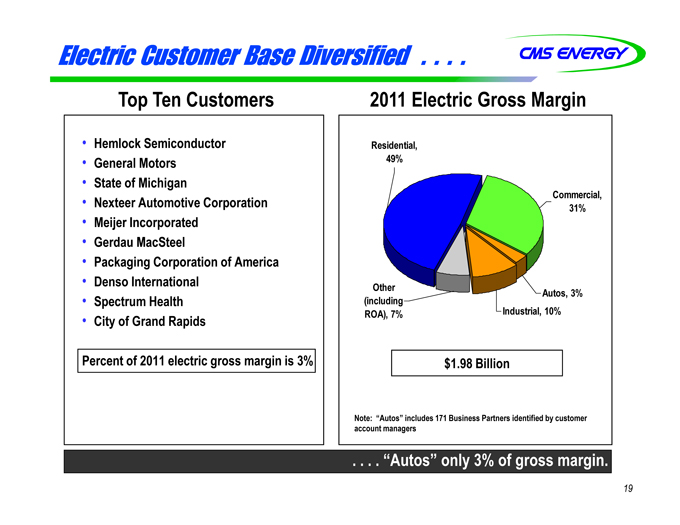
Electric Customer Base Diversified . . . .
Top Ten Customers
Hemlock Semiconductor General Motors State of Michigan Nexteer Automotive Corporation Meijjer Incorporated Gerdau MacSteel Packaging Corporation of America Denso International Spectrum Health City of Grand Rapids
Percent of 2011 electric gross margin is 3%
2011 Electric Gross Margin
Residential, 49%
Other (including ROA), 7%
Commercial, 31%
Autos, 3%
Industrial, 10%
$1.98 Billion
Note: “Autos” includes 171 Business Partners identified by customer account managers
. . . . “Autos” only 3%% of gross margin.
19
MATURITY SCHEDULE OF CMS AND CECO LONG-TERM DEBT & PREFERRED SECURITIES
AS OF 12/31/2011
Reflects conversion/redemption of $62MM (approx.) CMS Energy 2.875% Convertible Notes
| F/V |
S/U | Maturity or Call Date |
Amount (000’s) |
DEBT/ CO | ||||||||||
| SHORT-TERM DEBT: |
|
|||||||||||||
| F | U | SHORT-TERM | $ | 172,500 | 5.5% Convertible Sr Notes (Next Put Date 06/15/14) (CMS) | |||||||||
| F | U | SHORT-TERM | 225,532 | 2.875% Convertible Sr Unsec Notes (Next Put Date 12/01/14) (CMS) | ||||||||||
| F | S | 02/15/12 | 300,000 | 5% Series L FMBs (CECo) | ||||||||||
|
|
|
|||||||||||||
| $ | 698,032 | |||||||||||||
| LONG-TERM DEBT: |
|
|||||||||||||
| V | U | 01/15/13 | $ | 150,000 | Floating Rate Sr Notes (CMS) | |||||||||
| F | S | 04/15/13 | 375,000 | 5.375% Series B FMBs (CECo) | ||||||||||
|
|
|
|||||||||||||
| $ | 525,000 | |||||||||||||
| F | S | 02/15/14 | $ | 200,000 | 6% FMBs (CECo) | |||||||||
| F | U | 05/15/14 | 250,000 | 2.75% Sr Notes (CMS) | ||||||||||
|
|
|
|||||||||||||
| $ | 450,000 | |||||||||||||
| F | S | 03/15/15 | $ | 225,000 | 5% FMBs Series N (CECo) | |||||||||
| F | U | 09/30/15 | 250,000 | 4.25% Sr Notes (CMS) | ||||||||||
| F | S | 10/15/15 | 50,000 | 2.60% FMBs (CECo) | ||||||||||
| F | U | 12/15/15 | 125,000 | 6.875% Sr Notes (CMS) | ||||||||||
|
|
|
|||||||||||||
| $ | 650,000 | |||||||||||||
| F | S | 08/15/16 | $ | 350,000 | 5.5% Series M FMBs (CECo) | |||||||||
| F | S | 02/15/17 | 250,000 | 5.15% FMBs (CECo) | ||||||||||
| F | U | 07/17/17 | 250,000 | 6.55% Sr Notes (CMS) | ||||||||||
| F | S | 10/15/17 | 100,000 | 3.21% FMBs (CECo) | ||||||||||
| F | U | 02/15/18 | 250,000 | 5.05% Sr Notes (CMS) | ||||||||||
| F | S | 03/01/18 | 180,000 | 6.875% Sr Notes (CECo) | ||||||||||
| V | S | 04/15/18 | 67,700 | VRDBs to replace PCRBs (CECo) | ||||||||||
| F | S | 09/15/18 | 250,000 | 5.65% FMBs (CECo) | ||||||||||
| F | S | 03/15/19 | 350,000 | 6.125% FMBs (CECo) | ||||||||||
| F | U | 06/15/19 | 300,000 | 8.75% Sr Notes (CMS) | ||||||||||
| F | S | 09/15/19 | 500,000 | 6.70% FMBs (CECo) | ||||||||||
| F | U | 02/01/20 | 300,000 | 6.25% Sr Notes (CMS) | ||||||||||
| F | S | 04/15/20 | 300,000 | 5.65% FMBs (CECo) | ||||||||||
| F | S | 10/15/20 | 100,000 | 3.77% FMBs (CECo) | ||||||||||
| F | S | 09/01/22 | 250,000 | 5.30% FMBs (CECo) | ||||||||||
| F | U | 07/15/27 | 28,667 | QUIPS 7.75%(CMS) Pref Sec | ||||||||||
| V | S | 04/01/35 | 35,000 | PCRBs (CECo) | ||||||||||
| F | S | 09/15/35 | 175,000 | 5.80% FMBs (CECo) | ||||||||||
| F | S | 09/01/40 | 50,000 | 6.17% FMBs (CECO) | ||||||||||
| F | S | 10/15/40 | 50,000 | 4.97% FMBs (CECo) | ||||||||||
|
|
|
|||||||||||||
| $ | 4,136,367 | |||||||||||||
| $ | 6,459,399 | TOTAL | ||||||||||||
|
|
|
|||||||||||||
| $ | 6,430,732 | TOTAL EXCLUDING PREFERRED SECURITIES | ||||||||||||
|
|
|
|||||||||||||
| Various Maturity Dates/No Maturity Date Available: | ||||||||||||||
| $ | 171,456 | CECo Securitization Bonds after 10/20/11 payment | ||||||||||||
| 191,184 | CECo Capital lease rental commitments as of 12/31/11 | |||||||||||||
| 461,721 | EnerBank Discount Brokered CDs as of 12/31/11 (CMS) | |||||||||||||
| (16,344 | ) | CMS Net unamortized discount as of 12/31/11 | ||||||||||||
| (3,402 | ) | CECo Net unamortized discount as of 12/31/11 | ||||||||||||
|
|
|
|||||||||||||
| $ | 7,264,013 | GRAND TOTAL | ||||||||||||
Status Codes: F-Fixed rate; V-Variable rate; S-Secured; U-Unsecured
20
GAAP Reconciliation
CMS ENERGY CORPORATION
Earnings Per Share By Year GAAP Reconciliation
(Unaudited)
| 2003 | 2004 | 2005 | 2006 | 2007 | 2008 | 2009 | 2010 | |||||||||||||||||||||||||
| Reported earnings (loss) per share - GAAP |
($ | 0.30 | ) | $ | 0.64 | ($ | 0.44 | ) | ($ | 0.41 | ) | ($ | 1.02 | ) | $ | 1.20 | $ | 0.91 | $ | 1.28 | ||||||||||||
|
|
|
|
|
|
|
|
|
|
|
|
|
|
|
|
|
|||||||||||||||||
| After-tax items: |
||||||||||||||||||||||||||||||||
| Electric and gas utility |
0.21 | (0.39 | ) | — | — | (0.07 | ) | 0.05 | 0.33 | 0.03 | ||||||||||||||||||||||
| Enterprises |
0.74 | 0.62 | 0.04 | (0.02 | ) | 1.25 | (0.02 | ) | 0.09 | (0.03 | ) | |||||||||||||||||||||
| Corporate interest and other |
0.16 | (0.03 | ) | 0.04 | 0.27 | (0.32 | ) | (0.02 | ) | 0.01 | * | |||||||||||||||||||||
| Discontinued operations (income) loss |
(0.16 | ) | 0.02 | (0.07 | ) | (0.03 | ) | 0.40 | (* | ) | (0.08 | ) | 0.08 | |||||||||||||||||||
| Asset impairment charges, net |
— | — | 1.82 | 0.76 | 0.60 | — | — | — | ||||||||||||||||||||||||
| Cumulative accounting changes |
0.16 | 0.01 | — | — | — | — | — | — | ||||||||||||||||||||||||
|
|
|
|
|
|
|
|
|
|
|
|
|
|
|
|
|
|||||||||||||||||
| Adjusted earnings per share, including MTM - non-GAAP |
$ | 0.81 | $ | 0.87 | $ | 1.39 | $ | 0.57 | $ | 0.84 | $ | 1.21 | (a) | $ | 1.26 | $ | 1.36 | |||||||||||||||
| Mark-to-market impacts |
0.03 | (0.43 | ) | 0.51 | ||||||||||||||||||||||||||||
|
|
|
|
|
|
|
|
|
|
|
|
|
|
|
|
|
|||||||||||||||||
| Adjusted earnings per share, excluding MTM - non-GAAP |
NA | $ | 0.90 | $ | 0.96 | $ | 1.08 | NA | NA | NA | NA | |||||||||||||||||||||
|
|
|
|
|
|
|
|
|
|
|
|
|
|
|
|
|
|||||||||||||||||
| * | Less than $500 thousand or $0.01 per share. |
| (a) | $1.25 excluding discontinued Exeter operations and accounting changes related to convertible debt and restricted stock. |
CMS Energy
Reconciliation of Gross Operating Cash Flow to GAAP Operating Activities
(unaudited)
(mils)
| 2009 | 2010 | 2011 | 2012 | 2013 | 2014 | 2015 | ||||||||||||||||||||||
| Consumers Operating Income + Depreciation & Amortization |
$ | 1,248 | $ | 1,498 | $ | 1,527 | $ | 1,651 | $ | 1,735 | $ | 1,860 | $ | 1,977 | ||||||||||||||
| Enterprises Project Cash Flows |
16 | 39 | 24 | 25 | 27 | 33 | 35 | |||||||||||||||||||||
|
|
|
|
|
|
|
|
|
|
|
|
|
|
|
|||||||||||||||
| Gross Operating Cash Flow |
$ | 1,264 | $ | 1,537 | $ | 1,551 | $ | 1,676 | $ | 1,762 | $ | 1,893 | $ | 2,012 | ||||||||||||||
| Other operating activities including taxes, interest payments and working capital |
(416 | ) | (578 | ) | (382 | ) | (426 | ) | (412 | ) | (443 | ) | (757 | ) | ||||||||||||||
|
|
|
|
|
|
|
|
|
|
|
|
|
|
|
|||||||||||||||
| Net cash provided by operating activities |
$ | 848 | $ | 959 | $ | 1,169 | $ | 1,250 | $ | 1,350 | $ | 1,450 | $ | 1,255 | ||||||||||||||
|
|
|
|
|
|
|
|
|
|
|
|
|
|
|
|||||||||||||||