Attached files
| file | filename |
|---|---|
| 8-K - FORM 8-K - AMERICAN RIVER BANKSHARES | arb_8k.htm |
EXHIBIT 99.1
David T. Taber, President & CEO
Page 4 of Page 21
Forward-Looking Statements FIG Partners' 3rd Annual West Coast Bank CEO Forum February 7, 2012 Certain statements contained herein are forward-looking statements within the meaning of Section 27A of the Securities Act of 1933 and Section 21E of the Securities Exchange Act of 1934 and subject to the safe harbor provisions of the Private Securities Litigation Reform Act of 1995, that involve risks and uncertainties. Actual results may differ materially from the results in these forward-looking statements. Factors that might cause such a difference include, among other matters, changes in interest rates, economic conditions, governmental regulation and legislation, credit quality, and competition affecting the Company’s businesses generally; the risk of natural disasters and future catastrophic events including terrorist related incidents; and other factors discussed in the Company’s Annual Report on Form 10-K for the year ended December 31, 2010, and in subsequent reports filed on Form 10-Q and Form 8-K. The Company does not undertake any obligation to publicly update or revise any of these forward-looking statements, whether to reflect new information, future events or otherwise, except as required by law.
Page 5 of Page 21
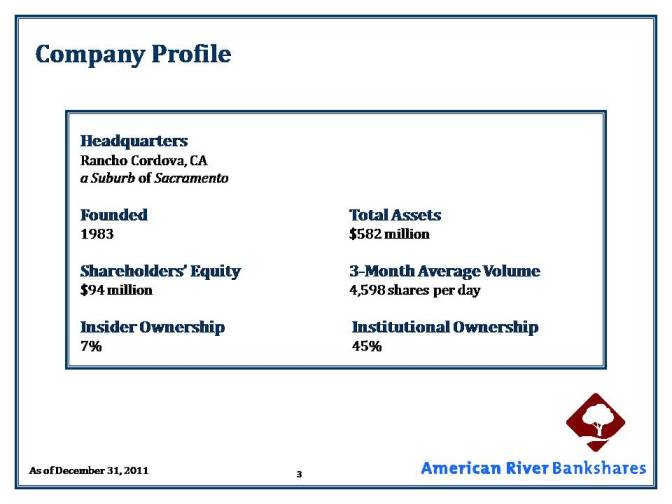
Company Profile Headquarters Rancho Cordova, CA a Suburb of Sacramento Founded Total Assets 1983 $582 million Shareholders’ Equity 3-Month Average Volume $94 million 4,598 shares per day
Insider Ownership Institutional Ownership 7% 45% As of December 31, 2011
Page 6 of Page 21
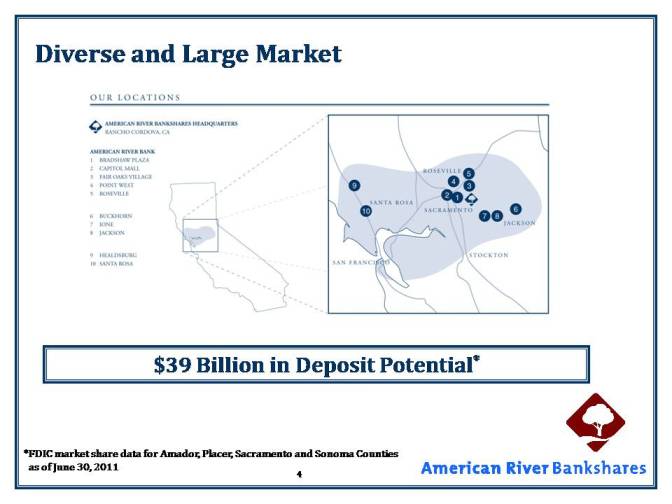
Diverse and Large Market $39 Billion in Deposit Potential* *FDIC market share data for Amador, Placer, Sacramento and Sonoma Counties as of June 30, 2011
Page 7 of Page 21
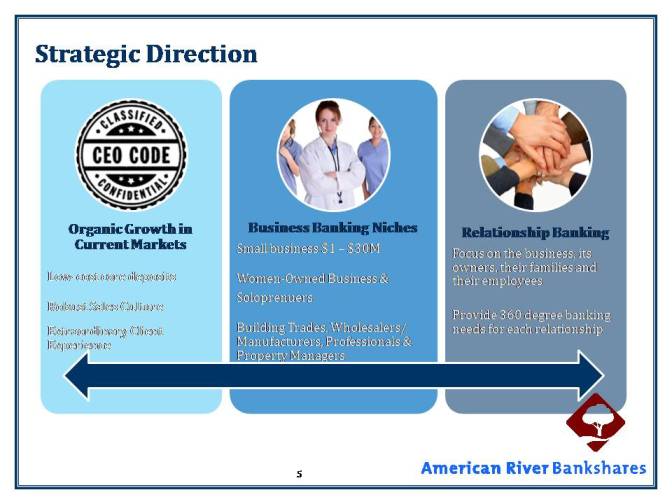
Strategic Direction
Page 8 of Page 21
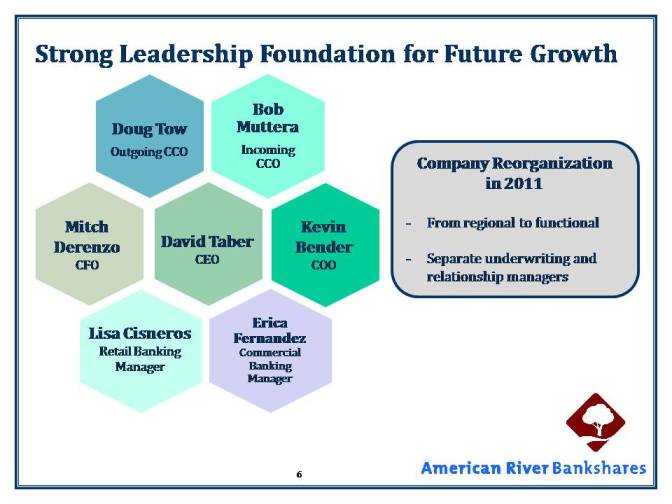
Strong Leadership Foundation for Future Growth
Page 9 of Page 21

Proactive Credit Management
Page 10 of Page 21
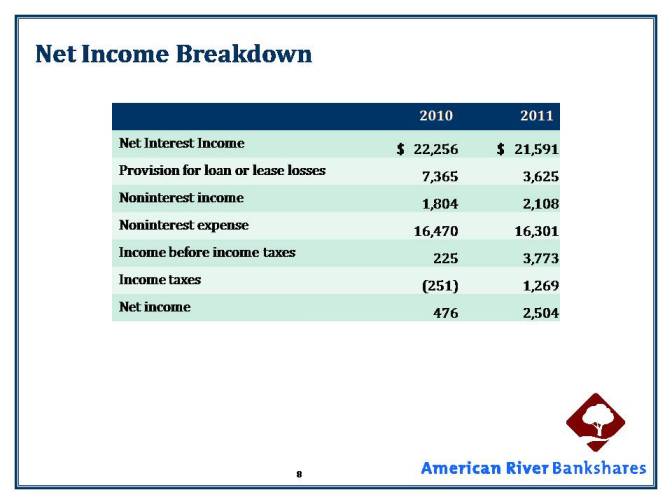
Net Income Breakdown
| 2010 | 2011 | |
| Net Interest Income | $ 22,256 | $ 21,591 |
| Provision for loan or lease losses | 7,365 | 3,625 |
| Noninterest income | 1,804 | 2,108 |
| Noninterest expense | 16,470 | 16,301 |
| Income before income taxes | 225 | 3,773 |
| Income taxes | (251) | 1,269 |
| Net income | 476 | 2,504 |
Page 11 of Page 21
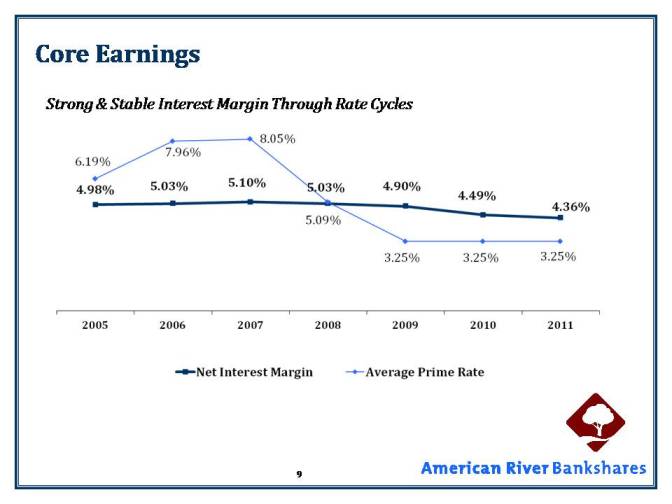
Core Earnings Strong & Stable Interest Margin Through Rate Cycles
Page 12 of Page 21
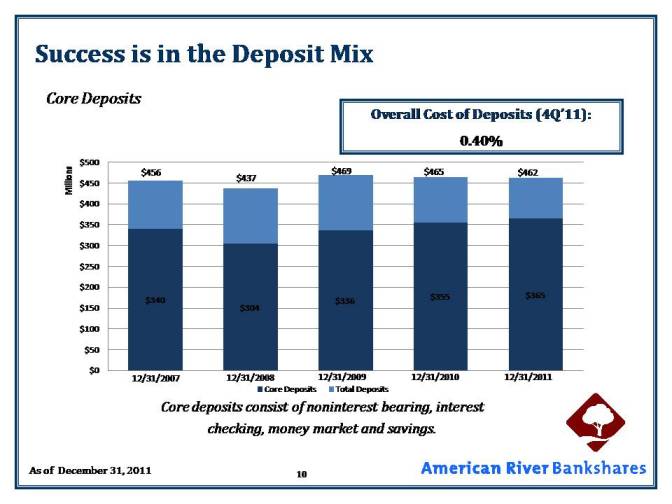
Success is in the Deposit Mix Core Deposits Overall Cost of Deposits (4Q’11): 0.40% Core deposits consist of noninterest bearing, interest checking, money market and savings. As of December 31, 2011
Page 13 of Page 21
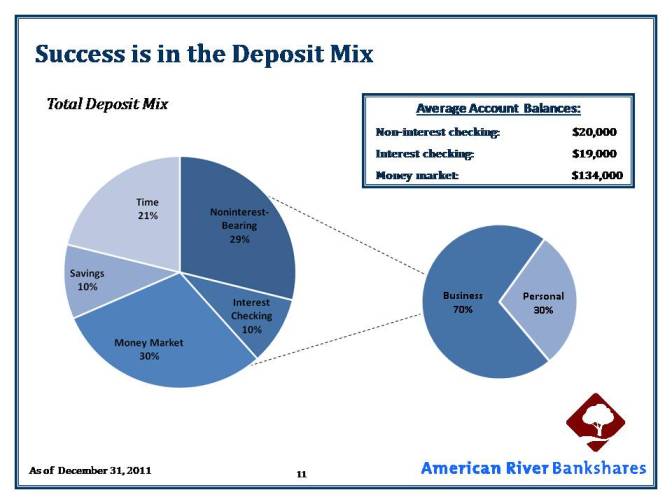
Success is in the Deposit Mix Total Deposit Mix Non-interest checking: $20,000 Interest checking: $19,000
Money market: $134,000 As of December 31, 2011
Page 14 of Page 21
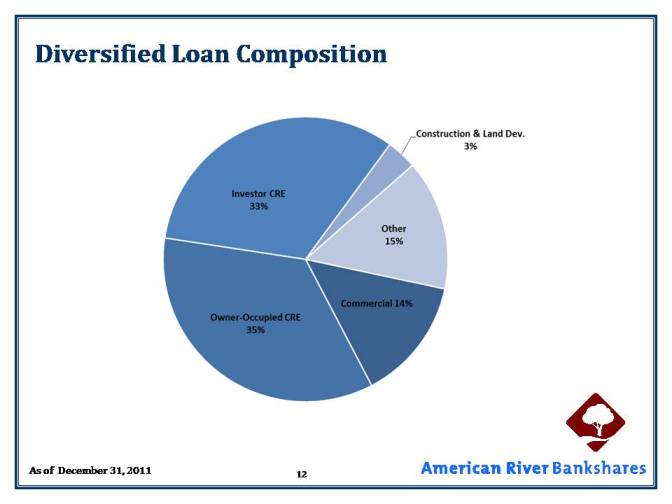
Diversified Loan Composition
As of December 31, 2011
Page 15 of Page 21
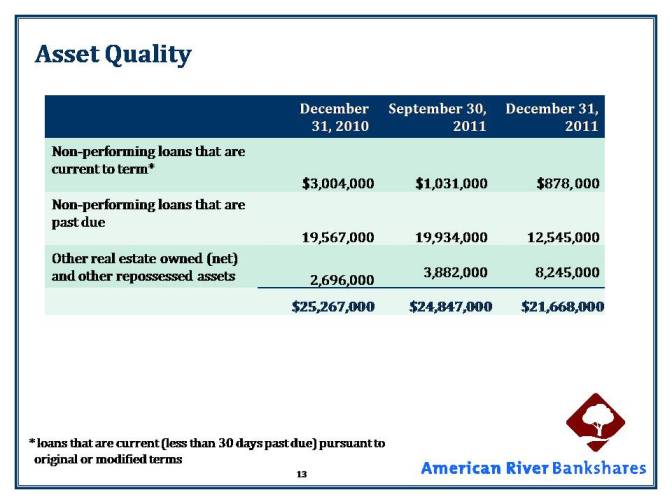
Asset Quality
| December 31, 2010 | September 30, 2011 | December 31, 2011 | |
| Non-performing loans that are current to term* | $3,004,000 | $1,031,000 | $878, 000 |
| Non-performing loans that are past due | 19,567,000 | 19,934,000 | 12,545,000 |
| Other real estate owned (net) and other repossessed assets | 2,696,000 | 3,882,000 | 8,245,000 |
| $25,267,000 | $24,847,000 | $21,668,000 |
* loans that are current (less than 30 days past due) pursuant to original or modified terms
Page 16 of Page 21
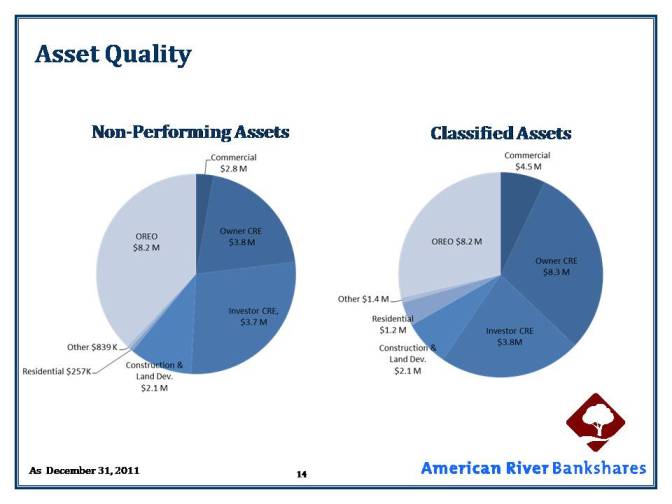
Asset Quality Non-Performing Assets Classified Assets As December 31, 2011
Page 17 of Page 21
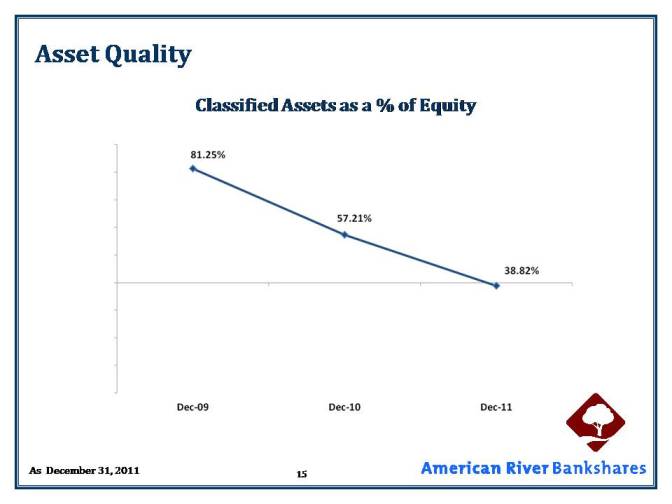
Asset Quality Classified Assets as a % of Equity As December 31, 2011
Page 18 of Page 21
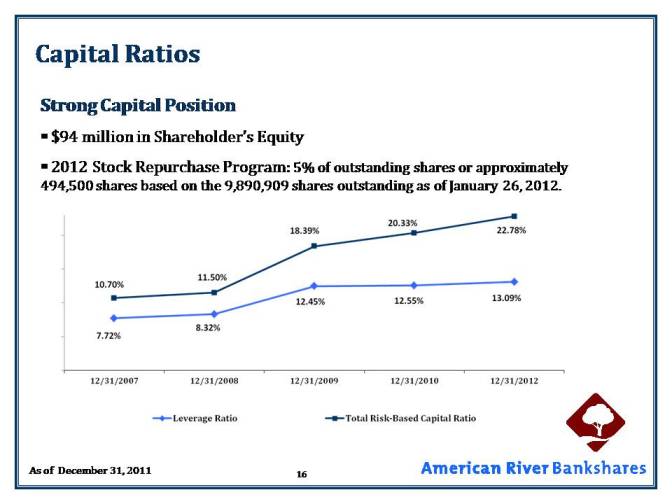
Capital Ratios
Strong Capital Position
▪ $94 million in Shareholder’s Equity
▪ 2012 Stock Repurchase Program: 5% of outstanding shares or approximately 494,500 shares based on the 9,890,909 shares outstanding as of January 26, 2012.
As of December 31, 2011
Page 19 of Page 21
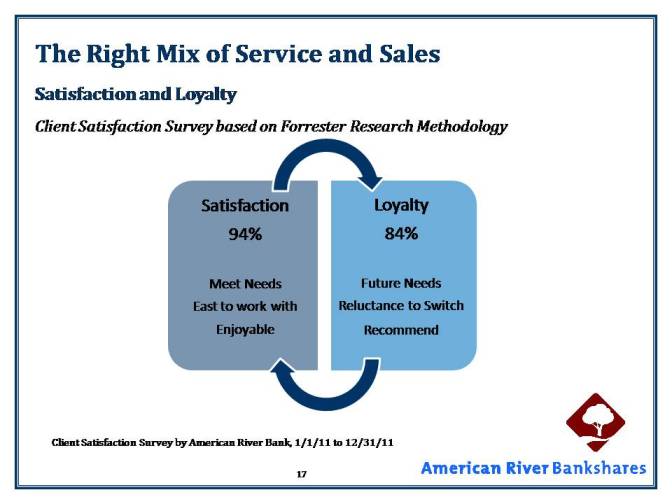
The Right Mix of Service and Sales Satisfaction and Loyalty Client Satisfaction Survey based on Forrester Research Methodology Client Satisfaction Survey by American River Bank, 1/1/11 to 12/31/11
Page 20 of Page 21
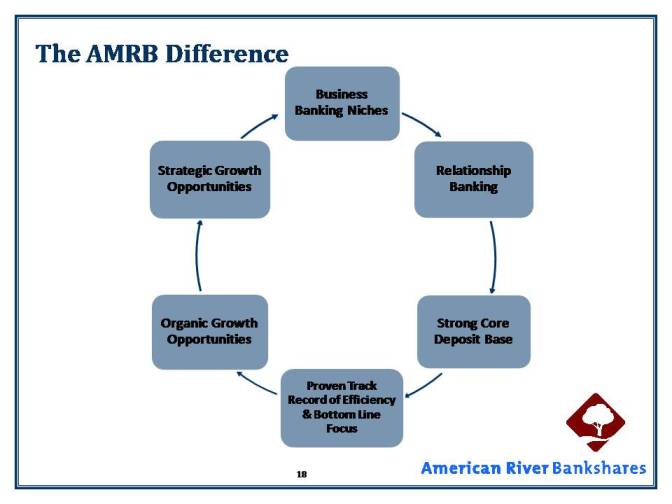
The AMRB Difference
Page 21 of Page 21