Attached files
| file | filename |
|---|---|
| 8-K - FORM 8-K - SunCoke Energy, Inc. | d294219d8k.htm |
| EX-99.2 - SUPPLEMENTAL FINANCIAL INFORMATION - SEGMENT REVENUES - SunCoke Energy, Inc. | d294219dex992.htm |
 Investor
Presentation February 2012
Exhibit 99.1 |
 1
Safe Harbor Statement
Oppenheimer 2nd Annual London 1-1 Investor Conference
Some of the information included in this presentation contains “forward-looking
statements” (as defined in Section 27A of the Securities Act of 1933, as amended and
Section 21E of the Securities Exchange Act of 1934, as amended). Such forward-looking
statements are based on management’s beliefs and assumptions and on information currently available.
Forward-looking statements include the information concerning SunCoke’s possible or assumed
future results of operations, business strategies, financing plans, competitive position,
potential growth opportunities, potential operating performance improvements, effects resulting
from our separation from Sunoco, the effects of competition and the effects of future
legislation or regulations. Forward-looking statements include all statements that are not historical facts and may
be identified by the use of forward-looking terminology such as the words “believe,”
“expect,” “plan,” “intend,” “anticipate,”
“estimate,” “predict,” “potential,” “continue,”
“may,” “will,” “should” or the negative of these terms or similar expressions.
Forward-looking statements involve risks, uncertainties and assumptions. Actual results may differ
materially from those expressed in these forward-looking statements. You should not put
undue reliance on any forward-looking statements.
In accordance with the safe harbor provisions of the Private Securities Litigation Reform Act of
1995, SunCoke has included in its filings with the Securities and Exchange Commission
cautionary language identifying important factors (but not necessarily all the important
factors) that could cause actual results to differ materially from those expressed in any
forward-looking statement made by SunCoke. For more information concerning these factors, see
SunCoke's Securities and Exchange Commission filings. All forward-looking statements
included in this presentation are expressly qualified in their entirety by such cautionary
statements. SunCoke undertakes no obligation to update publicly any forward-looking
statement (or its associated cautionary language) whether as a result of new information or future events or otherwise.
This presentation includes certain non-GAAP financial measures intended to supplement, not
substitute for, comparable GAAP measures. Reconciliations of non-GAAP financial measures to
GAAP financial measures are provided in the Appendix at the end of the presentation. Investors
are urged to consider carefully the comparable GAAP measures and the reconciliations to those
measures provided in the Appendix, or on our website at www.suncoke.com.
|
 2
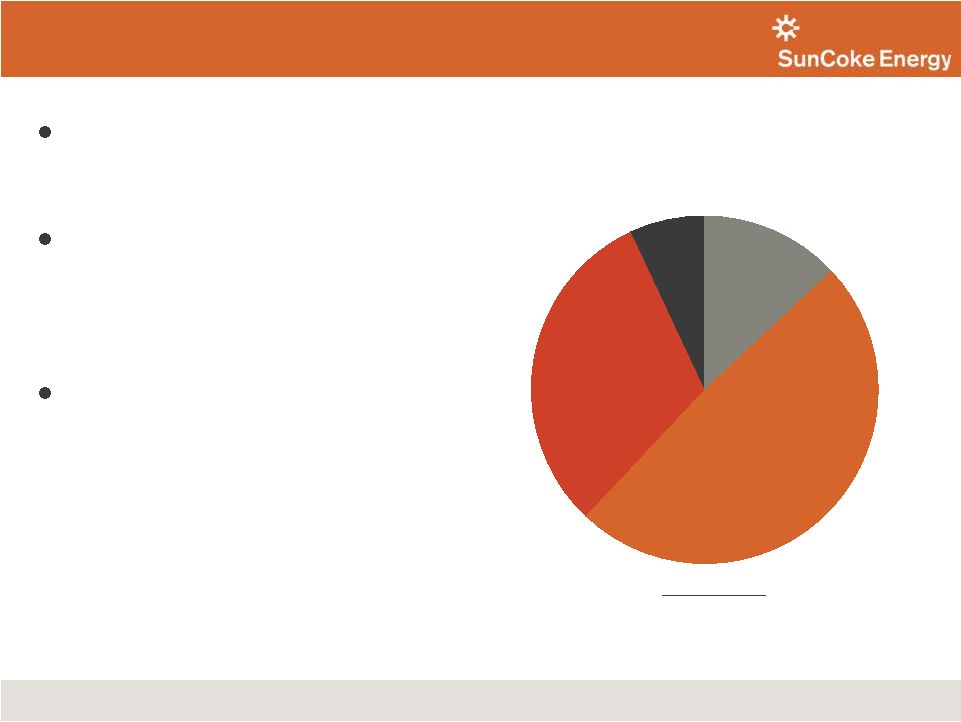
Coal
Mining
13%
Jewell
Coke
31%
Int'l Coke
7%
Other Domestic Coke
49%
SunCoke Introduction
2011 Adjusted EBITDA
(1)
(excluding Corporate Segment)
(1) For a definition of Adjusted EBITDA, please see the appendix.
Oppenheimer 2nd Annual London 1-1 Investor Conference
Largest independent producer of
metallurgical coke in Americas with
nearly 50 years experience
~85% of Adjusted EBITDA
(1)
generated
by cokemaking business
-
Secure, long-term take-or-pay
contracts with leading steelmakers
Metallurgical coal mining operations in
Virginia and West Virginia
-
2011 production of approximately
1.4 million tons
-
High quality metallurgical coal
reserves; primarily mid-vol.
2011 Results:
•Revenue of $1.5 billion
•Adjusted EBITDA
(1)
of $140.5 million |
 3
5.9 million tons of capacity with
new Middletown, Ohio facility
-
Six cokemaking facilities; five in
U.S. and one in Brazil
-
More than doubled capacity
since 2005
Proven ability to permit, develop,
construct and start up new
facilities and work internationally
Industry leading environmental
signature: U.S. EPA Maximum
Achievable Control Technology
The Leading Independent Cokemaker
SunCoke
Cokemaking Capacity
(Tons in thousands)
Oppenheimer 2nd Annual London 1-1 Investor Conference
0
1,000
2,000
3,000
4,000
5,000
6,000
7,000
2004
2005
2006
2007
2008
2009
2010
2011
Jewell Coke
Indiana Harbor
Haverhill I
Vitória
Haverhill II
Granite City
Middletown |
 4
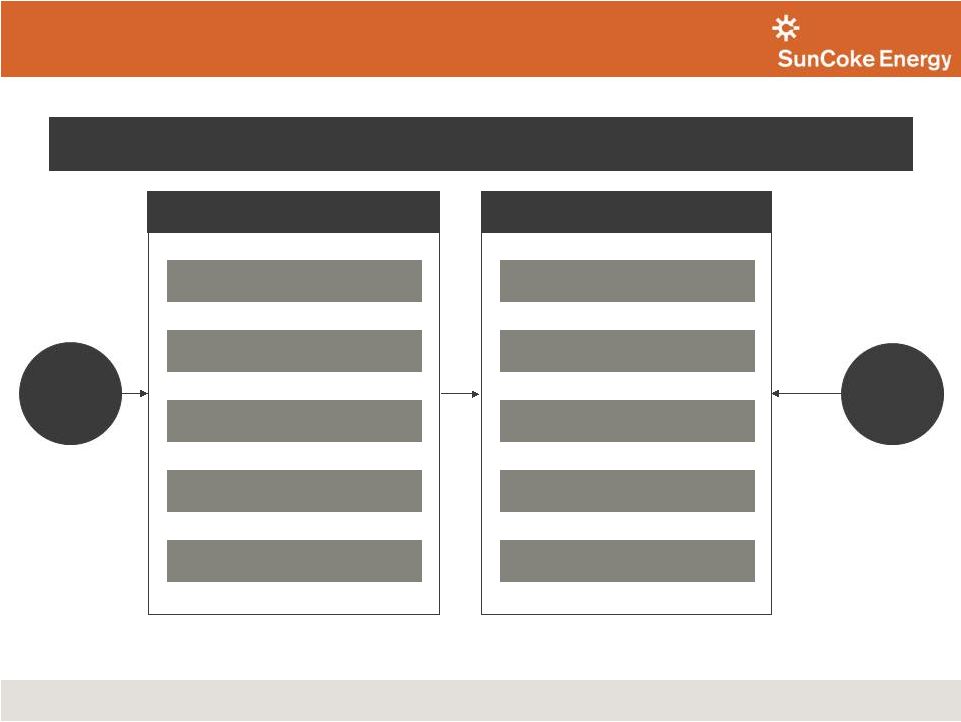
SunCoke’s Heat Recovery Oven vs. By-Product Oven
SunCoke’s technology is the industry’s environmental standard and provides many
advantages over the traditional cokemaking process
Oppenheimer 2nd Annual London 1-1 Investor Conference
Pressurization
Negative pressure
Positive pressure
Air Emissions
MACT standard for new
batteries
Potential for emission of hazardous
compounds
Power Generation
Cogenerates power
Power consuming process
Hazardous Inputs
None
Yes
–
sulfuric acid
Volatile Organic Compounds
Complete combustion
No combustion
Solid Wastes
No toxic solid wastes
Process produces toxic waste streams
SunCoke Heat Recovery
Traditional By-Product |
 5
SunCoke‘s Value Proposition
Provide an assured supply of coke to steelmakers
Larger, stronger coke for improved blast furnace performance
Demonstrated sustained 30% turndown; higher turndown on temporary basis
High quality coke with cheaper coal blends
Burn loss vs. by-product
Capital preservation and lower capacity cost per ton; particularly relative to
greenfield investment
Stringent U.S. regulatory environment
Power prices and reliability versus value of coke oven gas and by-product
"credits"
High Quality &
Reliable Coke
Supply
Turndown
Flexibility
Coal Flexibility
Capital
Efficiency
and Flexibility
Environmental /
Economic
Trade-offs
Oppenheimer 2nd Annual London 1-1 Investor Conference |
 6
SunCoke’s Contract Proposition
Plant
Production
and
Environmental
Compliance
Permits and Approvals
Engineering, Procurement &
Construction
Capital Funding and Ownership
Reliable, High-Quality Coke Supply
Deliver coke to customers through a competitive turnkey solution,
which produces a consistent stream of earnings
Operating Cost Component
(Pass-Through)
Fixed Fee
(Profit and Return on Capital)
Coal Cost Component
(Pass-Through)
Take-Or-Pay
Taxes
and
Transportation
and
Future
Environmental
Costs
(Pass-Through)
Coke fee
Energy fee
Typical Key Coke Sales Agreement
Provisions
What SunCoke Offers
Oppenheimer 2nd Annual London 1-1 Investor Conference
SunCoke
Energy
Customer |
 7
Focused Growth Strategy
Expand domestic coal production from current reserves and
improve efficiency of existing mines
We believe
SunCoke
Energy is
uniquely
positioned for
continued
investment and
earnings
growth
Continue to grow our U.S. and Canada cokemaking businesses;
reserving portion of future coke capacity for market sales
Grow international footprint in key growth markets with
immediate focus on India
Growth Initiatives
Oppenheimer 2nd Annual London 1-1 Investor Conference |
 8
SunCoke's U.S. and Canada Market Position
Chinese Coke Price vs. Representative SunCoke Price
North American Coke Imports
SunCoke believes it has the opportunity to displace higher cost coke imports
.
SunCoke
Chinese
Q4 2011 Average:
$395
$422
2011 Average:
$387
$431
2008-2010 Average:
$326
$430
(US$/ton)
5.4
3.6
2.5
2.6
2.8
3.6
5.6
1.3
2.4
2.8
2.3
–
1.0
2.0
3.0
4.0
5.0
6.0
2006
2007
2008
2009
2010
2011E
2012E
2013E
2014E
2015E
2021E
SunCoke domestic coke sales volumes
SunCoke weighted-average domestic cokemaking capacity
(Tons in millions)
Source: CRU, The Annual Outlook for Metallurgical Coke 2011.
(1)
Represents SunCoke’s domestic cokemaking capacity weighted by the number of
months each facility operated during that year.
(1)
(1)
Source: Steel Business Briefing, 2012
(1)
Other Domestic Coke sales and other operating revenues divided by tons sold.
Oppenheimer 2nd Annual London 1-1 Investor Conference
$200
$300
$400
$500
$600
$700
Jan-08
Jan-09
Jan-10
Jan-11 |
 9
$301
$442
$517
$395
$11
$130
$50
$25
$0
$100
$200
$300
$400
$500
Chinese Coke
Production Costs (1)
Handling/
Transportation
to Chinese Port
Average Export
License/
Tax Cost (40% Tariff)
Chinese Coke Cost
FOB Chinese Port
Transportation to
U.S.
Handling Losses
Net of Breeze Value
Chinese Coke Price
Delivered to U.S.
Q4 '11 SunCoke
Domestic Coke Price
SunCoke's U.S. and Canada Market Position
Source: CRU, The Annual Outlook for Metallurgical Coke 2011;
Company estimates. (1) Chinese Coke Production Costs net of By-Product
Credits; does not include return on capital. ($ per ton of coke)
Oppenheimer 2nd Annual London 1-1 Investor Conference
SunCoke Domestic Coke Pricing vs. Chinese Imports
40%
Tariff |
 10
2010 U.S. & Canada Coke Supply
SunCoke’s U.S. and Canada Market Position
Source: CRU, The Annual Outlook for Metallurgical Coke 2011.
Replace aging coke batteries operated by integrated steel producers
Source: CRU, The Annual Outlook for Metallurgical Coke 2011.
Oppenheimer 2nd Annual London 1-1 Investor Conference
12 million tons or 56% of coke capacity at facilities
>30 years old
Integrated
Steel
Producers
60%
SunCoke
18%
DTE
5%
Other Merchant &
Foundry
7%
Imports
10%
Aging Cokemaking Facilities
9
41
28%
28%
SunCoke
U.S. & Canada
(excl SXC)
30-40 years
40+ years
Average Age
% of U.S. & Canada
coke production |
 11
19
22
17
19
19
20
12
18
18
19
51
27
40
48
–
10
20
30
40
50
60
2006
2007
2008
2009
2010
2011E
2012E
2013E
2014E
2015E
Blast Furnace Coke Demand
BF/BOF Crude Steel Production
SunCoke's U.S. and Canada Market Position
BF/BOF Crude Steel Production
and Blast Furnace Coke Demand
3
2
Aging battery
replacement
Demand growth with
market recovery
Expected demand
opportunity by
2015
5
2010 Coke Rate:
894 lbs/thm
2015E Coke Rate:
800 lbs/thm
Market Opportunity
Source: CRU, The Annual Outlook for Metallurgical Coke 2011;
Company estimates. In million tons
million tons
Oppenheimer 2nd Annual London 1-1 Investor Conference
•
We
believe
SunCoke
is
positioned
to
capture
significant
share
of
market
opportunity
•
Next U.S. coke plant size anticipated to be up to 1.1 million tons
•
Near-term focus remains on obtaining permits; anticipated in latter half of 2012
•
Will defer seeking customer commitments until further progress on permits achieved in light
of current economic outlook |
 12
India –
Macro Outlook
Population growth
•
1.2 billion people today
•
Projected 1.5 billion by 2030
•
Growth equal to the entire U.S.
population
Urbanization
•
Less than 50% urban population
•
Vehicle production 3.6 MM (’11)
vs. 13 MM in NAFTA
•
Lowest steel intensity of BRICs
Economic prosperity
•
Economy expected to grow
6-8% per year
•
Per capital income could triple
Per Capita Crude Steel Use
(2010)
Kg/y
India
58
Brazil
147
United States
292
China
445
World Avg.
221
Source: World Steel Association, 2011.
Significant
Expected
GDP
Growth
Source: CIA World Factbook.
Oppenheimer 2nd Annual London 1-1 Investor Conference
Source: Census.gov, United States Census Bureau - International Data Base, CIA World
Factbook.
|
 13
India Opportunity for SunCoke
Oppenheimer 2nd Annual London 1-1 Investor Conference
India
Steel/Coke
Market
Strong market
fundamentals
with good fit
for SunCoke
technology
GROWING STEEL MARKET
•
Projected to be 3rd largest
steel market by 2020
•
Blast furnace to play a
critical role in growth
COKE SUPPLY DEFICIT
•
Importing between 2 and
5 million tons annually
•
Coke capacity investment
lags steel investment
•
3.5 million tons merchant
production or 13% of total
•
17 active merchant coke
producers
•
10% -
20% short power
•
Average wholesale price
>$80 mwh (2x U.S. rate)
ELECTRIC POWER DEFICIT
ACTIVE MERCHANT MARKET
Sources: CRU, The Annual Outlook for Metallurgical Coke 2011, CIA World
Factbook.
|
 14
Why is China Important?
Chinese Crude Steel Production and Coke Consumption
Source: CRU, The Annual Outlook for Metallurgical Coke 2011;
Company estimates. In million tons
2011E World Steel Production
2011E World Coke Production
Oppenheimer 2nd Annual London 1-1 Investor Conference
•
Chinese steel market represents 45% of
world production
•
Steel market expected to grow 46%
over the next 10 years producing an
incremental 300+ million tons (more
than 2x entire U.S. market)
•
Integrated steelmaking comprises 90%
of production, driving China to
represent 62% of the world coke
market
•
China’s coke demand expected to grow
approximately 160 million tons in the
next 10 years (equivalent to nearly 7
U.S. markets)
•
Chinese government has targeted
closure of nearly 40 million tons of
older/inefficient coke capacity
Source: CRU, The Annual Outlook for Metallurgical Coke 2011;
Company estimates. Source: CRU, The Annual Outlook for Metallurgical Coke
2011; Company estimates. 290
344
393
493
520
570
339
366
411
439
467
464
966
1,069
732
626
912
855
792
691
552
545
–
150
300
450
600
750
900
1,050
1,200
2006
2007
2008
2009
2010
2011E
2012E
2013E
2014E
2015E
2021E
Chinese Consumption of Coke
Chinese Crude Steel Production
7%
3%
Rest of
World
48%
China
45%
U.S. & Canada
Rest of
World
35%
China
62%
U.S. &
Canada |
 15
Coal Expansion
0.35 million tons expected
surface mining
1.15 million tons
expected production from Jewell
underground mines
0.30 million tons HKCC acquisition
Projected 2012 Coal Production
Planned Growth
Current Operations
Underground
Mining
Surface
Mining
Selective
Reserve
Additions
1.80 million tons
(Projected 2012 production; an
estimated increase of approximately
0.4 million tons from 2011E)
+
+
=
106 million tons of proven
and probable reserves
Reserve life of 50+ years
Near term focus on increasing
productivity at existing mines;
will defer opening new mines
until 2013
Currently limited to highwall
mining at HKCC
Signed agreement to extract
additional surface tons
Expect 1.2 million tons
over 3 years beginning in
2012
Acquired Harold Keene Coal
Companies in January 2011
Open to opportunistic
additions of coal reserves
Oppenheimer 2nd Annual London 1-1 Investor Conference |
 16
Q4 2011 and Full Year 2011 Earnings Overview
Oppenheimer 2nd Annual London 1-1 Investor Conference
•
Q4 2011 and Full Year 2011 missed expectations due to unfavorable
impact of $12.2 million (net of income attributable to noncontrolling
interests) in accounting adjustments at Indiana Harbor
•
Q4 2011 Net Income attributable to shareholders of $8.0 million and
EPS of $0.12 per share
•
Full Year Net Income attributable to shareholders of $60.6 million
and EPS of $0.87 per share
•
Q4 2011 Adjusted EBITDA of $31.4 million and Full Year 2011
Adjusted EBITDA of $140.5 million
•
Executed successful startup of Middletown in late October
•
Continued strong domestic coke plant performance
•
Full Year 2011 Coal Mining Adjusted EBITDA increased $28M over 2010
•
Solid year end liquidity position with cash balance of $128 million and
undrawn revolver
•
Separation from Sunoco, Inc. completed on January 17, 2012
•
Elected three new independent directors to the Board |
 17
Q4 2010 to Q4 2011
Adjusted EBITDA
(1)
Bridge
Adjusted EBITDA decrease reflects Indiana Harbor adjustments, higher corporate
costs and Black Lung Liability charge, offset by improved performance in Coal Mining and
the absence of ArcelorMittal legal/settlement costs
($ in millions)
Oppenheimer 2nd Annual London 1-1 Investor Conference
$34.7
$31.4
$10.2
$12.9
($12.2)
($6.5)
($6.0)
($1.7)
Q4 2010
Adjusted
EBITDA
Indiana Harbor
Adjustments
Corporate/Other
(Relocation/
Standalone) (2)
Black Lung
Liability Charge
Coke Segments
(Jewel Coke
Other Domestic Coke/
International)(3)
Net ArcelorMittal
Settlement Impact
Coal Mining (2) (3)
Q4 2011
Adjusted
EBITDA
(1) For a definition of Adjusted EBITDA and reconciliation of Adjusted EBITDA to net
income and operating income, please see the appendix.
(2)
Excludes Black Lung Liability charge
(3)
Jewell Coke includes approximately $0.2 million in favorable coal transfer impact, Coal
Mining includes offsetting $0.2 million unfavorable coal transfer impact.
|
 18
Full Year 2010 to 2011
Adjusted EBITDA
(1)
Bridge
Adjusted EBITDA decrease reflects impact of ArcelorMittal settlement and higher corporate
costs,
offset by improved Coal Mining results
($ in millions)
Oppenheimer 2nd Annual London 1-1 Investor Conference
(1) For a definition of Adjusted EBITDA and reconciliation of Adjusted EBITDA to net
income and operating income, please see the appendix.
(2)
Excludes Black Lung Liability charge
(3)
Jewell Coke includes approximately $16.0 million in unfavorable coal transfer impact,
Coal Mining includes offsetting $16.0 million favorable coal transfer impact.
(4)
Excludes Middletown losses
$227.3
$140.5
$31.0
($34.7)
($23.9)
($28.5)
($12.2)
($7.3)
($11.2)
2010
Adjusted
EBITDA
Net ArcelorMittal
Settlement Impact
Corporate/Other
(Relocation/
Standalone Costs)
(2)(4)
Jewell Coke (3)
(ex-settlement)
Indiana Harbor
Adjustments
Other Domestic
Coke
(ex-settlement)(4)
Other
(Black Lung/
Middletown/
International)
Coal Mining (2)(3)
2011
Adjusted
EBITDA |
 19
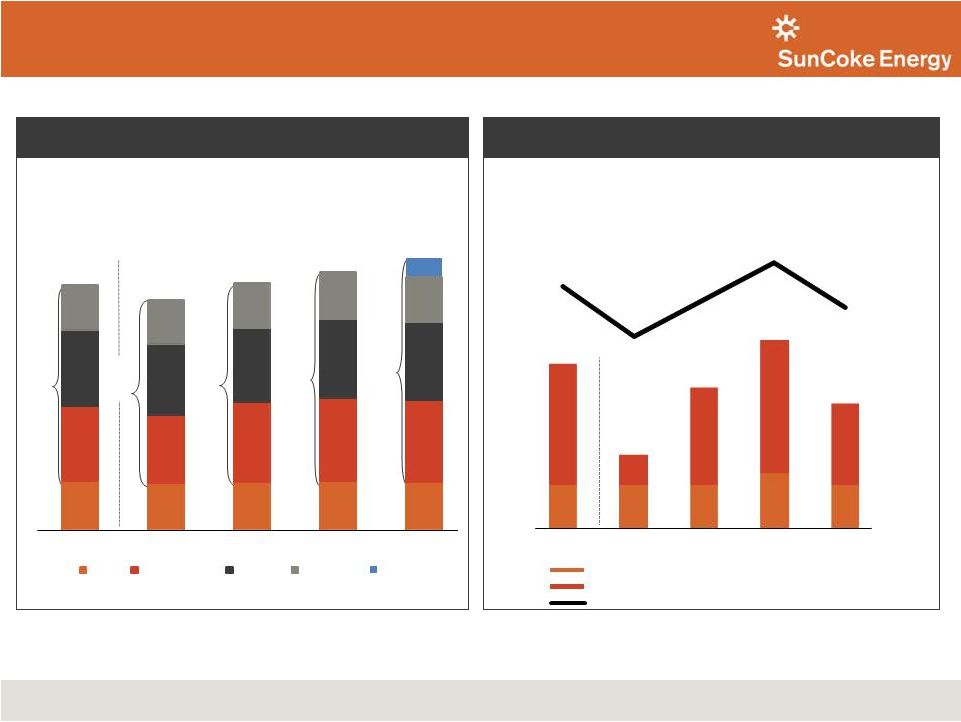
Domestic Coke Financial Summary
(Jewell Coke & Other Domestic Coke)
Domestic Coke Production
Domestic
Coke
Pro
Forma
Adjusted
EBITDA
(1)
,
Pro
Forma
for
ArcelorMittal Settlement and Coal Transfer Price
(Tons in thousands)
($ in millions, except per ton amounts)
Other
Domestic
Coke:
736
Other
Domestic
Coke:
745
Other
Domestic
Coke:
786
915
922
965
(1) For a definition of Pro Forma Adjusted EBITDA and Pro Forma Adjusted EBITDA/Ton
and a reconciliation of Pro Forma Adjusted EBITDA to operating income, please
see the appendix. (2) Other Domestic Coke results for Q4 ‘11 excludes
Middletown loss of approximately $0.4 million. (3) Includes Indiana Harbor
contract billing resolution of $6.0 million and inventory adjustment of $6.2 million,
of which $3.1 million is attributable to Q3 ’11.
861
$48
$36
$19
•
Q4 ‘11 increase over Q4 ‘10 reflects Middletown startup and
improvement at Indiana Harbor
•
Q4 ‘11 performance impacted by Indiana Harbor
accounting adjustments
1,014
Other
Domestic
Coke:
838
$42
$32
(2)
(3)
Oppenheimer 2nd Annual London 1-1 Investor Conference
179
174
177
179
176
282
256
301
314
309
286
266
276
293
289
168
165
168
179
172
68
Q4 '10
Q1 '11
Q2 '11
Q3 '11
Q4 '11
Jewell
Indiana Harbor
Haverhill
Granite City
Middletown
Other
Domestic
Coke:
687
$11
$11
$11
$14
$11
$31
$8
$25
$34
$21
$46/ton
$22/ton
$39/ton
$50/ton
$34/ton
$ 0
$ 20
$ 40
$ 60
$ 80
$ 120
$ 140
($5)
$5
Q4 '10
Q1 '11
Q2 '11
Q3 '11
Q4 '11
Jewell Coke Segment
Other Domestic Coke Segment
Pro Forma Adjusted EBITDA/ton |
 20
2012 Priorities
Oppenheimer 2nd Annual London 1-1 Investor Conference
•
Execute the ramp up of Middletown; expect to reach full production
levels in Q2 2012
•
Achieve targeted coke production volumes of 4.0 to 4.2 million tons
•
Continue permitting work for potential new U.S. plant in anticipation of a
market recovery
•
Implement India entry strategy by completing due diligence and
negotiating definitive agreements
•
Drive improved productivity at existing mines; mining a
projected
1.8 million tons and positioning segment for future expansion |
 21
Coal Expansion
Coal prices offer attractive growth and
return on capital in our coal mining business
SunCoke’s Mid-Vol. Coal
Contract Prices
$130
$165
2010
2011
2012E
$170 - $190
2012
Estimates
MV
(2)
HV
Thermal
Total
Sales Tons
(1)
1,550k
150k
150k
1,850k
% Committed
88%
27%
40%
79%
Price of
Committed
Tons (per ton)
$177
$130
$81
$171
Estimated Price Range of Uncommitted Tons (per ton)
High
$170
$120
$80
Low
$150
$100
$60
(1)
Includes approximately 50k of purchased coal.
(2)
Includes approximately 200k of 2011 carryover tonnage at $165.
Oppenheimer 2nd Annual London 1-1 Investor Conference
($ per ton) |
 22
$141
$74 -$84
$25 -
$40
$10 -
$15
2011
Adj. EBITDA
Coke
Coal Mining
Corporate
and Other
2012E
Adj. EBITDA
$250 -
$280
$250 -
$280
2012 Adjusted EBITDA
(1)
Outlook
($ in millions)
(1)
For a definition of Adjusted EBITDA, please see the appendix.
(2)
Excluding corporate costs.
•
Middletown
•
Indiana Harbor
improvement
•
Higher prices and
volumes
Oppenheimer 2nd Annual London 1-1 Investor Conference
Estimated
2012
Adjusted
EBITDA
(1)
projected
to
increase
by
$109 to $139 versus 2011;
expect
80%
-
85%
of
2012
Adjusted
EBITDA
(1,
2)
will
be
generated
by
cokemaking
business |
 23
2012 Outlook Summary
Metric
Expected 2012 Outlook
Adjusted EBITDA
(1)
$250 million –
$280 million
Capital Expenditures
& Investments
Approximately $150 million
Free Cash Flow
(2)
$50 million +
Cash Tax Rate
10% –
15%
Effective Tax Rate
20% –
24%
Corporate Costs
$30 million -
$35 million
Coke Production
4.0 -
4.2 million tons
Coal Production
Approximately 1.8 million tons
EPS (at 22% tax rate)
$1.30 -
$1.65
(1) For a definition of Adjusted EBITDA, please see the appendix
(2) For a definition of Free Cash Flow, please see the appendix
Oppenheimer 2nd Annual London 1-1 Investor Conference
|
 24
Strategy for Shareholder Value Creation
Oppenheimer 2nd Annual London 1-1 Investor Conference
Operational Excellence
•
Rigorous execution in
existing operations
•
Maintain focus on
safety and environment
•
Deliver returns through
strong, consistent coke
earnings and optimize
coal operations
Grow The Coke Business
•
Domestic
•
Secure permits for
next potential facility
•
Capitalize on aging
domestic capacity,
demand growth and
import displacement
•
International
•
Execute India entry
and pursue follow
on
growth
•
Continue evaluating
China for potential
entry
Potential Structuring
Alternatives
•
Coke MLP
•
Domestic assets well
suited and expected
to qualify
•
Will evaluate in 2012
•
Coal
•
Aggressively manage
the business
•
Optimize value in
near term and
enhance strategic
flexibility
- |
 25
Appendix
Oppenheimer 2nd Annual London 1-1 Investor Conference |
 26
Adjusted EBITDA
represents earnings before interest, taxes, depreciation, depletion and
amortization (“EBITDA”) adjusted for sales discounts and the
deduction of income attributable to non-controlling interests in our Indiana Harbor cokemaking operations.
EBITDA
reflects
sales
discounts
included
as
a
reduction
in
sales
and
other
operating
revenue.
The
sales
discounts
represent
the
sharing
with
our
customers
of
a
portion
of
nonconventional
fuels
tax
credits,
which
reduce
our
income
tax
expense.
However,
we
believe that our Adjusted EBITDA would be inappropriately penalized if these
discounts were treated as a reduction of EBITDA since they represent sharing
of a tax benefit which is not included in EBITDA. Accordingly, in computing Adjusted EBITDA, we have
added back these sales discounts. Our Adjusted EBITDA also reflects the deduction
of income attributable to noncontrolling interest in our Indiana Harbor
cokemaking operations. EBITDA and Adjusted EBITDA do not represent and should not be considered
alternatives to net income or operating income under United States generally
accepted accounting principles (GAAP) and may not be comparable to other
similarly titled measures of other businesses. Management believes Adjusted EBITDA is an important
measure of the operating performance of the Company’s assets and is indicative
of the Company’s ability to generate cash from operations.
Pro Forma Adjusted EBITDA
represents Adjusted EBITDA adjusted for the ArcelorMittal settlement impact and
coal transfer price impacts. The Jewell Coke and Coal Mining results have
been adjusted to set the internal transfer price to equal the coal component
contract price in Jewell Coke’s coke sales price for coal sales volumes sold
to Jewell Coke under the transfer pricing agreement. Management
believes Pro Forma Adjusted EBITDA provides transparency into the underlying profitability of these respective
segments for the periods presented.
Pro Forma Adjusted EBITDA/Ton
represents Pro Forma Adjusted EBITDA divided by tons sold.
Free Cash Flow
equals cash from operations less cash used in investing activities less cash
distributions to non-controlling interests.
Management
believes
Free
Cash
Flow
information
enhances
an
investor’s
understanding
of
a
business’
ability
to
generate cash. Free Cash Flow does not represent and should not be considered
an alternative to net income or cash flows from operating activities as
determined under GAAP and may not be comparable to other similarly titled measures of other businesses.
Definitions
Oppenheimer 2nd Annual London 1-1 Investor Conference |
  27
2012
Low
2012
High
Net Income
$98
$122
Depreciation, Depletion and Amortization
74
72
Total financing costs, net
48
46
Income tax expense (benefit)
25
37
EBITDA
$245
$277
Sales discounts
11
10
Noncontrolling interests
(6)
(7)
Adjusted EBITDA
$250
$280
Estimated EBITDA Reconciliation, $MM
2012E Net Income to Adjusted EBITDA Reconciliation
Oppenheimer 2nd Annual London 1-1 Investor Conference |
 28
Estimated Free Cash Flow Reconciliation, $MM
2012E Estimated Free Cash Flow Reconciliation
Oppenheimer 2nd Annual London 1-1 Investor Conference
2012
Cash from (i) operations;
In excess of
204
$
(ii) less investing;
Approx.
(150)
(iii) less payments to minority interest
Approx.
(4)
Free Cash Flow
In excess of
50
$ |
 29
EBITDA Reconciliation, $MM
Oppenheimer 2nd Annual London 1-1 Investor Conference
For The Year Ended 2011
Domestic Coke Weighted
Average = $36
Jewell
Coke
Other
Domestic Coke
International
Coke
Coal
Mining
Corporate
and Other
Total
Net Income
$58.9
Add: Depreciation, depletion and amortization
58.4
Subtract: Interest Income (Primarily from Affiliates)
(12.9)
3.5
Subtract: Capitalized interest
(9.8)
Add: Interest expense
20.6
Add (Subtract): Income tax expense
7.2
EBITDA
$57.6
$74.8
$13.7
$24.0
($44.2)
$125.8
–
12.9
–
–
–
12.9
–
1.7
–
–
–
1.7
Adjusted EBITDA
$57.6
$89.4
$13.7
$24.0
($44.2)
$140.5
Add (Subtract): Pro Forma coal transfer price impact
(11.5)
–
–
11.5
–
–
Pro Forma Adjusted EBITDA coal transfer price impacts
$46.1
$89.4
$13.7
$35.4
($44.2)
$140.5
Sales Volumes (thousands of tons)
702
3,068
1,442
1,454
–
Pro Forma Adjusted EBITDA per Ton
$66
$29
$10
$24
Operating Income (Loss)
$52.7
$36.1
$13.5
$11.1
($45.9)
$67.5
Add: Depreciation Expense
$4.9
$38.7
$0.2
$12.9
$1.7
$58.4
EBITDA
$57.6
$74.8
$13.7
$24.0
($44.2)
$125.9
Add: Sales discounts provided to customers due to sharing of nonconventional fuels tax credits Add
(Subtract): Net (Income) loss attributable to noncontrolling interests
Add: Interest cost – Affiliate |
 30
EBITDA Reconciliation, $MM
Oppenheimer 2nd Annual London 1-1 Investor Conference
For The Three Months Ended December 31, 2011
Domestic Coke Weighted
Average = $32
Jewell Coke
Other
Domestic Coke
International
Coke
Coal
Mining
Corporate
and Other
Total
Net Income
$7.5
Add: Depreciation, depletion and amortization
16.0
Subtract: Interest Income
(0.1)
-
Subtract: Capitalized interest
(4.5)
Add: Interest expense
11.7
Add: Income tax expense
(2.9)
EBITDA
$11.4
$17.6
$10.2
$1.7
($13.2)
$27.7
-
3.2
-
-
-
3.2
-
0.5
-
-
-
0.5
Adjusted EBITDA
$11.4
$21.3
$10.2
$1.7
($13.2)
$31.4
Add (Subtract): coal transfer price impact
(0.8)
0.8
-
Pro Forma Adjusted EBITDA without coal tranfer price impact
$10.6
$21.3
$10.2
$2.5
($13.2)
$31.4
Sales Volumes (thousands of tons)
166
837
295
363
Pro Forma Adjusted EBITDA per Ton
$64
$25
$34
$7
Operating Income (Loss)
$10.2
$7.0
$10.1
($2.0)
($13.6)
$11.8
Depreciation Expense
1.2
10.6
0.1
3.7
0.4
16.0
EBITDA
$11.4
$17.6
$10.2
$1.7
($13.2)
$27.8
Add: Interest cost - affiliates Add: Sales discounts provided to customers due to sharing of nonconventional fuels tax credits
Add (Subtract): net (income) loss attributable to noncontrolling interests
|
 31
EBITDA Reconciliation, $MM
For The Three Months Ended September 30, 2011
Oppenheimer 2nd Annual London 1-1 Investor Conference
Domestic Coke Weighted
Average = $50
Net Income
Add: Depreciation, depletion and amortization
Subtract: Interest Income
Subtract: Capitalized interest
Add: Interest expense
Add: Income tax expense
EBITDA
Adjusted EBITDA
Add (Subtract): coal transfer price impact
Pro Forma Adjusted EBITDA without coal tranfer price impact
Sales Volumes (thousands of tons)
Pro Forma Adjusted EBITDA per Ton
Operating Income (Loss)
Depreciation Expense
EBITDA
Jewell
Coke
Other
Domestic Coke
International
Coke
Coal
Mining
Corporate
and Other
Total
$21.7
14.8
(1.3)
0.3
(4.6)
8.9
5.1
$14.3
$34.3
$1.7
$8.8
($14.3)
$44.8
3.3
3.3
(3.4)
(3.4)
$14.3
$34.3
$1.7
$8.8
($14.3)
$44.8
(0.4)
0.4
-
$13.9
$34.3
$1.7
$9.2
($14.3)
$44.8
191
777
373
371
$73
$44
$5
$25
$13.1
$24.5
$1.7
$5.5
($14.6)
$30.1
1.2
9.8
0.1
3.3
0.3
14.8
$14.3
$34.3
$1.7
$8.8
($14.3)
$44.8
Add: Sales discounts provided to customers due to sharing of nonconventional fuels tax credits
Add (Subtract): net (income) loss attributable to noncontrolling interests Add:
Interest
cost
-
affiliates |
 32
EBITDA Reconciliation, $MM
For The Three Months Ended June 30, 2011
Oppenheimer 2nd Annual London 1-1 Investor Conference
Domestic Coke Weighted
Average = $39
Jewell
Coke
Other
Domestic Coke
International
Coke
Coal
Mining
Corporate
and Other
Total
Net Income
$24.0
Add: depreciation, depletion and amortization
14.6
Subtract: interest income (primarily from affiliates)
(5.8)
1.7
Subtract: capitalized interest
(0.4)
Add (Subtract): income tax expense (benefit)
$1.9
EBITDA
$12.9
$23.7
$0.8
$9.1
($10.5)
$36.0
Add: sales discounts provided to customers due to sharing of nonconventional fuels
tax credits
3.2
3.2
(1.6)
(1.6)
Adjusted EBITDA
$12.9
$25.3
$0.8
$9.1
($10.5)
$37.6
Add (Subtract): coal transfer price impact
(2.3)
2.3
-
Pro Forma Adjusted EBITDA without coal transfer impact
$10.6
$25.3
$0.8
$11.5
($10.5)
$37.6
Sales Volumes (thousands of tons)
170
757
412
334
Pro Forma Adjusted EBITDA per Ton
$62
$33
$2
$34
Operating Income (Loss)
$11.6
$14.1
$0.8
$6.0
($10.9)
$21.4
Depreciation Expense
1.3
9.6
0.1
3.2
0.4
14.6
EBITDA
$12.9
$23.7
$0.8
$9.1
($10.5)
$36.0
Add (Subtract): net (income) loss attributable to noncontrolling interests Add:
interest cost - affiliate
|
 33
EBITDA Reconciliation, $MM
For The Three Months Ended March 31, 2011
Oppenheimer 2nd Annual London 1-1 Investor Conference
Domestic Coke Weighted
Average = $22
Jewell
Coke
Other
Domestic Coke
International
Coke
Coal
Mining
Corporate
and Other
Total
Net Income
$5.7
Add: depreciation, depletion and amortization
13.0
Subtract: interest income (primarily from affiliates)
(5.7)
1.5
Subtract: capitalized interest
(0.3)
Add (Subtract): income tax expense (benefit)
3.1
EBITDA
$19.1
($0.9)
$1.0
$4.3
($6.2)
$17.3
3.1
3.1
6.2
6.2
Adjusted EBITDA
$19.1
$8.4
$1.0
$4.3
($6.2)
$26.6
Add (Subtract): coal transfer price impact
(8.0)
8.0
-
Pro Forma Adjusted EBITDA without coal transfer price impact
$11.1
$8.4
$1.0
$12.3
($6.2)
$26.6
Sales Volumes (thousands of tons)
175
697
362
386
Pro Forma Adjusted EBITDA per Ton
$63
$12
$3
$32
Operating Income (Loss)
$18.0
($9.5)
$0.9
$1.6
($6.7)
$4.3
Depreciation Expense
1.1
8.6
0.1
2.7
0.5
13.0
EBITDA
$19.1
($0.9)
$1.0
$4.3
($6.2)
$17.3
Add: Sales discounts provided to customers due to sharing of nonconventional fuels tax credits Add
(Subtract): net (income) loss attributable to noncontrolling interests
Add: interest cost - affiliate |
 34
EBITDA Reconciliation, $MM
For The Year Ended 2010
Oppenheimer 2nd Annual London 1-1 Investor Conference
Domestic Coke Weighted
Average = $46
Jewell
Coke
Other
Domestic Coke
International
Coke
Coal
Mining
Corporate
and Other
Total
Net Income
$146.3
Add: Depreciation, depletion and amortization
$48.2
Subtract: Interest Income (Primarily from Affiliates)
($23.7)
$5.4
Subtract: Capitalized interest
($0.7)
Add (Subtract): Income tax expense
$46.9
EBITDA
$151.5
$73.6
$15.0
($3.6)
($14.1)
$222.4
Add: Sales discounts provided to customers due to sharing of nonconventional fuels tax
credits –
12.0
–
–
–
12.0
–
(7.1)
–
–
–
(7.1)
Adjusted EBITDA
$151.5
$78.5
$15.0
($3.6)
($14.1)
$227.3
Add (Subtract): Pro Forma impact of ArcelorMittal settlement
(69.0)
18.0
–
–
–
(51.0)
Add: Legal and Settlement charges related to ArcelorMittal Settlement and Indiana Harbor
Arbitration 3.6
12.7
–
–
–
16.3
Add (Subtract): Pro Forma coal transfer price impact
(27.6)
–
–
27.6
–
–
Pro Forma Adjusted EBITDA without ArcelorMittal settlement and coal transfer price impacts
$58.5
$109.2
$15.0
$24.0
($14.1)
$192.6
Sales Volumes (thousands of tons)
721
2,917
–
1,277
–
Pro Forma Adjusted EBITDA per Ton
$81
$37
$19
Operating Income (Loss)
$147.1
$38.6
$14.9
($11.3)
($15.1)
$174.2
Add: Depreciation Expense
4.4
35.0
0.1
7.7
1.0
48.2
EBITDA
$151.5
$73.6
$15.0
($3.6)
($14.1)
$222.4
Add (Subtract): Net (Income) loss attributable to noncontrolling interests Add:
interest cost - Affiliate |
 35
EBITDA Reconciliation, $MM
For The Three Months Ended December 31, 2010
Oppenheimer 2nd Annual London 1-1 Investor Conference
Domestic Coke Weighted
Average = $46
Jewell
Coke
Other Domestic
Coke
International
Coke
Coal
Mining
Corporate and
Other
Total
Net Income
$15.1
Add: Depreciation, depletion and amortization
12.3
Subtract: Interest Income
(5.7)
1.0
Subtract: Capitalized interest
(0.3)
Add: Interest expense
-
Add: Income tax expense
5.7
EBITDA
$19.6
$6.6
$13.8
($7.8)
($4.1)
$28.1
Add: Sales discounts provided to customers due to sharing of nonconventional fuels tax
credits 3.2
3.2
3.4
3.4
Adjusted EBITDA
19.6
13.2
13.8
(7.8)
(4.1)
34.7
Add (Subtract): pro forma impact of ArcelorMittal settlement
(11.0)
4.9
(6.1)
Add: Legal and Settlement charges related to ArcelorMittal Settlement and Indiana Harbor
Arbitration 3.6
12.7
16.3
Add (Subtract): coal transfer price impact
(1.0)
1.0
-
Pro Forma Adjusted EBITDA without ArcelorMittal settlement and coal tranfer price impact
$11.2
$30.8
$13.8
($6.8)
($4.1)
$44.9
Sales Volumes (thousands of tons)
162
750
321
Pro Forma Adjusted EBITDA per Ton
$69
$41
($21)
Operating Income (Loss)
$18.5
($2.1)
$13.8
($9.8)
($4.6)
$15.8
Depreciation Expense
1.1
8.7
-
2.0
0.5
12.3
EBITDA
$19.6
$6.6
$13.8
($7.8)
($4.1)
$28.1
Add: (Subtract): net (income) loss attributable to noncontrolling interests
Add: interest cost - affiliates |
 36
Media releases and SEC filings are available
on our website at www.suncoke.com
Contact Investor Relations for more information: 630-824-1907
Oppenheimer 2nd Annual London 1-1 Investor Conference |