Attached files
| file | filename |
|---|---|
| 8-K - 8-K - Solera National Bancorp, Inc. | a12-4098_18k.htm |
| EX-99.1 - EX-99.1 - Solera National Bancorp, Inc. | a12-4098_1ex99d1.htm |
Exhibit 99.2
|
|
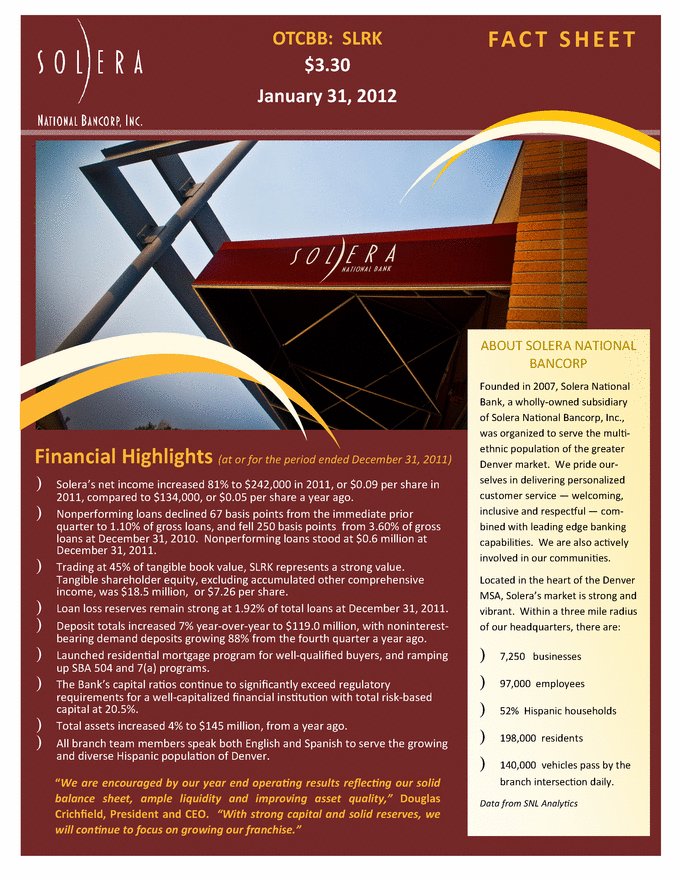
OTCBB: SLRK $3.30 January 31, 2012 FACT SHEET SOLERA Financial Highlights (at or for the period ended December 31, 2011) ) ) Solera’s net income increased 81% to $242,000 in 2011, or $0.09 per share in 2011, compared to $134,000, or $0.05 per share a year ago. ) Nonperforming loans declined 67 basis points from the immediate prior quarter to 1.10% of gross loans, and fell 250 basis points from 3.60% of gross loans at December 31, 2010. Nonperforming loans stood at $0.6 million at December 31, 2011. ) ) Trading at 45% of tangible book value, SLRK represents a strong value. Tangible shareholder equity, excluding accumulated other comprehensive income, was $18.5 million, or $7.26 per share. Loan loss reserves remain strong at 1.92% of total loans at December 31, 2011. ) ) Deposit totals increased 7% year-over-year to $119.0 million, with noninterest-bearing demand deposits growing 88% from the fourth quarter a year ago. Launched residential mortgage program for well-qualified buyers, and ramping up SBA 504 and 7(a) programs. ) ) The Bank’s capital ratios continue to significantly exceed regulatory requirements for a well-capitalized financial institution with total risk-based capital at 20.5%. Total assets increased 4% to $145 million, from a year ago. All branch team members speak both English and Spanish to serve the growing and diverse Hispanic population of Denver. “We are encouraged by our year end operating results reflecting our solid balance sheet, ample liquidity and improving asset quality,” Douglas Crichfield, President and CEO. “With strong capital and solid reserves, we will continue to focus on growing our franchise.” ABOUT SOLERA NATIONAL BANCORP Founded in 2007, Solera National Bank, a wholly-owned subsidiary of Solera National Bancorp, Inc., was organized to serve the multiethnic population of the greater Denver market. We pride ourselves in delivering personalized customer service-welcoming, inclusive and respectful - combined with leading edge banking capabilities. We are also actively involved in our communities. Located in the heart of the Denver MSA, Solera’s market is strong and vibrant. Within a three mile radius of our headquarters, there are: 7,250 businesses 97,000 employees 52% Hispanic households 198,000 residents 140,000 vehicles pass by the branch intersection daily. Data from SNL Analytics) |
|
|
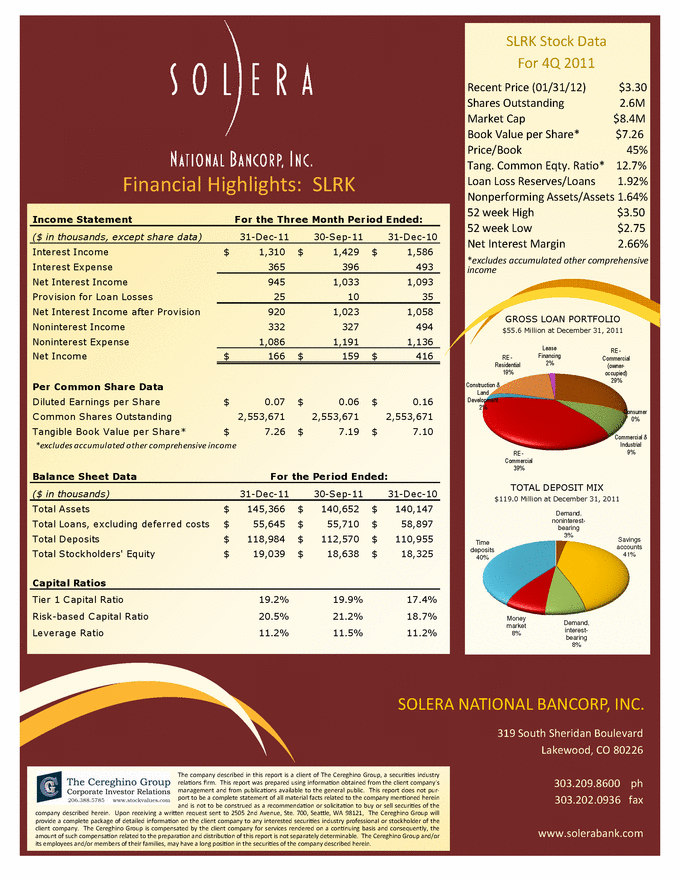
SLRK Stock Data For 4Q 2011 Recent Price (01/31/12) $3.30 Shares Outstanding 2.6M Market Cap $8.4M Book Value per Share* $7.26 Price/Book 45% Tang. Common Eqty. Ratio* 12.7% Loan Loss Reserves/Loans 1.92% Nonperforming Assets/Assets 1.64% 52 week High $3.50 52 week Low $2.75 Net Interest Margin 2.66% *excludes accumulated other comprehensive income GROSS LOAN PORTFOLIO $55.6 Million at December 31, 2011 Lease Financing 2% RE -Commercial (owner-occupied) 29% RE - Residential 19% Construction & Land Development 2% Consumer 0% Commercial & Industrial 9% RE - Commercial 39% TOTAL DEPOSIT MIX $119.0 Million at December 31, 2011 Demand, noninterest- bearing 3% Savings accounts 41% Time deposits 40% Money market 8% Demand, interest-bearing 8% Financial Highlights: SLRK Income Statement For the Three Month Period Ended: ($ in thousands, except share data) 31-Dec-11 30-Sep-11 31-Dec-10 Interest Income $ 1,310 $ 1,429 $ 1,586 Interest Expense Net Interest Income 365 396 493 945 1,033 1,093 Provision for Loan Losses Net Interest Income after Provision 25 1 0 3 5 920 1,023 1,058 Noninterest Income 332 327 494 Noninterest Expense Net Income Per Common Share Data 1,086 1,191 1,136 $ 166 $ 159 $ 416 Diluted Earnings per Share $ 0.07 $ 0.06 $ 0.16 Common Shares Outstanding 2,553,671 2,553,671 2,553,671 Tangible Book Value per Share* $ 7.26 $ 7.19 $ 7.10 excludes accumulated other comprehensive income Balance Sheet Data For the Period Ended: ($ in thousands) 31-Dec-11 30-Sep-11 31-Dec-10 Total Assets $ 145,366 $ 140,652 $ 140,147 Total Loans, excluding deferred costs $ 5 5,645 $ 5 5,710 $ 58,897 Total Deposits $ 118,984 $ 112,570 $ 110,955 Total Stockholders’ Equity $ 1 9,039 $ 1 8,638 $ 1 8,325 Capital Ratios Tier 1 Capital Ratio 19.2% 19.9% 17.4% Risk-based Capital Ratio 20.5% 21.2% 18.7% Leverage Ratio 11.2% 11.5% 11.2% SOLERA NATIONAL BANCORP, INC. 319 South Sheridan Boulevard Lakewood, CO 80226 303.209.8600 ph 303.202.0936 fax www.solerabank.com The Cereghino Group Corporate Investor Relations 206.388.5785 www.stock.values.com The company described in this report is a client of The Cereghino Group, a securities industry relations firm. This report was prepared using information obtained from the client company’s management and from publications available to the general public. This report does not purport to be a complete statement of all material facts related to the company mentioned herein and is not to be construed as a recommendation or solicitation to buy or sell securities of the company described herein. Upon receiving a written request sent to 2505 2nd Avenue, Ste. 700, Seattle, WA 98121, The Cereghino Group will provide a complete package of detailed information on the client company to any interested securities industry professional or stockholder of the client company. The Cereghino Group is compensated by the client company for services rendered on a continuing basis and consequently, the amount of such compensation related to the preparation and distribution of this report is not separately determinable. The Cereghino Group and/or its employees and/or members of their families, may have a long position in the securities of the company described herein. |