Attached files
| file | filename |
|---|---|
| EX-99.3 - EXHIBIT 99.3 - Ally Financial Inc. | v301050_ex99-3.htm |
| EX-99.1 - PRESS RELEASE - Ally Financial Inc. | v301050_ex99-1.htm |
| 8-K - FORM 8-K - Ally Financial Inc. | v301050_8k.htm |
![]()
Ally Financial Inc . 4Q Earnings Review February 2, 2012 Contact Ally Investor Relations at (866) 710-4623 or investor .relations@ally .com

Forward -Looking Statements and Additional Information The following should be read in conjunction with the financial statements, notes and other information contained in the Company’s 2010 Annual Report on Form 10-K, Quarterly Reports on Form 10-Q, and Current Reports on Form 8-K. This information is preliminary and based on company data available at the time of the presentation In the presentation that follows and related comments by Ally Financial Inc. (“Ally”) management, the use of the words “expect,” “anticipate,” “estimate,” “forecast,” “initiative,” “objective,” “plan,” “goal,” “project,” “outlook,” “priorities,” “target,” “intend,” “evaluate,” “pursue,” “seek,” “may,” “would,” “could,” “should,” “believe,” “potential,” “continue,” or similar expressions is intended to identify forward -looking statements . All statements herein and in related management comments, other than statements of historical fact, including without limitation, statements about future events and financial performance, are forward -looking statements that involve certain risks and uncertainties . While these statements represent our current judgment on what the future may hold, and we believe these judgments are reasonable, these statements are not guarantees of any events or financial results, and Ally’s actual results may differ materially due to numerous important factors that are described in the most recent reports on SEC Forms 10-K and 10-Q for Ally, each of which may be revised or supplemented in subsequent reports filed with the SEC. Such factors include, among others, the following: maintaining the mutually beneficial relationship between Ally and General Motors (“GM”), and Ally and Chrysler; the profitability and financial condition of GM and Chrysler; securing low cost funding for us and Residential Capital, LLC (“ResCap”); our ability to realize the anticipated benefits associated with being a bank holding company, and the increased regulation and restrictions that we are now subject to; any additional future impact resulting from delayed foreclosure sales or related matters; the potential for legal liability resulting from claims related to the sale of private-label mortgage -backed securities; risks related to potential repurchase obligations due to alleged breaches of representations and warranties in mortgage securitization transactions; changes in U.S. government -sponsored mortgage programs or disruptions in the markets in which our mortgage subsidiaries operate; continued challenges in the residential mortgage markets; the continuing negative impact on ResCap and our mortgage business generally due to the declines in the U.S. housing market; uncertainty of our ability to enter into transactions or execute strategic alternatives to realize the value of our ResCap operations; the potential for deterioration in the residual value of off-lease vehicles; disruptions in the market in which we fund our operations, with resulting negative impact on our liquidity; changes in our accounting assumptions that may require or that result from changes in the accounting rules or their application, which could result in an impact on earnings; changes in the credit ratings of Ally, ResCap, Chrysler, or GM; changes in economic conditions, currency exchange rates or political stability in the markets in which we operate; and changes in the existing or the adoption of new laws, regulations, policies or other activities of governments, agencies and similar organizations (including as a result of the Dodd-Frank Act). Investors are cautioned not to place undue reliance on forward -looking statements . Ally undertakes no obligation to update publicly or otherwise revise any forward -looking statements except where expressly required by law. Reconciliation of non-GAAP financial measures included within this presentation are provided in this presentation . Use of the term “loans” describes products associated with direct and indirect lending activities of Ally’s global operations . The specific products include retail installment sales contracts, loans, lines of credit, leases or other financing products . The term “originate” refers to Ally’s purchase, acquisition or direct origination of various “loan” products . 4Q 2011 Preliminary Results 2
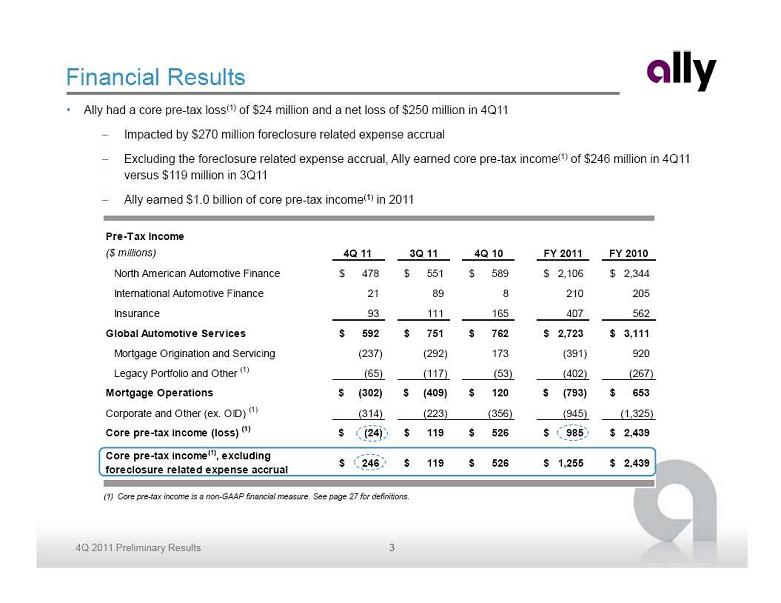
Financial Results • Ally had a core pre-tax loss(1) of $24 million and a net loss of $250 million in 4Q11 – Impacted by $270 million foreclosure related expense accrual – Excluding the foreclosure related expense accrual, Ally earned core pre-tax income (1) of $246 million in 4Q11 versus $119 million in 3Q11 – Ally earned $1.0 billion of core pre-tax income (1) in 2011 Pre-Tax Income ($ millions) 4Q 11 3Q 11 4Q 10 FY 2011 FY 2010 North American Automotive Finance $ 478 $ 551 $ 589 $ 2,106 $ 2,344 International Automotive Finance 21 89 8 210 205 Insurance 93 111 165 407 562 Global Automotive Services $ 592 $ 751 $ 762 $ 2,723 $ 3,111 Mortgage Origination and Servicing (237) (292) 173 (391) 920 Legacy Portfolio and Other (1) (65) (117) (53) (402) (267) Mortgage Operations $ (302) $ (409) $ 120 $ (793) $ 653 Corporate and Other (ex. OID) (1) (314) (223) (356) (945) (1,325) Core pre-tax income (loss) (1) $ (24) $ 119 $ 526 $ 985 $ 2,439 Core pre-tax income (1), excluding $ 246 $ 119 $ 526 $ 1,255 $ 2,439 foreclosure related expense accrual (1) Core pre-tax income is a non-GAAP financial measure. See page 27 for definitions . 4Q 2011 Preliminary Results 3

2011 Achievements 9Significant growth in auto originations - U.S. consumer originations up 27% YoY Premier Auto 9NAO earning assets increased 17% YoY Finance 9Continued to execute on diversification strategy – U.S. used originations up 90% YoY Franchise 9Maintained #1 position in U.S. total automotive finance market share 92011 retail deposit growth of $5.9 billion or 27% YoY Ally Bank Deposit 9Continued product expansion – new IRA products, “Ally Perks” and eCheck remote deposit Franchise 9Customer accounts increased to 977 thousand – up 35% YoY 9$27 billion of parent company liquidity (1) to address debt maturities and operational needs 9Over $38 billion of new secured and unsecured funding transactions in 2011 Strong Financial Profile 9Robust capital levels relative to risk profile of assets - Tier 1 Contingent Common (2) of 11.2% 9Cost of funds improved 64 basis points YoY 9U.S. Treasury sold $2.7 billion of Trust Preferred Securities to third party investors Paying Back U.S. Taxpayer 9Ally has paid $5.4 billion to the U.S. Treasury including preferred dividends (1) See page 26 for further details (2) Tier 1 Contingent Common is a non-GAAP financial measure. See page 27 for definitions. 4Q 2011 Preliminary Results 4

Core Business Fundamentals Core business fundamentals continue positive trend • Competitively advantaged auto finance franchise • Strong asset generation capabilities • High quality assets – low loss, short dated, secured auto loans • Leading direct bank franchise with growing customer base • Conservative capital and liquidity posture U.S. Consumer Auto Ally Bank Loan Portfolio Originations ($B) Retail Deposits ($B) Net Credit Loss Ratio (1) $27.7 $40.2 $21.8 3.55% $31.6 $16.9 $18.4 0.97% 0.43% 2009 2010 2011 2009 2010 2011 4Q 09 4Q 10 4Q 11 Retail - New Retail - Used Lease (1) 4Q09 adjusted for the strategic reclassification of certain legacy mortgage assets from HFI to HFS and the adoption of FFIEC guidelines resulting in charge-off policy modifications 4Q 2011 Preliminary Results 5

Challenges & Priorities • Addressing mortgage business clouds – Recognized foreclosure related charge to support resolution of these issues – Maintaining leading mortgage servicing platform – Protecting Ally and enabling it to thrive • Auto market is very competitive – Attractive asset class – Aggressive market pricing is pressuring returns – Solidifying dealer relationships as full service and full spectrum lender – Diversifying and expanding to offset market share pressure • Capital and funding dynamics – Percentage of bank and deposit funding – 15% Leverage Ratio requirement at Ally Bank – MCP impact • Expense base management – Consent Order costs – Other mortgage related expenses 4Q 2011 Preliminary Results 6

Fourth Quarter and Full Year 2011 Results ($ millions) 4Q 11 3Q 11 4Q 10 FY 2011 FY 2010 Net financing revenue (ex. OID) $ 743 $ 832 $ 846 $ 3,387 $ 3,813 Total other revenue (ex. OID) 977 554 1,300 3,646 5,129 Provision for loan losses 6 50 71 219 442 Controllable expenses (1) 965 731 885 3,357 3,341 Other noninterest expenses 503 486 664 2,202 2,720 Core pre-tax income (1), excluding $ 246 $ 119 $ 526 $ 1,255 $ 2,439 foreclosure related expense accrual Foreclosure related expense accrual 270 - - 270 - Core pre-tax income (loss) (1) (24) 119 526 985 2,439 OID amortization expense (1) 137 225 301 962 1,300 Income tax expense 73 93 45 179 153 Income (loss) from discontinued operations (16) (11) (101) (45) 89 Net income (loss) $ (250) $ (210) $ 79 $ (201) $ 1,075 Notable Items: 4Q 11 3Q 11 4Q 10 FY 2011 FY 2010 Net mortgage servicing revenue 166 (174) 101 414 876 Net operating lease revenue 199 254 346 1,260 1,693 Restructuring charge expense (39) (9) (20) (51) (80) Mortgage repurchase expense (44) (70) (180) (324) (670) Compensation & benefits expense (442) (293) (406) (1,574) (1,576) (1) See page 27 for definitions 4Q 2011 Preliminary Results 7

Net Interest Margin • Net Interest Margin (NIM) impacted by earning asset mix and spread compression – Shift to higher quality, lower yielding assets – Business managed in accordance with low credit loss assets – Lease remarketing gains normalizing as termination volume is declining – Cost of funds declining as bank assets grow – Expect we are at or near bottom of NIM compression Ally Financial - NIM and Cost of Funds (1) 7.1% $161 6.1% $159 5.0% 4.3% 4.1% 3.5% $146 3.0% $142 2.3% 1.8% 1.5% 1.3% 1.4% 1Q 10 2Q 10 3Q 10 4Q 10 1Q 11 2Q 11 3Q 11 4Q 11 Earning Assets ($B) Earning Asset Yield Net Interest Margin (ex OID) Cost of Funds (ex OID) (1) Risk-adjusted NIM (ex. OID) (1) See page 27 for definitions 4Q 2011 Preliminary Results 8

North American Automotive Finance • North American segment reported pre-tax Key Financials ($ millions) 4Q 11 3Q 11 4Q 10 income of $478 million Net financing revenue $ 704 $ 755 $ 798 Total other revenue 84 126 157 • Net financing revenue decrease of $51 million Total net revenue 788 881 955 QoQ primarily driven by: Provision for loan losses (33) 25 19 Noninterest expense 343 305 347 – $43 million decline in lease gains as Pre-tax income from continuing ops $ 478 $ 551 $ 589 termination volume is declining Total assets $ 96,971 $ 90,532 $ 81,893 • Other revenue decline due to lack of whole loan NAO Earning Asset Balances (EOP) sales in 4Q ($ billions) $96.2 • Provision expense decline driven by continued $87.5 $90.6 $90.2 $81.9 strong credit performance and better credit mix • Earning assets up 7% QoQ and 17% YoY – Consumer asset increase driven by strong originations offsetting legacy asset run-off 4Q 10 1Q 11 2Q 11 3Q 11 4Q 11 Consumer Commercial – Commercial asset increase primarily due to typical higher year end inventories Earning Asset Growth YoY Growth QoQ Growth Ally - NAO 17% 7% Bank Average (1) 1% 0% (1) ‘Bank Average’ includes average earning assets for BAC, JPM, WFC, C, USB, PNC, BBT, COF, FITB, RF and STI based on 4Q11 earnings release materials 4Q 2011 Preliminary Results 9
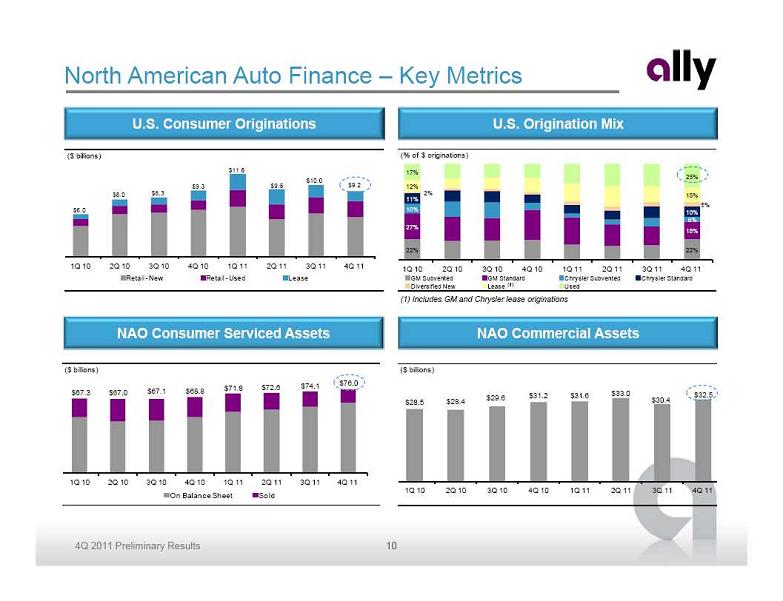
North American Auto Finance – Key Metrics U.S. Consumer Originations U.S. Origination Mix ($ billions) (% of $ originations) $11.6 17% 25% $10.0 $9.3 $9.5 $9.2 12% $8.0 $8.3 2% 15% 11% 5% $6.0 10% 10% 6% 27% 18% 22% 22% 1Q 10 2Q 10 3Q 10 4Q 10 1Q 11 2Q 11 3Q 11 4Q 11 1Q 10 2Q 10 3Q 10 4Q 10 1Q 11 2Q 11 3Q 11 4Q 11 Retail - New Retail - Used Lease GM Subvented GM Standard Chrysler Subvented Chrysler Standard Diversified New Lease (1) Used (1) Includes GM and Chrysler lease originations NAO Consumer Serviced Assets NAO Commercial Assets ($ billions) ($ billions) $74.1 $76.0 $71.8 $72.6 $67.3 $67.0 $67.1 $68.8 $33.0 $29.6 $31.2 $31.6 $32.5 $28.5 $28.4 $30.4 1Q 10 2Q 10 3Q 10 4Q 10 1Q 11 2Q 11 3Q 11 4Q 11 1Q 10 2Q 10 3Q 10 4Q 10 1Q 11 2Q 11 3Q 11 4Q 11 On Balance Sheet Sold 4Q 2011 Preliminary Results 10
![]()
International Automotive Finance • International Operations earned $21 million of pre-tax income down from $89 million in 3Q Key Financials ($ millions) 4Q 11 3Q 11 4Q 10 Net financing revenue $ 157 $ 167 $ 151 – Higher provision expense driven by reserve Total other revenue 64 61 49 build in Latin America Total net revenue 221 228 200 Provision for loan losses 23 (2) 29 – Higher noninterest expense driven by restructuring and tax related items Noninterest expense 177 141 163 Pre-tax income from continuing ops $ 21 $ 89 $ 8 • Originations flat QoQ and up 5% YoY Total assets $ 15,382 $ 15,314 $ 15,979 – Full year YoY growth driven by Germany, Brazil and UK • European credit performance has remained stable despite economic uncertainties International Operations Gross Financing Receivables Mix (1) International Consumer Auto Originations (1) ($ billions) $2.6 $2.6 Latin America $2.5 $2.3 Europe $1.9 30% 44% 26% 4Q 10 1Q 11 2Q 11 3Q 11 4Q 11 China China Brazil Germany U.K. Mexico Other (1) Represents continuing operations only. China is part of a joint-venture in which Ally owns a minority interest (not included in total assets above). 4Q 2011 Preliminary Results 11

Insurance • Pre-tax income of $93 million, down from $111 Key Financials ($ millions) 4Q 11 3Q 11 4Q 10 million in 3Q Insurance premiums, service revenue earned and other $ 393 $ 403 $ 433 Insurance losses and loss adjustment expenses 142 162 186 – Weather loss declined $10 million QoQ Acquisition and underwriting expenses 217 174 215 Total underwriting income 34 67 32 – Realized gains from investment portfolio Investment income and other 59 44 133 Pre-tax income from continuing ops $ 93 $ 111 $ 165 improved in 4Q due to a stronger equity market Total assets $ 8,036 $ 8,215 $ 8,789 Key Statistics 4Q 11 3Q 11 4Q 10 • Written premiums decreased QoQ but increased Insurance ratios YoY due to an increase in industry volume Loss ratio 36% 41% 43% Underwriting expense ratio 56% 43% 50% Combined ratio 92% 84% 93% – Dealer Products and Services premiums decreased QoQ due to seasonality Insurance Total Written Premiums (1) ($ millions) $397 $374 $380 $335 $311 4Q 10 1Q 11 2Q 11 3Q 11 4Q 11 Dealer Products & Services International (1) Continuing Operations only 4Q 2011 Preliminary Results 12

Mortgage Operations – Origination and Servicing • Origination and Servicing pre-tax loss of $237 million Key Financials ($ millions) 4Q 11 3Q 11 4Q 10 Net financing revenue $ (7) $ 7 $ 21 – Impacted by $270 million foreclosure related Gain on sale of mortgage loans, net 111 51 206 expense accrual Other revenue (excluding gain on sale) 261 (113) 184 Total net revenue 365 (55) 411 • Gain on sale is up from 3Q primarily due to Provision for loan losses - (1) -increased production and higher overall margins Noninterest expense 332 238 238 Pre-tax income (loss) from continuing ops, $ 33 $ (292) $ 173 – Increased margins partially driven by excluding foreclosure related expense accrual channel mix shift to direct -to-consumer Foreclosure related expense accrual 270 - -lending Pre-tax income (loss) from continuing ops $ (237) $ (292) $ 173 • Loan production of $16.5 billion is up $0.9 billion Total assets $ 23,024 $ 23,882 $ 23,681 from 3Q and down $6.8 billion from 4Q10 Primary servicing - EOP ($ billions) $ 351 $ 355 $ 356 • Servicing revenue normalized from volatility seen ($ millions) 4Q 11 3Q 11 4Q 10 in 3Q Servicing fees $ 292 $ 297 $ 314 Servicing asset valuation, net of hedge (126) (471) (213) – Over $400 million of servicing revenue in Net servicing revenue $ 166 $ (174) $ 101 2011 Origination and Servicing Mortgage Loan Production • Announced sale of ResMor Trust mortgage ($ billions) operations – Moved to Discontinued Operations in the $23.2 Legacy Portfolio & Other segment $15.6 $16.5 $11.8 $12.3 4Q 10 1Q 11 2Q 11 3Q 11 4Q 11 Prime Conforming Government Prime Non-Conforming Other 4Q 2011 Preliminary Results 13
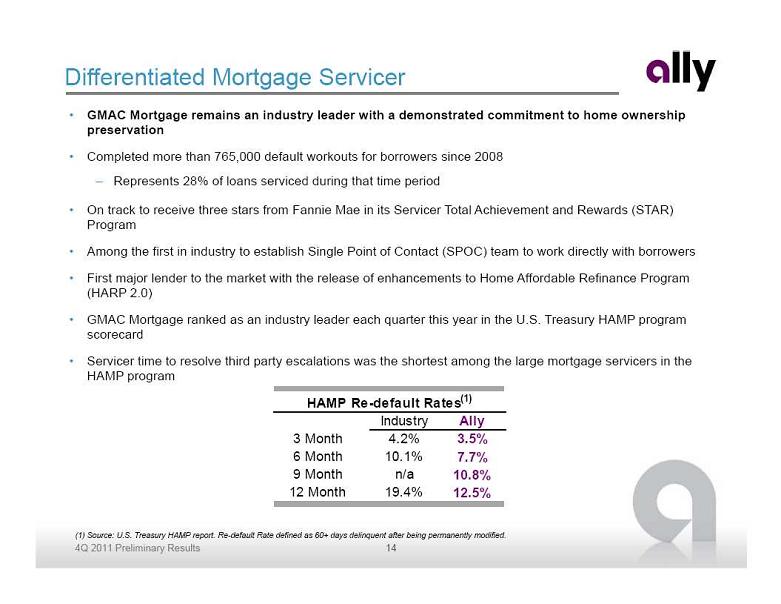
Differentiated Mortgage Servicer • GMAC Mortgage remains an industry leader with a demonstrated commitment to home ownership preservation • Completed more than 765,000 default workouts for borrowers since 2008 – Represents 28% of loans serviced during that time period • On track to receive three stars from Fannie Mae in its Servicer Total Achievement and Rewards (STAR) Program • Among the first in industry to establish Single Point of Contact (SPOC) team to work directly with borrowers • First major lender to the market with the release of enhancements to Home Affordable Refinance Program (HARP 2.0) • GMAC Mortgage ranked as an industry leader each quarter this year in the U.S. Treasury HAMP program scorecard • Servicer time to resolve third party escalations was the shortest among the large mortgage servicers in the HAMP program HAMP Re-default Rates(1) Industry Ally 3 Month 4.2% 3.5% 6 Month 10.1% 7.7% 9 Month n/a 10.8% 12 Month 19.4% 12.5% (1) Source: U.S. Treasury HAMP report. Re-default Rate defined as 60+ days delinquent after being permanently modified. 4Q 2011 Preliminary Results 14

Mortgage Operations – Legacy Portfolio and Other • Pre-tax loss of $65 million compared to a loss of Key Financials ($ millions) 4Q 11 3Q 11 4Q 10 $117 million in 3Q Net financing revenue $ 62 $ 68 $ 98 – Other revenue and provision impacted by Gain on sale of mortgage loans, net 39 6 141 write down as a result of Mexico asset Other revenue (excluding gain on sale) (27) (43) (26) revaluation Total net revenue 74 31 213 Provision for loan losses 35 32 23 • Assets continued to decline to $10.9 billion in 4Q Noninterest expense 104 116 243 Pre-tax loss from continuing ops $ (65) $ (117) $ (53) • Legacy HFS portfolio of $1.5 billion carry value – Sold $133 million net UPB at a gain of $24 million Legacy Portfolio & Other Balance Sheet ($ billions) – Marked at 45% of UPB $13.1 • Legacy Ally Bank HFI portfolio of $6.9 billion gross $12.3 $11.9 $11.6 $10.9 carry value, down $230 million from 3Q and $1.1 billion YoY – Portfolio continues to perform within expectations 4Q 10 1Q 11 2Q 11 3Q 11 4Q 11 Loans HFI Disc Ops Loans HFS Cash, trading & other assets Note: Consumer loans HFI consists primarily of Ally Bank HFI (originated pre-2009) and legacy securitizations 4Q 2011 Preliminary Results 15
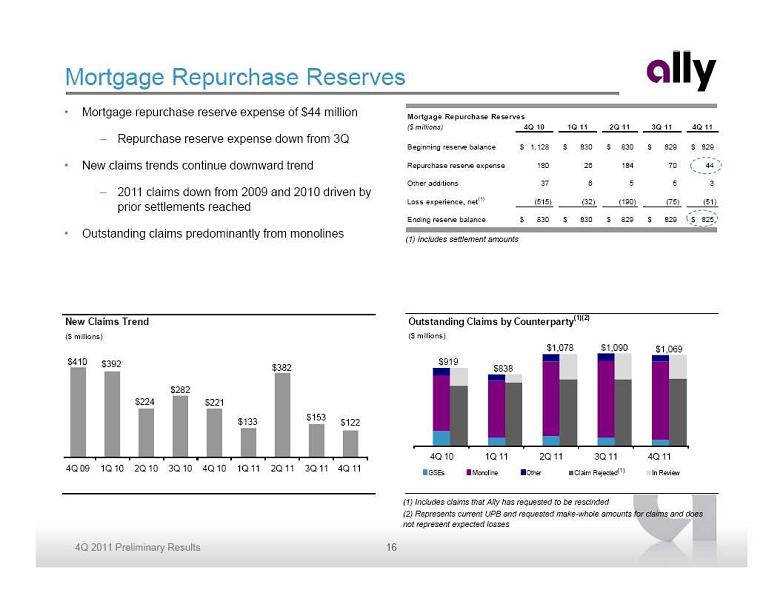
Mortgage Repurchase Reserves • Mortgage repurchase reserve expense of $44 million Mortgage Repurchase Reserves ($ millions) 4Q 10 1Q 11 2Q 11 3Q 11 4Q 11 – Repurchase reserve expense down from 3Q Beginning reserve balance $ 1,128 $ 830 $ 830 $ 829 $ 829 • New claims trends continue downward trend Repurchase reserve expense 180 26 184 70 44 Other additions 37 6 5 5 3 – 2011 claims down from 2009 and 2010 driven by prior settlements reached Loss experience, net(1) (515) (32) (190) (75) (51) Ending reserve balance $ 830 $ 830 $ 829 $ 829 $ 825 • Outstanding claims predominantly from monolines (1) Includes settlement amounts New Claims Trend Outstanding Claims by Counterparty (1)(2) ($ millions) ($ millions) $1,078 $1,090 $1,069 $410 $392 $919 $382 $838 $282 $224 $221 $153 $133 $122 4Q 10 4Q 10 1Q 11 1Q 11 2Q 11 2Q 11 3Q 11 3Q 11 4Q 114Q 11 4Q 09 1Q 10 2Q 10 3Q 10 4Q 10 1Q 11 2Q 11 3Q 11 4Q 11 (1) GSEs Monoline Other Claim Rejected In Review (1) Includes claims that Ally has requested to be rescinded (2) Represents current UPB and requested make-whole amounts for claims and does not represent expected losses 4Q 2011 Preliminary Results 16

Ally Bank Franchise Growth • Ally is well positioned to benefit as market shift to direct Direct banking preferred by customers banking model continues Preferred Banking Channel • Recognized as a leading direct bank franchise 72% 59% – Brand awareness (1) up 52% YoY – Introduced “No Nonsense” marketing campaign 34% 28% – Ally Bank 12-Month CD – “A Best Money Move of 2011” – MONEY® Magazine, May 2011 2007 2011 2007 2011 – Ally Bank recognized as one of the “Best Banks of 2011” – MONEY® Magazine, September 2011 Branches/ATM Direct Channels Source: American Bankers Association • Positive response to innovative product offerings launched in 2011 Strong brand recognition in short period of time – IRA products Ally Bank Brand Awareness (1) – 48 Month Raise Your Rate CD 38% – Popmoney – eCheck Deposit 25% – “Ally Perks” debit rewards program 2010 2011 (1) See page 27 for definitions 4Q 2011 Preliminary Results 17

Deposit Growth • Continued growth of Ally’s deposit base Stable, consistent growth of retail deposits – Total deposit growth of $0.7 billion Ally Financial Deposit Levels ($ billions) $44.3 $45.1 – Driven by $1.4 billion of retail deposit growth at Ally $40.7 $42.3 $39.0 Bank offset by typical year end drop in escrow deposits $26.3 $27.7 $21.8 $23.5 $24.6 • Customer loyalty driving 92% CD retention rate 4Q 10 1Q 11 2Q 11 3Q 11 4Q 11 • Number of Ally Bank retail customer accounts increased Ally Bank Retail Ally Bank Brokered ResMor Other 35% YoY Consistently building customer base High CD retention rates reflect franchise strength Ally Bank - Retail Deposit Accounts Retail CD Balance Retention (1) ($ billions) 977 920 852 $3.5 799 1.94 726 1.93 $3.0 91% 92% 676 1.90 88% 1.87 86% FHLB 617 $2.5 85% 535 573 1.85 Borrowings 506 1.82 $2.0 461 10% Br 363 1.78 1.76 1.75 1.75 $1.5 1.72 $1.0 1.65 $0.5 $0.0 1Q 09 2Q 09 3Q 09 4Q 09 1Q 10 2Q 10 3Q 10 4Q 10 1Q 11 2Q 11 3Q 11 4Q 11 4Q 10 1Q 11 2Q 11 3Q 11 4Q 11 Number of Retail Deposit Accounts (000s) CD Balances Up for Renewal CD Balances Retained Retention Rate Average Number of Deposit Accounts per Customer (1) Retention includes balances retained in any Ally Bank product 4Q 2011 Preliminary Results 18

Liquidity • Proactive liquidity management has effectively pre-funded wall of debt maturities in 2012 – Expect to refinance only a fraction of parent maturities in 2012 as bank financing model continues to evolve – $7.4 billion of TLGP maturing in the second half of 2012 – $27 billion of parent company liquidity and an additional $10 billion of liquidity at Ally Bank(1) • Time to Required Funding (2) (TRF) stands at 25 months – Assumes no change in asset growth projections and no additional unsecured issuance – Assumes auto ABS markets remain open • ABS markets remain at historically low and attractive yields – Completed 5 U.S. retail auto transactions in 2011 with average all-in yield of 1.2% – Auto ABS market proven to be resilient through the economic cycle Ally Financial Liquidity Position ($ billions) $30 $27 $25 $24 $22 $20 $14 $15 $10 $5 $0 4Q 10 4Q 11 Parent Co. Liquidity Unsecured Bond Maturities (next 24 months) (1) See page 26 for further details (2) See page 27 for definitions 4Q 2011 Preliminary Results 19

Funding Highlights • New funding transactions of $6.5 billion in 4Q and over $38 billion in 2011 • Ally utilizes a diverse funding strategy across markets and asset classes – Raised $2.2 billion in the U.S. and European term securitization markets in 4Q – Signed new $3.5 billion credit facility that will be utilized to fund U.S. auto leases in 2012 and 2013 • Demonstrates significant appetite for auto asset class Ally Financial Funding Transactions ($ billions) 4Q 11 2011 U.S. Public Securitization $ 1.7 $ 8.9 U.S. Private Securitization - 7.5 International Securitization 0.5 2.0 Auto Whole Loan Sales / Forward Purchase Commitments 0.4 5.2 U.S. New Secured Credit Facilities 3.5 5.5 International New Secured Credit Facilities 0.4 5.4 Unsecured Bond Issuance - 3.8 Total New Funding Transactions $ 6.5 $ 38.3 • In addition, Ally renewed $25 billion of existing revolving credit facilities during 2011 4Q 2011 Preliminary Results 20
![]()
Capital • Capital ratios remain robust versus the risk profile of assets and versus industry peers – Directive to maintain 15% Total Risk-Based Capital ratio expired 12/31/11 • Ally is well positioned to achieve the enhanced Basel III capital requirements in advance of the proposed timelines – Estimated 4Q11 Basel III Tier 1 Common Ratio of 10.7% on a fully converted basis(1) ($ billions) 12/31/2011 9/30/2011 12/31/2010 Tier 1 Capital $ 21.1 $ 21.5 $ 22.2 Tier 1 Common Capital $ 11.6 $ 12.0 $ 12.7 Total Risk-Based Capital $ 22.7 $ 23.2 $ 24.2 Tangible Common Equity $ 11.9 $ 12.3 $ 13.0 Tangible Assets $ 183.4 $ 181.4 $ 171.5 Risk-Weighted Assets $ 154.2 $ 149.7 $ 148.0 Tier 1 Capital Ratio 13.7% 14.3% 15.0% Tier 1 Common Capital Ratio 7.5% 8.0% 8.6% Total Risk-Based Capital Ratio 14.7% 15.5% 16.4% Tangible Common Equity / Tangible Assets 6.5% 6.8% 7.6% Tangible Common Equity / Risk-Weighted Assets 7.7% 8.2% 8.8% Note: Tier 1 Common and Tangible Common Equity are non-GAAP financial measures . See page 22 of the Financial Supplement for further details. (1) See page 27 for definitions 4Q 2011 Preliminary Results 21

Asset Quality Net charge -offs declined 56% YoY 3.14x reserve coverage of net charge -offs Consolidated Asset Quality Trends Allowance Balance as % of NCOs $ millions $ millions $109,779 $113,920 $107,871 1.20 358.0% 0.97% $106,488 329.3% 1.00 313.8% $101,398 0.80 239.1% 0.60 194.8% 0.73% 0.40 0.45% 0.45% 0.43% 0.20 0.00 4Q 10 1Q 11 2Q 11 3Q 11 4Q 11 4Q 10 1Q 11 2Q 11 3Q 11 4Q 11 Ending Loan Balance Net Charge -Off % Note: Above loans are classified as held-for-investment recorded at historical costs as these loans Note: See page 27 for further details are included in our allowance for loan losses. See page 27 for further details. Global auto delinquencies have normalized Global auto net credit losses down 43% YoY Global Delinquencies - Managed Retail Contract Amount Global Annualized Credit Losses - Managed Retail Contract Amount $ Amount of Accruing Contracts Greater than 30 Days Past Due (millions) ($ millions) 0.88% 0.83% 1.94% 1.48% 1.43% 0.51% 1.42% 1.47% 0.48% 0.41% $994 $937 $805 $871 $861 $108 $112 $60 $71 $78 4Q 10 1Q 11 2Q 11 3Q 11 4Q 11 4Q 10 1Q 11 2Q 11 3Q 11 4Q 11 Delinquent Contracts $ % of Retail Contract $ Outstanding Credit Losses % of Avg. Managed Assets 4Q 2011 Preliminary Results 22

Strategic Priorities • Be the leading global auto finance company • Grow our leading direct bank franchise • Continue to manage and reduce mortgage business risk • Continuously improve competitiveness through lower funding costs • Drive for continuous productivity improvement • Work toward continued repayment of the U.S. Treasury’s investment 4Q 2011 Preliminary Results 23

Supplemental Charts

Supplemental Corporate and Other • OID amortization expense of $137 million in 4Q Key Financials ($ millions) 4Q 11 3Q 11 4Q 10 • Commercial Finance pre-tax income of $29 Net financing loss $ (198) $ (186) $ (244) Total other revenue 18 40 45 million in 4Q, up from $24 million in 3Q Total net loss (ex. OID) (180) (146) (199) Provision for loan losses (19) (4) - • Noninterest expense normalized in 4Q Noninterest expense 153 81 157 Core pre-tax loss $ (314) $ (223) $ (356) OID Amortization Expense (1) 137 225 301 Pre-tax loss from continuing ops $ (451) $ (448) $ (657) Total assets $ 29,637 $ 32,393 $ 28,561 (1) Primarily bond exchange OID amortization expense used for calculating core pre-tax income OID Amortization Schedule ($ millions) $962 $336 $249 $176 Avg = $75/yr 2011 2012 2013 2014 2015 and thereafter As of 12/31/2011 . Primarily represents bond exchange OID amortization expense used for calculating core pre-tax income 4Q 2011 Preliminary Results 25

Supplemental Liquidity and Unsecured Debt Maturity Profile Available Liquidity 12/31/2011 9/30/2011 12/31/2010 ($ billions) Parent (1) Ally Bank Parent (1) Ally Bank Parent (1) Ally Bank Cash and Cash Equivalents $ 8.0 $ 3.6 $ 10.1 $ 4.5 $ 6.7 $ 3.1 Unencumbered Securities (2) 0.8 6.4 0.4 5.2 2.3 4.4 Current Committed Unused Capacity (3) 10.1 4.9 11.7 6.1 9.9 3.8 Subtotal $ 18.9 $ 14.9 $ 22.2 $ 15.8 $ 18.9 $ 11.3 Ally Bank Intercompany Loan(4) 4.9 (4.9) 2.2 (2.2) 3.7 (3.7) Total Current Available Liquidity $ 23.8 $ 10.0 $ 24.4 $ 13.6 $ 22.6 $ 7.5 Forward Committed Unused Capacity (5) 3.1 - 1.5 - 1.2 - Total Available Liquidity $ 26.9 $ 10.0 $ 25.9 $ 13.6 $ 23.8 $ 7.5 (1) Parent defined as Ally Consolidated less Ally Bank, ResCap (not shown) and Insurance (not shown) (2) Includes UST, Agency debt and Agency MBS (3) Includes equal allocation of shared unused capacity totaling $2.5 billion in 4Q11, $4.0 billion in 3Q11 and $3.9 billion in 4Q10, which can be used by Ally Bank or the Parent (including a Mexican subsidiary) . Parent company figures at September 30, 2011 exclude unused capacity of $2.4 billion from two new Ally Credit Canada facilities that were completed in 3Q11 to refinance existing debt outstanding early in 4Q11. (4) To optimize use of cash and secured facility capacity between entities, Ally Financial lends cash to Ally Bank from time to time under an intercompany loan agreement . Amounts outstanding on this loan are repayable to Ally Financial at any time, subject to 5 days notice. (5) Represents both forward purchase commitments and committed secured facilities, which are reliant upon the origination of future receivables, stated capacity represents anticipated facility utilization during the next 12 months . Ally Financial Inc. Consolidated Unsecured Long-Term Debt Maturity Profile ($ billions) $20 $12 $6 $4 $2 2012 2013 2014 2015 2016 and thereafter As of 12/31/2011 4Q 2011 Preliminary Results 26
Supplemental Notes on non -GAAP and other financial measures (1) Core pre-tax income is a non-GAAP financial measure . It is defined as income from continuing operations before taxes and primarily bond exchange original issue discount ("OID") amortization expense . (2) Controllable expenses include employee related costs, consulting and legal fees, marketing, information technology, facility, portfolio servicing and restructuring expenses . (3) OID amortization expense includes accelerated OID amortization of $50 million in FY 2011 and $101 million in FY 2010 from extinguishment of debt. (4) Net Interest Margin and Cost of Funds exclude OID amortization expense . The impact of historical financial statement restatements for discontinued operations are not reflected in prior periods . (5) Risk Adjusted NIM is calculated as net interest margin (ex. OID) less annualized net charge -off ratio. (6) Legacy Portfolio and Other segment primarily consists of loans originated prior to Jan. 1, 2009, and includes non core business activities including portfolios in run off. (7) Corporate and Other primarily consists of centralized corporate treasury and deposit gathering activities, such as management of the cash and corporate investment securities portfolios, short and long term debt, retail and brokered deposit liabilities, derivative instruments, the amortization of the discount associated with new debt issuances and bond exchanges, most notably from the December 2008 bond exchange, and the residual impacts of our corporate funds transfer pricing (FTP) and treasury asset liability management (ALM) activities . The segment also includes our Commercial Finance Group, certain equity investments and reclassifications and eliminations between the reportable operating segments . (8) Basel III Tier 1 Contingent Common calculation assumes full conversion of MCP to common equity and is based on management’s current interpretation of Basel III capital proposals . This proforma capital calculation is subject to change based on final Basel III rulemaking and interpretations thereof by regulatory authorities . Note, Basel I Tier 1 Contingent Common also assumes full conversion of MCP to common equity. (9) Brand Awareness percentage provided by an outside firm, TNS Custom Research . TNS is the world's largest custom market research specialist, providing innovative market research expertise across the product life-cycle, in 80 countries . (10) Time-to-required funding (TRF) is a liquidity risk measure expressed as the number of months that Ally Financial can meet its ongoing liquidity needs as they arise without issuing unsecured debt. The TRF metric assumes that asset growth projections remain unchanged and that the auto ABS markets remain open. (11) Net charge -off ratios are calculated as annualized net charge -offs divided by average outstanding finance receivables and loans excluding loans measured at fair value and loans held-for-sale. (12) Allowance coverage ratios are based on the allowance for loan losses related to loans held-for-investment excluding those loans held at fair value as a percentage of the unpaid principal balance, net of premiums and discounts . 4Q 2011 Preliminary Results 27