Attached files
| file | filename |
|---|---|
| EX-99.1 - EXHIBIT 99.1 - ARROW ELECTRONICS INC | a50152816ex99-1.htm |
| 8-K - ARROW ELECTRONICS, INC. 8-K - ARROW ELECTRONICS INC | a50152816.htm |
Exhibit 99.2
Fourth-Quarter 2011 CFO Commentary
As reflected in our earnings release, there are a number of items that impact the comparability of our results with those in the trailing quarter and the fourth quarter of last year. Any discussion of our results will exclude these items to give you a better sense of our operating results. As always, the operating information we provide to you should be used as a complement to GAAP numbers. For a complete reconciliation between our GAAP and Non-GAAP results, please refer to our earnings release or the earnings reconciliation found at the end of this document.
The following fourth quarter and pro forma information included in this CFO commentary is unaudited and should be read in conjunction with the company's consolidated financial statements and related notes appearing in the company's 2011 Annual Report on Form 10-K as filed with the Securities and Exchange Commission.
Fourth-Quarter and Full-Year Summary
2011 was an exceptional year for Arrow Electronics as we set new financial records and successfully executed on our strategy to drive growth in our core global components and global ECS businesses as well as in high-margin lifecycle services. We achieved record revenue of $21.4 billion, representing year-over-year growth of 14% and compound annual growth of 10% over the past five years. One of our long-term goals is to grow profits faster than sales and we did that again in 2011, with operating income increasing 1.5x faster than sales. We reported record earnings per share of $5.19, an increase of 26% from 2010 and compound annual growth of 12% over the past five years. Our commitment to generating superior returns is clear:
|
|
·
|
Return on working capital for the full year is ahead of our long-term goal;
|
|
|
·
|
Return on invested capital is well in excess of our weighted average cost of capital
|
In global enterprise computing solutions we had a remarkable year, as Andy Bryant and his team set records for sales and operating income. Over the course of the year, we made significant progress on our strategy to differentiate Arrow ECS and solidified our industry-leading position. In 2011, we acquired new businesses that improved our strategic position in the market and we expanded our services offering to achieve higher value and margins. As we head into 2012, we are confident ECS will benefit from this next wave of IT spending to build out the data center of the future.
In global components, Peter Kong and his team did an admirable job of growing the legacy business in a market that was expected to decline in 2011, and also set records for annual sales and operating income. In 2011 we executed on our strategy to expand the portfolio and increase our addressable market. Our strong performance, coupled with a number of strategic acquisitions, has accelerated our core business and we continue to see new opportunities as we enter 2012.
1
Consolidated Overview – Full Year 2011
|
P&L Highlights*
|
2011
|
Y/Y
Change
|
Y/Y Change
Pro Forma
|
|
Sales
|
$21,390
|
+14%
|
+4%
|
|
Gross Profit Margin
|
13.8%
|
+90bps
|
+20bps
|
|
Operating Expense/Sales
|
9.3%
|
+60bps
|
-20bps
|
|
Operating Income
|
$952.5
|
+22%
|
+14%
|
|
Operating Margin
|
4.5%
|
+30bps
|
+40bps
|
|
Net Income
|
$601.4
|
+22%
|
+16%
|
|
Diluted EPS
|
$5.19
|
+26%
|
+19%
|
* $ in millions, except per share data, may reflect rounding
|
·
|
2011 sales of $21.4 billion increased 14% year over year
|
|
|
o
|
Driven by the addition of recent acquisitions and growth in both segments in a difficult economic environment
|
|
|
§
|
Pro forma for acquisitions and excluding FX, sales were up 2% year over year
|
|
·
|
Consolidated gross profit margin was 13.8%
|
|
|
o
|
Increased 90 basis points year over year primarily due to higher margins attributable to recent acquisitions, improved pricing, and a favorable mix towards higher profit margin products in both the global components and global ECS businesses.
|
|
|
§
|
Pro forma for acquisitions, gross margin increased 20 basis points year over year
|
|
·
|
Operating expenses as a percentage of sales was 9.3%
|
|
|
o
|
Increased 60 basis points year over year
|
|
|
o
|
On an absolute dollar basis, operating expenses increased 22% year over year as acquisitions added $285 million, $42 million was for investments and variable costs relating to increased sales, and a strengthening dollar lowered expenses by $35 million due to translation
|
|
|
§
|
Pro forma for acquisitions, operating expenses were up only 2% year over year and were down 20 basis points as a percentage of sales
|
|
·
|
Operating income was $952.5 million
|
|
|
o
|
Increased 22% year over year
|
|
|
o
|
Operating income grew 1.5x faster than sales year over year
|
|
|
§
|
Pro forma operating income growth outpaced sales growth by 3x
|
|
·
|
Operating income as a percentage of sales was 4.5%
|
|
|
o
|
Increased 30 basis points year over year
|
|
|
o
|
Within the range of our long-term targets
|
|
·
|
Effective tax rate for the year was 29.5%
|
|
·
|
Net income was $601.4 million
|
|
|
o
|
Increased 22% compared with last year
|
|
·
|
Earnings per share were $5.27 and $5.19 on a basic and diluted basis, respectively
|
|
|
o
|
Diluted EPS increased 26% year over year
|
|
|
o
|
This represents the highest level ever reported
|
|
·
|
Extremely strong returns on capital
|
|
|
o
|
Return on working capital for the full year is ahead of our long-term goal
|
|
|
o
|
Return on invested capital is well in excess of our weighted average cost of capital
|
2
Consolidated Overview – Fourth Quarter
|
P&L Highlights*
|
4Q11
|
Y/Y
Change
|
Y/Y Change
Pro Forma
|
Q/Q
Change
|
|
Sales
|
$5,440
|
+4%
|
-3%
|
+5%
|
|
Gross Profit Margin
|
13.7%
|
+70bps
|
+10bps
|
Flat
|
|
Operating Expense/Sales
|
9.2%
|
+70bps
|
+10bps
|
-30bps
|
|
Operating Income
|
$246.3
|
+4%
|
Flat
|
+13%
|
|
Operating Margin
|
4.5%
|
Flat
|
+10bps
|
+30bps
|
|
Net Income
|
$157.3
|
+4%
|
+1%
|
+14%
|
|
Diluted EPS
|
$1.38
|
+7%
|
+4%
|
+15%
|
* $ in millions, except per share data, may reflect rounding
|
·
|
Fourth quarter sales of $5.4 billion were in line with our expectations
|
|
|
o
|
Increased 4% year over year and 5% on a sequential basis
|
|
|
§
|
Pro forma for acquisitions and excluding FX, sales were down 3% year over year and increased 6% sequentially
|
|
·
|
Consolidated gross profit margin was 13.7%
|
|
|
o
|
Increased 70 basis year over year, driven primarily by the addition of higher margin products and services, and was flat sequentially
|
|
|
o
|
Pro forma for acquisitions, gross profit margin was up 10 basis points year over year
|
|
·
|
Operating expenses as a percentage of sales was 9.2%
|
|
|
o
|
Increased 70 basis points year over year and decreased 30 basis points sequentially
|
|
|
o
|
On an absolute dollar basis, operating expenses increased 12% year over year as acquisitions added $55 million this quarter
|
|
|
§
|
Pro forma for acquisitions, operating expenses were down 3% year over year and were up 10 basis points as a percentage of sales
|
|
·
|
Operating income was $246.3 million
|
|
|
o
|
Increased 4% year over year and 13% sequentially
|
|
|
o
|
Pro forma for acquisitions, operating income was flat year over year
|
|
·
|
Operating income as a percentage of sales was 4.5%
|
|
|
o
|
Flat year over year and increased 30 basis points sequentially
|
|
|
o
|
Pro forma for acquisitions, operating income as a percentage of sales increased 10 basis points year over year
|
|
·
|
Effective tax rate for the quarter was 28.4%
|
|
·
|
Net income was $157.3 million
|
|
|
o
|
Increased 4% compared with last year and 14% sequentially
|
|
|
o
|
Pro forma for acquisitions, net income was up 1% year over year
|
|
·
|
Earnings per share were $1.40 and $1.38 on a basic and diluted, respectively
|
|
|
o
|
Diluted EPS increased 7% year over year and 15% sequentially
|
|
|
o
|
Pro forma for acquisitions, EPS increased 4% year over year
|
|
|
o
|
This is a record level of earnings per share
|
3
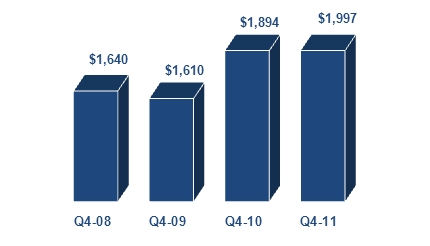
Global Components
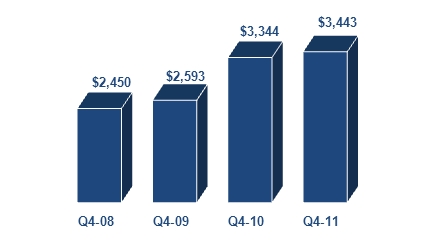
Sales ($ in millions)
|
·
|
Sales increased 3% year over year and declined 6% sequentially
|
|
|
o
|
Pro forma and excluding the impact of foreign exchange, sales declined 5% year over year and 4% sequentially
|
|
|
§
|
In line with the high end of normal seasonality on a sequential basis
|
|
·
|
Gross margin increased 50 basis points year over year primarily due to the impact of recently acquired businesses
|
|
|
o
|
Sequentially, gross margin increased 20 basis points, primarily driven by strength in the Americas region
|
|
·
|
Leading indicators, including lead times and cancellation rates, are in line with normal historical levels
|
|
·
|
Operating profit declined 3% year over year
|
|
|
o
|
Operating margin decreased 30 basis points year over year to 5.1%
|
|
|
o
|
Pro forma for acquisitions, operating margin was flat year over year
|
|
·
|
Return on working capital declined 570 basis points year over year reflecting lower profitability and increased levels of working capital, primarily due to the impact of acquisitions
|
4
Americas Components Region
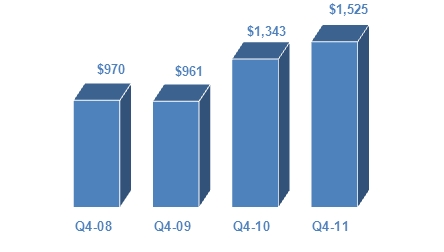
Sales ($ in millions)
|
·
|
Sales increased 14% year over year and 3% sequentially
|
|
|
o
|
Pro forma for acquisitions, sales increased 2% year over year and increased 3% on a sequential basis
|
|
|
o
|
Sales well above normal seasonality on a sequential basis
|
|
·
|
In 2011, our lighting vertical grew 8% year over year, significantly outgrowing the market
|
|
·
|
Operating income increased 14% year over year
|
|
|
o
|
Operating margin increased 10 basis points year over year
|
|
|
o
|
Pro forma for acquisitions, operating margin increased 60 basis points year over year
|
|
·
|
Looking ahead to the first quarter, we expect sales in our traditional Americas components legacy business to be in line with the low to midpoint of normal seasonality
|
5
Europe Components Region
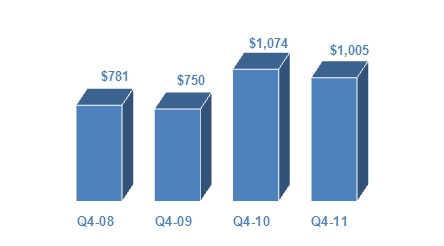
Sales ($ in millions)
|
·
|
Sales declined 7% year over year and 16% sequentially
|
|
|
o
|
Pro forma for acquisitions and excluding FX, sales decreased 9% year over year and 12% sequentially
|
|
|
o
|
Sales below normal seasonality due to market softness
|
|
·
|
Performance in Central Europe, particularly Germany, and Northern Europe relatively in line with expectations
|
|
|
o
|
Weakness in Southern Europe driven by sovereign debt issues and economic uncertainty
|
|
·
|
Vertical market growth continued in the fourth quarter with aerospace and defense and lighting increasing 19% and 12% year over year, respectively
|
|
·
|
Operating income declined 19% year over year
|
|
|
o
|
Operating margin declined 70 basis points year over year
|
|
·
|
Looking ahead to the first quarter, we expect sales in our traditional European components legacy business to be in line with the low to midpoint of normal seasonality
|
6
Asia Pacific Components Region
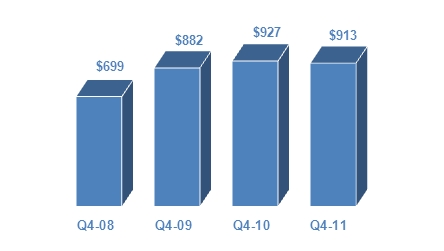
Sales ($ in millions)
|
·
|
Sales declined 2% year over year and 7% sequentially
|
|
|
o
|
Pro forma for acquisitions, sales decreased 11% year over year and 8% sequentially
|
|
|
o
|
Below normal seasonality on a sequential basis, primarily due to ongoing weakness in the low-end mobile handset component market and soft market conditions in the region
|
|
·
|
Core Asia sales increased 11% year over year
|
|
|
o
|
Strength in China and Taiwan partially offset by decreased demand in Hong Kong and South Asia
|
|
|
o
|
Sequentially, the core business was above normal seasonality
|
|
·
|
Vertical market growth led by lighting and transportation, which increased 41% and 17% year over year, respectively
|
|
|
o
|
In 2011, we outgrew the lighting market by nearly 40%
|
|
·
|
Operating profit declined 20% year over year
|
|
|
o
|
Operating margin declined 50 basis points year over year
|
|
·
|
Looking ahead to the first quarter, we expect sales in our traditional Asia Pacific components legacy business to be in line with the low to midpoint of normal seasonality
|
7
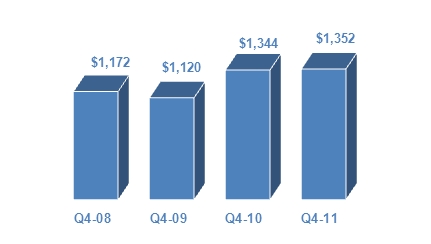
Global Enterprise Computing Solutions
Sales ($ in millions)
|
·
|
Sales increased 5% year over year and 30% sequentially
|
|
|
o
|
Record fourth quarter and full year revenue
|
|
|
o
|
Pro forma for acquisitions and excluding FX, sales increased 1% year over year and 32% sequentially
|
|
|
§
|
Below normal seasonality due to an increased mix of services revenue
|
|
·
|
Strong double-digit year-over-year growth in storage (+22%), services (+20%), and software (+17%)
|
|
|
o
|
Robust growth in faster-growing product lines with networking, infrastructure, and virtualization up 72%, 25%, and 17% year over year, respectively
|
|
|
o
|
Sequentially, all product lines experienced very healthy double-digit growth, led by software (+62%), storage (+30%), services (+20%), and proprietary servers (+13%)
|
|
·
|
Gross margin increased 90 basis points year over year driven by the addition of acquisitions and changes in product mix
|
|
|
o
|
Pro forma for acquisitions, gross profit increased 50 basis points year over year
|
|
|
o
|
Gross margin was flat on a sequential basis
|
|
·
|
Operating income grew 19% year over year and increased nearly 4x faster than sales
|
|
|
o
|
Operating margin increased 60 basis points year over year to 5.3%
|
|
|
o
|
Pro forma for acquisitions, operating margin increased 50 basis points year over year
|
|
|
o
|
Full year 2011 operating margin of 4.0% increased 60 basis points year over year
|
|
·
|
Return on working capital continues to excel
|
8
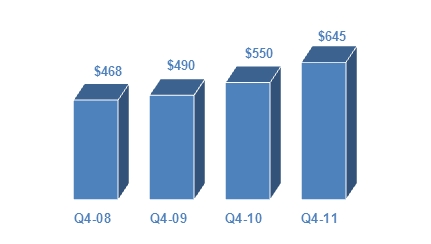
ECS America
Sales ($ in millions)
|
·
|
Sales increased 1% year over year and 23% sequentially
|
|
|
o
|
Record quarterly revenue
|
|
|
o
|
Pro forma for acquisitions, sales decreased 3% year over year and increased 23% sequentially
|
|
·
|
Impressive double-digit year-over-year growth in networking (+72%), virtualization (+28%), services (+24%), storage (+24%), and software (+19%)
|
|
·
|
Gross profit increased 160 basis points year over year and declined 20 basis points sequentially
|
|
|
o
|
Year-over-year increase driven by strength in our core North American value-added distribution business, changes in product mix, and the addition of recent acquisitions
|
|
·
|
A combination of top-line growth and improved gross profit resulted in operating income growth of 25% year over year
|
|
|
o
|
Operating income grew significantly faster than sales year over year
|
|
|
o
|
Operating margin expanded 110 basis points year over year
|
|
·
|
Looking ahead to the first quarter, we expect sales in our traditional Americas value-added computing solutions business to be in line with normal seasonality
|
9
ECS Europe
Sales ($ in millions)
|
·
|
Sales increased 17% year over year and 48% sequentially
|
|
|
o
|
Pro forma for acquisitions and excluding FX, sales increased 10% year over year and 54% sequentially
|
|
·
|
Sales growth in line with normal seasonality on a sequential basis
|
|
|
o
|
Strong growth across Western and Central Europe, increasing 18% and 14%, respectively
|
|
|
§
|
UK and Southern Europe grew 7% and 6%, respectively, despite difficult market conditions
|
|
|
o
|
Notable year-over-year growth in networking (+71%), infrastructure (+35%), storage (+16%), and proprietary servers (+14%)
|
|
·
|
Gross profit declined 110 basis points year over year due primarily to product mix
|
|
|
o
|
Pro forma for acquisitions, gross profit declined 70 basis points year over year
|
|
|
o
|
Increased 20 basis points sequentially
|
|
·
|
Operating profit increased 7% year over year
|
|
|
o
|
Operating margin declined 40 basis points year over year
|
|
·
|
Looking ahead to the first quarter, we expect sales in our traditional European value-added computing solutions business to be in line with the low to midpoint of normal seasonality
|
10
Cash Flow and Balance Sheet Highlights
|
·
|
Working Capital
|
We continue to effectively manage all levers of our working capital and working capital to sales of $.15 is within our long-term target range. Return on working capital of 31.0% is above our long-term target.
|
·
|
Return on Invested Capital
|
Return on invested capital of 13.2% is well in excess of our weighted average cost of capital and in line with the midpoint of our long-term target range. This is a key driver in creating lasting shareholder value.
|
·
|
Cash Flow from Operations
|
We generated $147 million in cash from operations in the fourth quarter. For the full year 2011, we generated $121 million in cash from operations, during a period where we achieved record revenue and continued to invest in the business.
|
·
|
Share Buyback
|
In 2011 we repurchased 5.1 million shares for a total of $182 million. We currently have $150 million remaining on our most recent repurchase authorization to fund future share buybacks.
|
·
|
Debt and Liquidity
|
Our balance sheet and capital structure remain strong with conservative debt levels, and a net debt to EBITDA ratio of approximately 1.5x. We further strengthened our financial position during the fourth quarter as we extended our asset securitization for 3 years and increased its borrowing capacity to $775 million. This transaction brings our total available liquidity to nearly $2.0 billion in addition to our cash of almost $400 million. Thus we have the flexibility to continue to take advantage of opportunities in the marketplace.
|
First Quarter 2012 Guidance
|
|
|
Consolidated Sales
|
$4.67 billion to $5.07 billion
|
|
Global Components
|
$3.35 billion to $3.55 billion
|
|
Global ECS
|
$1.32 billion to $1.52 billion
|
|
Diluted Earnings per Share
|
$1.01 to $1.13
|
11
Arrow Electronics Revenue Seasonality*
|
Global
Components
|
NAC
|
EMEA ex FX
|
AAP
|
|
Q1
|
-2% to +4%
|
+13% to +19%
|
-1% to +5%
|
|
Q2
|
-3% to +3%
|
-5% to -11%
|
+4% to +10%
|
|
Q3
|
-2% to +4%
|
-5% to +1%
|
+3% to +9%
|
|
Q4
|
-4% to +2%
|
-3% to -9%
|
-1% to +7%
|
|
Global ECS
|
NA
|
EMEA ex FX
|
|
Q1
|
-28% to -34%
|
-21% to -27%
|
|
Q2
|
+20% to +26%
|
+1% to +7%
|
|
Q3
|
-2% to -8%
|
-12% to -18%
|
|
Q4
|
+28% to +34%
|
+59% to +65%
|
* Revenue seasonality based on historical sequential sales growth for 2007-2011 for our traditional components and ECS businesses excluding acquisitions
12
Risk Factors
The discussion of the company’s business and operations should be read together with the risk factors contained in Item 1A of its 2011 Annual Report on Form 10-K, filed with the Securities and Exchange Commission, which describe various risks and uncertainties to which the company is or may become subject. If any of the described events occur, the company’s business, results of operations, financial condition, liquidity, or access to the capital markets could be materially adversely affected.
Certain Non-GAAP Financial Information
In addition to disclosing results that are determined in accordance with Generally Accepted Accounting Principles ("GAAP"), the company provides certain non-GAAP financial information relating to operating income, net income attributable to shareholders and net income per basic and diluted share, each as adjusted for certain charges, credits and losses that the company believes impact the comparability of its results of operations. These charges, credits and losses arise out of the company's efficiency enhancement initiatives, acquisitions, prepayment of debt, and settlement of certain legal and tax matters. A reconciliation of the company's non-GAAP financial information to GAAP is set forth in the table below.
The company believes that such non-GAAP financial information is useful to investors to assist in assessing and understanding the company's operating performance and underlying trends in the company's business because management considers the charges, credits and losses referred to above to be outside the company's core operating results. This non-GAAP financial information is among the primary indicators management uses as a basis for evaluating the company's financial and operating performance. In addition, the company's Board of Directors may use this non-GAAP financial information in evaluating management performance and setting management compensation.
The presentation of this additional non-GAAP financial information is not meant to be considered in isolation or as a substitute for, or alternative to, operating income, net income attributable to shareholders and net income per basic and diluted share determined in accordance with GAAP. Analysis of results and outlook on a non-GAAP basis should be used as a complement to, and in conjunction with, data presented in accordance with GAAP.
13
Earnings Reconciliation
($ in thousands, except per share data)
| Q4 2011 | Q4 2010 | 2011 | 2010 | |||||||||||||
|
Operating income, as Reported
|
$232,183 | $231,795 | $908,843 | $750,775 | ||||||||||||
|
Restructuring, integration, and other charges
|
14,135 | 6,070 | 37,811 | 33,494 | ||||||||||||
|
Settlement of legal matter
|
-- | -- | 5,875 | -- | ||||||||||||
|
Operating income, as Adjusted
|
$246,318 | $237,865 | $952,529 | $784,269 | ||||||||||||
|
Net income attributable to shareholders, as Reported
|
$174,088 | $157,889 | $598,810 | $479,630 | ||||||||||||
|
Restructuring, integration, and other charges
|
11,223 | 5,459 | 28,054 | 24,605 | ||||||||||||
|
Settlement of legal matter
|
-- | -- | 3,609 | -- | ||||||||||||
|
Gain/(adjustment) on bargain purchase
|
410 | -- | (668 | ) | -- | |||||||||||
|
Loss on prepayment of debt
|
549 | -- | 549 | 964 | ||||||||||||
|
Reversal of valuation allowance on international deferred tax assets
|
(28,928 | ) | -- | (28,928 | ) | -- | ||||||||||
|
Impact of settlements on tax matters
|
||||||||||||||||
|
Income tax
|
-- | (9,404 | ) | -- | (9,404 | ) | ||||||||||
|
Interest (net of taxes)
|
-- | (2,312 | ) | -- | (2,312 | ) | ||||||||||
|
Net income attributable to shareholders, as Adjusted
|
$157,342 | $151,632 | $601,426 | $493,483 | ||||||||||||
|
Diluted EPS, as Reported
|
$1.53 | $1.34 | $5.17 | $4.01 | ||||||||||||
|
Restructuring, integration, and other charges
|
0.10 | 0.05 | 0.24 | 0.21 | ||||||||||||
|
Settlement of legal matter
|
-- | -- | 0.03 | -- | ||||||||||||
|
Gain/(adjustment) on bargain purchase
|
-- | -- | (0.01 | ) | -- | |||||||||||
|
Loss on prepayment of debt
|
-- | -- | -- | 0.01 | ||||||||||||
|
Reversal of valuation allowance on international deferred tax assets
|
(0.25 | ) | -- | (0.25 | ) | -- | ||||||||||
|
Impact of settlements on tax matters
|
||||||||||||||||
|
Income tax
|
-- | (0.08 | ) | -- | (0.08 | ) | ||||||||||
|
Interest (net of taxes)
|
-- | (0.02 | ) | -- | (0.02 | ) | ||||||||||
|
Diluted EPS, as Adjusted
|
$1.38 | $1.29 | $5.19 | $4.13 |
The sum of the components for net income per share, as Adjusted, may not agree to totals, as presented, due to rounding.
Earnings Reconciliation
References to restructuring and other charges refer to the following incremental charges taken in the periods indicated:
Q4-11 Restructuring, Integration, and Other Charges: During the fourth quarter of 2011, the company recorded restructuring, integration, and other charges of $14.1 million ($11.2 million net of related taxes or $.10 per share on both a basic and diluted basis) primarily related to initiatives taken by the company to improve operating efficiencies.
Q4-11 Gain/(Adjustment) on Bargain Purchase: During the fourth quarter of 2011, the company recorded an adjustment to the gain on bargain purchase recorded in the first quarter of 2011 of $.7 million ($.4 million net of related taxes).
14
Q4-11 Loss on Prepayment of Debt: During the fourth quarter of 2011, the company recorded a loss on prepayment of debt of $.9 million ($.5 million net of related taxes).
Q4-11 Reversal of Valuation Allowance on International Deferred Tax Assets: During the fourth quarter of 2011, the company recorded a net reduction of the provision for income taxes of $28.9 million ($.26 and $.25 per share on a basic and diluted basis, respectively) principally due to a reversal of a valuation allowance on certain international deferred tax assets.
Q4-10 Restructuring, Integration, and Other Charges: During the fourth quarter of 2010, the company recorded restructuring, integration, and other charges of $6.1 million ($5.5 million net of related taxes or $.05 per share on both a basic and diluted basis) primarily related to initiatives taken by the company to improve operating efficiencies.
Q4-10 Impact of Settlements on Tax Matters: During the fourth quarter of 2010, the company recorded a net reduction of the provision for income taxes of $9.4 million ($.08 per share on both a basic and diluted basis) and a reduction in interest expense of $3.8 million ($2.3 million net of related taxes or $.02 per share on both a basic and diluted basis) primarily related to the settlement of certain income tax matters covering multiple years.
2011 Restructuring, Integration, and Other Charges: During 2011, the company recorded restructuring, integration, and other charges of $37.8 million ($28.1 million net of related taxes or $.25 and $.24 per share on a basic and diluted basis, respectively) primarily related to initiatives taken by the company to improve operating efficiencies.
2011 Settlement of Legal Matter: During 2011, the company recorded a charge of $5.9 million ($3.6 million net of related taxes or $.03 per share on both a basic and diluted basis) in connection with the settlement of a legal matter.
2011 Gain on Bargain Purchase: During 2011, the company recorded a gain on a bargain purchase of $1.1 million ($.7 million net of related taxes or $.01 per share on both a basic and diluted basis).
2011 Loss on Prepayment of Debt: During 2011, the company recorded a loss on prepayment of debt of $.9 million ($.5 million net of related taxes).
2011 Reversal of Valuation Allowance on International Deferred Tax Assets: During 2011, the company recorded a net reduction of the provision for income taxes of $28.9 million ($.25 per share on both a basic and diluted basis) principally due to a reversal of a valuation allowance on certain international deferred tax assets.
15
2010 Restructuring, Integration, and Other Charges: During 2010, the company recorded restructuring, integration, and other charges of $33.5 million ($24.6 million net of related taxes or $.21 per share on both a basic and diluted basis) primarily related to initiatives taken by the company to improve operating efficiencies.
2010 Loss on Prepayment of Debt: During 2010, the company recorded a loss on prepayment of debt of $1.6 million ($1.0 million net of related taxes or $.01 per share on both a basic and diluted basis).
2010 Impact of Settlements on Tax Matters: During 2010, the company recorded a net reduction of the provision for income taxes of $9.4 million ($.08 per share on both a basic and diluted basis) and a reduction in interest expense of $3.8 million ($2.3 million net of related taxes or $.02 per share on both a basic and diluted basis) primarily related to the settlement of certain income tax matters covering multiple years.
16