Attached files
| file | filename |
|---|---|
| 8-K - FORM 8-K - STANCORP FINANCIAL GROUP INC | d290662d8k.htm |
| EX-99.2 - STATISTICAL SUPPLEMENT - STANCORP FINANCIAL GROUP INC | d290662dex992.htm |
| EX-99.1 - PRESS RELEASE - STANCORP FINANCIAL GROUP INC | d290662dex991.htm |
 ©
2010 Standard Insurance Company
2012 Annual Guidance
January 30, 2012
Exhibit 99.3 |
 ©
2010 Standard Insurance Company
Forward-Looking Statements
2
This presentation should be read in conjunction with StanCorp’s
most recent earnings release and most recent Form 10-Q.
Information in this presentation includes certain statements related
to projected growth and future events. These statements are
“forward-looking”
statements as that term is defined in the Private
Securities Litigation Reform Act of 1995. Because such statements
are subject to risks and uncertainties, actual results in future
periods may differ materially from those expressed or implied by
such forward-looking statements. See StanCorp’s latest annual
report on Form 10-K and most recent Form 10-Q filed with the
Securities and Exchange Commission for a description of the types
of uncertainties and risks that may affect actual results.
|
 ©
2010 Standard Insurance Company
2012 Annual Guidance
3
Earnings Guidance
Challenges
•
Net income per diluted share,
excluding after-tax net capital
gains and losses, to be in the
range of $3.60 to $3.90.
•
Return on average equity,
excluding after-tax net capital
gains and losses from net income
and AOCI from equity, to be in the
range of 9% to 10%.
•
Sustained low interest rate
environment.
•
Declining wage and employment
levels.
•
Competitive pricing environment. |
 ©
2010 Standard Insurance Company
2012 Annual Guidance
4
•
Given pricing actions and a continued challenging economic environment,
we expect group insurance premium growth to be relatively flat.
•
We expect our group insurance annual benefit ratio to be in the range of
80% to 82%.
•
If the current interest rate environment persists, we estimate the discount
rate would be lowered 25 to 50 basis points.
•
We expect share repurchases to be in the range of $40 to $80 million.
•
Our estimated 2012 effective income tax rate will be 26% to 27%.
•
We estimate that implementing ASU 2010-26 will increase pre-tax
expenses by approximately $3 to $4 million.
Factors Affecting 2012 Guidance |
 ©
2010 Standard Insurance Company
Earnings per Share
5
*Excluding after-tax net capital gains and losses
For
illustrative
purposes,
factors
are
not
shown
to
scale
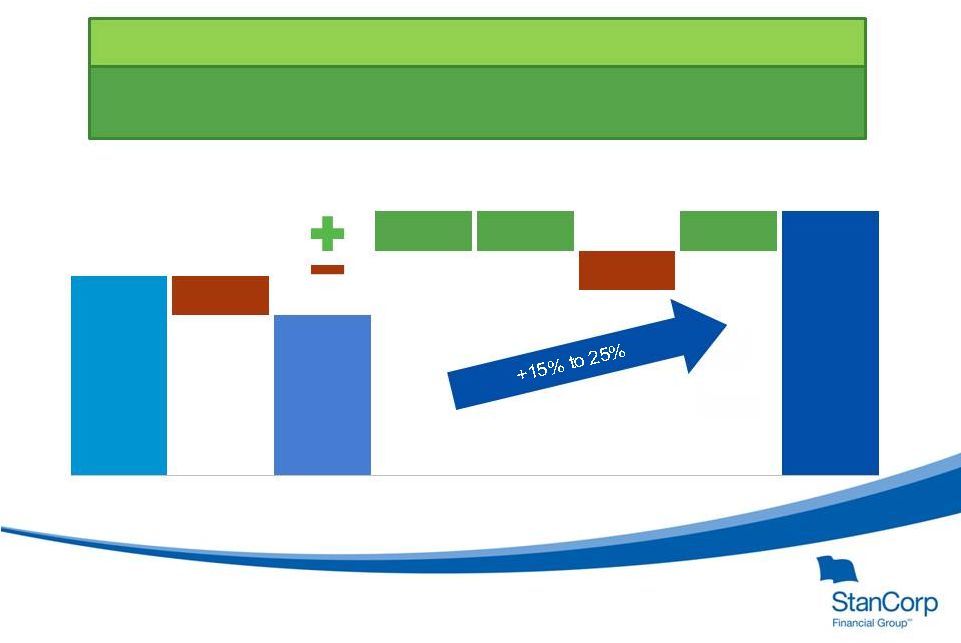
2011 EPS*
2012 EPS Guidance
Net income per diluted share, excluding after-tax net capital gains and
losses, to be in the range of $3.60 to $3.90.
ASU 2010-26
DAC Impact
$0.05 to $0.06
2011 EPS*
Including
Annual
ASU 2010-26
DAC Impact
$3.13 to $3.14
$3.60 to $3.90
Group
Benefit Ratio
Interest
Rates
Premium
Growth
Other
2012 EPS*
Guidance
$3.19 |
 ©
2010 Standard Insurance Company
6
Non-GAAP Financial Measures
($ millions –
except per share data)
2011
Reconciliation of Non-GAAP financial measures:
Net income
139.3
$
After-tax net capital losses
(4.5)
Net income excluding after-tax net capital losses
143.8
$
Net capital losses
(6.9)
$
Tax benefit on net capital losses
(2.4)
After-tax net capital losses
(4.5)
$
Diluted earnings per common share:
Net income
3.09
$
After-tax net capital losses
(0.10)
Net income excluding after-tax net capital losses
3.19
$
Share data:
Basic weighted-average
44,876,650
Diluted weighted-average
45,016,070
At period end
44,268,859
Shareholders' equity
2,010.5
$
Accumulated other comprehensive income
235.1
Shareholders' equity excluding accumulated other
comprehensive income
1,775.4
$
Net income return on average equity
7.1%
Net income return on average equity
(excluding after-tax net capital losses and
accumulated other comprehensive income)
8.2
Book value per common share:
Including accumulated other comprehensive income
45.42
$
Accumulated other comprehensive income
5.32
Excluding accumulated other comprehensive income
40.10
$ |