Attached files
| file | filename |
|---|---|
| 8-K - SUNOCO LOGISTICS PARTNERS LP--FORM 8-K - Energy Transfer Operating, L.P. | d290216d8k.htm |
 Fourth Quarter 2011
Earnings Conference Call
January 26, 2012
Sunoco Logistics Partners L.P.
Exhibit 99.1 |
 Forward-Looking Statements
2
You should review this slide presentation in conjunction with the fourth
quarter 2011 earnings conference call for Sunoco Logistics
Partners L.P., held on January 26 at 4:30 p.m. ET. You may listen to
free) 888-790-3592. International callers should dial
517-308-9379. Please enter Conference ID “Sunoco
Logistics.” Audio replays of the conference call will be
available for two weeks after the conference call beginning
approximately two hours following the completion of the call. To access the replay, dial 888-282-
0036. International callers should dial
203-369-3022. During the
call, those statements we make that are not historical facts are forward-looking statements.
These forward-looking statements are not guarantees of future
performance. Although we believe the assumptions underlying these
statements are reasonable, investors are cautioned that such forward-looking
statements involve risks and uncertainties that may affect our business
and cause actual results to differ materially from those discussed
during the conference call. Such risks and uncertainties include economic,
business, competitive and/or regulatory factors affecting our business,
as well as uncertainties related to the outcomes of pending or
future litigation. Sunoco Logistics Partners L.P. has included in its Annual Report
on Form 10-K for the year ended December 31, 2010, and in its
subsequent SEC filings, cautionary language identifying important
factors (though not necessarily all such factors) that could cause future outcomes to
differ materially from those set forth in the forward-looking
statements. For more information about these any obligation to update or alter these forward-looking statements,
whether as a result of new information, future events or
otherwise. This presentation includes certain non-GAAP financial measures
intended to supplement, not substitute for, comparable GAAP
measures. Reconciliations of non-GAAP financial measures to GAAP
financial measures are provided in the slides at the end of the
presentation. You should consider carefully the comparable
GAAP measures and the reconciliations to those measures provided in this presentation.
the
audio
portion
of
the
conference
call
on
our
website
at
www.sunocologistics.com
or
by
dialing
(USA
toll-
factors,
see
our
SEC
filings,
available
on
our
website
at
www.sunocologistics.com.
We
expressly
disclaim |
 Highlights
Record quarterly performance:
•
$165 million Adjusted EBITDA
•
$110 million Distributable Cash Flow (DCF)
Record full year performance:
•
$544 million Adjusted EBITDA
•
$388 million Distributable Cash Flow
•
$665 million of Expansion Capital Spending
3
Note: Fourth quarter and full year Adjusted EBITDA and DCF
include an $11million charge for regulatory obligations
recognized in
connection with the Partnership’s impairment assessment of certain assets affected by Sunoco, Inc.’s
announcement to exit
its refining operations |
 Highlights
Grew ratable business 14% year over year
Completed
a
three-for-one
unit
split
(1)
on
December
2
nd
Increased
distribution
for
27
th
consecutive
quarter
2012 Guidance:
•
Increase the cash distribution by 7 %
•
Approximately $300 million of organic expansion capital
•
Approximately $50 million of maintenance capital
(1)
All unit and per unit information presented herein is on a
post-split basis. 4 |
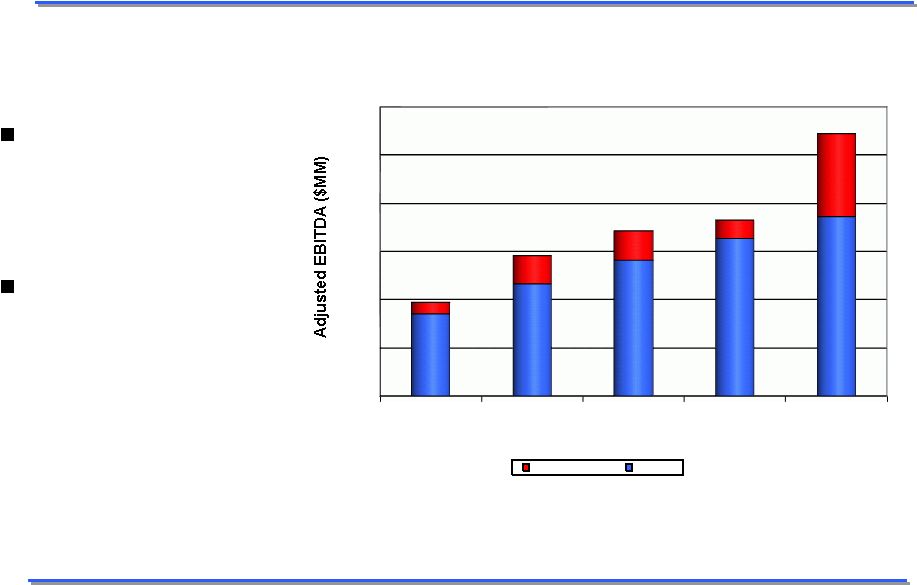 Segment EBITDA:
Segment Change 2007-2011YTD Adjusted EBITDA: Ratable and Market
Related Maximize asset base by
taking advantage of
market opportunities
Distributions based on
ratable cash
•
Market related cash
flow increases
coverage ratio
193
291
343
366
544
0
100
200
300
400
500
600
2007
2008
2009
2010
2011
Year
Market Related
Ratable
5 |
 Record Expansion Capital Growth
2011 expansion capital of $665 million included record organic
and acquisition growth.
(1)
Includes inventory.
(amounts in millions)
Full Year Ended
December 31,
2011
Calculation of Expansion Capital:
Organic Expansion Capital
171
$
Major Acquisitions
(1)
494
Total Expansion Capital
665
$
6
|
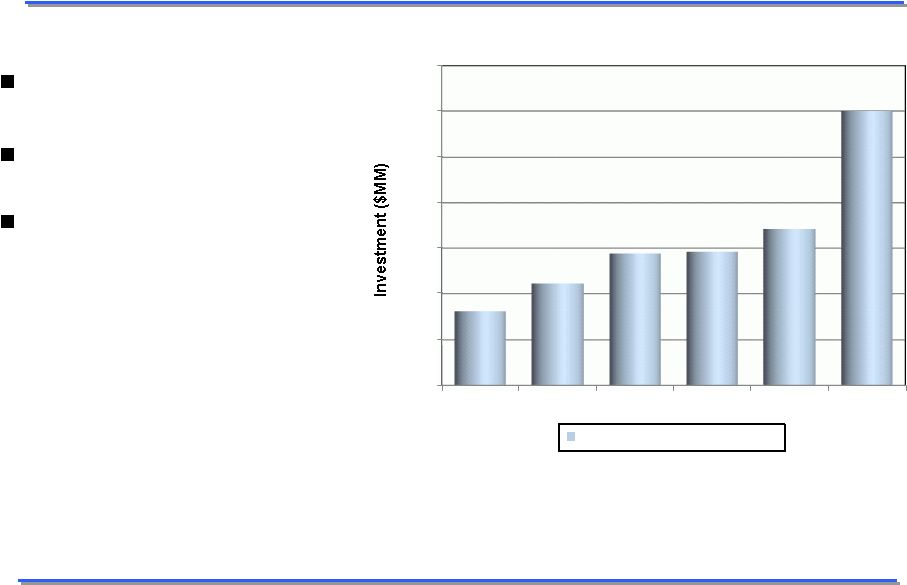 Organic Expansion Capital
7
Optimize current asset base
Invest in organic extensions
•
Butane blending
•
Nederland
•
Eagle Point
•
Mariner West
•
West Texas Crude Expansion
2012 Organic investment
projected to be approximately
$300 million including:
0
50
100
150
200
250
300
350
2007
2008
2009
2010
2011
2012P
Organic Expansion Capital |
 2011 Acquisitions
Texon Crude Business w/exposure to shales in:
Bakken, Granite Wash, Permian & Eagleford
Eagle Point Tank Farm
Inland Pipeline (84% interest)
East Boston Products Terminal
8 |
 Q4 2011 Financial Highlights
(amounts in millions)
9
Three Months Ended
Full Year Ended
December 31,
December 31,
2011
2010
2011
2010
Sales and other operating revenue
3,376
$
2,223
$
10,905
$
7,808
$
Other income
4
5
13
30
Total revenues
3,380
2,228
10,918
7,838
Cost of products sold and operating expenses
3,178
2,103
10,264
7,398
Depreciation and amortization
25
19
86
64
Impairment charge and related matters
42
3
42
3
Selling, general and administrative expenses
23
20
90
72
Total costs and expenses
3,268
2,145
10,482
7,537
Operating income
112
83
436
301
Interest cost and debt expense
28
21
96
78
Capitalized interest
(2)
(2)
(7)
(5)
Gain on investments in affiliates
-
-
-
128
Income before provision for income taxes
86
64
347
356
Provision for income taxes
7
4
25
8
Net Income
79
60
$
322
348
$
Net income attributable to noncontrolling
interests
3
1
9
2
Net Income attributable to Sunoco Logistics
Partners L.P.
76
$
59
$
313
$
346
$
|
 Q4 2011 Financial Highlights
(amounts in millions, except per unit amounts)
10
Three Months Ended
Full Year Ended
December 31,
December 31,
2011
2010
2011
2010
Calculation of Limited Partners' interest:
Net Income attributable to Sunoco Logistics Partners L.P.
76
$
59
$
313
$
346
$
Less: General Partner's interest
(14)
(12)
(54)
(48)
Limited Partners' interest in Net Income
62
$
47
$
259
$
298
$
Net Income per Limited Partner unit:
Basic
0.60
$
0.47
$
2.56
$
3.13
$
Diluted
0.60
$
0.47
$
2.54
$
3.11
$
Weighted Average Limited Partners' units outstanding:
Basic
103.3
99.2
101.3
95.2
Diluted
103.8
99.7
101.8
95.7
(1)
Amounts reflect the three-for-one unit split in the fourth
quarter 2011. (1)
(1) |
 Refined Products Pipelines
(financial amounts in millions)
11
Three Months Ended
Full Year Ended
December 31,
December 31,
2011
2010
2011
2010
Financial Highlights
Sales and other operating revenue
37
$
29
$
130
$
120
$
Operating income
9
$
10
$
33
$
44
$
Depreciation and amortization expense
4
$
3
$
17
$
15
$
Adjusted EBITDA
(1)
12
$
13
$
49
$
59
$
Operating Highlights
(2)(3)
Pipeline throughput (thousands of bpd)
599
442
522
468
Pipeline revenue per barrel (cents)
67.5
71.7
68.3
70.0
(1)
(2)
(3)
Amounts exclude earnings attributable to noncontrolling interests.
Excludes amounts attributable to equity interests which are not
consolidated. In May 2011, the Partnership acquired a controlling
financial interest in the Inland refined products pipeline. As a result of this acquisition, the Partnership
accounted for this entity as a consolidated subsidiary from the
acquisition date. Volumes for the twelve months ended December 31, 2011 of 88 thousand bpd and
the related revenue per barrel, have been included in the consolidated
totals. From the date of acquisition, this pipeline had actual throughput of approximately
140
thousand
bpd
for
the
twelve
months
ended
December
31,
2011. |
 Terminal Facilities
(financial amounts in millions)
12
Three Months Ended
Full Year Ended
December 31,
December 31,
2011
2010
2011
2010
Financial Highlights
Sales and other operating revenue
156
$
99
$
435
$
287
$
Operating income
(11)
$
21
$
85
$
95
$
Depreciation and amortization expense
10
$
8
$
34
$
26
$
Adjusted EBITDA
(1)
30
$
32
$
150
$
124
$
Operating Highlights
Terminal throughput (thousands of bpd):
(2)
Refined products terminals
514
502
492
488
Nederland terminal
692
724
757
729
Refinery terminals
505
434
443
465
(1)
(2)
Amounts
include
an
$11
million
charge
for
regulatory
obligations
recognized
in
the
fourth
quarter
2011
in
connection
with
the
Partnership's
impairment
assessment
of
certain
assets
affected
by
Sunoco's
announcement
to
exit
its
refining
operations.
In
July
2011
and
August
2011,
the
Partnership
acquired
the
Eagle
Point
tank
farm
and
a
refined
products
terminal
located
in
East
Boston
Massachusetts,
respectively.
Volumes
for
these
acquisitions
are
included
from
their
acquisition
dates. |
 Crude Oil Pipelines
(financial amounts in millions)
13
Three Months Ended
Full Year Ended
December 31,
December 31,
2011
2010
2011
2010
Financial Highlights
Sales and other operating revenue
86
$
76
$
319
$
221
$
Operating income
52
$
36
$
181
$
126
$
Depreciation and amortization expense
6
$
7
$
25
$
21
$
Adjusted EBITDA
(1)
56
$
42
$
198
$
145
$
Operating Highlights
(2)(3)
Pipeline throughput (thousands of bpd)
1,577
1,592
1,587
1,183
Pipeline revenue per barrel (cents)
58.9
50.9
55.0
50.7
(1)
(2)
(3)
Amounts exclude earnings attributable to noncontrolling interests.
In July 2010, the Partnership acquired additional interests in
the Mid-Valley and West Texas Gulf crude oil pipelines, which previously
had been recorded as
equity investments. The Partnership obtained a controlling
financial interest as a result of these acquisitions and began accounting for these entities as
consolidated subsidiaries from their respective acquisition
dates. Volumes and the related revenues for the twelve months ended
December 31, 2010 of 278
thousand bpd have been included in the crude oil pipeline throughput
and revenue per barrel. From the date of acquisition, these pipelines had actual throughput
of approximately 696 thousand bpd for the three and twelve months ended
December 31, 2010. The amounts presented for the three and twelve month periods
ended December 31, 2011 include amounts attributable to these systems
for the entire period. Excludes amounts attributable to equity
interests which are not consolidated. |
 Crude Oil Acquisition and Marketing
(financial amounts in millions)
14
Three Months Ended
Full Year Ended
December 31,
December 31,
2011
2010
2011
2010
Financial Highlights
Sales and other operating revenue
3,135
$
2,048
$
10,163
$
7,282
$
Operating income
62
$
16
$
137
$
36
$
Depreciation and amortization expense
5
$
1
$
10
$
2
$
Adjusted EBITDA
67
$
17
$
147
$
38
$
Operating Highlights
(1)
Crude oil purchases (thousands of bpd)
(2)
690
606
663
638
Gross margin per barrel purchased (cents)
(2)(3)
103.4
35.6
61.9
20.0
Average crude oil price (per barrel)
$94.02
$85.18
$95.14
$79.55
(1)
(2)
(3)
Represents total segment sales and other operating revenue minus
cost of products sold and operating expenses and depreciation and
amortization divided by total crude purchases.
The Crude Oil Acquisition and Marketing segment gathers, purchases,
markets and sells crude oil principally in Oklahoma and Texas. The segment consists of
approximately 140 crude oil transport trucks; and approximately 110
crude oil truck unloading facilities. Includes results from the
crude oil acquisition and marketing business acquired from Texon L.P. in August 2011 from the acquisition date. |
 Q4 2011 Financial Highlights
(amounts in millions)
15
Three Months Ended
Full Year Ended
December 31,
December 31,
2011
2010
2011
2010
Capital Expenditure Data:
Maintenance capital expenditures
22
$
12
$
42
$
37
$
Expansion capital expenditures
69
58
171
137
Major Acquisitions
-
-
494
252
Total
91
$
70
$
707
$
426
$
December 31,
December 31,
2011
2010
Balance Sheet Data (at period end):
Cash and cash equivalents
5
$
2
$
Total debt
(2)(3)
1,698
$
1,229
$
Equity:
Sunoco Logistics Partners L.P. Equity
1,096
$
965
$
Noncontrolling interests
98
77
Total Equity
1,194
$
1,042
$
(1)
(2)
(3)
Total debt at December 31, 2010 includes the $100 million promissory
note to Sunoco, Inc. Includes July 2011 acquisition of Eagle
Point tank farm from Sunoco for $100 million, consisting of: Class A (deferred distribution)
units with a fair value of $98 million and $2 million in cash. This
related party transaction was recorded at Sunoco’s carrying value on
$22 million under generally accepted accounting principles.
As of December 31, 2011, the Partnership had available borrowing
capacity of $550 million under its revolving credit facilities.
(1) |
 Non-GAAP Financial Measures
(amounts in millions)
(1)
Management of the Partnership believes Adjusted EBITDA and
distributable cash flow information enhances an investor's understanding of a business’
ability to generate
cash for payment of distributions and other purposes. Adjusted
EBITDA and distributable cash flow do not represent and should not be considered an alternative to net
income or cash flows from operating activities as determined under
United States generally accepted accounting principles (GAAP)
and may not be comparable to other
similarly titled measures of other businesses.
(2)
Amounts
exclude
earnings
attributable
to
noncontrolling
interests
and
include
an
$11
million
charge
for
regulatory
obligations
recognized
in
the
fourth
quarter
2011
in
connection with the Partnership's impairment assessment of certain
assets affected by Sunoco's announcement to exit its refining
operations.
16
Three Months Ended
Full Year Ended
December 31,
December 31,
2011
2010
2011
2010
Add: Interest expense, net
26
19
89
73
Add: Depreciation and amortization expense
25
19
86
64
Add: Impairment charge
31
3
31
3
Add: Provision for income taxes
7
4
25
8
Less: Gain on investments in affiliates
-
-
-
(128)
Adjusted EBITDA
(1)(2)
165
104
544
366
Less: Interest expense, net
(26)
(19)
(89)
(73)
Less: Maintenance capital expenditures
(22)
(12)
(42)
(37)
Less: Provision for income taxes
(7)
(4)
(25)
(8)
Distributable cash flow
(1)
110
$
69
$
388
$
248
$
313
$
346
$
59
$
76
$
Net Income attributable to Sunoco Logistics
Partners L.P. |