Attached files
| file | filename |
|---|---|
| 8-K - FORM 8-K - NETFLIX INC | d290258d8k.htm |
Exhibit 99.1
January 25th, 2012
Dear Fellow Shareholders,
The global opportunity for streaming TV shows and movies becomes more compelling every year with the rise of smart TVs and faster broadband. With our streaming growth, Netflix is leading the development of Internet TV. Members enjoyed over 2 billion hours of Netflix streaming video in Q4, which is approximately 30 hours per member per month on average. Every quarter we are improving our content selection, we are improving our user experience, we are learning more about social, and we are increasing our brand awareness in the 47 countries where we offer our Internet TV network.
| (in millions, except per share data) | Q1 ‘10 | Q2 ‘10 | Q3 ‘10 | Q4 ‘10 | Q1 ‘11 | Q2 ‘11 | Q3 ‘11 | Q4 ‘11 | ||||||||||||||||||||||||
| Domestic Streaming: |
||||||||||||||||||||||||||||||||
| Net Subscription Additions |
— | — | — | — | — | — | — | 0.22 | ||||||||||||||||||||||||
| Total Subscriptions |
— | — | — | — | — | — | 21.45 | 21.67 | ||||||||||||||||||||||||
| Revenue |
— | — | — | — | — | — | — | $ | 476 | |||||||||||||||||||||||
| Contribution Profit |
— | — | — | — | — | — | — | $ | 52 | |||||||||||||||||||||||
| Contribution Margin |
— | — | — | — | — | — | — | 10.9 | % | |||||||||||||||||||||||
| International Streaming: |
||||||||||||||||||||||||||||||||
| Net Subscription Additions |
— | — | 0.13 | 0.38 | 0.29 | 0.16 | 0.51 | 0.38 | ||||||||||||||||||||||||
| Total Subscriptions |
— | — | 0.13 | 0.51 | 0.80 | 0.97 | 1.48 | 1.86 | ||||||||||||||||||||||||
| Revenue |
— | — | $ | — | $ | 4 | $ | 12 | $ | 19 | $ | 23 | $ | 29 | ||||||||||||||||||
| Contribution Profit (Loss) |
— | — | $ | (3 | ) | $ | (9 | ) | $ | (11 | ) | $ | (9 | ) | $ | (23 | ) | $ | (60 | ) | ||||||||||||
| Domestic DVD: |
||||||||||||||||||||||||||||||||
| Net Subscription Additions |
— | — | — | — | — | — | — | (2.76 | ) | |||||||||||||||||||||||
| Total Subscriptions |
— | — | — | — | — | — | 13.93 | 11.17 | ||||||||||||||||||||||||
| Revenue |
— | — | — | — | — | — | — | $ | 370 | |||||||||||||||||||||||
| Contribution Profit |
— | — | — | — | — | — | — | $ | 194 | |||||||||||||||||||||||
| Contribution Margin |
— | — | — | — | — | — | — | 52.4 | % | |||||||||||||||||||||||
| Total Domestic (Streaming + DVD, for historical comparison): |
| |||||||||||||||||||||||||||||||
| Net Unique U.S. Subscriber Additions |
1.70 | 1.03 | 1.80 | 2.70 | 3.30 | 1.80 | (0.81 | ) | 0.61 | |||||||||||||||||||||||
| Total Unique U.S. Subscribers |
13.97 | 15.00 | 16.80 | 19.50 | 22.80 | 24.59 | 23.79 | 24.40 | ||||||||||||||||||||||||
| Y/Y Change |
35 | % | 42 | % | 51 | % | 59 | % | 63 | % | 64 | % | 42 | % | 25 | % | ||||||||||||||||
| Revenue |
$ | 494 | $ | 520 | $ | 553 | $ | 592 | $ | 706 | $ | 770 | $ | 799 | $ | 847 | ||||||||||||||||
| Y/Y Change |
25 | % | 27 | % | 31 | % | 33 | % | 43 | % | 48 | % | 44 | % | 43 | % | ||||||||||||||||
| Contribution Profit |
$ | 111 | $ | 130 | $ | 130 | $ | 152 | $ | 187 | $ | 213 | $ | 219 | $ | 246 | ||||||||||||||||
| Y/Y Change |
53 | % | 40 | % | 46 | % | 55 | % | 68 | % | 64 | % | 68 | % | 62 | % | ||||||||||||||||
| Global: |
||||||||||||||||||||||||||||||||
| Revenue |
$ | 494 | $ | 520 | $ | 553 | $ | 596 | $ | 719 | $ | 789 | $ | 822 | $ | 876 | ||||||||||||||||
| Y/Y Change |
25 | % | 27 | % | 31 | % | 34 | % | 46 | % | 52 | % | 49 | % | 47 | % | ||||||||||||||||
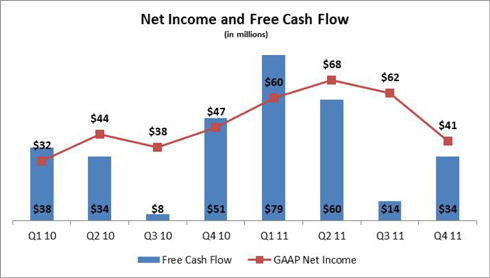
| Net Income |
$ | 32 | $ | 44 | $ | 38 | $ | 47 | $ | 60 | $ | 68 | $ | 62 | $ | 41 | ||||||||||||||||
| Y/Y Change |
45 | % | 38 | % | 27 | % | 52 | % | 88 | % | 55 | % | 63 | % | -13 | % | ||||||||||||||||
| EPS |
$ | 0.59 | $ | 0.80 | $ | 0.70 | $ | 0.87 | $ | 1.11 | $ | 1.26 | $ | 1.16 | $ | 0.73 | ||||||||||||||||
| Y/Y Change |
59 | % | 48 | % | 35 | % | 55 | % | 88 | % | 58 | % | 66 | % | -16 | % | ||||||||||||||||
| Free Cash Flow |
$ | 38 | $ | 34 | $ | 8 | $ | 51 | $ | 79 | $ | 60 | $ | 14 | $ | 34 | ||||||||||||||||
| Buyback |
$ | 108 | $ | 45 | $ | 57 | $ | — | $ | 109 | $ | 51 | $ | 40 | $ | — | ||||||||||||||||
| Shares (FD) |
54.8 | 54.3 | 53.9 | 54.2 | 54.2 | 53.9 | 53.9 | 55.4 | ||||||||||||||||||||||||
|
|
1 |

Domestic Streaming
Q4 Results
Domestically, we grew faster than expected in streaming members (up 220k to 21.67 million) in Q4. October and November member trends were consistent with our expectations from our last earnings call, while in December, we not only returned to strongly positive net streaming additions (aided by strong seasonal gross adds) but exceeded our forecast. In particular, we saw fewer streaming cancellations, as well as lower migration to DVD-only plans, resulting in the outperformance for streaming members.
The domestic streaming segment delivered $52 million of contribution profit, or 10.9% contribution margin. We exceeded our domestic streaming contribution margin target of around 8% due to higher than expected streaming members and revenue, as well as some under-spending in both content and marketing.
Outlook
We are encouraged by the strength in acquisition that we are seeing, coupled with continued improvements in retention among our domestic streaming members. For Q1 to date, our domestic net additions for streaming are tracking close to our net additions in Q1 2010 of 1.7 million net additions. Given this trend, we are comfortable with our ability to continue to expand our domestic streaming contribution margin.
Since we significantly out-performed our 8% domestic streaming contribution margin target in Q4, we are increasing our Q1 contribution margin target to approximately 11%. Then, consistent with our previous guidance, we expect to increase the domestic streaming contribution margin throughout the year to deliver a trend of margin expansion that averages 100 bps per quarter. We will continue to increase our content spending sequentially every quarter, but not at the year-over-year rate expected in Q1 (more than doubling).
Domestic Content Library
As a result of the significant investments in our streaming library throughout 2011, our current domestic offering is dramatically improved from a year ago. We have a material increase in the quantity and quality of the content to show for our increased spending – most notably across on-air TV, kids TV and library TV. While our 2012 domestic streaming content commitments are already substantially in place, that doesn’t mean our offering will be static in the coming months. The relationships we’ve established with all major producers of film and TV in the U.S., including multiple output arrangements, ensure a steady flow of new titles to the service.
The remaining Starz titles will come off our domestic service at the end of February. Since the Sony output came off in Q2 2011, the remaining Starz content is primarily the Encore catalog titles and the 15 current Disney Pay 1 titles. For the Encore catalog titles, we have plenty of substitutes and in many cases
|
|
2 |
have already directly relicensed from the studios some of the top performing Encore titles. So, the only significant loss is the current 15 Disney output titles, such as “Toy Story 3” and “Tangled,” which currently constitute about 2% of our domestic viewing.
Throughout 2012, Paramount will provide us (through our EPIX deal) with such successful family fare as “The Adventures of Tin Tin,” “Rango” and “Hugo,” which, with 11 Oscar nominations including Best Picture, is one of the most acclaimed movies of the year. And in 2013, when our DreamWorks Animation output deal comes online, we’ll strengthen our long-term, stable flow of great animated family film titles.
More generally, the Pay 1 titles from our other output deals will increase in the coming months as EPIX, Relativity, Film District, Open Road and others provide Netflix with films that have already tallied more than $1.3 billion in domestic box office, including “Thor,” “Transformers 3,” “Captain America,” “Super 8,” “The Immortals” and “Footloose.”
Last quarter, we explained that the evolution of video streaming services to a large extent reflects the legacy of television networks: namely, historical reliance upon exclusive content as a differentiator. Consistent with this practice, we are increasingly licensing content on an exclusive basis.
Domestic Streaming Competition
We compete for viewing time with a very wide range of providers. As other viewing solutions for TV shows and movies get better, we will face increased competition and potential decreased viewing share. On the one hand, if our service improves faster than others, we will increase our viewing share.
One class of competitors is the other over-the-top pure plays such as Hulu Plus and Amazon Prime. We expect Amazon to continue to offer their video service as a free extra with Prime domestically but also to brand their video subscription offering as a standalone service at a price less than ours. Both Amazon and Hulu Plus’s content is a fraction of our content, and we believe their respective total viewing hours are each less than 10% of ours. In the case of Hulu Plus, subscribers have to pay for the service ($7.99) and still watch commercials (unlike, commercial-free Netflix). Even if Hulu could afford our level of content spend, at the same price consumers would prefer commercial-free Netflix over commercial-interrupted Hulu Plus.
As we’ve often said, we see the biggest long term threat as TV Everywhere, and in particular, HBO GO, the leading implementation of TV Everywhere to date. HBO has some great content, particularly their original series, but today for most people it is locked behind a linear interface, or at best, behind a DVR interface and in all cases tethered to a linear subscription plan. As HBO GO grows and becomes the primary way that consumers experience HBO, it will become a much more effective competitor for viewing time. Similarly, Showtime’s TV Everywhere application is very impressive and just starting to gain traction. Every major network is investing in their Internet application, on tablets, smart TVs, phones, game consoles, and laptops. Pricing is simple: the consumer just authenticates with their MVPD provider. Over the next few years, UIs will evolve in astounding ways, such as allowing viewers to
|
|
3 |
watch eight simultaneous games on ESPN, color coding where the best action is in a given moment or allowing Olympics fans the ability to control their own slow-motion replays. A decade from now, choosing a linear feed from a broadcast grid of 200 channels will seem like using a rotary dial telephone.
Just as broadcast networks have substantially transformed themselves into cable channels over the last twenty years, both broadcast and cable networks will effectively also become Internet networks like Netflix. As a pure-play we have many advantages, however, just as cable did over broadcast. We are 100% on-demand and highly-personalized. Our brand is broad, rather than niche, so we can combine the benefits of multiple channels into one service. Additionally, our Internet culture enables us to create and drive social TV, recommendations TV, and other Internet innovations faster than our cable and broadcast network competitors.
As cable networks developed, they were able to both compete with broadcast networks, and to bolster broadcast networks economics through syndication. Today it is accepted practice for networks to license parts of their content to other networks, if they get paid well enough. That is the world of content licensing in which we live. In that sense, we are just another network competing for viewing time with, and licensing content from, other networks.
VPPA Update
In 46 of the 47 countries we serve, members can currently enjoy automatic seamless video sharing between friends on Facebook, in the same manner that they can choose to enjoy automatic seamless sharing between friends of their music listening and news story viewing.
As we’ve highlighted before, under a U.S. law enacted in the 1980s, companies that rent or sell physical video tapes or DVDs are subject to particular privacy rules. This law, the Video Privacy Protection Act, or VPPA, creates confusion over our ability to allow U.S. members to choose to automatically share their viewing history with their friends. A broad bipartisan group of lawmakers from the House recognized the benefits of modernizing and simplifying this law and passed H.R. 2471, an amendment to the VPPA that clarifies the ability of consumers to elect to share their viewing history on an ongoing basis if they so wish. Now this proposed amendment is with the Senate, and they have scheduled a hearing on the VPPA for next week.
International Streaming
In our 5th quarter since launching international operations, we reached 1.9 million international streaming members in Q4.
Canada
In Canada in Q4, we enhanced our offering with fresh movies and TV shows from existing output deals, as well as new deals. For TV, we’ve significantly improved our television catalog with new content from FOX, Sony, and AMC and for film, we have continued to add Pay 1 film titles such as “Black Swan,” “True Grit,” “The Chronicles of Narnia” and “Rango,” as well as great catalog titles like “Pulp Fiction.” The addition of lots of compelling new shows and movies both drove increased hours viewed per member and member acquisition during the quarter.
|
|
4 |
The market opportunity in Canada is exciting enough that we continue to invest in the content library, meaning that we’ll run at roughly break even for two quarters, and we expect to return to a positive contribution profit starting in Q3 of this year, two years after our initial launch. Our plan after that is to grow our contribution margin as we continue to grow our membership.
Latin America
In Latin America, we ended the year with about the same number of members as we had in Canada at the same time post-launch last year. Latin America has about 4x more broadband households than Canada; so, our focus is on capturing a larger portion of the market opportunity.
Latin America presents unique challenges relative to our other markets; namely, low device penetration, high piracy, varying preferences for subtitles, and relatively low credit card usage for ecommerce. We are quickly learning what content works best in the region, and are adjusting our content library accordingly. We have already nearly doubled our content library since launch, adding considerably more U.S. and local movies and TV. We are rapidly increasing the accessibility of our service by adding more subtitles in both Spanish and Portuguese (in addition to dubs), as well as expanding the range of Netflix enabled devices in the region. Finally, as expected upon launch, we’ve found that processing ecommerce consumer payments is quite challenging as compared with North America and Europe. To overcome this challenge, we are working with our local payment partners to optimize our systems, exploring adding new payment methods and testing various trial campaigns to improve conversion.
We are committed to the region over the long-term, encouraged by the prospect of building a large, profitable business over time, just as DIRECTV has done.
UK and Ireland
Our UK and Ireland launch at the beginning of the month was very successful, and we’re seeing faster member growth than we did when we launched Canada. As our membership in the UK and Ireland grows, we’ll be able to invest more and more in content. We have a great selection of new films from Lionsgate and others, and will have on our service such highly-anticipated films as “Hunger Games” and “The Hobbit”, in addition to catalog movies from 5 of the 6 major studios. On the TV side, we have current Hollywood TV from the major networks and three key local channels.
In the UK and Ireland we launched with our best Facebook implementation to date. The positive social effects get stronger as the number of connected members rises, so we are working hard on making connecting very easy, and the connected experience very enjoyable.
Just as in the U.S. where our primary long-term competition will likely be TV Everywhere, in the UK our long-term competition will likely be Sky Go offering Sky Movies and Sky Atlantic on-demand. (Sky Atlantic is
|
|
5 |
mostly HBO Originals content, and Sky Movies is one channel with the Pay 1 movie output from all six major U.S. movie studios). We believe we will compete very effectively against Sky Go, given our advantages of being an unbundled low-priced offering with broad content that is purely on-demand, and personalized. Over the coming years, we hope to be able to grow large enough to outbid Sky for one or more major studio output deals, as we did this year for MGM.
Finally, in the UK, but not in Ireland, we also have the “free” BBC iPlayer and Amazon’s LOVEFiLM as competitors for viewing time. LOVEFiLM is primarily a DVD-by-mail service with 2 million DVD subscribers in the UK, Germany and the Nordics. iPlayer is an excellent over the top last few days catch-up service, free for UK residents.
Total International Results & Outlook
In Q4, international revenue of $29 million was in-line with expectations, while contribution loss of $60 million was slightly better due to lower content expenses.
In Q1, the combined investments in both Latin America and the UK and Ireland will result in a total international contribution loss of between $108 and $118 million. In future quarters, we intend to continue to increase our investment in the content libraries in each market, just as we have done in Canada since launch. Doing so improves the consumer experience, builds strong word of mouth and positive brand awareness, and drives additional acquisition, all elements of a strong foundation for long-term success. As we improve the service, we grow membership and thus we expect the quarterly international losses to moderate slightly.
DVD
Q4 Results
As expected, DVD members declined this quarter to 11.2 million due to the continued impact of the price changes, as hybrid members continued to predominantly choose a streaming-only plan over a higher priced hybrid plan. Both hybrid cancellation and migration to streaming-only plans ebbed through the quarter. We added over 600k unique domestic members in Q4, ending the quarter with 24.4 million.
The domestic DVD segment delivered $194 million of contribution profit in Q4, representing a 52.4% contribution margin. The slight out-performance relative to our guidance was predominantly attributable to a higher ASP than forecasted due to more DVD members staying on 2+ disc plans.
Outlook
While DVD members declined sharply over the last two quarters, the weekly rate of DVD cancellations has subsided from peak levels in September. Looking out across 2012, we expect continued attrition among our DVD members. Specifically, in Q1, we expect net losses of DVD members of approximately 1.5 million, with the sequential decline moderating in future quarters.
|
|
6 |
The DVD business model is predominantly variable cost based. So, as the size of the market opportunity continues to decline, we expect healthy contribution profit margins to be maintained. Meanwhile, for customers with DVD needs (namely, completeness, simplicity, and with limited broadband), our product is priced 20% lower than our nearest competitor, and our service remains better and faster.
Earlier this month, Warner Home Entertainment announced it was moving the availability date for rental DVDs to kiosk and all subscription by mail services to 56 days post the release date for retail sale. This followed its move to impose a 28 day delay on store based rentals. While we didn’t like the new release date schemes, we decided that it was better for our members for us to maintain a direct relationship with Warner under the selling terms it has imposed. The alternative was to secure discs through multiple retail and third party channels, which can be unreliable and may have added to the time it takes to procure enough DVDs to meet member demand. We suspect there will be increasingly differentiated dates as the studios re-configure their shrinking packaged goods businesses.
Product Improvement
Constantly improving our service is key to satisfying current members and attracting new ones. The better we make the Netflix experience, the more hours are watched, translating into increased retention and strong word of mouth referral. In Q4, we announced several product enhancements to that end.
We improved the Netflix experience on the Xbox 360, launching a user interface (UI) that is compatible with Kinect, allowing members to navigate the Netflix UI with voice and gesture. The new Xbox app makes substantial improvements in the streaming experience, reducing the amount of re-buffering, accelerating start-up, and delivering higher quality streams. We introduced a new UI for the iPad, making it easier and quicker for members to find what to watch, and we expanded our presence on tablets as a launch partner of both Amazon’s Kindle Fire and the Barnes & Noble NOOK Tablet.
Following our well-received launch of the “Just for Kids” feature in July, we rolled out the feature to the Nintendo Wii. Additionally, we made updates to the Netflix app for Android which improved the user experience and increased the breadth of Android devices supported. Finally, we had several personalization algorithm breakthroughs for how we sort titles in each category, making it easier for our members to find movies and TV shows they’ll love.
Original Programming
Our first Netflix original series, “Lilyhammer,” a fish-out-of-water story set in Norway and starring “The Sopranos” mainstay and E Street Band guitarist Steven Van Zandt, will debut on our service on February 6th in the U.S., Canada and Latin America. All eight first season episodes of “Lilyhammer” will be available at once, so Netflix members can enjoy the first season as quickly as they like, instead of having to wait a week for each new episode as they would with linear programming.
|
|
7 |
More Netflix original series are planned for 2012 and 2013, including House of Cards (Q4 2012), and an exclusive and original fourth season of Arrested Development (2013). Our spending on original programming is intended to allow us to test a new licensing model using a small portion of our content budget. If “Lilyhammer” or “House of Cards” is popular enough on Netflix so that the fees we’ve paid for each are in-line with that of other equally-popular content on Netflix during the same time period, we’ll consider them a success.
Global Profitability: Q4 Results & Outlook
Q4 net income of $41 million, and $0.73 per share, exceeded our expectations, predominantly driven by the out-performance of domestic streaming contribution profit discussed above.
In general, member growth or contraction in a quarter effects revenue the following quarter more than the quarter of the change. The sharp decline in DVD members in Q4 means that in Q1 our DVD revenue will decline by about as much as our streaming revenue will increase, resulting in approximately flat sequential revenue in Q1.
Due to the increased investment in international, in particular the launch of the UK, our current outlook is for a consolidated loss of between $9 and $27 million in Q1. While contribution profit from domestic streaming will grow sequentially, it will not be sufficient to offset the sequential decline in DVD profits (~$50 million), and the sequential increase in our international losses (~$50 million), as well as cover our global G&A and Technology & Development costs.
As a result, we expect modest quarterly losses, as well as losses for the calendar year. Until we achieve our goal of returning to global profitability, we do not intend to launch additional international markets.
Q4 Free Cash Flow
In Q4, FCF of $34 million slightly trailed net income of $41 million. Significant sources of cash flow in the quarter (relative to net income) were non-cash stock compensation and an increase in accounts payable related to timing of marketing payments. These sources of cash were more than offset by cash payments for content (in excess of the P&L expense), a decline in deferred revenue and an interest payment on our notes.
|
|
8 |
In the quarter, we continued to add to our domestic and international content libraries. For the full year 2011, we added $2.3 billion of streaming content library assets (or, $1.6 billion net of amortization expense) to our balance sheet. Since we have been generally successful in matching payment terms with the expense, the growth in streaming content assets also coincided with an increase in our content related liabilities of $1.5 billion, representing payment obligations under our content licenses not yet due.
As we add original content in the last quarter of this year, we expect payments for originals to weigh on FCF as they typically require more up-front payments than non-original content license payment terms.
Q4 Financing
Our standard practice with regard to managing our capital structure has been to evaluate on an on-going basis the appropriate cash level and capital structure for the business. In Q4, given the pain from our price changes and the impact to our 2012 outlook, this analysis led us to the decision to strengthen our balance sheet by raising $400 million of additional capital from two long-term oriented shareholders. $200 million was raised through the sale of equity (2.86 million shares at $70 per share), and $200 million was raised through the private placement of zero-coupon convertible notes. We have no intentions to spend this additional capital; it is merely a stronger safety-net for an aggressive, fast moving business with a big opportunity.
After the financing, we finished the quarter with $798 million in cash and equivalents.
Metrics evolution
As stated in our January 2011 investor letter, net additions, along with revenue and contribution profit, are our core performance measurements for each of our segments. This is the final letter in which we will provide gross additions, churn and SAC in our domestic results, conforming to how we have been reporting our international streaming results.
Starting this quarter, we will also be providing guidance for paid members, in addition to our traditional guidance for total members. Since paid membership drives revenue and profit, we believe a focus on this metric is most relevant for our financial discussions. We will continue to report free, paid, and total subscribers by segment.
As we evolve our focus from DVD to streaming, we are slightly updating our definition of membership starting with this quarter’s membership guidance. Members who are on payment hold will no longer be counted as members, while members who cancel mid-period will be counted until their service ceases at the end of the period. We estimate the net effect of these changes will be less than 200k fewer domestic streaming members than we would otherwise report in Q1. There is no effect on revenue from this change.
|
|
9 |
CEO Stock Sales
Reed has some 10-year options expiring in Q1, and will be making a one-time sale of those shares as part of a 10b5-1 plan, but is otherwise not selling stock this quarter.
CMO Search
As we announced last week, we’re looking for a CMO who today probably runs marketing at a cable network or a mobile phone network, and has strong global experience. Typically these searches take 4-6 months. In the meantime, our long time executive Jessie Becker is our Interim CMO, and is a candidate for the role also. Leslie Kilgore made huge contributions over the last 12 years to nearly every part of our business, and we’re very happy to have her join our Board of Directors to continue to help Netflix prosper.
Business Outlook
Q1 2012 Guidance
| Domestic Streaming: |
||||
| Total Subscriptions |
22.8 m to 23.6 m | |||
| Paid Subscriptions |
21.5 m to 22.3 m | |||
| Revenue |
$496 m to $511 m | |||
| Contribution Profit |
$50 m to $64 m | |||
| International Streaming |
||||
| Total Subscriptions |
2.5 m to 3.1 m | |||
| Paid Subscriptions |
1.9 m to 2.45 m | |||
| Revenue |
$38 m to $44 m | |||
| Contribution Profit / (Loss) |
($118 m) to ($108 m) | |||
| Domestic DVD: |
||||
| Total Subscriptions |
9.4 m to 10.0 m | |||
| Paid Subscriptions |
9.3 m to 9.9 m | |||
| Revenue |
$308 m to $322 m | |||
| Contribution Profit |
$139 m to $154 m | |||
| Consolidated Global: |
||||
| Net Income |
($27 m) to ($9 m) | |||
| EPS |
($0.49) to ($0.16) | |||
Summary
Our streaming membership is growing in 47 countries and we see an enormous opportunity to build a global Internet TV network of unparalleled reach and consumer delight. We look forward to resuming our global expansion after our return to global profitability.
|
|
10 |
Sincerely,
|
|

| |
| Reed Hastings, CEO |
David Wells, CFO | |
|
|

| |


Conference Call Q&A Session
Netflix management will host a webcast Q&A session at 3:00 p.m. Pacific Time today to answer questions about the Company’s financial results and business outlook. Please email your questions to ir@netflix.com. The company will read the questions aloud on the call and respond to as many questions as possible. For those without access to the Internet the dial-in for the live earnings Q&A session is: (760) 666-3613. After email Q&A, we will also open up the lines to take live follow-up questions.
The live webcast, and the replay, of the earnings Q&A session can be accessed at ir.netflix.com.
| IR Contact: |
PR Contact: | |
| Ellie Mertz |
Steve Swasey | |
| VP, Finance & Investor Relations |
VP, Corporate Communications | |
| 408 540-3977 |
408 540-3947 |
Use of Non-GAAP Measures
This shareholder letter and its attachments include reference to the non-GAAP financial measure of free cash flow. Management believes that free cash flow is an important liquidity metric because it measures, during a given period, the amount of cash generated that is available to repay debt obligations, make investments, repurchase stock and for certain other activities. However, this non-
|
|
11 |
GAAP measure should be considered in addition to, not as a substitute for or superior to, net income, operating income and net cash provided by operating activities, or other financial measures prepared in accordance with GAAP. Reconciliation to the GAAP equivalent of this non-GAAP measure is contained in tabular form on the attached unaudited financial statements.
Forward-Looking Statements
This shareholder letter contains certain forward-looking statements within the meaning of the federal securities laws, including statements regarding our long-term opportunities and improvements to our service; growth trends, including subscriber acquisition, contribution profit and margin as well as content acquisition; international segment performance, including Canadian contribution profit and Latin America challenges as well as content investment; DVD subscriber losses and contribution profit; global profitability; content acquisition, including original programming and specific title availability; competition; free cash flow and usage of cash; our subscriber growth, including total and paid; revenue, and contribution profit (loss) for both domestic (streaming and DVD) and international operations as well as net income and earnings per share for the first quarter of 2012. The forward-looking statements in this letter are subject to risks and uncertainties that could cause actual results and events to differ, including, without limitation: our ability to attract new subscribers and retain existing subscribers; our ability to compete effectively; our ability to build back our brand; the continued availability of content on terms and conditions acceptable to us; maintenance and expansion of device platforms for instant streaming; fluctuations in consumer usage of our service; disruption in service on our website or with third-party computer systems that help us operate our service; competition and widespread consumer adoption of different modes of viewing in-home filmed entertainment. A detailed discussion of these and other risks and uncertainties that could cause actual results and events to differ materially from such forward-looking statements is included in our filings with the Securities and Exchange Commission, including our Annual Report on Form 10-K filed with the Securities and Exchange Commission on February 18, 2011. We undertake no obligation to update forward-looking statements to reflect events or circumstances occurring after the date of this press release.
|
|
12 |
Netflix, Inc.
Consolidated Statements of Operations
(unaudited)
(in thousands, except per share data)
| Three Months Ended | Twelve Months Ended | |||||||||||||||||||
| December
31, 2011 |
September
30, 2011 |
December
31, 2010 |
December
31, 2011 |
December
31, 2010 |
||||||||||||||||
| Revenues |
$ | 875,575 | $ | 821,839 | $ | 595,922 | $ | 3,204,577 | $ | 2,162,625 | ||||||||||
| Cost of revenues: |
||||||||||||||||||||
| Subscription |
512,578 | 471,823 | 336,756 | 1,789,596 | 1,154,109 | |||||||||||||||
| Fulfillment expenses |
62,577 | 64,794 | 54,034 | 250,305 | 203,246 | |||||||||||||||
|
|
|
|
|
|
|
|
|
|
|
|||||||||||
| Total cost of revenues |
575,155 | 536,617 | 390,790 | 2,039,901 | 1,357,355 | |||||||||||||||
|
|
|
|
|
|
|
|
|
|
|
|||||||||||
| Gross profit |
300,420 | 285,222 | 205,132 | 1,164,676 | 805,270 | |||||||||||||||
| Operating expenses: |
||||||||||||||||||||
| Marketing |
114,288 | 89,108 | 62,849 | 402,638 | 293,839 | |||||||||||||||
| Technology and development |
80,783 | 69,480 | 45,959 | 259,033 | 163,329 | |||||||||||||||
| General and administrative |
34,477 | 29,792 | 17,871 | 117,937 | 64,461 | |||||||||||||||
|
|
|
|
|
|
|
|
|
|
|
|||||||||||
| Total operating expenses |
229,548 | 188,380 | 126,679 | 779,608 | 521,629 | |||||||||||||||
|
|
|
|
|
|
|
|
|
|
|
|||||||||||
| Operating income |
70,872 | 96,842 | 78,453 | 385,068 | 283,641 | |||||||||||||||
| Other income (expense): |
||||||||||||||||||||
| Interest expense |
(4,942 | ) | (4,915 | ) | (4,832 | ) | (20,025 | ) | (19,629 | ) | ||||||||||
| Interest and other income (expense) |
(95 | ) | 1,696 | 938 | 3,479 | 3,684 | ||||||||||||||
|
|
|
|
|
|
|
|
|
|
|
|||||||||||
| Income before income taxes |
65,835 | 93,623 | 74,559 | 368,522 | 267,696 | |||||||||||||||
| Provision for income taxes |
25,103 | 31,163 | 27,464 | 136,883 | 106,843 | |||||||||||||||
|
|
|
|
|
|
|
|
|
|
|
|||||||||||
| Net income |
$ | 40,732 | $ | 62,460 | $ | 47,095 | $ | 231,639 | $ | 160,853 | ||||||||||
|
|
|
|
|
|
|
|
|
|
|
|||||||||||
| Net income per share: |
||||||||||||||||||||
| Basic |
$ | 0.76 | $ | 1.19 | $ | 0.90 | $ | 4.38 | $ | 3.06 | ||||||||||
| Diluted |
$ | 0.73 | $ | 1.16 | $ | 0.87 | $ | 4.26 | $ | 2.96 | ||||||||||
| Weighted average common shares outstanding: |
||||||||||||||||||||
| Basic |
53,582 | 52,569 | 52,584 | 52,847 | 52,529 | |||||||||||||||
| Diluted |
55,439 | 53,870 | 54,194 | 54,369 | 54,304 | |||||||||||||||
|
|
13 |
Netflix, Inc.
Consolidated Balance Sheets
(unaudited)
(in thousands, except share and par value data)
| As of | ||||||||
| December
31, 2011 |
December
31, 2010 |
|||||||
| Assets |
||||||||
| Current assets: |
||||||||
| Cash and cash equivalents |
$ | 508,053 | $ | 194,499 | ||||
| Short-term investments |
289,758 | 155,888 | ||||||
| Current content library, net |
919,709 | 181,006 | ||||||
| Prepaid content |
56,007 | 62,217 | ||||||
| Other current assets |
53,843 | 43,621 | ||||||
|
|
|
|
|
|||||
| Total current assets |
1,827,370 | 637,231 | ||||||
| Non-current content library, net |
1,046,934 | 180,973 | ||||||
| Property and equipment, net |
136,353 | 128,570 | ||||||
| Other non-current assets |
55,052 | 35,293 | ||||||
|
|
|
|
|
|||||
| Total assets |
$ | 3,065,709 | $ | 982,067 | ||||
|
|
|
|
|
|||||
| Liabilities and Stockholders’ Equity |
||||||||
| Current liabilities: |
||||||||
| Content accounts payable |
$ | 924,706 | $ | 168,695 | ||||
| Other accounts payable |
87,860 | 54,129 | ||||||
| Accrued expenses |
54,693 | 38,572 | ||||||
| Deferred revenue |
148,796 | 127,183 | ||||||
|
|
|
|
|
|||||
| Total current liabilities |
1,216,055 | 388,579 | ||||||
| Long-term debt |
200,000 | 200,000 | ||||||
| Long-term debt due to related party |
200,000 | — | ||||||
| Non-current content liabilities |
739,628 | 48,179 | ||||||
| Other non-current liabilities |
61,703 | 55,145 | ||||||
|
|
|
|
|
|||||
| Total liabilities |
2,417,386 | 691,903 | ||||||
| Stockholders’ equity: |
||||||||
| Common stock, $0.001 par value; 160,000,000 shares authorized at December 31, 2011 and December 31, 2010; 55,398,615 and 52,781,949 issued and outstanding at December 31, 2011 and December 31, 2010, respectively |
55 | 53 | ||||||
| Additional paid-in capital |
219,119 | 51,622 | ||||||
| Accumulated other comprehensive income, net |
706 | 750 | ||||||
| Retained earnings |
428,443 | 237,739 | ||||||
|
|
|
|
|
|||||
| Total stockholders’ equity |
648,323 | 290,164 | ||||||
|
|
|
|
|
|||||
| Total liabilities and stockholders’ equity |
$ | 3,065,709 | $ | 982,067 | ||||
|
|
|
|
|
|||||
|
|
14 |
Netflix, Inc.
Consolidated Statements of Cash Flows
(unaudited)
(in thousands)
| Three Months Ended | Twelve Months Ended | |||||||||||||||||||
| December 31, 2011 |
September 30, 2011 |
December 31, 2010 |
December 31, 2011 |
December 31, 2010 |
||||||||||||||||
| Cash flows from operating activities: |
||||||||||||||||||||
| Net income |
$ | 40,732 | $ | 62,460 | $ | 47,095 | $ | 231,639 | $ | 160,853 | ||||||||||
| Adjustments to reconcile net income to net cash provided by operating activities: |
||||||||||||||||||||
| Additions to streaming content library |
(976,545 | ) | (539,285 | ) | (174,429 | ) | (2,320,732 | ) | (406,210 | ) | ||||||||||
| Change in streaming content liabilities |
643,780 | 314,720 | 79,639 | 1,460,400 | 167,836 | |||||||||||||||
| Amortization of streaming content library |
281,279 | 187,446 | 65,009 | 699,128 | 158,100 | |||||||||||||||
| Amortization of DVD content library |
22,754 | 23,000 | 31,006 | 96,744 | 142,496 | |||||||||||||||
| Depreciation and amortization of property, equipment and intangibles |
11,826 | 11,913 | 9,253 | 43,747 | 38,099 | |||||||||||||||
| Stock-based compensation expense |
18,077 | 15,705 | 8,270 | 61,582 | 27,996 | |||||||||||||||
| Excess tax benefits from stock-based compensation |
(501 | ) | (11,761 | ) | (27,515 | ) | (45,784 | ) | (62,214 | ) | ||||||||||
| Other non-cash items |
(578 | ) | (1,745 | ) | (1,314 | ) | (4,050 | ) | (9,128 | ) | ||||||||||
| Deferred taxes |
(920 | ) | (5,281 | ) | 1,999 | (15,110 | ) | (962 | ) | |||||||||||
| Changes in operating assets and liabilities: |
||||||||||||||||||||
| Prepaid content |
21,139 | (17,335 | ) | (2,895 | ) | 6,211 | (35,476 | ) | ||||||||||||
| Other current assets |
(9,710 | ) | (8,578 | ) | (5,990 | ) | (4,775 | ) | (18,027 | ) | ||||||||||
| Other accounts payable |
19,366 | (5,422 | ) | 16,852 | 24,314 | 18,098 | ||||||||||||||
| Accrued expenses |
(1,629 | ) | 20,920 | 27,543 | 59,902 | 67,209 | ||||||||||||||
| Deferred revenue |
(12,133 | ) | 13,992 | 24,197 | 21,613 | 27,086 | ||||||||||||||
| Other non-current assets and liabilities |
8,529 | (11,218 | ) | (2,003 | ) | 2,883 | 645 | |||||||||||||
|
|
|
|
|
|
|
|
|
|
|
|||||||||||
| Net cash provided by operating activities |
65,466 | 49,531 | 96,717 | 317,712 | 276,401 | |||||||||||||||
|
|
|
|
|
|
|
|
|
|
|
|||||||||||
| Cash flows from investing activities: |
||||||||||||||||||||
| Acquisition of DVD content library |
(23,144 | ) | (20,826 | ) | (32,908 | ) | (85,154 | ) | (123,901 | ) | ||||||||||
| Purchases of short-term investments |
(123,214 | ) | (7,673 | ) | (34,193 | ) | (223,750 | ) | (107,362 | ) | ||||||||||
| Proceeds from sale of short-term investments |
19,485 | 37 | 15,794 | 50,993 | 120,857 | |||||||||||||||
| Proceeds from maturities of short-term investments |
19,665 | 1,805 | 5,500 | 38,105 | 15,818 | |||||||||||||||
| Purchases of property and equipment |
(10,656 | ) | (14,080 | ) | (14,431 | ) | (49,682 | ) | (33,837 | ) | ||||||||||
| Other assets |
2,255 | (844 | ) | 2,055 | 3,674 | 12,344 | ||||||||||||||
|
|
|
|
|
|
|
|
|
|
|
|||||||||||
| Net cash used in investing activities |
(115,609 | ) | (41,581 | ) | (58,183 | ) | (265,814 | ) | (116,081 | ) | ||||||||||
|
|
|
|
|
|
|
|
|
|
|
|||||||||||
| Cash flows from financing activities: |
||||||||||||||||||||
| Principal payments of lease financing obligations |
(536 | ) | (526 | ) | (480 | ) | (2,083 | ) | (1,776 | ) | ||||||||||
| Proceeds from issuance of common stock |
1,025 | 4,409 | 15,822 | 19,614 | 49,776 | |||||||||||||||
| Net proceeds from public offering of common stock |
199,947 | — | — | 199,947 | — | |||||||||||||||
| Excess tax benefits from stock-based compensation |
501 | 11,761 | 27,515 | 45,784 | 62,214 | |||||||||||||||
| Proceeds from issuance of debt, net of issuance costs |
198,060 | — | — | 198,060 | — | |||||||||||||||
| Repurchases of common stock |
— | (39,602 | ) | — | (199,666 | ) | (210,259 | ) | ||||||||||||
|
|
|
|
|
|
|
|
|
|
|
|||||||||||
| Net cash provided by (used in) financing activities |
398,997 | (23,958 | ) | 42,857 | 261,656 | (100,045 | ) | |||||||||||||
|
|
|
|
|
|
|
|
|
|
|
|||||||||||
| Net increase (decrease) in cash and cash equivalents |
348,854 | (16,008 | ) | 81,391 | 313,554 | 60,275 | ||||||||||||||
| Cash and cash equivalents, beginning of period |
159,199 | 175,207 | 113,108 | 194,499 | 134,224 | |||||||||||||||
|
|
|
|
|
|
|
|
|
|
|
|||||||||||
| Cash and cash equivalents, end of period |
$ | 508,053 | $ | 159,199 | $ | 194,499 | $ | 508,053 | $ | 194,499 | ||||||||||
|
|
|
|
|
|
|
|
|
|
|
|||||||||||
| Three Months Ended | Twelve Months Ended | |||||||||||||||||||
| December
31, 2011 |
September
30, 2011 |
December
31, 2010 |
December
31, 2011 |
December
31, 2010 |
||||||||||||||||
| Non-GAAP free cash flow reconciliation: |
||||||||||||||||||||
| Net cash provided by operating activities |
$ | 65,466 | $ | 49,531 | $ | 96,717 | $ | 317,712 | $ | 276,401 | ||||||||||
| Acquisitions of DVD content library |
(23,144 | ) | (20,826 | ) | (32,908 | ) | (85,154 | ) | (123,901 | ) | ||||||||||
| Purchases of property and equipment |
(10,656 | ) | (14,080 | ) | (14,431 | ) | (49,682 | ) | (33,837 | ) | ||||||||||
| Other assets |
2,255 | (844 | ) | 2,055 | 3,674 | 12,344 | ||||||||||||||
|
|
|
|
|
|
|
|
|
|
|
|||||||||||
| Non-GAAP free cash flow |
$ | 33,921 | $ | 13,781 | $ | 51,433 | $ | 186,550 | $ | 131,007 | ||||||||||
|
|
|
|
|
|
|
|
|
|
|
|||||||||||
|
|
15 |
Netflix, Inc.
Other Data
(unaudited)
(in thousands, except percentages, average monthly revenue per paying
subscriber and subscriber acquisition cost)
| As of / Three Months Ended | ||||||||||||
| December
31, 2011 |
September
30, 2011 |
December
31, 2010 |
||||||||||
| Unique domestic subscriber information: |
||||||||||||
| Subscribers: beginning of period |
23,789 | 24,594 | 16,800 | |||||||||
| Gross subscriber additions: during period |
5,216 | 4,714 | 5,132 | |||||||||
| Gross subscriber additions year-to-year change |
1.6 | % | 18.9 | % | 83.1 | % | ||||||
| Gross subscriber additions quarter-to-quarter sequential change |
10.6 | % | (11.3 | %) | 29.4 | % | ||||||
| Less subscriber cancellations: during period |
(4,610 | ) | (5,519 | ) | (2,431 | ) | ||||||
| Net subscriber additions: during period |
606 | (805 | ) | 2,701 | ||||||||
| Subscribers: end of period |
24,395 | 23,789 | 19,501 | |||||||||
| Subscribers year-to-year change |
25.1 | % | 41.6 | % | 59.0 | % | ||||||
| Subscribers quarter-to-quarter sequential change |
2.5 | % | (3.3 | %) | 16.1 | % | ||||||
| Free subscribers: end of period |
1,537 | 946 | 1,566 | |||||||||
| Free subscribers as percentage of ending subscribers |
6.3 | % | 4.0 | % | 8.0 | % | ||||||
| Paid subscribers: end of period |
22,858 | 22,843 | 17,935 | |||||||||
| Paid subscribers year-to-year change |
27.4 | % | 44.0 | % | 50.8 | % | ||||||
| Paid subscribers quarter-to-quarter sequential change |
0.1 | % | (1.8 | %) | 13.1 | % | ||||||
| Average monthly revenue per paying subscriber |
$ | 12.35 | $ | 11.56 | $ | 11.68 | ||||||
| Domestic churn |
5.3 | % | 6.3 | % | 3.7 | % | ||||||
| Domestic subscriber acquisition cost |
$ | 15.62 | $ | 15.25 | $ | 10.87 | ||||||
| Three Months Ended | ||||||||||||
| December
31, 2011 |
September
30, 2011 |
December
31, 2010 |
||||||||||
| Consolidated margins: |
||||||||||||
| Gross margin |
34.3 | % | 34.7 | % | 34.4 | % | ||||||
| Operating margin |
8.1 | % | 11.8 | % | 13.2 | % | ||||||
| Net margin |
4.7 | % | 7.6 | % | 7.9 | % | ||||||
| Consolidated expenses as percentage of revenues: |
||||||||||||
| Marketing |
13.1 | % | 10.8 | % | 10.5 | % | ||||||
| Technology and development |
9.2 | % | 8.5 | % | 7.7 | % | ||||||
| General and administrative |
3.9 | % | 3.6 | % | 3.0 | % | ||||||
|
|
|
|
|
|
|
|||||||
| Total operating expenses |
26.2 | % | 22.9 | % | 21.2 | % | ||||||
| Consolidated year-to-year change: |
||||||||||||
| Total revenues |
46.9 | % | 48.6 | % | 34.1 | % | ||||||
| Cost of subscription |
52.2 | % | 61.4 | % | 45.4 | % | ||||||
| Fulfillment expenses |
15.8 | % | 24.5 | % | 23.1 | % | ||||||
| Marketing |
81.8 | % | 9.7 | % | (11.1 | %) | ||||||
| Technology and development |
75.8 | % | 65.0 | % | 38.4 | % | ||||||
| General and administrative |
92.9 | % | 87.3 | % | 51.7 | % | ||||||
| Total operating expenses |
81.2 | % | 35.3 | % | 9.5 | % | ||||||
|
|
16 |
Netflix, Inc.
Segment Information
(unaudited)
(in thousands)
| As of / Three Months Ended | Twelve Months Ended | |||||||||||||||||||
| December
31, 2011 |
September
30, 2011 |
December
31, 2010 |
December
31, 2011 |
December
31, 2010 |
||||||||||||||||
| Domestic Streaming |
||||||||||||||||||||
| Free subscriptions at end of period |
1,518 | 937 | — | |||||||||||||||||
| Paid subscriptions at end of period |
20,153 | 20,511 | — | |||||||||||||||||
|
|
|
|
|
|
|
|||||||||||||||
| Total subscriptions at end of period |
21,671 | 21,448 | — | |||||||||||||||||
| Revenue |
$ | 476,334 | $ | — | $ | — | $ | — | $ | — | ||||||||||
| Cost of revenues and marketing expenses |
424,224 | — | — | — | — | |||||||||||||||
|
|
|
|
|
|
|
|
|
|
|
|||||||||||
| Contribution profit |
52,110 | — | — | — | — | |||||||||||||||
| International Streaming |
||||||||||||||||||||
| Free subscriptions at end of period |
411 | 491 | 176 | |||||||||||||||||
| Paid subscriptions at end of period |
1,447 | 989 | 333 | |||||||||||||||||
|
|
|
|
|
|
|
|||||||||||||||
| Total subscriptions at end of period |
1,858 | 1,480 | 509 | |||||||||||||||||
| Revenue |
$ | 28,988 | $ | 22,687 | $ | 3,617 | $ | 82,850 | $ | 3,617 | ||||||||||
| Cost of revenues and marketing expenses |
88,731 | 46,005 | 13,041 | 185,999 | 15,735 | |||||||||||||||
|
|
|
|
|
|
|
|
|
|
|
|||||||||||
| Contribution profit (loss) |
(59,743 | ) | (23,318 | ) | (9,424 | ) | (103,149 | ) | (12,118 | ) | ||||||||||
| Domestic DVD |
||||||||||||||||||||
| Free subscriptions at end of period |
126 | 115 | — | |||||||||||||||||
| Paid subscriptions at end of period |
11,039 | 13,813 | — | |||||||||||||||||
|
|
|
|
|
|
|
|||||||||||||||
| Total subscriptions at end of period |
11,165 | 13,928 | — | |||||||||||||||||
| Revenue |
$ | 370,253 | $ | — | $ | — | $ | — | $ | — | ||||||||||
| Cost of revenues and marketing expenses |
176,488 | — | — | — | — | |||||||||||||||
|
|
|
|
|
|
|
|
|
|
|
|||||||||||
| Contribution profit |
193,765 | — | — | — | — | |||||||||||||||
| Total Domestic (Streaming + DVD) |
||||||||||||||||||||
| Free unique subscribers at end of period |
1,537 | 946 | 1,566 | |||||||||||||||||
| Paid unique subscribers at end of period |
22,858 | 22,843 | 17,935 | |||||||||||||||||
|
|
|
|
|
|
|
|||||||||||||||
| Total unique subscribers at end of period |
24,395 | 23,789 | 19,501 | |||||||||||||||||
| Revenue |
$ | 846,587 | $ | 799,152 | $ | 592,305 | $ | 3,121,727 | $ | 2,159,008 | ||||||||||
| Cost of revenues and marketing expenses |
600,712 | 579,720 | 440,598 | 2,256,540 | 1,635,459 | |||||||||||||||
|
|
|
|
|
|
|
|
|
|
|
|||||||||||
| Contribution profit |
245,875 | 219,432 | 151,707 | 865,187 | 523,549 | |||||||||||||||
| Consolidated |
||||||||||||||||||||
| Free unique subscribers at end of period |
1,948 | 1,437 | 1,742 | |||||||||||||||||
| Paid unique subscribers at end of period |
24,305 | 23,832 | 18,268 | |||||||||||||||||
|
|
|
|
|
|
|
|||||||||||||||
| Total unique subscribers at end of period |
26,253 | 25,269 | 20,010 | |||||||||||||||||
| Revenue |
$ | 875,575 | $ | 821,839 | $ | 595,922 | $ | 3,204,577 | $ | 2,162,625 | ||||||||||
| Cost of revenues and marketing expenses |
689,443 | 625,725 | 453,639 | 2,442,539 | 1,651,194 | |||||||||||||||
|
|
|
|
|
|
|
|
|
|
|
|||||||||||
| Contribution profit |
$ | 186,132 | $ | 196,114 | 142,283 | $ | 762,038 | 511,431 | ||||||||||||
| Other operating expenses |
115,260 | 99,272 | 63,830 | 376,970 | 227,790 | |||||||||||||||
|
|
|
|
|
|
|
|
|
|
|
|||||||||||
| Operating income |
70,872 | 96,842 | $ | 78,453 | 385,068 | $ | 283,641 | |||||||||||||
| Other income (expense) |
(5,037 | ) | (3,219 | ) | (3,894 | ) | (16,546 | ) | (15,945 | ) | ||||||||||
| Provision for income taxes |
25,103 | 31,163 | 27,464 | 136,883 | 106,843 | |||||||||||||||
|
|
|
|
|
|
|
|
|
|
|
|||||||||||
| Net Income |
$ | 40,732 | $ | 62,460 | $ | 47,095 | $ | 231,639 | $ | 160,853 | ||||||||||
|
|
|
|
|
|
|
|
|
|
|
|||||||||||
|
|
17 |