Attached files
| file | filename |
|---|---|
| 8-K - FORM 8-K - LOCAL Corp | d287209d8k.htm |
 Local
Corporation Overview January 2012
Connecting Local Merchants with Online Consumers
Exhibit 99.1 |
 Local Corporation Presentation | January 2012
Safe Harbor Statement; Non-GAAP Financial Measures
2
Certain matters being discussed by Local Corporation’s management
today include forward looking statements which are made pursuant to
the Safe Harbor provisions of section 21-E of the Securities Exchange
Act of 1934. Investors are cautioned that statements which are not
strictly historical statements, including statements concerning future
expected financial performance, management objectives and plans for
future operations, our relationships with strategic or other partners, the
release of new products or services or enhancements to existing
products or services, our expectations regarding potential acquisitions
and the future performance of past acquisitions including our ability to
realize expected synergies, trends in the market for our current or
planned products or services, and market acceptance of our products or
services, constitute forward looking statements. The
forward looking statements include, but are not limited to, any statements containing the words
“expect”, “anticipate”, “estimates”, “believes”,
“should”, “could”, “may”, “possibly”, and similar expressions
and the negatives thereof. These forward looking statements involve a
number of risks and uncertainties that could cause actual results to differ
materially from the forward looking statements. Those risks and
uncertainties are detailed in the company’s filings from time to time with
the Securities and Exchange Commission. The information contained in
the forward looking statements is provided as of the date of such oral
statements and the company disclaims any obligation to update such
statements.
This document includes the non-GAAP financial measure of “Adjusted
Net Income/Loss” which we define as net income/loss excluding:
provision for income taxes; interest and other income (expense), net;
depreciation; amortization; stock based compensation charges, warrant
revaluation charges and non-recurring items. Adjusted Net Income/Loss,
as defined above, is not a measurement under GAAP. Adjusted Net
Income/Loss is reconciled to net loss and loss per share, which we
believe are the most comparable GAAP measures, at the end of this
presentation. Management believes that Adjusted Net Income/Loss
provides useful information to investors about the company’s
performance because it eliminates the effects of period-to-period
changes in income from interest on the company’s cash and marketable
securities, expense from the company’s financing transactions and the
costs associated with income tax expense, capital investments, stock-
based compensation expense, warrant revaluation charges, and non-
recurring charges which are not directly attributable to the underlying
performance of the company’s business operations. Management uses
Adjusted Net Income/Loss in evaluating the overall performance of the
company’s business operations. A
limitation of non-GAAP Adjusted Net Income/Loss is that it excludes items that often have
a material effect on the company’s net income and earnings per common share calculated in
accordance with GAAP. Therefore, management compensates for this limitation by using
Adjusted Net Income/Loss in conjunction with GAAP net loss and loss
per share measures. The company believes that Adjusted Net
Income/Loss provides investors with an additional tool for evaluating the
company’s core performance, which management uses in its own
evaluation of overall performance, and as a base-line for assessing the
future earnings potential of the company. While the GAAP results are
more complete, the company prefers to allow investors to have this
supplemental metric since, with reconciliation to GAAP (as noted above
it may provide greater insight into the company’s financial results. The
non-GAAP measures should be viewed as a supplement to, and not as
a substitute for, or superior to, GAAP net income or earnings per share.
|
 Local Corporation Presentation | January 2012
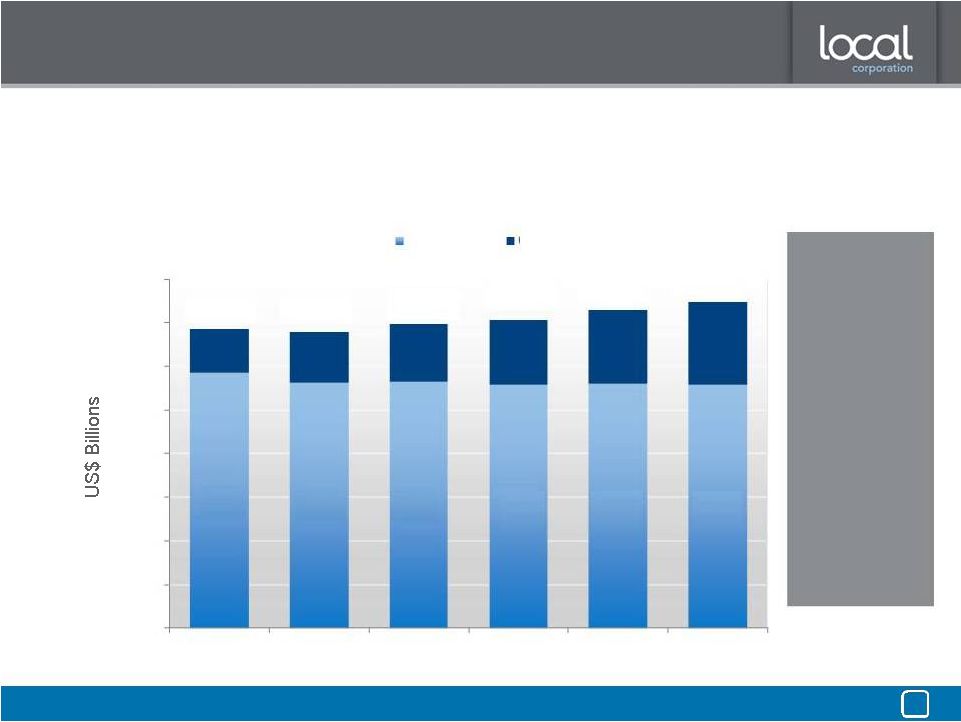
Why invest in this industry [local online advertising]?
3
Source: BIA/Kelsey, November 2011. Numbers are rounded.
Online/Digital
Media
CAGR 13.6%
$135.9
$137.2
$139.5
$141.5
$146.0
$149.4
$23.3
$26.4
$29.9
$33.8
$37.9
$20.0
$0.0
$20.0
$40.0
$60.0
$80.0
$100.0
$120.0
$140.0
$160.0
2010
2011
2012
2013
2014
2015
$112.5
$111.6
$112.2
$111.5
$117.2
$113.1
2010
2015
CAGRs:
Traditional
Online/Digital
Total Media
CAGR 1.7%
Traditional Media
CAGR
1.0%
-
sec·u·lar
trends
[sek-yuh-ler]
adjective.noun
1.
a secular
trend
away
from
traditional
to
digital
media
caused
by
increased
consumption
of
digital
content
2.
consumers
are
spending
more
time
online
and
ad
dollars
are
following
them |
 Local Corporation Presentation | January 2012
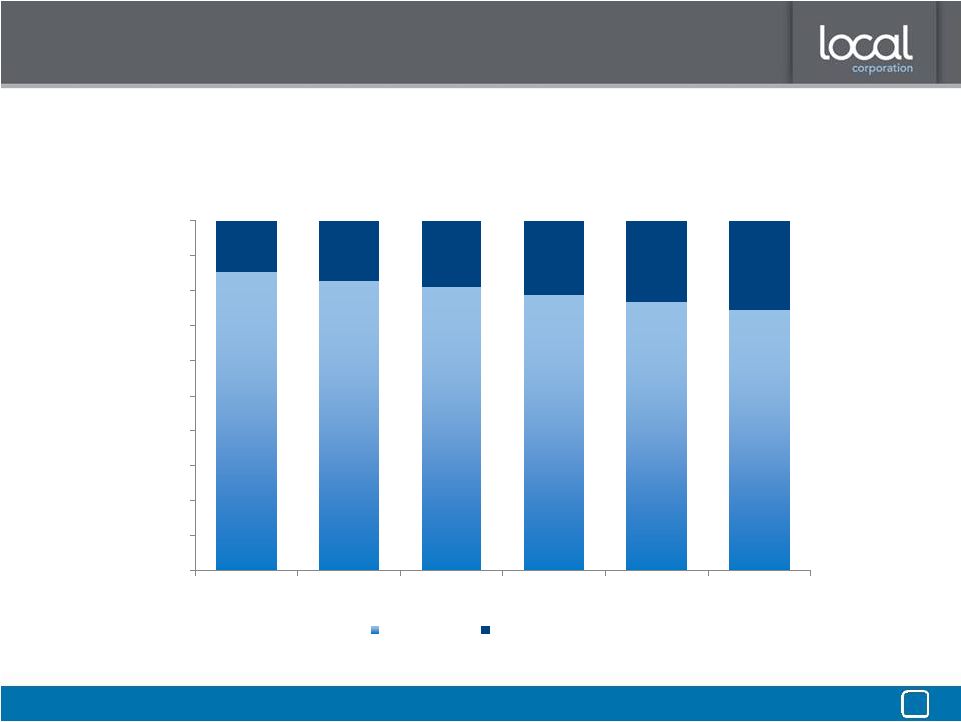
Why invest in this industry [local online advertising]?
sec·u·lar trends
[sek-yuh-ler] adjective.noun
1.
online advertising continues to eat into traditional media market share
4
85.4%
82.8%
81.1%
78.9%
76.9%
74.6%
14.6%
17.2%
18.9%
21.1%
23.1%
25.4%
0%
10%
20%
30%
40%
50%
60%
70%
80%
90%
100%
2010
2011
2012
2013
2014
2015
Traditional
Online/Digital
Source: BIA/Kelsey, November 2011. Numbers are rounded.
|
 Local Corporation Presentation | January 2012
Within local online advertising is [local search]
growth
[grohth] noun
1.
local search volumes are growing faster than non-local searches
2.
consumers are searching for local goods and services more frequently
5
Source: BIA/Kelsey, November 2011. Numbers are rounded.
|
 Local Corporation Presentation | January 2012
Within local online advertising is [local search]
growth
6
Source: BIA/Kelsey, November 2011. Numbers are rounded.
[grohth] noun
1.
search ad spend is shifting from non-local into local search
2.
local search revenue is growing faster than volume because advertisers pay higher prices to
reach local consumers |
 Local Corporation Presentation | January 2012
Within local online advertising is [local display]
growth
[grohth]
noun
1.
display is growing, but local display is growing faster
2.
local
rich
media
is
projected
to
grow
50%
CAGR
through
2015
7
Source: BIA/Kelsey, November 2011. Numbers are rounded.
US Local Display as % of Top Line Market |
 Local Corporation Presentation | January 2012
Within local online advertising is [daily deals]
growth
[grohth]
noun
1.
a disruptive ad model that is accelerating the shift in spend from old media
2.
a highly attractive performance ad product for lagging online advertisers such as
restaurants 8
Source: BIA/Kelsey, November 2011. Numbers are rounded.
0
500
1,000
1,500
2,000
2,500
3,000
3,500
4,000
4,500
2010
2011
2012
2013
2014
2015
$873
$1,970
$2,455
$2,987
$3,564
$4,171
+36.7% CAGR |
 Local Corporation Presentation | January 2012
Local Corporation
lo·cal
cor·po·ra·tion
[loh-kuhl] [kawr-puh-rey-shuhn] adjective.noun
Founded 1999, IPO 2004: NASDAQ: [LOCM]
1.
a
diversified
local
online
media
business
focused
on
high
growth
markets
2.
specializes in connecting local merchants with online consumers
3.
reaches one million consumers every day across over 1,000 sites via search, display and
email 4.
a rapidly growing local display network that served almost 1BB impressions in December
2011 5.
a proprietary technology platform covered by 9 patents (8 pending); serves over 30,000
customers with web hosting, search engine optimization, display, pay per click,
subscription and daily deals ads 9 |
 Local Corporation Presentation | January 2012
Publisher Partners
MUVs in 4Q11
Channel SMBs
Daily Deal Members
Daily Deals Markets
Our Large & Growing Ecosystem
Flagship Property
Direct SMBs
White Label Sites
Organic Traffic
Business Listings
Local Merchants
Non-search
We Connect a Million Consumers with Local Merchants Every Day
We generate revenue
from ads, including pay-per-click,
pay-per-call, subscription, daily deals & display
Search
Impressions Dec 2011
Consumers
Deals
-
Spreebird
-
Facebook, Twitter
1
14
40%
-
Google
-
Yahoo
-
SuperMedia
-
ATTi
Ad Partners
Regional Media Publishers
-
Newspapers, TV, radio
stations, yellow pages
Ad Agencies
Channel Partners
SMB Subscribers
Direct
100
1,000+
9,000
31,000
400,000
18MM
94MM
1BB
Display
Social Media
Consumer Properties
-
Local.com
-
Krillion.com
-
1,000+ partner sites
10
-
Feet on the street sales
-
Telesales |
 Local Corporation Presentation | January 2012
Our Target Demographic
11
Gender
Female
57%
Male
43%
Age
18 to 24
10%
25 to 34
17%
35 to 44
20%
45 to 54
18%
Household Income
$25K -
$39,999
17.8%
$40K -
$59,999
23.7%
$60K -
$74,999
9.6%
$75K -
$99,999
11.7%
$100,000 +
17.1%
Local.com Source: ComScore, January 2011
We reach household managers with
high buying intent when they are
looking for local solutions |
 Local Corporation Presentation | January 2012
Advertisers Pay More For Local Consumers
•
57% of our traffic is the Household Manager
»
Aged between 25-45 with one child or more at home
»
Controls significant portion of the household purse strings
»
Typically spends 80% of that money within 20 miles of home
•
Advertisers often pay more to reach ready-to-buy Household Managers
»
Just conducted local & commercial searches online
»
89% of in-store purchasers in key categories have conducted online
research**
»
82% of people visiting local search sites follow-up with offline action
(store visit/call)*
12
Search Term
Click
Bids*
Premium
Restaurant
$0.22
577%
San Francisco
Restaurant
$1.27
Credit Union
$0.45
116%
Seattle
Credit Union
$0.52
Plumber
$2.60
275%
Plumber
$7.14
Moving Company
$2.35
252%
Denver
Moving Company
$5.93
Divorce Attorney
$2.03
186%
Divorce Attorney
Las Vegas
$3.77
Auto Repair
$1.97
157%
Dallas
Auto Repair
$3.09
Wedding Florist
$0.51
278%
Orlando
Wedding Florist
$1.42
Hotel
$0.99
138%
New
York City
Hotel
$1.37
* Bids as of January 6, 2011
Advertisers often pay more to reach local consumers…
Los Angeles
** TMP/Yahoo-comScore
study
–
2007 |
 Local Corporation Presentation | January 2012
More Proprietary Products for Our Customers
13
Channel
Local Merchants
Consumers
•
Local Premium
»
Subscription ads on Local.com
•
Web Hosting
»
Basic product for ~$15/month
•
LocalConnect
Business Directory
»
‘Local businesses’
tab for newspaper,
tv, radio station websites
•
Five Exact Match SMB Solutions
»
Mobile, SEO, display and social media
»
More coming soon
•
Deals
via Spreebird.com
•
Local.com
»
Local business search
•
Krillion.com
»
Local product search
•
Spreebird.com
»
Deal-of-the-day
»
Travel deals
•
Krillion
Product Directory
»
‘Local products’
tab for newspaper,
tv, radio station websites
•
Rovion Ad Management Platform
»
Rich media ad management for
agencies and national brands to
localize national ad campaigns
•
Five Exact Match SMB Solutions
»
White label products coming soon |
 Consumers: Our
Network of Properties & Services 14
•
A network of over 1,000 Owned or Private Label sites
»
Flagship Local.com; Spreebird.com; Krillion.com
»
Business name/category search
»
Product search (80k products in over 70k locations)
»
Coupons, specials, daily & travel deals
»
Events, activities, topics, reviews & more
•
A record 94MM MUVs in 4Q11
»
One-third of traffic was organic
»
Balance of traffic via SEM (Google/Yahoo/Bing)
»
All users doing local-&-commercial searches
•
Expanding mobile product range
»
Five products launched; five more coming
Local shopping info
embedded in rich media
display ads
Engage via mobile
web & apps
(coming soon)
Data published across
Consumer Properties
Local Corporation Presentation | January 2012 |
 Local Corporation Presentation | January 2012
15
Local Merchants & Channel: Display Ad Platform
»
Launched 4Q11
»
Designed for national brands with local presence,
including movie studios, big box retailers, regional and
national agencies/media brands, automotive brands
and luxury goods retailers
»
Local rich media ad units with available real-time ‘in
store’
product, inventory and pricing data
»
A unique, patented local platform designed to capture
transitioning national-to-local ad spend
»
A wide variety of ad units including expandable,
floating, pre-page interstitial banners & InPerson
»
Agency quality creative with web-based drag-and-
drop interface and cloud storage of digital assets
»
Improves ROI –
no need for flash ad programmers
»
Lower cost, faster turnaround ad production
•
Purpose-built for emerging local rich media segment
•
Enables the development and management of…
•
Saves agencies & brands time and money |
 Local Corporation Presentation | January 2012
16
Local Merchants & Channel: Display Ad Distribution
Local Corporation Display Business
Our
national
sales
organization
sells
display
advertising
across
three
networks
Local.com
Local Syndication
Network
Local Display Ad
Network
The search results
pages within the
flagship site owned
and operated by
Local Corp.
The pages within the
sites owned and
operated by
partners who have
implemented the
Local hosted search
product.
The pages within
sites owned and
operated by third-
party ad networks.
In
December
2011
we
served
over
1
billion
impressions
–
up
from
about
100
million
impressions
in
January
2011 |
 Local Corporation Presentation | January 2012
Local Merchants & Channel: Proprietary SMB Ad Products
17
•
Exact Match suite of SMB ad products
»
Five products released since mid-2011 (two mobile)
»
More coming soon
•
Subscription pricing from $129-$199/month
»
‘Do it for me’
»
Multi-channel access to consumers via seo, social media,
display and mobile
Helping Local Merchants Reach Online Consumers |
 Local Corporation Presentation | January 2012
Local Merchants: Spreebird Daily Deals
18
•
Daily deals is a desirable performance ad product
»
SMBs
only
pay
when
we
drive
a
customer
to
their
register
•
Launched
Spreebird
in
May
2011,
acquired
Screamin’
Daily
Deals
July
2011
»
Not urban –
suburban
•
Step 1. Partner with school PTA for fundraising
•
Step 2. Pay a bounty when ‘Mom’
signs up
•
Step 3. Pay a bounty when Mom buys from local merchant
»
10% of our revenue share is paid to school of Mom’s choice in
merchant’s name
»
Merchant becomes ‘community hero’, leading to repeat
hyperlocal business from a desirable demographic
School
Rewards:
Each
time
a
Household
Manager
saves
money
on
great,
hyperlocal
Spreebird
deals,
we
donate
10%
of
our
revenue
back
to
the
kids’
school
in
the
merchant’s
name!
Donation to school in
merchant’s
name
= Community Hero!!!
Local merchant
Household
Manager
Hyperlocal node |
 Proprietary
Technology Portfolio Powers Products/Network 19
•
Multiple databases with
millions of SMB listings to
validate business
information
•
We crawl the web and use
our proprietary Keyword
DNA™
+ web indexing
algorithms to generate all
our search results
•
Ingest real-time ad and data
feeds from multiple partners
•
Syndicates those feeds to
over 100,000 sites
•
A fully featured group-
buying distribution
platform
•
Personalization engine
driving enhanced user
experience
•
API, RSS, widget
syndication for our regional
media network and
planned partners
•
Rich media ad management
and serving platform
•
Automated creation,
production, management
and serving of ads
•
Rovion ‘in-person’
video unit
•
Green screen studios &
network
•
Highly scalable geo-category
domain acquisition
•
Automated website hosting
& mgt. features
•
Content marketplace for the
procurement, creation,
payment and management
of custom local content for
SMB websites
•
Pulls real-time product
inventory directly from
manufacturers, retailers
•
Data aggregation and
normalization technologies
and know-how
•
Product-based search results
•
9 patents issued, 8 pending in local/mobile/data/display
•
Local Corporation Presentation | January 2012
Each acquisition has strategically increased our ability to serve this rapidly growing segment
with a wider range of proprietary products & services |
 Local Corporation Presentation | January 2012
Experienced Team with Strategy Discipline
20
Heath Clarke
Founder, Chairman & CEO
20+ yrs exp
Founded Local in ’99
VP eCommerce LanguageForce
CEO/Founder AFP (Australia)
Erick Herring
SVP Technology
Founder Townloop
CTO Feedback.com
CTO, VP Product Webvisible
CTO Adapt Technologies
Ken Cragun
CFO
20+ yrs exp
CFO Modtech
SVP MIVA
CFO ImproveNet
CFO NetCharge.com
CPA; Big 4 Exp.
Malcolm Lewis
SVP, GM Social Buying
Founder, Fablistic
SVP/GM, Local Corporation
Sr. Management, Oracle Corporation
Mike Sawtell
COO
20+ yrs exp
Chairman & CEO, DigitalPost Interactive
Pres. & COO , Interchange Corp. (now
Local Corporation)
COO & VP of Sales, Informative Research
Peter Hutto
SVP, Corporate Development
Co-Founder, ZeroDegrees
Managing Director, EDS & MCI
Systemhouse
Tullio Siragusa
SVP, Sales
Head of Sales, Ansearch Ltd.
SVP Global Sales, Operative Media
VP Strategic Accounts, Acxiom |
 Local Corporation Presentation | January 2012
Financial Performance
21
Adjusted Net Income (Loss) = Net income (loss) before interest, taxes, depreciation,
amortization, stock-based compensation, warrant revaluation charges, and
non-recurring Items Q4-2011 annualized revenue = $96.0M
•
Financials (non-GAAP)
»
40% CAGR 2006-2010; ~50% growth between 2Q and 4Q2011
»
4Q11 Revenue guidance: $24MM and break-even Adjusted Net Income
»
FY11 Revenue guidance: ~$78MM
$14.2M
$21.5M
$38.3M
$56.3M
$84.1M
$77.3M
$(0.96)
$(0.63)
$(0.33)
$0.21
$0.82
$(1.10)
$(0.60)
$(0.10)
$0.40
$0.90
$1.40
$0.0M
$10.0M
$20.0M
$30.0M
$40.0M
$50.0M
$60.0M
$70.0M
$80.0M
$90.0M
$100.0M
2006
2007
2008
2009
2010
2011 Fcst |
 Local Corporation Presentation | January 2012
4Qs of Transformation Return
to Strong Growth 22
Acquired Octane360 –
SEO
& web hosting platform
4Q>2Q Yahoo/Bing impact
Acquired Rovion rich media ad platform
Acquired Krillion shopping data platform
Launched Spreebird (daily deals)
Acquired Screamin’
Media Group
(daily deals)
Google ad feed begins
Situational Challenge
•
Yahoo/Bing alliance caused
monetization drop
•
Dealt with by switching partner at
end of contract
We didn’t stop there…
Diversified Revenue & Products
•
Retained Yahoo partnership
•
Expanded into non-search
revenues & products
Delivered Record Traffic
•
18% YOY growth
Expanded
Technology
Platform
•
Rich media & daily deals
•
Local product search
•
New patents
Modified Team
•
Faster product development
•
Improved sales organization
$0.0M
$5.0M
$10.0M
$15.0M
$20.0M
$25.0M
Q1-09
Q2-09
Q3-09
Q4-09
Q1-10
Q2-10
Q3-10
Q4-10
Q1-11
Q2-11
Q3-11
Q4-11E |
 Our
Revenue Streams and Mid-Term Growth Expectations 53%
30%
17%
2%
0%
0%
15%
65%
21%
14%
2%
1%
1%
10%
15%
30%
50%
50%
60%
400%
-50%
30%
50%
80%
80+%
100%
80%
100%
100%
100%
20%
40%
10%
10%
20%
20%
15%
70%
$44M
$25M
$15M
$48M
$17M
$12M
23
Local Corporation Presentation | January 2012 |
 Local Corporation Presentation | January 2012
3Q11 Balance Sheet & Capitalization
24
September 30, 2011
Common stock
22,009
Options
(Avg.
Exercise
Price
$4.65)
4,566
Warrants
(Avg.
Exercise
Price
7.11)
1,478
Fully Diluted
28,053
I.
II.
III.
1
1
Additional Data:
In January 2011 the Company completed a public offering of 4.6 million shares at a price of
$4.25 per share. Net proceeds of $18.2 million
Total authorized shares 65,000,000 common and 10,000,000 preferred September
30, 2011 Cash
$10,119
Accounts Receivable
13,018
Total Assets
76,478
Total Debt
8,000
Total Liabilities
23,978
Shareholders Equity
$52,500
Key Balance Sheet Items
(in thousands)
Capitalization
(in thousands)
1.
Options and warrants represent approximately $31MM in cash
In August 2011 the Company closed on a $12 million credit facility
|
 Local Corporation Presentation | January 2012
Why Invest in Local Corporation?
25
•
Rapidly growing company in a rapidly growing market
•
Beneficiary of secular trend towards online ad spend by SMBs
•
Extensive technology platform and differentiated product portfolio
An Attractive Position
in Fast Growing Markets
•
Growing revenue streams with considerable future growth potential
•
Proprietary products that improve operating leverage over time
•
Experienced executive team focused on execution with strategy discipline
Strong Operating Model
with Experienced Leadership
Team
•
Four quarters of change, challenge and transformation –
completed
•
Not just a search engine –
a media business
•
Returned to strong growth with greater revenue diversification
Completed a Business
Transformation |
 Local Corporation Presentation | January 2012
26
Heath Clarke
Chairman & Chief Executive Officer
hclarke@local.com
Ken Cragun
Chief Financial Officer
kcragun@local.com
949.784.0800
http://corporate.local.com
Thank You |
 Local Corporation Presentation | January 2012
P&L Trend –
Quarterly
27
Adjusted Net Income (Loss) = Net income (loss) before interest, taxes, depreciation,
amortization, stock-based compensation, warrant revaluation charges, and
non-recurring Items Actual
Actual
Actual
Actual
Actual
Actual
Actual
Actual
Forecast
Description
Q1-10
Q2-10
Q3-10
Q4-10
FY-10
Q1-11
Q2-11
Q3-11
Q4-11
Revenue
18,631
$
23,004
$
22,457
$
20,045
$
84,137
$
16,795
$
15,584
$
20,877
$
24,000
$
Sequential revenue growth
14%
19%
-2%
-12%
49%
-16%
-7%
34%
15%
Gross Margin
7,829
9,828
11,752
8,211
37,620
5,807
4,772
8,370
Gross Margin %
42%
43%
52%
41%
45%
35%
31%
40%
Other Operating Expenses
7,354
8,750
9,754
8,050
33,908
8,618
10,506
12,639
Operating income (loss)
475
1,078
1,998
161
3,712
(2,811)
(5,734)
(4,269)
Interest and other income (expense)
(56)
(61)
(79)
(79)
(275)
(55)
(30)
(227)
Change in fair value of warrant liability
(272)
335
1,830
(1,006)
887
1,559
411
513
Income (Loss) before income taxes
147
1,352
3,749
(924)
4,324
(1,307)
(5,353)
(5,353)
Provision for income taxes
13
122
-
(33)
102
11
51
48
Net income (loss)
134
$
1,230
$
3,749
$
(891)
$
4,222
$
(1,318)
$
(5,404)
$
(4,031)
$
Adjusted Net income (loss)
2,575
$
3,451
$
4,595
$
3,154
$
13,775
$
8
$
(1,903)
$
(1,093)
$
-
$
Weighted average shares
15,918
17,342
17,202
16,576
16,788
20,241
21,254
21,940
Net income (loss) per share
0.01
$
0.07
$
0.22
$
(0.05)
$
0.25
$
(0.07)
$
(0.25)
$
(0.18)
$
Adjusted Net income (loss) per share
0.16
$
0.20
$
0.27
$
0.19
$
0.82
$
0.00
$
(0.09)
$
(0.05)
$ |
 Local Corporation Presentation | January 2012
Reconciliation:
Adjusted
Net
Income
to
GAAP
Net
Inc
-
Qtrly
28
Actual
Actual
Actual
Actual
Actual
Actual
Actual
Actual
Forecast
Description
Q1-10
Q2-10
Q3-10
Q4-10
FY-10
Q1-11
Q2-11
Q3-11
Q4-11
Adjusted Net income (loss)
2,575
$
3,451
$
4,595
$
3,154
$
13,775
$
8
$
(1,903)
$
(1,093)
$
-
$
Plus interest and other income (expense), net
(56)
(61)
(79)
(79)
(275)
(55)
(30)
(227)
(150)
Less provision for income taxes
(13)
(122)
-
33
(102)
(11)
(51)
(48)
(50)
Less amortization of intangibles
(1,230)
(1,454)
(1,561)
(1,489)
(5,734)
(1,198)
(1,210)
(1,371)
(1,700)
Less depreciation
(246)
(259)
(330)
(583)
(1,418)
(649)
(703)
(850)
(920)
Less stock-based compensation
(624)
(660)
(706)
(921)
(2,911)
(972)
(1,020)
(955)
(800)
Less revaluation of warrants
(272)
335
1,830
(1,006)
887
1,559
411
513
unknown
Less non-recurring charges
-
-
-
-
-
-
(898)
GAAP Net income (loss)
134
$
1,230
$
3,749
$
(891)
$
4,222
$
(1,318)
$
(5,404)
$
(4,031)
$
unknown |