Attached files
| file | filename |
|---|---|
| EX-99.1 - PRESS RELEASE - BlackRock Inc. | d284825dex991.htm |
| 8-K - FORM 8-K - BlackRock Inc. | d284825d8k.htm |
 Q4
2011 Earnings Press Release Supplement
January 19, 2012
Exhibit 99.2 |
 1
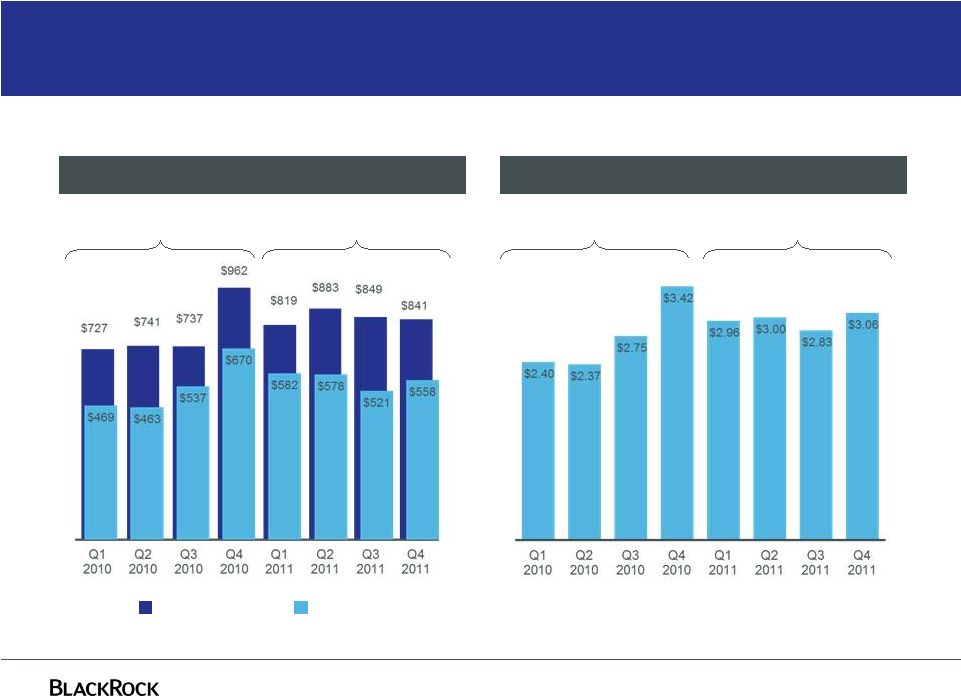
Full year 2011 diluted EPS up 8% despite market volatility
Operating and Net Income, as adjusted ($ in millions)
Diluted Earnings Per Share, as adjusted
For further information and reconciliation between GAAP and as adjusted, see the
appendix, notes (a) through (e) in the current earnings release, 2010 Form 10-K or 2011 Form 10-Qs.
Operating Income
Net Income
Full Year 2010 Operating Income:
$3,167
Full Year 2011 Operating Income:
$3,392
Full Year 2010:
$10.94
Full Year 2011:
$11.85 |
 2
39.1%
39.7%
40.0%
40.1%
40.7%
38.4%
37.4%
38.7%
38.2%
36.8%
38.9%
38.8%
2007
2008
2009
2009
Q1
2010
Q2
2010
Q3
2010
Q4
2010
Q1
2011
Q2
2011
Q3
2011
Q4
2011
Full year 2011 operating margin improved
Operating Margin, as adjusted
For further information and reconciliation between GAAP and as adjusted, see notes
(a) through (e) in the current earnings release, 2010 Form 10-K or 2011 Form 10-Qs.
Full Year 2011 = 39.7%
Full Year 2010 = 39.3%
BGI/BLK
Pro Forma |
 Global
markets no longer aligned: US- Positive; Others-
Negative
3
800
900
1,000
1,100
1,200
1,300
1,400
Q2
2010
Q3
2010
Q4
2010
Q1
2011
Q2
2011
Q3
2011
Q4
2011
Q1
2010
MSCI World Index
S&P 500
MSCI Emerging Markets
Q4 11 vs. Q4 10 Average:
MSCI
World
Index
5%
MSCI
Emerging
Markets
17%
S&P
500
2%
Q4 11 vs. Q3 11 Average:
MSCI
World
Index
4%
MSCI
Emerging
Markets
10%
S&P 500 -
flat |
 Year-over-year
Q4 2011 vs. Q4 2010
4 |
 5
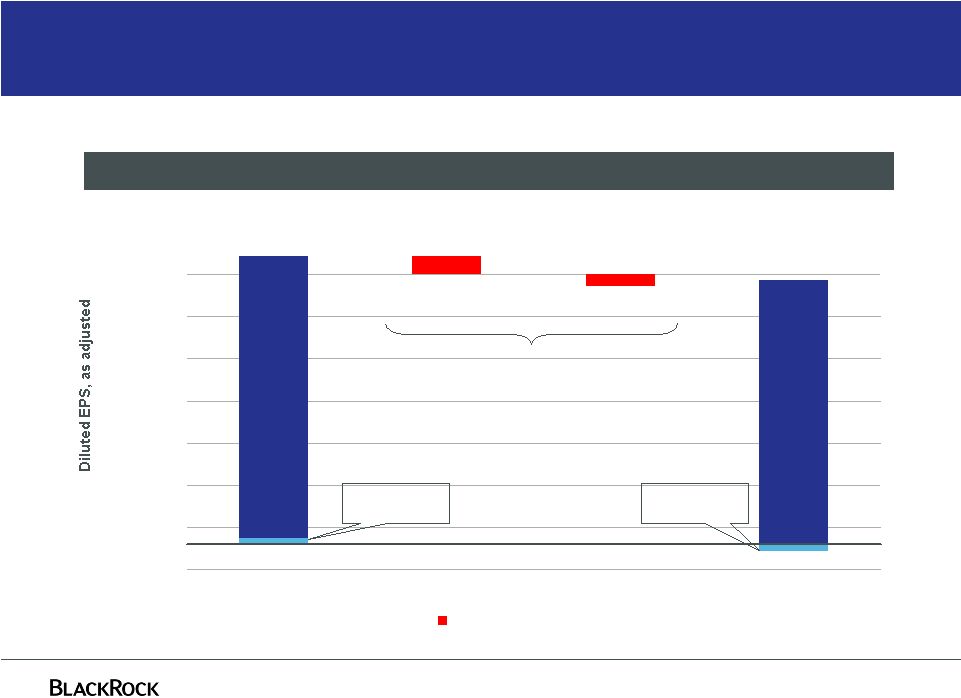
Year-over-year EPS decline explained by market effects
Q4-11 Compared to Q4-10, as adjusted
$3.14
($0.21)
($0.15)
$3.35
($0.30)
$0.20
$0.70
$1.20
$1.70
$2.20
$2.70
$3.20
Q4-10 EPS
Operating EPS
Non Operating EPS
Q4-11 EPS
Total EPS:
$3.06
Total EPS:
$3.42
Non-Operating:
$0.07
Operating
EPS:
Operating
EPS:
For further information and reconciliation between GAAP and as adjusted, see notes
(a) through (e) in the current earnings release. Non-Operating:
($0.08)
Decreasing EPS
($0.36) |
 6
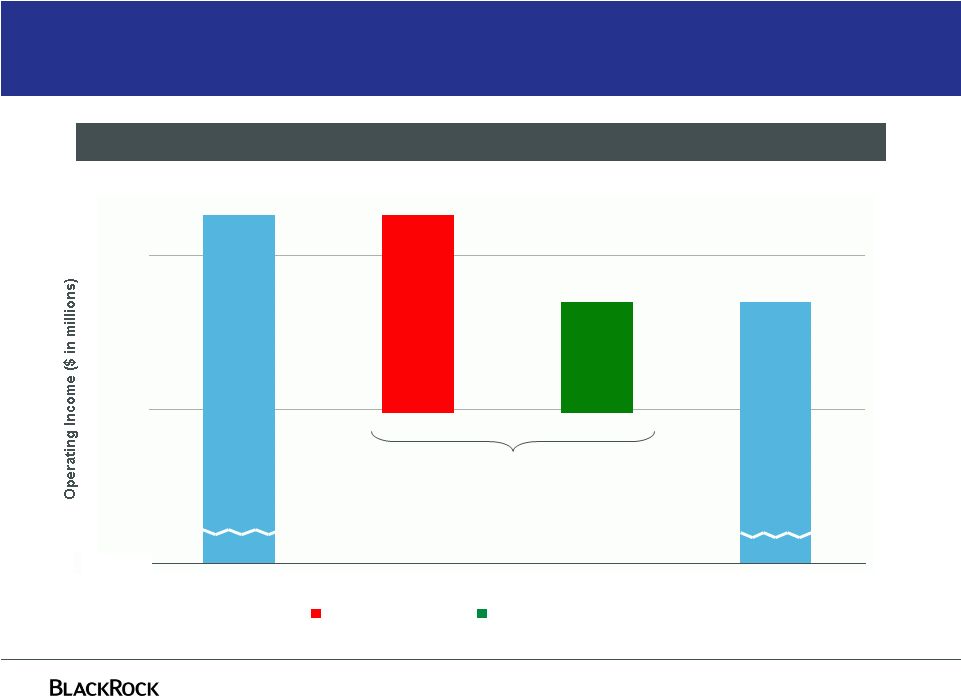
Year-over-year
operating
income
benefited
from
cost
controls
muting
market
pressures
($121) million
$0
Q4-11 Compared to Q4-10, as adjusted
For further information and reconciliation between GAAP and as adjusted, see notes
(a) through (e) in the current earnings release. Decreasing Expenses
Decreasing Revenue
$841
$962
($266)
$145
$700
$900
Q4-10
Revenue
Expenses
Q4-11 |
 7
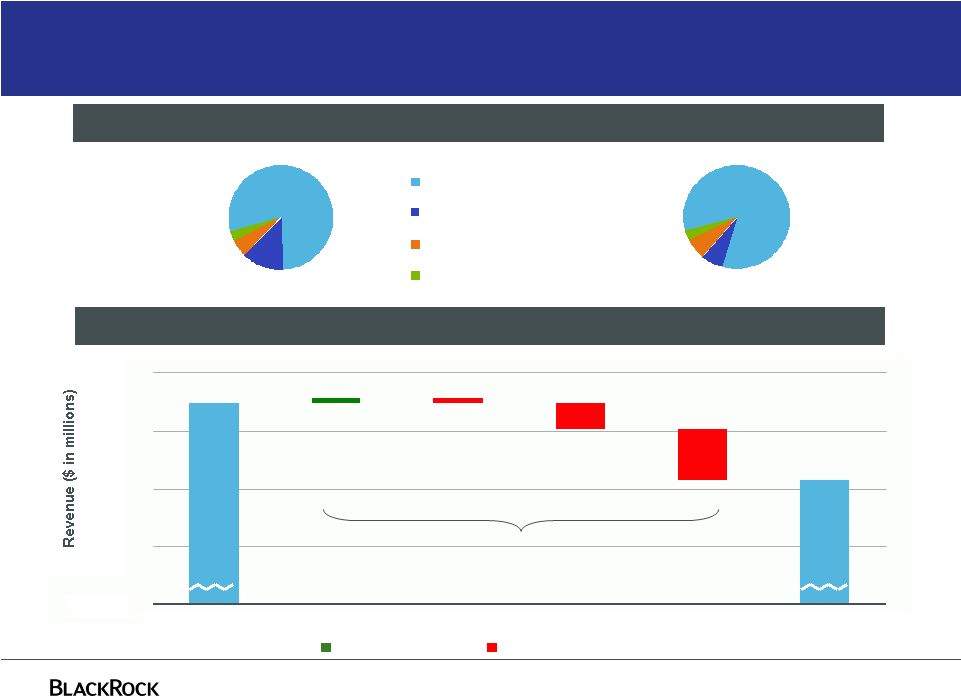
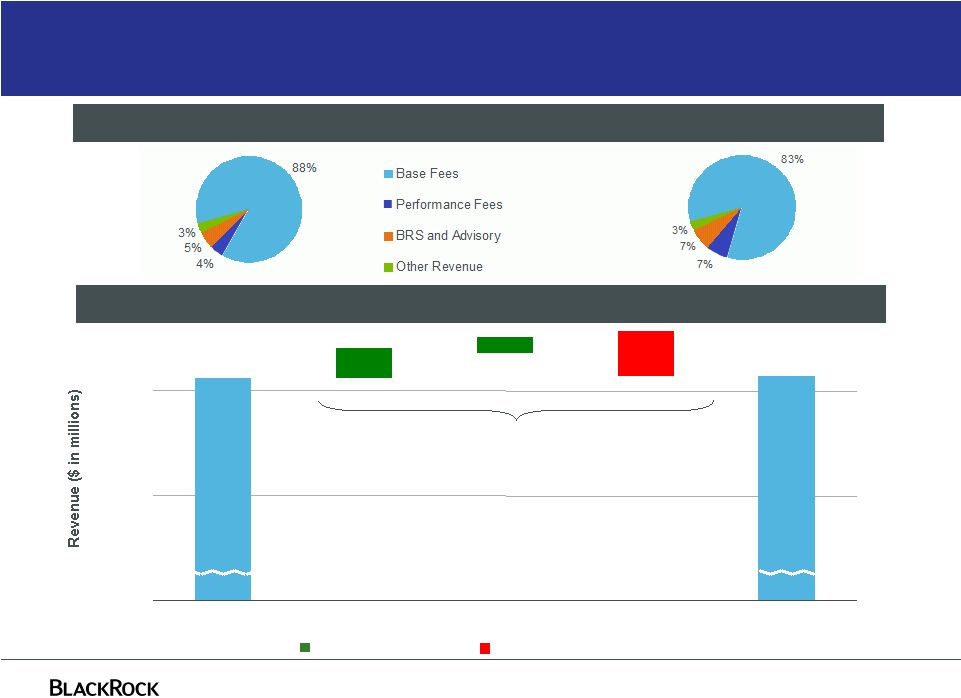
Year-over-year market stress masked benefits of organic growth in AUM and
BRS Q4-11 Compared to Q4-10
($266) million
Total Revenue
Q4-10
$2.49 billion
Q4-11
$2.23 billion
79%
13%
3%
5%
Base Fees
Performance Fees
BRS and Advisory
Other Revenue
83%
7%
7%
3%
Decreasing Revenue
Increasing Revenue
$0
$2,493
$2,227
($179)
$17
($88)
($16)
$2,000
$2,200
$2,400
$2,600
Q4-10
BRS & Advisory
Other Revenue
Base Fees
Performance Fees
Q4-11 |
 8
Market effects on year-over-year base fees balanced by organic growth and
product mix Decreasing Base Fees
Increasing Base Fees
Q4-11 Compared to Q4-10
Base fees
($88) million
Q4-11
$1.86 billion
Q4-10
$1.95 billion
$1,951
$1,863
$15
$8
$4
$1
$1
($2)
($30)
($38)
($47)
$1,700
$1,800
$1,900
$2,000
Q4-10
iShares
Fixed
Income
Active
Fixed
Income
Multi-Asset
Institutional
Index Equity
Institutional
Index Fixed
Income
Alternatives
iShares
Equity
Cash
Active
Equity
Q4-11
$0
24%
24%
9%
9%
22%
22%
5%
5% |
 9
9% year-over-year expense decline across all expense categories
Increasing Expenses
Decreasing Expenses
Expenses, as adjusted, by Category
Q4-11 Compared to Q4-10, as adjusted
For further information and reconciliation between GAAP and as adjusted, see notes
(a) through (e) in the current earnings release. $0
($145) million
Q4-11
$1.39 billion
Q4-10
$1.53 billion
$1,386
$1,531
($68)
($46)
($19)
($6)
($5)
($1)
$1,300
$1,400
$1,500
$1,600
Q4-10
Amort.-
Intangible
Assets
Amort.-
Deferred
Commissions
Direct Fund
Expenses
Distribution Compensation
& Servicing
& Benefits
G&A
Q4-11 |
 Sequential Quarters
Q4 2011 vs. Q3 2011
10 |
 11
Sequential EPS reflects improved non-operating EPS
$3.14
$3.12
$0.21
$0.02
($0.30)
$0.20
$0.70
$1.20
$1.70
$2.20
$2.70
$3.20
$3.70
Q3-11 EPS
Operating EPS
Non-Operating EPS
Q4-11 EPS
$0.23
Increasing EPS
For further information and reconciliation between GAAP and as adjusted, see notes
(a) through (e) in the current earnings release. Q4-11 Compared to
Q3-11, as adjusted Total EPS:
$3.06
Operating
EPS:
Non-Operating:
($0.29)
Non-Operating:
($0.08)
Total EPS:
$2.83
Operating
EPS: |
 12
Sequential operating income stable
Q4-11 Compared to Q3-11, as adjusted
($8) million
$0
For further information and reconciliation between GAAP and as adjusted, see notes
(a) through (e) in the current earnings release. Increasing Expense
Increasing Revenue
$849
$841
$2
($10)
$600
$700
$800
$900
Q3-11
Revenue
Expenses
Q4-11 |
 13
Sequential revenue driven by growth in performance fees and BRS offset by market
effects $2 million
Decreasing Revenue
$0
Q4-11 Compared to Q3-11
Increasing Revenue
Total Revenue
Q4-11
$2.23 billion
Q3-11
$2.23 billion
$2,227
$2,225
$32
($86)
$56
$2,000
$2,200
Q3-11
Performance Fees
BRS & Advisory
Base Fees
Q4-11 |
 14
Sequential base fee decline reflected organic growth offset by market effects
($86) million
Decreasing Base Fees
Increasing Base Fees
Base Fees
$0
Q4-11 Compared to Q3-11
Q3-11
$1.95 billion
Q4-11
$1.86 billion
$1,700
$1,800
$1,900
$2,000
$1,863
$1,949
($46)
($24)
($9)
($6)
($5)
($3)
($1)
$1
$7
Q3-11
iShares
Fixed
Income
Institutional
Index Fixed
Income
Cash
Active
Fixed
Income
Institutional
Index Equity
Multi-Asset
Alternatives
iShares
Equity
Active
Equity
Q4-11
22%
22%
5%
5% |
 15
Sequential expenses remained relatively stable
Increasing Expenses
Decreasing Expenses
$0
Q3-11
$1.38 billion
Expense, as adjusted, by Category
Q4-11 Compared to Q3-11, as adjusted
For further information and reconciliation between GAAP and as adjusted, see notes
(a) through (e) in the current earnings release. $10 million
Q4-11
$1.39 billion
$1,386
$1,376
($11)
($3)
($2)
$11
$15
$1,300
$1,400
$1,500
Q3-11
G&A
Compensation &
Benefits
Amort.-
Deferred
Commissions
Distribution &
Servicing
Direct Fund
Expenses
Q4-11 |
 Non-operating and cash flow
16 |
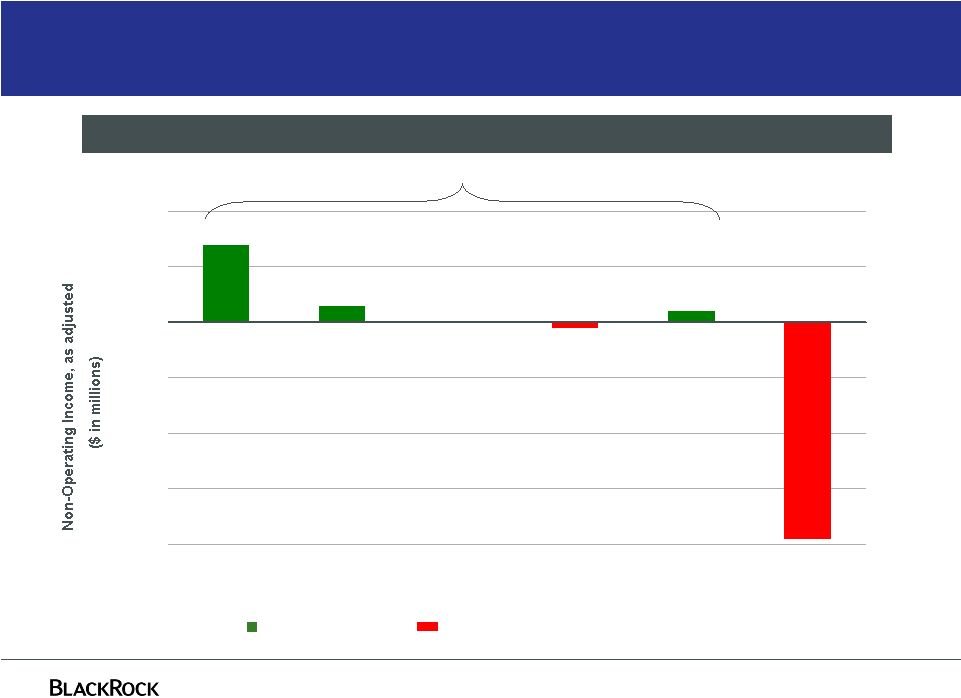 17
For further information and reconciliation between GAAP and as adjusted, see notes
(a) through (e) in the current earnings release. Q4 2011 net investment gains
driven by private equity valuations $14
$0
$3
($1)
$2
($39)
($40)
($30)
($20)
($10)
$0
$10
$20
Private Equity
Real Estate
Distressed Credit/
Mortgage Funds
Hedge Funds/
Funds of Hedge
Funds
Other Investments
Net Interest
Expense
Q4-11 $21 million Non-Operating Expense by Category, as adjusted
Investment Losses/ Net Interest Expense
Investment Gains
$18 million Net
Investment Gains |
 18
Strong 2011 operating cash flow and payout ratio
Notes:
(A) Payout ratio = (dividends + share repurchases) / GAAP net income.
$0.7
$0.6
$1.9
$1.4
$2.5
$2.9
$0.0
$0.5
$1.0
$1.5
$2.0
$2.5
$3.0
2006
2007
2008
2009
2010
Est. 2011
Payout
ratio
reflects
dividend
growth
and
$2.6
billion
of
buybacks
2011 Operating cash flow exceeded 2010
GAAP
as adjusted
For further information and reconciliation between GAAP and as adjusted, see the
Company’s Form 10-Qs and Form 10-Ks.
$0.7
$0.9
$1.5
$1.2
$2.6
$2.7
2/17/06
2/27/07
2/15/08
N/A
2/25/10
2/24/11
Dividend Change
Declared:
157% with $2.5 bn May buyback
Excludes $2.5 bn May buyback |
 AUM
and flows 19 |
 20
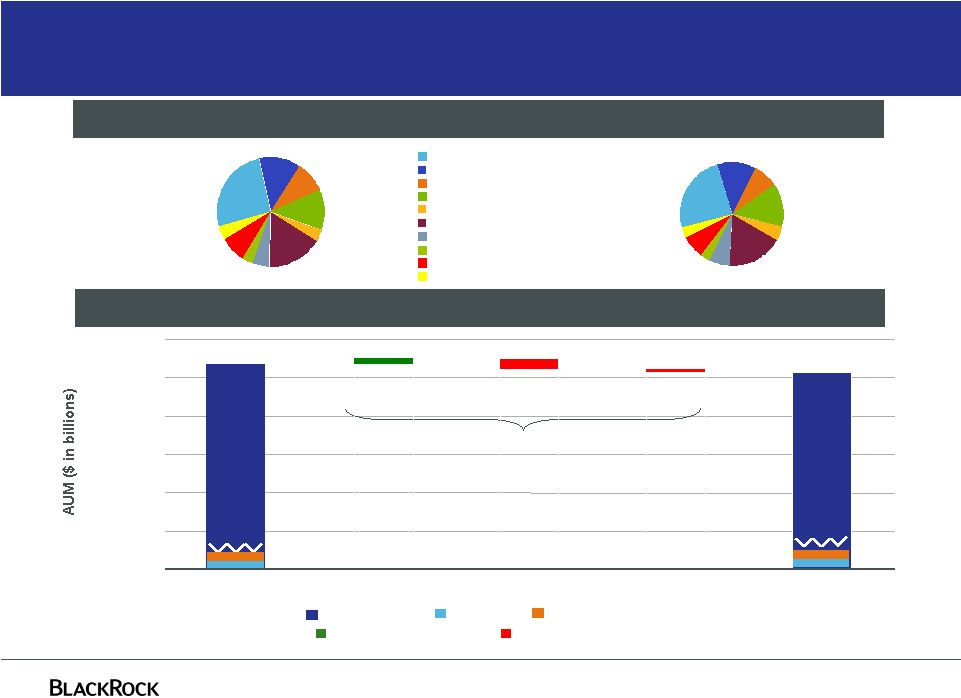
Year-over-year AUM declines driven by equity markets
Q4-10 Compared to Q4-11
$0
($20) billion
Total AUM
Q4-10
$3.561 trillion
Q4-11
$3.513 trillion
5%
3%
8%
4%
17%
26%
13%
3%
12%
9%
Index EQ
iShares EQ
Active EQ
Index FI
iShares FI
Active FI
Multi Asset
Alternatives
Cash
Advisory
6%
3%
7%
3%
18%
25%
12%
4%
14%
8%
$500
Cash AUM
Long-term AUM
Decreasing AUM
Increasing AUM
Advisory AUM
(1)
$3,513
($7)
($28)
$15
$3,533
$3,100
$3,200
$3,300
$3,400
$3,500
$3,600
Q4-10
Net New Business
Market
FX
Q4-11
(1)
Amount excludes $28 billion BGI merger-related outflows, outflows due to manager
concentration considerations prior to third quarter 2011 and outflows from scientific active equity performance prior to second quarter 2011.
|
 21
Sequential AUM growth driven by flows and markets
Q3-11 Compared to Q4-11
$0
$168 billion
Total AUM
Q3-11
$3.345 trillion
Q4-11
$3.513 trillion
6%
3%
7%
4%
19%
24%
12%
4%
13%
8%
Index EQ
iShares EQ
Active EQ
Index FI
iShares FI
Active FI
Multi Asset
Alternatives
Cash
Advisory
6%
3%
7%
3%
18%
25%
12%
4%
14%
8%
$500
Cash AUM
Long-term AUM
Decreasing AUM
Increasing AUM
Advisory AUM
$3,513
$3,345
$25
($6)
$149
$3,100
$3,200
$3,300
$3,400
$3,500
$3,600
Q3-11
Net New Business
Market
FX
Q4-11 |
 Appendix
22 |
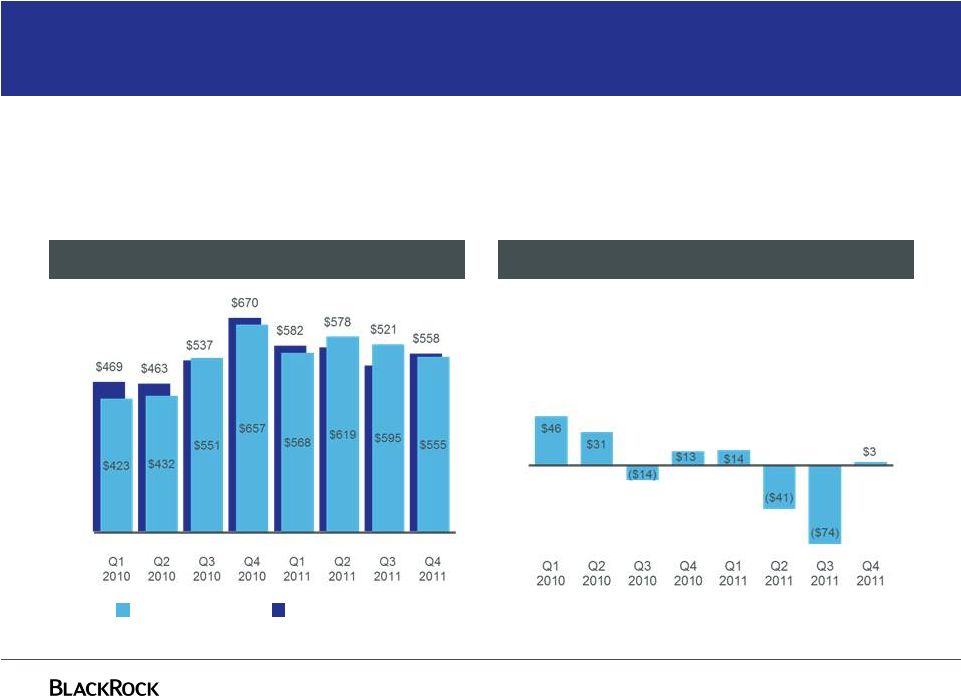
 23
Quarterly
operating
income
–
GAAP
and
as
adjusted
GAAP
as adjusted
Operating Income ($ in millions)
Non-GAAP Adjustments ($ in millions)
Non-GAAP
adjustments
include
BGI
integration
costs,
PNC
LTIP
funding
obligation,
Merrill
Lynch
compensation
contribution, UK lease exit costs, restructuring charges, and compensation related to
appreciation (depreciation) on certain deferred compensation plans
For further information and reconciliation between GAAP and as adjusted, see notes
(a) through (e) in the current earnings release, 2010 Form 10-K or 2011 Form 10-Qs. |
 24
Quarterly
net
income
–
GAAP and as adjusted
Net Income ($ in millions)
Non-GAAP Adjustments ($ in millions)
Non-GAAP
adjustments
include
BGI
integration
costs,
PNC
LTIP
funding
obligation, Merrill Lynch compensation
contribution,
UK
lease
exit
costs,
restructuring
charges,
income
tax
law changes and a state tax election
GAAP
as adjusted
For further information and reconciliation between GAAP and as adjusted, see notes
(a) through (e) in the current earnings release, 2010 Form 10-K or 2011 Form 10-Qs. |
 25
GAAP
as adjusted
Quarterly
non-operating
income
–
GAAP
and
as
adjusted
Non-Operating Income (Expense) ($ in millions)
Non-GAAP Adjustments ($ in millions)
Non-GAAP adjustments include net income (loss) attributable to
non-controlling interests, and compensation expense related to
(appreciation) depreciation on certain deferred compensation plans For further
information and reconciliation between GAAP and as adjusted, see notes (a) through (e) in the current earnings release, 2010 Form 10-K or 2011 Form 10-Qs. |
 26
Forward-looking statements
This presentation, and other statements that BlackRock may make, may contain forward-looking
statements within the meaning of the Private Securities Litigation Reform Act, with respect to
BlackRock’s future financial or business performance, strategies or expectations.
Forward-looking statements are typically identified by words or phrases such as “trend,” “potential,” “opportunity,”
“pipeline,” “believe,” “comfortable,” “expect,”
“anticipate,” “current,” “intention,” “estimate,” “position,” “assume,” “outlook,” “continue,”
“remain,” “maintain,” “sustain,” “seek,” “achieve,”
and similar expressions, or future or conditional verbs such as “will,” “would,”
“should,” “could,” “may” or similar expressions.
BlackRock cautions that forward-looking statements are subject to numerous assumptions, risks and
uncertainties, which change over time. Forward-looking statements speak only as of
the date they are made, and BlackRock assumes no duty to and does not undertake to update
forward-looking statements. Actual results could differ materially from those anticipated in forward-looking
statements and future results could differ materially from historical performance. In
addition to risk factors previously disclosed in BlackRock’s Securities and Exchange Commission (“SEC”) reports and those
identified elsewhere in this presentation the following factors, among others, could cause actual
results to differ materially from forward-looking statements or historical performance: (1)
the introduction, withdrawal, success and timing of business initiatives and strategies; (2)
changes and volatility in political, economic or industry conditions, the interest rate environment, foreign exchange
rates or financial and capital markets, which could result in changes in demand for products or
services or in the value of assets under management; (3) the relative and absolute investment
performance of BlackRock’s investment products; (4) the impact of increased competition;
(5) the impact of capital improvement projects; (6) the impact of future acquisitions or divestitures; (7) the
unfavorable resolution of legal proceedings; (8) the extent and timing of any share repurchases; (9)
the impact, extent and timing of technological changes and the adequacy of intellectual
property and information security protection; (10) the impact of legislative and regulatory
actions and reforms, including the Dodd-Frank Wall Street Reform and Consumer Protection Act, and regulatory,
supervisory or enforcement actions of government agencies relating to BlackRock, Barclays Bank PLC or
The PNC Financial Services Group, Inc.; (11) terrorist activities, international hostilities
and natural disasters, which may adversely affect the general economy, domestic and local
financial and capital markets, specific industries or BlackRock; (12) the ability to attract and retain
highly talented professionals; (13) fluctuations in the carrying value of BlackRock’s economic
investments; (14) the impact of changes to tax legislation and, generally, the tax position of
the Company; (15) BlackRock’s success in maintaining the distribution of its products; (16)
the impact of BlackRock electing to provide support to its products from time to time; and (17) the impact of
problems at other financial institutions or the failure or negative performance of products at other
financial institutions. |
 |