Attached files
| file | filename |
|---|---|
| 8-K - FORM 8-K - PNC FINANCIAL SERVICES GROUP, INC. | d279873d8k.htm |
| EX-99.1 - FINANCIAL SUPPLEMENT (UNAUDITED) FOR FOURTH QUARTER 2011 - PNC FINANCIAL SERVICES GROUP, INC. | d279873dex991.htm |
 The PNC
Financial Services Group, Inc. Fourth Quarter and Full Year 2011
Earnings Conference Call
January 18, 2012
Exhibit 99.2 |
 2
Cautionary Statement Regarding Forward-Looking
Information and Adjusted Information |
 3
Today’s Discussion
Significant 2011 achievements and financial
highlights
Strong growth in customers, loans and deposits
Delivered strong returns
Positioned to achieve strong results in 2012
PNC Continues to Build a Great Company.
PNC Continues to Build a Great Company. |
 4
Significant 2011 Achievements
PNC’s Business Model Delivered Strong Results in 2011.
2011 financial
summary
Net income
Diluted EPS from
net income
Return on
average assets
$3.1 billion
$5.64
1.16%
Delivered good financial results through exceptional client growth across businesses and
markets
Grew commercial loans
Maintained a high quality balance sheet that reflected an overall moderate risk profile
Managed expenses while investing for growth in our businesses
Continued to maintain strong capital levels and liquidity positions
Expansion in attractive growth markets
2011 highlights |
 5
-$2.3
$0.8
FY10
FY11
Focused on Growing Client Relationships
Asset Management Group
Retail Banking
Corporate & Institutional Banking
Discretionary AUM Total
Net Flows
4
1,012
1,165
FY10
FY11
2011 referral sales
5
up 52% vs.
2010
2011 new primary
clients³
up 26%
vs. 2010
Total sales have increased by 38%
for 2011 vs. 2010
New clients represent 12% of total
existing primary clients at
December 31, 2011
Strong 2011 sales across all
markets and client segments
2011 total growth of 5.4%, greater
than 1.2% footprint population
growth
Active online bill payment customers
showed total
growth² of 2.4%
from 3Q11, 13% from 4Q10
Corporate Banking new primary
clients
3
Checking relationship
growth
1
75
296
FY10
FY11
+
+ |
 6
Delivering Long-Term Shareholder Value
$7.06
$9.91
2007
2011
4
40%
23%
17%
13%
11%
-8%
-29%
-36%
-43%
-55%
-57%
-68%
-84%
PNC
Peer 1
Peer 2
Peer 3
Peer 4
Peer 5
Peer 6
Peer 7
Peer 8
Peer 9
Peer 10
Peer 11
Peer 12
$17.58
$44.38
12/31/07
12/31/11
Pretax pre-provision earnings per share¹
PNC
% change 2007-2011²
Tangible book value per share³
152%
72%
71%
48%
36%
24%
18%
-2%
-5%
-10%
-15%
-42%
-44%
PNC
Peer 1
Peer 2
Peer 3
Peer 4
Peer 5
Peer 6
Peer 7
Peer 8
Peer 9
Peer 10
Peer 11
Peer 12
PNC
% change 2007-2011² |
 7
2011 Risk Management Progress
Credit, Market and Operational risk
–
Credit costs significantly improved
–
Continued to position balance sheet for rising interest rates
–
Repositioned retail deposit products and reduced higher cost retail CDs
–
Added new clients and loans at lower risk weighting
–
Continued enhancements to risk management capabilities and
technologies
Reputational and Industry risk
–
Settled (or has settlements pending) several meaningful legal matters
–
Increased residential mortgage foreclosure-related expenses primarily
as a result of ongoing governmental matters
–
Implemented several new regulatory requirements
Strategic Positioning
–
Enhanced strong capital and liquidity positions
–
Strengthened brand recognition and awareness
–
Announced RBC Bank (USA) acquisition to expand in attractive growth
markets |
 8
Financial Performance –
Fourth Quarter Highlights
Continued focus on high quality loan growth
Delivered strong revenue performance
–
NII growth driven by increase in core net interest income
–
Noninterest income grew excluding the impact of regulatory
changes¹
Overall improved credit quality resulted in reduced credit costs
Expenses
were elevated due to several items
–
1Q12
estimated
expenses²
expected to be more consistent with
3Q11
Capital and liquidity positions continued to be strong
4Q11 financial
summary
Net income
Diluted EPS from
net income
Tier 1 common
ratio
$493 million
$0.85
10.3%³
(1)
Further information is provided in the Appendix. (2)Excluding legal and regulatory related
contingencies, integration costs, additional capital actions related to TPS
redemptions, and additional residential mortgage foreclosure-related costs. (3) Estimated. |
 9
A Higher Quality, Differentiated Balance Sheet
Change from:
Category (billions)
Dec. 31,
2011
Sep. 30,
2011
Dec. 31,
2010
Total investment securities
$60.6
$(1.5)
$(3.6)
Core commercial
loans¹
86.7
3.6
9.6
Core consumer
loans¹
59.9
1.4
1.2
Non-strategic
loans²
12.4
(0.5)
(2.4)
Total loans
159.0
4.5
8.4
Other assets
51.6
(1.3)
2.1
Total assets
$271.2
$1.7
$6.9
Transaction deposits
$147.6
$4.6
$13.0
Retail CDs
29.5
(2.9)
(7.8)
Other
10.9
(1.5)
(0.6)
Total deposits
188.0
0.2
4.6
Borrowed funds, other
49.1
1.7
(1.5)
Shareholders’
equity
34.1
(0.2)
3.8
Total liabilities and equity
$271.2
$1.7
$6.9
Loans increased $4.5 billion or
3% linked-quarter driven by
commercial and consumer loans
Transaction deposits increased
$4.6 billion or 3% linked-quarter
reflecting increased commercial
and consumer liquidity
Retail CDs declined $2.9 billion
linked-quarter reflecting
expected run-off of higher cost
CDs
As of December 31, 2011,
equity increased 13% compared
to year-end 2010
4Q11 highlights
(1) Excludes loans assigned to the Non-Strategic Assets (formerly Distressed Assets
Portfolio) Portfolio business segment. (2) Represents loans assigned to the
Non-Strategic Assets Portfolio business segment. |
 10
Credit Trends Continue to Improve
$791
$533
$414
$365
$327
$442
$421
$280
$261
$190
4Q10
1Q11
2Q11
3Q11
4Q11
Nonperforming
loans
2,5
Provision and net charge-offs
Criticized commercial loans
30-89 Days
90 Days +
Accruing
loans
past
due
2,3
$2.7
$2.6
$2.6
$2.8
$3.0
$1.8
$1.9
$1.5
$1.6
$1.6
4Q10
1Q11
2Q11
3Q11
4Q11
$13.7
$12.7
$11.7
$10.8
$9.9
4Q10
1Q11
2Q11
3Q11
4Q11
Criticized Commercial
loans¹
Provision
Net charge-offs
4Q10
1Q11
2Q11
3Q11
4Q11
Total nonperforming loans
$4.5
$4.3
$3.9
$3.7
$3.6 |
 11
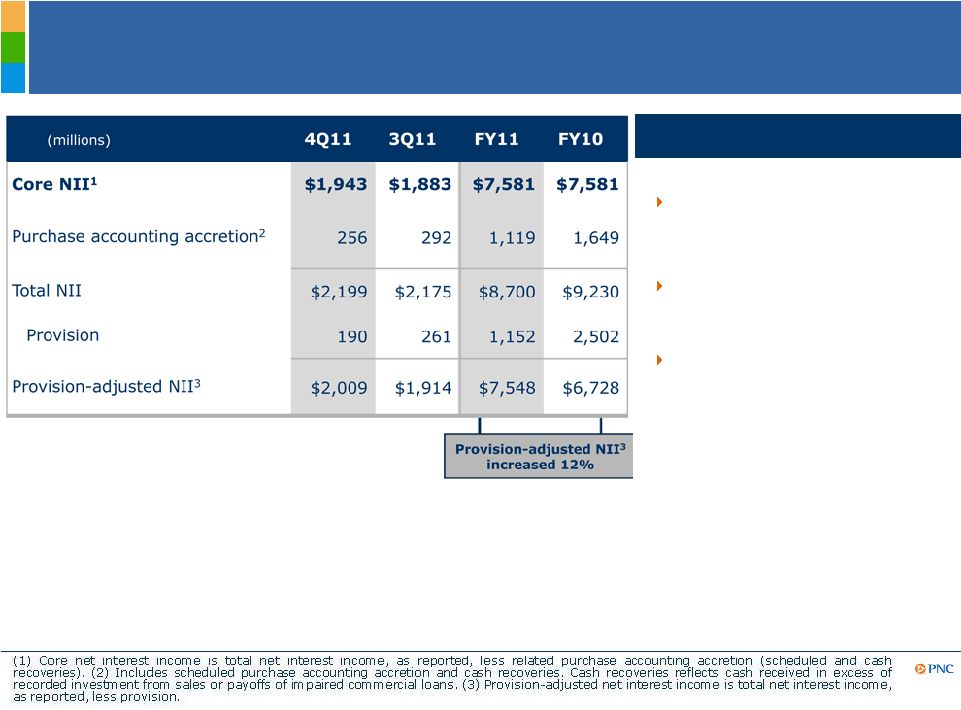
Improving Net Interest Income and Provision Trends
Highlights
Quarterly:
Total NII improved from 3Q11 due
to growth in core NII
1
, partially
offset by lower purchase
accounting accretion
Provision declined as overall credit
quality continued to improve
Full Year 2011:
Provision-adjusted NII
3
increased
12% as core NII remained stable
while significantly lower provision
more than offset the expected
decline in purchase accounting
accretion |
 12
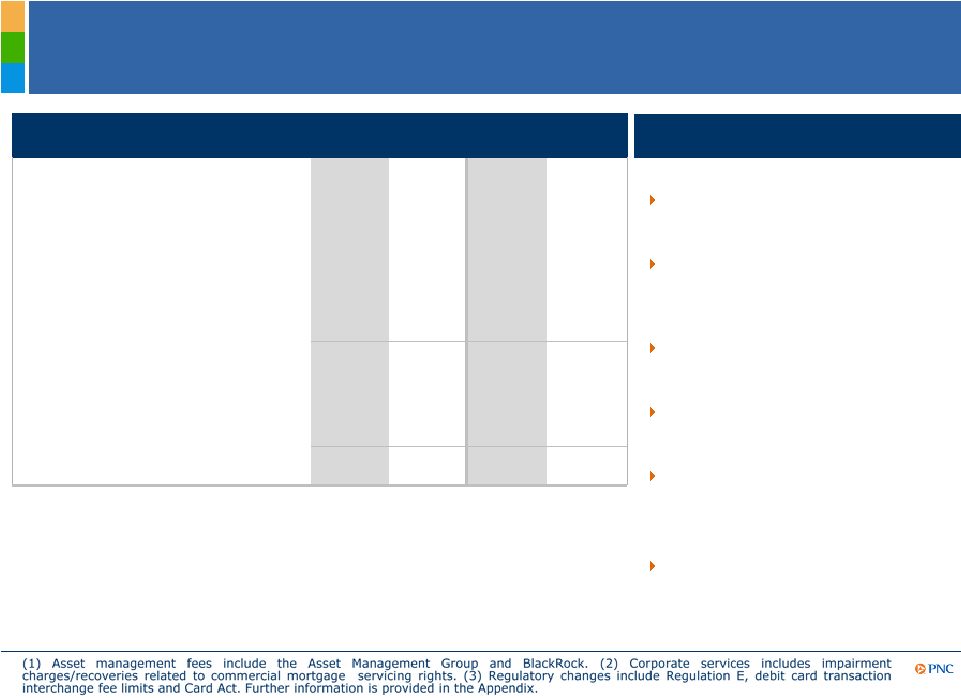
Client Growth and Sales Momentum Provide
Opportunities to Increase Noninterest Revenue
4Q11 highlights
(millions)
4Q11
3Q11
FY11
FY10
Asset management
1
$250
$287
$1,088
$1,054
Consumer services
269
330
1,243
1,261
Corporate services
2
266
187
898
1,082
Residential mortgage
157
198
713
699
Deposit service charges
140
140
534
705
Client fee income
$1,082
$1,142
$4,476
$4,801
Net gains on sales of
securities
less net OTTI
18
33
97
101
Other
250
194
1,053
1,044
Total noninterest income
$1,350
$1,369
$5,626
$5,946
Quarterly:
Asset management declined
partially due to a third quarter
non-cash tax benefit at BlackRock
Consumer services declined
reflecting regulatory impact on
debit card interchange fees of $75
million
Corporate services increased
primarily due to a valuation
impairment of CMSR in 3Q11
Residential mortgage decreased
primarily from lower MSR hedge
gains
Other improved primarily due to
higher values on deferred
compensation hedges
Full Year 2011:
Noninterest income decline
primarily driven by impact of
regulatory changes
3 |
 13
Well–Managed Expenses While Investing for Growth
(millions)
4Q11
3Q11
FY11
FY10
Personnel
$1,052
$949
$3,966
$3,906
Occupancy
198
171
738
730
Equipment
177
159
661
668
Marketing
74
72
249
266
Other
1,218
789
3,491
3,043
Total noninterest expense
$2,719
$2,140
$9,105
$8,613
PNC is Committed to Disciplined Expense Management.
PNC is Committed to Disciplined Expense Management.
Highlights
Quarterly:
Personnel increased primarily due to higher
personnel expenses largely driven by higher
stock market prices and higher business
production
Occupancy and Equipment increased due to
a lease termination and equipment write-
offs
Other increased primarily due to higher
residential mortgage foreclosure-related
expenses and trust preferred securities
redemption charge
Full Year 2011:
Excluding residential mortgage foreclosure-
related expenses and trust preferred
securities redemption charges, noninterest
expense remained flat
1
First Quarter Outlook:
Excluding RBC Bank (USA) integration and
other costs, 1Q12 expenses
2
expected to
return to 3Q11 levels
(1) Further information is provided in the Appendix. (2) Excluding legal and regulatory
related contingencies, integration costs, additional capital actions related to
remaining TPS redemption, and additional residential mortgage foreclosure-related costs. |
 14
Strong Capital and Liquidity Position
Highlights
Tier 1 common ratio
Proforma Basel III Tier 1 common ratio estimated
to be between 8.0-8.5%
1
during 2013
–
Possible improvement assuming final capital
requirements reflect the inherent risk profile
in our sub-investment grade securities
Capital priorities:
–
Build capital to support client growth and
business investment
–
Maintain appropriate capital in light of
economic uncertainty
–
Return excess capital to shareholders
Strong liquidity position
–
Loan-to-deposit ratio of 85%
–
Parent company two year liquidity coverage
4
of 172% |
 15
Outlook
1
–
Full Year 2012 vs. 2011
PNC is Positioned to Deliver Strong Results in 2012.
PNC is Positioned to Deliver Strong Results in 2012.
Estimated % Change
3
Combined
2
Balance sheet
Loans
Increase mid to high teens
Total revenue
Increase mid to high single digits
Combined
2
Income
statement
Net interest income
Increase mid to high single digits
Noninterest income
Increase mid single digits
Noninterest expense
Increase mid single digits
4
Loan loss provision
Stable
5
PNC stand-alone positioned for strong results in 2012
RBC Bank (USA) pending acquisition expected to be accretive in 2012,
excluding integration costs
(1) Refer to the Cautionary Statement in the Appendix, including assumptions. (2) Reflects
combined PNC and RBC Bank (USA). (3) Estimated change for 2012 is based on 2011
reported results. (4) Excluding legal and regulatory related contingencies, integration costs and any
additional capital actions related to TPS redemptions for 2011 and 2012. (5) Excluding legal
and regulatory related contingencies. |
 16
Cautionary Statement Regarding Forward-Looking
Information
Appendix |
 17
Cautionary Statement Regarding Forward-Looking
Information (continued)
Appendix |
 18
Cautionary Statement Regarding Forward-Looking
Information (continued)
Appendix |
 19
Non-GAAP to GAAP Reconcilement
Appendix
In millions
Dec. 31, 2007
Dec. 31, 2011
% Change
Total revenue
$6,705
$14,326
Noninterest expense
4,296
9,105
Pretax pre-provision earnings
$2,409
$5,221
Common shares outstanding
341
527
Pretax pre-provision earnings per share
$7.06
$9.91
40%
PNC
believes
that
pretax
pre-provision
earnings
from
continuing
operations,
a
non-GAAP
measure,
is
useful
as
a
tool
to help evaluate ability to provide for credit costs through operations.
For the year ended
As of
In millions except per share data
Dec. 31, 2007
Dec. 31, 2011
% Change
Common shareholders' equity
$14,847
$32,417
Common shares outstanding
341
527
Book value per common share
$43.60
$61.52
41%
Goodwill and other intangible assets other than servicing rights (1)
$8,853
$9,027
Common shareholders' equity less intangible assets
$5,994
$23,390
Common shares outstanding
341
527
Tangible book value per common share
$17.58
$44.38
152%
PNC
believes
that
tangible
book
value
per
common
share,
a
non-GAAP
measure,
is
useful
as
a
tool
to
help
evaluate
the
amount,
on
a
per
share
basis,
of
goodwill
and
certain
other
intangible
assets
included
in
book
value
per
common
share.
(1) Servicing rights were $701 million and $1,115 million at December 31, 2007 and December
31, 2011, respectively. |
 20
Non-GAAP to GAAP Reconcilement
Appendix
Year over year
$ in millions
Dec. 31, 2011
Sept. 30, 2011
June 30, 2011
Mar. 31, 2011
Dec. 31, 2010
% Change
Accruing loans past due, 30-89 days
$1,565
$1,551
$1,498
$1,868
$1,817
Accruing loans past due, 90+ days
2,973
2,768
2,646
2,645
2,709
Total accruing loans past due
$4,538
$4,319
$4,144
$4,513
$4,526
0%
Government guaranteed/insured loans
3,031
2,821
2,658
2,617
2,624
16%
Total accruing loans past due,
excluding government guaranteed/insured loans
$1,507
$1,498
$1,486
$1,896
$1,902
-21%
For the three months ended
PNC believes that information adjusted for the impact of certain items may be useful to help
evaluate the impact of those items on our operations. |
 21
Non-GAAP to GAAP Reconcilement
Appendix
2011 vs. 2010
In millions
Dec. 31, 2011
Sept. 30, 2011
Dec. 31, 2011
Dec. 31, 2010
% Change
Total noninterest income, as reported
$1,350
$1,369
$5,626
$5,946
-5%
Adjustments for negative impact of regulatory changes:
Regulation E
100
90
345
145
Credit Card Act
5
5
20
15
Debit card transaction interchange fee limits
75
-
75
-
Total noninterest income, as adjusted
$1,530
$1,464
$6,066
$6,106
-1%
2011 vs. 2010
In millions
Dec. 31, 2011
Sept. 30, 2011
Dec. 31, 2011
Dec. 31, 2010
% Change
Total noninterest expense, as reported
$2,719
$2,140
$9,105
$8,613
6%
Adjustments:
Trust preferred securities redemption charge
198
-
198
-
Residential mortgage foreclosure-related expenses
240
63
324
71
Total noninterest expense, as adjusted
$2,281
$2,077
$8,583
$8,542
0%
PNC believes that information adjusted for the impact of certain items may be useful to help
evaluate the impact of those items on our operations.
For the year ended
For the quarter ended
PNC believes that information adjusted for the impact of certain items may be useful to help
evaluate the impact of those items on our operations.
For the quarter ended
For the year ended |
 22
Peer Group of Banks
Appendix
The PNC Financial Services Group, Inc.
PNC
BB&T Corporation
BBT
Bank of America Corporation
BAC
Capital One Financial, Inc.
COF
Comerica Inc.
CMA
Fifth Third Bancorp
FITB
JPMorgan Chase
JPM
KeyCorp
KEY
M&T Bank
MTB
Regions Financial Corporation
RF
SunTrust Banks, Inc.
STI
U.S. Bancorp
USB
Wells Fargo & Co.
WFC
Ticker |