Attached files
| file | filename |
|---|---|
| EX-5.1 - EX-5.1 - Dynamic Offshore Resources, Inc. | a2206894zex-5_1.htm |
| EX-23.3 - EX-23.3 - Dynamic Offshore Resources, Inc. | a2206512zex-23_3.htm |
| EX-23.2 - EX-23.2 - Dynamic Offshore Resources, Inc. | a2206512zex-23_2.htm |
| EX-23.1 - EX-23.1 - Dynamic Offshore Resources, Inc. | a2206512zex-23_1.htm |
As filed with the Securities and Exchange Commission on January 17, 2012
Registration No. 333-176521
UNITED STATES
SECURITIES AND EXCHANGE COMMISSION
Washington, D.C. 20549
AMENDMENT NO. 6
TO
FORM S-1
REGISTRATION STATEMENT UNDER THE SECURITIES ACT OF 1933
Dynamic Offshore Resources, Inc.
(Exact name of registrant as specified in its charter)
| Delaware (State or other jurisdiction of incorporation or organization) |
1311 (Primary Standard Industrial Classification Code Number) |
45-3034172 (I.R.S. Employer Identification No.) |
1301 McKinney, Suite 900
Houston, Texas 77010
(713) 728-7840
(Address, including zip code, and telephone number, including area code, of registrant's principal executive offices)
Thomas R. Lamme
Senior Vice President and General Counsel
1301 McKinney, Suite 900
Houston, Texas 77010
(713) 728-7840
(Name, address, including zip code, and telephone number, including area code, of agent for service)
Copies to:
| T. Mark Kelly Matthew R. Pacey Vinson & Elkins L.L.P. 1001 Fannin, Suite 2500 Houston, Texas 77002-6760 (713) 758-2222 |
Sean T. Wheeler Ryan J. Maierson Latham & Watkins LLP 811 Main Street, Suite 3700 Houston, Texas 77002 (713) 546-5400 |
Approximate date of commencement of proposed sale to the public:
As soon as practicable after the effective date of this Registration Statement.
If any of the securities being registered on this Form are to be offered on a delayed or continuous basis pursuant to Rule 415 under the Securities Act of 1933 check the following box: o
If this Form is filed to register additional securities for an offering pursuant to Rule 462(b) under the Securities Act, please check the following box and list the Securities Act registration statement number of the earlier effective registration statement for the same offering. o
If this Form is a post-effective amendment filed pursuant to Rule 462(c) under the Securities Act, check the following box and list the Securities Act registration statement number of the earlier effective registration statement for the same offering. o
If this Form is a post-effective amendment filed pursuant to Rule 462(d) under the Securities Act, check the following box and list the Securities Act registration statement number of the earlier effective registration statement for the same offering. o
Indicate by check mark whether the registrant is a large accelerated filer, an accelerated filer, a non-accelerated filer, or a smaller reporting company. See the definitions of "large accelerated filer," "accelerated filer" and "smaller reporting company" in Rule 12b-2 of the Exchange Act.
| Large accelerated filer o | Accelerated filer o | Non-accelerated filer ý (Do not check if a smaller reporting company) |
Smaller reporting company o |
The registrant hereby amends this Registration Statement on such date or dates as may be necessary to delay its effective date until the registrant shall file a further amendment which specifically states that this Registration Statement shall thereafter become effective in accordance with Section 8(a) of the Securities Act of 1933 or until this Registration Statement shall become effective on such date as the Securities and Exchange Commission, acting pursuant to said Section 8(a), may determine.
The information in this preliminary prospectus is not complete and may be changed. We and the selling stockholders may not sell these securities until the registration statement filed with the Securities and Exchange Commission is effective. This preliminary prospectus is not an offer to sell these securities and we and the selling stockholders are not soliciting offers to buy these securities in any state where the offer or sale is not permitted.
SUBJECT TO COMPLETION, DATED JANUARY 17, 2012
Prospectus
16,666,667 Shares

Dynamic Offshore Resources, Inc.
Common Stock
Dynamic Offshore Resources, Inc. is offering 16,666,667 shares of its common stock. This is our initial public offering, and no public market currently exists for our shares. We anticipate that the initial public offering price of our common stock will be between $17.00 and $19.00 per share.
We have been approved, subject to official notice of issuance, to list our common stock on the New York Stock Exchange under the symbol "DOR".
Investing in our common stock involves risks. Please read "Risk Factors" beginning on page 20.
| |
Price to Public | Underwriting Discounts and Commissions |
Proceeds to Company |
|||||||
|---|---|---|---|---|---|---|---|---|---|---|
Per Share |
$ | $ | $ | |||||||
Total |
$ | $ | $ | |||||||
The selling stockholders have granted the underwriters the right to purchase up to an additional 2,500,000 shares of common stock to cover over-allotments. We will not receive any proceeds from the sale of shares by the selling stockholders.
The Securities and Exchange Commission and state securities regulators have not approved or disapproved of these securities, or determined if this prospectus is truthful or complete. Any representation to the contrary is a criminal offense.
The underwriters expect to deliver the shares of common stock to purchasers on , 2012.
| Citigroup | Credit Suisse | |||
| Deutsche Bank Securities | Tudor, Pickering, Holt & Co. | UBS Investment Bank |
| Capital One Southcoast | ||||||||
| FBR Capital Markets | ||||||||
| Howard Weil Incorporated | ||||||||
| IBERIA Capital Partners L.L.C. | ||||||||
| Johnson Rice & Company L.L.C. | ||||||||
| Dahlman Rose & Company | Morgan Keegan | Natixis | RBS |
The date of this prospectus is , 2012.
You should rely only on the information contained in this prospectus and any free writing prospectus prepared by or on behalf of us or to which we have referred you. Neither we nor the selling stockholders have authorized anyone to provide you with information different from that contained in this prospectus and any free writing prospectus. The information in this prospectus is accurate only as of the date of this prospectus, regardless of the time of delivery of this prospectus or any sale of the common stock.
We and the selling stockholders are offering to sell shares of common stock and seeking offers to buy shares of common stock only in jurisdictions where offers and sales are permitted. We have not taken any action to permit a public offering of the shares of common stock outside the United States or to permit the possession or distribution of this prospectus outside the United States. Persons outside the United States who come into possession of this prospectus must inform themselves about and observe any restrictions relating to the offering of the shares of common stock and the distribution of this prospectus outside the United States.
Until , 2012, all dealers that buy, sell or trade our common stock, whether or not participating in this offering, may be required to deliver a prospectus. This requirement is in addition to the dealers' obligation to deliver a prospectus when acting as underwriters and with respect to their unsold allotments or subscriptions.
This prospectus contains forward-looking statements that are subject to a number of risks and uncertainties, many of which are beyond our control. Please read "Risk Factors" beginning on page 20 and "Cautionary Note Regarding Forward-Looking Statements" beginning on page 41.
Industry and Market Data
The market data and certain other statistical information used throughout this prospectus are based on independent industry publications, government publications or other published independent sources. Some data is also based on our good faith estimates. Although we believe these third-party sources are reliable and that the information is accurate and complete, we have not independently verified the information.
i
This summary provides a brief overview of information contained elsewhere in this prospectus. Because it is abbreviated, this summary does not contain all of the information that you should consider before investing in our common stock. You should read the entire prospectus carefully before making an investment decision, including the information presented under the headings "Risk Factors," "Cautionary Note Regarding Forward-Looking Statements," "Management's Discussion and Analysis of Financial Condition and Results of Operations" and the historical consolidated financial statements and unaudited pro forma financial information and the related notes thereto included elsewhere in this prospectus. We have provided definitions for certain oil and natural gas terms used in this prospectus in the "Glossary of Oil and Natural Gas Terms" beginning on page A-1 of this prospectus.
Unless otherwise indicated, the estimated reserve volumes and related operational measures presented in this prospectus include the properties acquired in the XTO Acquisition and the MOR Transaction described under "—Recent Developments" beginning on page 6. Unless otherwise indicated, the information presented in this prospectus assumes that the underwriters' option to purchase additional shares of common stock to cover over-allotments is not exercised.
In this prospectus, unless the context otherwise requires, the terms "we," "us," "our" and the "Company" refer to Dynamic Offshore Holding, LP and its subsidiaries before the completion of our corporate reorganization and Dynamic Offshore Resources, Inc. and its subsidiaries as of and following the completion of our corporate reorganization.
Dynamic Offshore Resources, Inc.
Overview
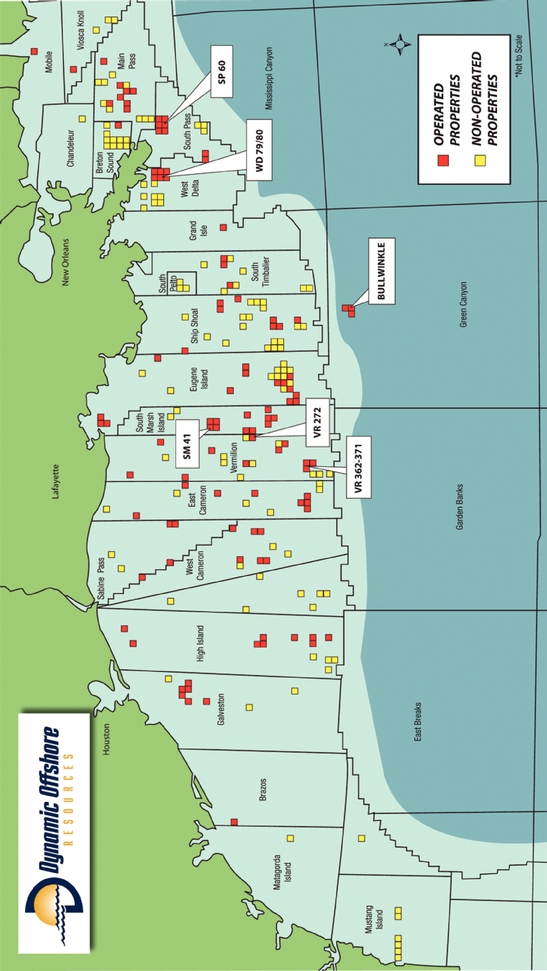
We are an independent exploration and production company focused on the acquisition and development of producing oil and natural gas properties in the Gulf of Mexico. Since we commenced operations in 2008, we have pursued an active growth strategy as an acquirer of producing assets that provide attractive development opportunities. We seek to maximize the value of our reserves through focused operations and exploitation to generate attractive cash returns. Our management team has an average of more than 28 years of energy industry experience, primarily in the Gulf of Mexico, and is experienced in the unique aspects of evaluating, acquiring and developing offshore properties.
As of July 31, 2011, our estimated net proved reserves were 60.1 MMBoe, of which 50% was oil and 81% was proved developed, with an associated PV-10 of approximately $1.7 billion, based on Securities and Exchange Commission ("SEC") pricing of $88.44 per Bbl for oil and $4.19 per MMBtu for natural gas. As of that same date, our estimated net probable reserves were 16.0 MMBoe with an associated PV-10 of approximately $370.1 million. Please read "—Summary Historical Operating and Reserve Data—Summary Reserve Data" beginning on page 15 for information on our estimated net proved and probable reserves, PV-10 and related pricing. During November 2011, our properties had aggregate average net daily production in excess of 27,000 Boe per day.
As of September 30, 2011, we had interests in approximately 270 net productive wells and over 250 offshore oil and gas leases in federal and state waters of the Gulf of Mexico, representing approximately 830,000 gross (490,000 net) acres. Importantly, we operate more than 90% of our assets based on the PV-10 of our proved oil and natural gas reserves as of July 31, 2011, allowing us to maintain better control over our asset portfolio. Our properties are predominantly located in water depths of less than 300 feet. In addition, we own a 49% interest in and operate the deepwater Bullwinkle field and associated platform, located in approximately 1,350 feet of water. Similar to our shallow water properties, the Bullwinkle field produces from a fixed-leg platform utilizing surface wellheads and blowout preventers and, consequently, is not subject to recent regulations instituted for deepwater drilling.
1
Our Acquisition History
A significant portion of our growth has been achieved through a series of acquisitions. Since we began operations in 2008, we have completed ten material acquisitions, creating significant value relative to the capital employed. Since inception, our principal equity owners have invested approximately $225 million and have received approximately $123 million in aggregate distributions from cash flows, for a net investment of $102 million. Over this same period, we have incurred a total of $555 million in debt, with $365 million of debt outstanding and $59 million of cash and cash equivalents as of December 31, 2011. As a result of these acquisitions and our operations, the PV-10 of our proved oil and natural gas reserves totaled approximately $1.7 billion as of July 31, 2011.
We believe that the Gulf of Mexico continues to represent an attractive buyer's market, given the limited number of competitors and the availability of acquisition opportunities, as other oil and natural gas companies divest their Gulf of Mexico properties. For example, on August 31, 2011, we acquired substantially all of the Gulf of Mexico assets that Exxon Mobil Corporation ("Exxon") acquired as part of its acquisition of XTO Energy Inc. in 2010. Please read "—Recent Developments—XTO Acquisition" beginning on page 7. We will continue to be opportunistic in evaluating potential acquisition targets, which we expect will include both shallow water properties and properties in deeper waters with characteristics similar to the Bullwinkle field.
The following table presents key metrics related to each of our material acquisitions. For more information, please read "Business—Our Acquisition History" beginning on page 70.
| |
|
|
As of Acquisition Date(1) | |||||||||||
|---|---|---|---|---|---|---|---|---|---|---|---|---|---|---|
Acquisition
|
Acquisition Date |
Major Fields | Net Proved Reserves (MMBoe) |
% Oil | % Proved Developed |
|||||||||
SPN Resources(2) |
March 2008 | South Pass 60, West Delta 79/80 | 10.2 | 57 | % | 90 | % | |||||||
Northstar |
July 2008 | Eugene Island 307, Eugene Island 32 | 8.7 | 46 | % | 75 | % | |||||||
Bayou Bend Petroleum |
May 2009 | Marsh Island | 0.6 | 13 | % | 73 | % | |||||||
Beryl Oil and Gas(2) |
October 2009 | Vermilion 362-371 | 14.3 | 25 | % | 85 | % | |||||||
Shell |
January 2010 | Bullwinkle | 6.2 | 89 | % | 68 | % | |||||||
Samson Resources |
July 2010 | Vermilion 272, High Island 52 | 4.9 | 48 | % | 92 | % | |||||||
Providence Resources |
March 2011 | Ship Shoal 252/253, Main Pass 19 | 1.4 | 22 | % | 82 | % | |||||||
Gryphon Exploration |
May 2011 | High Island 52, Ship Shoal 301 | 2.1 | 12 | % | 100 | % | |||||||
XTO |
August 2011 | South Marsh Island 41, West Cameron 485/507 | 13.5 | 39 | % | 72 | % | |||||||
MOR |
September 2011 | South Pass 60, West Delta 79/80 | (3) | 3.4 | 65 | % | 92 | % | ||||||
- (1)
- Based
on reserve reports or our internally generated reserve estimates prepared at or near the acquisition date.
- (2)
- Includes
interests subsequently acquired from Superior in exchange for a 10% equity interest in us.
- (3)
- We acquired from MOR the remaining 25% working interest in the properties that we acquired from SPN Resources in 2008.
Since our inception, we have acquired 65.5 MMBoe of net proved reserves through ten material acquisitions (including the XTO Acquisition and the MOR Transaction) and as of July 31, 2011, have produced 14.7 MMBoe. At July 31, 2011, our estimated net proved reserves were 60.1 MMBoe (including the additional reserves that we acquired in the XTO Acquisition and the MOR Transaction).
Our Significant Fields
All of our oil and natural gas properties are located in federal and state waters in the Gulf of Mexico. In the aggregate, our six largest fields accounted for approximately 66% of the PV-10 of our proved oil and natural gas reserves as of July 31, 2011. Our largest fields include the following:
- •
- Bullwinkle field: The Bullwinkle field is located in approximately 1,350 feet of water and encompasses all of Green Canyon blocks 65, 108 and 109. Cumulative production from our
2
- •
- South Marsh Island 41 field: The South Marsh
Island 41 field is located in approximately 100 feet of water and encompasses all of South Marsh Island blocks 40, 41, 44 and 45. Cumulative production from our South Marsh
Island 41 field from first production in 1967 through April 2011 totaled approximately 14 MMBbls of oil and 87 Bcf of natural gas.
- •
- South Pass 60 field: The South Pass 60 field
is located in approximately 250 feet of water and encompasses all or portions of South Pass blocks 6, 17, 59, 60, 61, 66 and 67. Cumulative production from our South Pass 60 field
from first production in 1972 through April 2011 totaled approximately 229 MMBbls of oil and 498 Bcf of natural gas.
- •
- West Delta 79/80 field: The West Delta 79/80
field is located in approximately 150 feet of water and encompasses all or portions of West Delta blocks 57, 79 and 80. Cumulative production from our West Delta 79/80 field from
first production in 1970 through April 2011 totaled approximately 162 MMBbls of oil and 616 Bcf of natural gas.
- •
- Vermilion 362-371 field: The
Vermilion 362-371 field is located in approximately 300 feet of water and encompasses all of Vermilion blocks 362, 363 and 371. Cumulative production from our
Vermilion 362-371 field from first production in 1994 through April 2011 totaled approximately 6 MMBbls of oil and 65 Bcf of natural gas.
- •
- Vermilion 272 field: The Vermilion 272 field is located in approximately 175 feet of water and encompasses all of Vermilion block 272 and all of South Marsh Island blocks 87 and 102. Cumulative production from our Vermilion 272 field from first production in 2003 through April 2011 totaled approximately 6 MMBbls of oil and 14 Bcf of natural gas.
Bullwinkle field from first production in 1989 through April 2011 totaled approximately 113 MMBbls of oil and 175 Bcf of natural gas. Also, the Bullwinkle platform serves as a major processing hub for deepwater production of third party fields for which we receive significant production handling revenues.
The following table presents summary data regarding our largest fields as of the date and for the period indicated:
| |
|
|
As of July 31, 2011 | |
||||||||||
|---|---|---|---|---|---|---|---|---|---|---|---|---|---|---|
Field
|
Acquired From |
Operator | Average Working Interest |
% Oil of Proved Reserves |
November 2011 Average Net Daily Production (Boe/d) |
|||||||||
Bullwinkle |
Shell | Dynamic | 49 | % | 84 | % | 1,745 | |||||||
South Marsh Island 41 |
XTO | Dynamic | 100 | % | 90 | % | 1,835 | |||||||
South Pass 60 |
SPN | Dynamic | 100 | % | 84 | % | 2,208 | |||||||
West Delta 79/80 |
SPN | Dynamic | 100 | % | 65 | % | 1,395 | |||||||
Vermilion 362-371 |
Beryl | Dynamic | 67 | % | 35 | % | 1,685 | |||||||
Vermilion 272 |
Samson | Dynamic | 100 | % | 85 | % | 830 | |||||||
Our Business Strategies
Our goal is to increase stockholder value by growing reserves, production and cash flows at an attractive return on invested capital. We seek to achieve this goal through the following strategies:
- •
- Continue to pursue strategic acquisitions. We intend to continue to selectively acquire companies and producing properties based on disciplined valuations of proved reserves. Our acquisition strategy is focused on identifying motivated sellers of operated properties with underworked assets where the total asset retirement obligation is proportionate to the proved reserve value of the assets. We believe these types of assets are candidates for lower-risk production enhancement activities. By applying a disciplined valuation methodology, we reduce the risk of underperformance on the acquired properties while maintaining the potential for higher returns
3
- •
- Enhance returns by focusing on operations and cost
efficiencies. We believe that our focus on lower risk production enhancement activities, such as workovers and recompletions on
producing and shut-in wellbores, is one of the most cost-effective ways to maintain and grow production. We are engaged in a continual effort to monitor and reduce operating
expenses by finding opportunities to safely increase operational efficiencies related to staffing, transportation and operational procedures. Moreover, our ability to accurately estimate and manage
plugging and abandonment ("P&A") costs associated with potential acquisitions increases the likelihood of achieving our target returns on investment.
- •
- Focus primarily on the shallow waters of the Gulf of
Mexico. Our experience in the Gulf of Mexico has led us to focus our efforts in that particular region, where we are familiar with the
regulatory, geological and operational characteristics of this environment. This geographic focus enables us to minimize logistical costs and required staff.
- •
- Maintain a disciplined financial policy. We intend to
continue to pursue a disciplined financial policy by maintaining a prudent capital structure and managing our exposure to interest rate and commodity price risk. We plan to continue maintaining
relatively modest leverage and financing our growth with a balanced combination of equity and debt. Maintaining a balanced capital structure allows us to use our available capital to selectively
pursue attractive investments or acquisition opportunities.
- •
- Manage our exposure to commodity price risk. We intend to continue to manage our exposure to commodity price risk in the near term while remaining opportunistic over the long term. We use a variety of hedging instruments to accomplish our risk management objectives and enhance the stability of our cash flows. Our commodity derivative contracts are currently in the form of basic swaps and collars that are designed to provide a fixed price (swaps) or defined range of prices (collars) that we will receive. We actively monitor our hedge portfolio to support our cash flow objectives.
on our investment. We believe that opportunities to consolidate interests in our existing properties will continue to be available and that these consolidation transactions can generate attractive returns without the risks associated with acquiring and operating new assets. For example, we recently acquired from Moreno Offshore Resources, LLC the remaining interests in the properties we previously acquired from SPN Resources in 2008. Please read "—Recent Developments—MOR Transaction" beginning on page 7. We also believe that maintaining a strong financial profile through our disciplined financial policy helps position us as a preferred buyer by mitigating sellers' concerns regarding our ability to close transactions and fund future abandonment obligations.
Our Competitive Strengths
We have a number of competitive strengths that we believe will help us to successfully execute our business strategies:
- •
- Acquisition execution capabilities. We have a proven track record of identifying, evaluating and executing the purchase of oil and natural gas assets and companies. Since we began operations in 2008, we have completed ten material acquisitions, creating significant value relative to the capital employed. The significant history, experience and familiarity of our executive management team with the Gulf of Mexico leads potential sellers to contact us directly, which reduces potential competition from other buyers. We have an experienced team of professionals dedicated primarily to the technical evaluation of acquisitions and reserve analysis, which allows us to continuously pursue opportunities without compromising the management of our existing assets. Moreover, we believe that our expertise related to the legal, financial and regulatory aspects of mergers and acquisitions allows us to quickly and successfully close transactions.
4
- •
- High-quality asset base with significant production enhancement
opportunities. Our producing asset base is composed of some of the largest fields discovered in the Gulf of Mexico. Given the prolific
nature of our assets, we believe that our fields are characterized by lower-risk properties and offer significant additional development and exploration potential. Specifically, our
geological and geophysical professionals have identified a multi-year inventory of potential drilling locations in our fields associated with our proved reserves, which we believe
represent lower-risk opportunities. In addition, we have identified a substantial inventory of unproven prospects through the technical evaluation of our properties. We have licenses for
recent 3-D seismic data utilizing modern processing techniques on more than 450 offshore blocks. Our seismic data covers the vast majority of our acreage holdings, including multiple data
sets over several of our more valuable properties. Many of our fields contain several producing zones, providing us increased opportunities for production enhancement activities within each wellbore.
Additionally, we own the rights to deep intervals on the vast majority of our approximately 830,000 gross (490,000 net) acres in the Gulf of Mexico, which includes the depths at which ultra-deep
exploration is underway on the Gulf of Mexico shelf.
- •
- Operating control over the majority of our portfolio of
assets. We operate more than 90% of our assets based on the PV-10 of our proved oil and natural gas reserves as of
July 31, 2011, allowing us to maintain better control over our asset portfolio. We believe that controlling operations will allow us to dictate the pace of development as well as the costs,
type and timing of exploration and development activities. We also believe that maintaining operational control over the majority of our assets allows us to better pursue our strategies of enhancing
returns through focusing on production enhancement opportunities, operational and cost efficiencies, maximizing hydrocarbon recovery and effectively managing our P&A liabilities.
- •
- Strong financial profile. We believe that our strong
financial profile positions us as a preferred buyer for potential acquisitions. After the completion of this offering, we expect to continue to have strong liquidity and financial flexibility
sufficient to fund our anticipated capital needs and future growth opportunities. As of September 30, 2011, after giving effect to the application of the net proceeds of this offering, we would
have had approximately $108.0 million outstanding under our revolving credit facility, with additional availability of approximately $322.0 million. Please read "—Recent
Developments—XTO Acquisition" beginning on page 7, "—MOR Transaction" beginning on page 7, and "—Borrowing Base Increases and Debt Repayment;
Distributions to Equity Owners" beginning on page 8. We expect that cash flows from our assets will be sufficient to fund our planned capital expenditure activities, and given our high level of
operational control, we should be able to maintain control over the pace of spending.
- •
- Significant oil exposure. As of July 31, 2011, our
estimated net proved reserves were composed of approximately 50% oil. This oil exposure allows us to benefit from the disparity between relative oil and natural gas prices, which has persisted over
the last several years and which we expect to continue in the future. Nearly all of our oil is sold at LLS, HLS and EIC prices, which have recently traded at a significant premium to NYMEX WTI
benchmark prices. Consequently, our oil production benefits from higher pricing differentials relative to many other North American crude oil producers in other areas. For example, for the three
months ended September 30, 2011, the average realized price before the effect of commodity derivative contracts for our oil production was $104.91 per Bbl, compared to an average WTI index
price of $89.54 per Bbl for the same period.
- •
- Efficient management of our P&A activities. We consider the evaluation and execution of P&A activities to be one of our core competencies. We have an experienced internal team with a dedicated focus on managing our P&A activities and estimating P&A costs associated with acquisition opportunities. Our ongoing effort to manage our P&A liabilities by proactively
5
- •
- Experienced and incentivized management team. Our
management team has an average of more than 28 years of energy industry experience, primarily focused on the Gulf of Mexico. In addition, our executive officers, management and other employees
have a meaningful economic interest in us, which is expected to total approximately 10.1% of our common stock following the completion of this offering, thereby aligning management's interests with
those of our stockholders.
- •
- Affiliation with Riverstone. Investment funds managed or
advised by Riverstone Holdings LLC ("Riverstone") have significant energy and financial expertise to complement their investment in us. To date, affiliates of Riverstone and the Carlyle Group (such
affiliates, the "Riverstone/Carlyle Funds") have committed approximately $16.0 billion to 79 investments across the midstream, upstream, power, oilfield service and renewable sectors of the
energy industry. Following the completion of this offering, the Riverstone/Carlyle Funds will own an approximate 52.3% interest in us. While we expect that our relationship with Riverstone will
continue to provide us with several significant benefits, including access to potential transactions and financial professionals with a successful track record of investing in energy assets,
Riverstone is under no obligation to provide us with such access and is likely to do so only to the extent such access would prove beneficial to Riverstone. In addition, we have renounced our interest
in certain business opportunities that may be presented to Riverstone and its affiliates. Further, affiliates of Riverstone currently have, and may make in the future, investments in other similar
companies that compete with us. Please read "Certain Relationships and Related Party Transactions—Riverstone/Carlyle Funds Investments in Dynamic" beginning on page 126.
- •
- Relationship with Superior. Superior Energy Services and its affiliates (collectively, "Superior") will continue to own a significant equity interest in us following this offering and is a co-owner in Bullwinkle. We believe this relationship offers several significant benefits, including access to technical expertise related to well intervention and decommissioning and insight into offshore service market conditions. Our complementary areas of expertise and operational capabilities position us favorably in the pursuit of future acquisition opportunities. Please read "Certain Relationships and Related Party Transactions—Transactions with Superior" beginning on page 128 and "Description of Capital Stock—Corporate Opportunity" on page 138.
removing inactive structures, wellbores and pipelines meaningfully reduces our operating expenses, maintenance expenses, insurance premiums and overall risk exposure.
Recent Developments
Preliminary 2011 Operational and Financial Results
Although we are in the early stages of compiling our operational and financial results for the fourth quarter and full year of 2011, our preliminary estimated results indicate our production was approximately 26,000 to 26,500 Boe per day for the three months ended December 31, 2011, an increase of 33% to 35% as compared to 19,609 Boe per day in the quarter ended September 30, 2011. The increase in our production for the three months ended December 31, 2011 was primarily attributable to the inclusion of a full quarter's results of the August 2011 XTO Acquisition described below.
We estimate that our proved reserves, net of production, increased slightly between July 31, 2011 and December 31, 2011.
We expect our average realized price before the effect of commodity derivative contracts for our oil production to be between $114.00 and $115.00 per Bbl for the three months ended December 31, 2011, compared to an average WTI index price of $94.06 per Bbl for the same period. For the three months ended December 31, 2011, we expect our average realized price before the effect of commodity
6
derivative contracts for our natural gas production to be between $3.65 and $3.85 per Mcf, compared to an average Henry Hub benchmark price of $3.46 per MMBtu for the same period.
For the three months ended December 31, 2011 as compared to the three months ended September 30, 2011, we expect that (i) our lease operating expenses were slightly lower on a per Boe basis, (ii) our general and administrative expense was comparable and (iii) our workover expense was lower on a per Boe basis.
These results are preliminary and may differ from those ultimately reported in our future SEC filings. The preliminary financial data included in this prospectus has been prepared by, and is the responsibility of, our management. Hein & Associates LLP, our independent registered public accountants, has not audited, reviewed, compiled or performed any procedures with respect to the preliminary financial data underlying these results. Accordingly, Hein & Associates LLP does not express an opinion or any other form of assurance with respect thereto. The preliminary reserve estimates underlying our expectations described above have been prepared by our internal engineers; Netherland, Sewell & Associates, Inc., our independent reserve engineers, have not reviewed or prepared any reports with respect to those estimates.
XTO Acquisition
On August 31, 2011, we acquired from XTO Offshore Inc., HHE Energy Company and XH, LLC, each an indirect subsidiary of Exxon, certain oil and natural gas interests in the Gulf of Mexico for approximately $182.5 million (the "XTO Acquisition"). The properties acquired comprise substantially all of the Gulf of Mexico assets that Exxon acquired as part of its acquisition of XTO Energy, Inc. in 2010 (the "XTO Acquisition Properties"). As of July 31, 2011, based on a reserve report prepared by NSAI and our internally prepared reserve estimates, these properties contained 13,535 MBoe of proved reserves, of which 39% was oil, and 7,025 MBoe of probable reserves. As of that same date, the PV-10 of the proved oil and natural gas reserves was approximately $329 million, and the PV-10 of the probable oil and natural gas reserves was approximately $87 million, in each case based on SEC pricing of $88.44 per Bbl for oil and $4.19 per MMBtu for natural gas. Please read "—Summary Historical Operating and Reserve Data—Summary Reserve Data" beginning on page 15.
The XTO Acquisition Properties include approximately 250,000 gross (130,000 net) acres and 135 gross (62 net) producing wells. At the time of acquisition, net production from the XTO Acquisition Properties during August 2011 was greater than 7,500 Boe/d. Additionally, our geological and geophysical professionals have identified an inventory of over 30 potential drilling locations within the XTO Acquisition Properties. We operate over 90% of the XTO Acquisition Properties.
For more information about the XTO Acquisition Properties, please read "Business—XTO Acquisition" beginning on page 72, "—Our Operations" beginning on page 79 and the statements of revenues and direct operating expenses for the XTO Acquisition Properties included elsewhere in this prospectus.
MOR Transaction
On September 14, 2011, we acquired directly from a subsidiary of Moreno Offshore Resources, LLC ("MOR") for $68.0 million the remaining 25% working interest in the properties that we acquired from SPN Resources in 2008 (the "MOR Transaction"). MOR had originally acquired this interest from SPN Resources at the same time as our initial acquisition. As of July 31, 2011, MOR's 25% working interest represented approximately 3.4 MMBoe of proved reserves, of which approximately 65% was oil, and 0.3 MMBoe of probable reserves. As of that same date, the PV-10 of the proved oil and natural gas reserves associated with MOR's working interest was approximately $104.2 million, and the PV-10 of the probable oil and natural gas reserves was approximately $10.7 million, in each case based on SEC pricing of $88.44 per Bbl for oil and $4.19 per MMBtu for natural gas. At the time of
7
acquisition, net production attributable to MOR's 25% working interest during August 2011 was approximately 1,300 Boe/d. We currently operate substantially all of the properties we acquired in the MOR Transaction.
For more information about the properties acquired in the MOR Transaction, please read "Business—MOR Transaction" beginning on page 73.
Borrowing Base Increases and Debt Repayment; Distributions to Equity Owners
In connection with the XTO Acquisition and the MOR Transaction, the lenders under our credit facility approved two independent increases to our borrowing base of $105 million and $25 million, respectively. Following the closing of the XTO Acquisition and the MOR Transaction, our borrowing base increased from $300 million to $430 million. On November 7, 2011, the lenders under our credit facility reaffirmed the borrowing base of $430 million. On December 28, 2011, we repaid $20 million in borrowings under our revolving credit facility, leaving $365 million in borrowings outstanding as of that date. As of September 30, 2011, after giving effect to the application of the net proceeds of this offering, we would have had approximately $108.0 million outstanding under our revolving credit facility, with additional availability of approximately $322.0 million.
In the fourth quarter of 2011, we made an approved tax distribution to our equity owners of approximately $18 million, and on January 13, 2012, we made an additional approved distribution to our equity owners of $25 million.
Risk Factors
For a discussion of the risks and other considerations that could negatively affect us, including risks related to this offering and our common stock, please read "Risk Factors" beginning on page 20 and "Cautionary Note Regarding Forward-Looking Statements" beginning on page 41.
Conflicts of Interest
Affiliates of Citigroup Global Markets Inc., Credit Suisse Securities (USA) LLC, Deutsche Bank Securities Inc., UBS Securities LLC, Capital One Southcoast, Inc., IBERIA Capital Partners L.L.C., Natixis Securities Americas LLC and RBS Securities Inc. are lenders, and in several cases, agents for the lenders, under our credit facility and may receive more than 5% of the net proceeds of this offering in connection with our repayment of outstanding borrowings under our credit facilty. See "Use of Proceeds" on page 43. A "conflict of interest" under Rule 5121 of the Financial Industry Regulatory Authority, or FINRA, is therefore deemed to exist. Accordingly, this offering is being made in compliance with Rule 5121. Pursuant to Rule 5121, the initial public offering price of the shares of common stock must not be higher than that recommended by a "qualified independent underwriter" meeting certain standards, and the qualified independent underwriter must exercise the usual standards of due diligence with respect to the registration statement of which this prospectus forms a part. Tudor Pickering, Holt & Co. has assumed the responsibilities of acting as the qualified independent underwriter in this offering. Please read "Underwriters—Conflicts of Interest" beginning on page 147.
8
Corporate Reorganization
Pursuant to the terms of a corporate reorganization, which will be completed immediately prior to the closing of this offering, all of the interests in Dynamic Offshore Holding, LP will be transferred to its wholly owned subsidiary, Dynamic Offshore Resources, Inc., through a combination of a contribution of such interests and a merger of Dynamic Offshore Holding, LP into Dynamic Offshore Resources, Inc. and all limited partner interests in Dynamic Offshore Holding, LP will be converted into the right to receive common stock of Dynamic Offshore Resources, Inc. The following diagram indicates our ownership structure after giving effect to our corporate reorganization and this offering based on an assumed initial public offering price of $18.00 per share (the mid-point of the price range set forth on the cover of this prospectus) and assuming no exercise of the underwriters' over-allotment option.
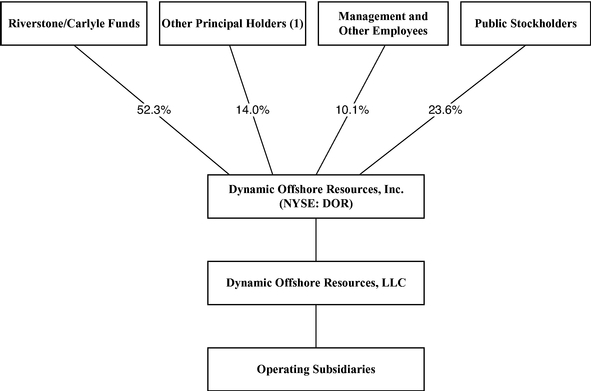
- (1)
- Includes Superior, MOR DOH Holdings, L.L.C. and trusts held for the benefit of family members of our executive officers and other employees.
For more information regarding our principal stockholders, please read "Principal and Selling Stockholders" beginning on page 132 and "Certain Relationships and Related Party Transactions" beginning on page 126. For more information regarding our corporate reorganization, please read "Corporate Reorganization" beginning on page 131.
Corporate Information
Our principal executive offices are located at 1301 McKinney, Suite 900, Houston, Texas 77010, and our telephone number at that address is (713) 728-7840. Our website is located at www.dynamicosr.com. We expect to make our periodic reports and other information filed with or furnished to the SEC available free of charge through our website as soon as reasonably practicable after those reports and other information are electronically filed with or furnished to the SEC. Information on our website or any other website is not incorporated by reference herein and does not constitute a part of this prospectus.
9
Common stock offered by Dynamic Offshore Resources, Inc. |
16,666,667 shares. | |
Common stock to be outstanding after the offering |
70,533,333 shares. |
|
Over-allotment option |
The selling stockholders have granted the underwriters a 30-day option to purchase up to an aggregate of 2,500,000 additional shares of our common stock to cover over-allotments. |
|
Use of proceeds |
We expect to receive approximately $277.0 million of net proceeds from the sale of the common stock offered by us, based upon the assumed initial public offering price of $18.00 per share (the midpoint of the price range set forth on the cover page of this prospectus), after deducting underwriting discounts and estimated offering expenses. Each $1.00 increase (decrease) in the public offering price would increase (decrease) our net proceeds by approximately $15.6 million. We intend to use the net proceeds from this offering to repay outstanding borrowings under our revolving credit facility. We will not receive any proceeds from the sale of shares by the selling stockholders pursuant to any exercise of the underwriters' over-allotment option to purchase additional shares of our common stock. |
|
|
Affiliates of certain of the underwriters are lenders under our revolving credit facility and, accordingly, will receive a portion of the proceeds of this offering. Please read "Use of Proceeds" on page 43, "Corporate Reorganization" on page 131, and "Underwriters" beginning on page 144. |
|
Dividend policy |
We do not anticipate paying any cash dividends on our common stock. In addition, our revolving credit facility places certain restrictions on our ability to pay cash dividends. Please read "Dividend Policy" on page 43. |
|
Risk factors |
You should carefully read and consider the information beginning on page 20 of this prospectus set forth under the heading "Risk Factors" and all other information set forth in this prospectus before deciding to invest in our common stock. |
|
Listing and trading symbol |
We have been approved, subject to official notice of issuance, to list our common stock on the New York Stock Exchange under the symbol "DOR". |
10
Summary Historical Consolidated and Unaudited Pro Forma Financial Data
You should read the following summary financial data in conjunction with "Selected Historical Consolidated and Unaudited Pro Forma Financial Data" beginning on page 46, "Corporate Reorganization" beginning on page 131, "Management's Discussion and Analysis of Financial Condition and Results of Operations" beginning on page 51 and our historical consolidated financial statements and unaudited pro forma financial information and related notes thereto included elsewhere in this prospectus. The financial information included in this prospectus may not be indicative of our future results of operations, financial position and cash flows.
Set forth below is (i) summary historical consolidated financial data for the period from January 1, 2008 through March 13, 2008 of SPN Resources LLC, our accounting predecessor, which has been derived from the audited financial statements of SPN Resources LLC included elsewhere in this prospectus, (ii) our summary historical consolidated financial data for the years ended December 31, 2008, 2009 and 2010, and balance sheet data at December 31, 2009 and 2010, which has been derived from the audited financial statements of Dynamic Offshore Holding, LP included elsewhere in this prospectus, (iii) our summary historical consolidated financial data for the nine months ended September 30, 2010 and 2011 and balance sheet data at September 30, 2011, which has been derived from the unaudited financial statements of Dynamic Offshore Holding, LP included elsewhere in this prospectus, and (iv) pro forma consolidated financial data for the year ended December 31, 2010 and the nine months ended September 30, 2011 and pro forma balance sheet data at September 30, 2011, which has been derived from the unaudited pro forma financial statements included elsewhere in this prospectus.
We have accounted for the MOR Transaction as a transaction between entities under common control because of our relationship with Riverstone, which also controls (as defined in the accounting standards codification master glossary) the Moreno Group companies. Transfers of net assets between entities under common control are accounted for as if the transfer occurred at the beginning of the period, and prior years are retrospectively adjusted to furnish comparative information similar to the pooling method.
The unaudited pro forma financial data for the year ended December 31, 2010, which reflects our acquisition of certain oil and natural gas properties from Samson Resources on July 8, 2010 (the "Samson Acquisition Properties"), our recently completed XTO Acquisition, our corporate reorganization and the effects of this offering and the application of the net proceeds, was derived from the unaudited pro forma financial information included elsewhere in this prospectus. The unaudited pro forma financial information for the year ended December 31, 2010 and the nine months ended September 30, 2011 was prepared as if each of these transactions occurred on January 1, 2010. The unaudited pro forma financial information as of September 30, 2011 was prepared as if our corporate reorganization and this offering and the application of the net proceeds had occurred on September 30, 2011.
11
| |
Historical | Pro Forma | ||||||||||||||||||||||||
|---|---|---|---|---|---|---|---|---|---|---|---|---|---|---|---|---|---|---|---|---|---|---|---|---|---|---|
| |
Predecessor | Dynamic Offshore Holding, LP | ||||||||||||||||||||||||
| |
January 1, 2008 Through March 13, 2008 |
Year Ended December 31, |
Nine Months Ended September 30, |
|
Nine Months Ended September 30, 2011 |
|||||||||||||||||||||
| |
Year Ended December 31, 2010 |
|||||||||||||||||||||||||
| |
2008 | 2009 | 2010 | 2010 | 2011 | |||||||||||||||||||||
| |
(In thousands) |
|||||||||||||||||||||||||
Statement of operations data: |
||||||||||||||||||||||||||
Oil and gas revenues |
$ | 56,179 | $ | 209,219 | $ | 178,992 | $ | 345,812 | $ | 255,496 | $ | 340,541 | 536,507 | 436,179 | ||||||||||||
Other operating revenues |
741 | 1,695 | 2,017 | 12,815 | 7,770 | 11,926 | 12,815 | 11,926 | ||||||||||||||||||
|
56,920 | 210,914 | 181,009 | 358,627 | 263,266 | 352,467 | 549,322 | 448,105 | ||||||||||||||||||
Operating expenses: |
||||||||||||||||||||||||||
Lease operating expense |
8,791 | 36,725 | 60,618 | 89,399 | 63,511 | 78,998 | 126,135 | 98,605 | ||||||||||||||||||
Exploration expense |
— | 80 | 8,999 | 2,100 | 1,736 | 7,285 | 2,100 | 7,285 | ||||||||||||||||||
Depreciation, depletion and amortization |
13,414 | 49,648 | 88,573 | 195,122 | 96,205 | 102,417 | 271,568 | 132,289 | ||||||||||||||||||
General and administrative expense |
2,275 | 17,843 | 25,655 | 24,328 | 19,280 | 19,328 | 24,328 | 19,328 | ||||||||||||||||||
Other operating expense(1) |
4,786 | 29,930 | 51,142 | 73,047 | 50,114 | 51,709 | 82,931 | 58,328 | ||||||||||||||||||
|
29,266 | 134,226 | 234,987 | 383,996 | 230,846 | 259,737 | 507,062 | 315,835 | ||||||||||||||||||
Income (loss) from operations |
27,654 | 76,688 | (53,978 | ) | (25,369 | ) | 32,420 | 92,730 | 42,260 | 132,270 | ||||||||||||||||
Other income (expense): |
||||||||||||||||||||||||||
Interest expense, net |
(34 | ) | (2,492 | ) | (7,138 | ) | (13,541 | ) | (10,688 | ) | (6,409 | ) | (12,123 | ) | (4,324 | ) | ||||||||||
Commodity derivative income (expense) |
— | 159,939 | (21,887 | ) | 6,990 | 29,838 | 61,889 | 6,990 | 61,889 | |||||||||||||||||
Bargain purchase gain |
— | — | 161,351 | 4,024 | 4,024 | — | 4,024 | — | ||||||||||||||||||
Other |
— | (103 | ) | — | (1,080 | ) | — | (146 | ) | (1,080 | ) | (146 | ) | |||||||||||||
Income (loss) before income taxes |
27,620 | 234,032 | 78,348 | (28,976 | ) | 55,594 | 148,064 | 40,071 | 189,689 | |||||||||||||||||
Income tax benefit (expense) |
— | (14,738 | ) | 20,387 | 14,814 | 4,344 | 1,544 | (14,719 | ) | (66,387 | ) | |||||||||||||||
Net income (loss) |
27,620 | 219,294 | 98,735 | (14,162 | ) | 59,938 | 149,608 | 25,352 | 123,302 | |||||||||||||||||
Less: Net income (loss) attributable to noncontrolling interests |
— | 34,648 | 57,663 | (4,070 | ) | 10,184 | 460 | (2,645 | ) | 299 | ||||||||||||||||
Net income (loss) attributable to Dynamic Offshore Holding, LP |
$ | 27,620 | $ | 184,646 | $ | 41,072 | $ | (10,092 | ) | $ | 49,754 | $ | 149,148 | $ | 27,997 | $ | 123,003 | |||||||||
Pro forma net income (loss) attributable to Dynamic Offshore Holding, LP/Dynamic Offshore Resources, Inc. |
$ | 129,600 | $ | 13,634 | $ | (16,883 | ) | $ | 29,516 | $ | 95,947 | $ | 27,997 | $ | 123,003 | |||||||||||
Pro forma basic and diluted earnings per share |
$ | 1.84 | $ | 0.19 | $ | (0.24 | ) | $ | 0.42 | $ | 1.36 | $ | 0.40 | $ | 1.74 | |||||||||||
Adjusted EBITDA(2) |
$ | 41,953 | $ | 154,165 | $ | 131,440 | $ | 235,567 | $ | 175,756 | $ | 206,158 | $ | 383,626 | $ | 278,064 | ||||||||||
- (1)
- Includes
insurance expense, workover expense, accretion expense, casualty loss (gain), loss on abandonments, loss (gain) on sale of assets and other.
- (2)
- Adjusted EBITDA is a non-GAAP financial measure. For a definition of Adjusted EBITDA and a reconciliation of Adjusted EBITDA to our net income (loss) and net cash provided by operating activities, please read "—Non-GAAP Financial Measure" beginning on page 13.
| |
As of December 31, | |
|
||||||||||
|---|---|---|---|---|---|---|---|---|---|---|---|---|---|
| |
As of September 30, 2011 |
Pro Forma As of September 30, 2011 |
|||||||||||
| |
2009 | 2010 | |||||||||||
| |
(In thousands) |
||||||||||||
Balance sheet data: |
|||||||||||||
Cash and cash equivalents |
$ | 88,457 | $ | 75,162 | $ | 18,765 | $ | 18,766 | |||||
Net property, plant and equipment |
861,204 | 864,645 | 1,145,544 | 1,145,544 | |||||||||
Total assets |
1,138,999 | 1,067,131 | 1,374,766 | 1,371,767 | |||||||||
Long-term debt |
243,000 | 203,205 | 385,000 | 108,000 | |||||||||
Total owners'/stockholders' equity |
526,244 | 475,531 | 530,579 | 704,580 | |||||||||
12
| |
Predecessor | Dynamic Offshore Holding, LP | |||||||||||||||||
|---|---|---|---|---|---|---|---|---|---|---|---|---|---|---|---|---|---|---|---|
| |
January 1, 2008 Through March 13, 2008 |
Years Ended December 31, |
Nine Months Ended September 30, |
||||||||||||||||
| |
2008 | 2009 | 2010 | 2010 | 2011 | ||||||||||||||
| |
(In thousands) |
||||||||||||||||||
Other financial data: |
|||||||||||||||||||
Net cash provided by operating activities |
$ | 22,836 | $ | 173,704 | $ | 37,796 | $ | 157,656 | $ | 139,553 | $ | 156,602 | |||||||
Net cash provided by (used in) investing activities |
(3,627 | ) | (431,423 | ) | 62,075 | (94,605 | ) | (113,576 | ) | (296,676 | ) | ||||||||
Net cash provided by (used in) financing activities |
—- | 309,749 | (63,589 | ) | (76,346 | ) | 5,823 | 83,677 | |||||||||||
Non-GAAP Financial Measure
Adjusted EBITDA
Adjusted EBITDA is a supplemental non-GAAP financial measure that is used by management and external users of our consolidated financial statements, such as industry analysts, investors, lenders and rating agencies, to compare our performance across reporting periods on a consistent basis by excluding items that we do not believe are indicative of our core operating performance.
We define Adjusted EBITDA as revenues, including commodity derivative settlements, less lease operating expense, workover expense, insurance expense and general and administrative expense. Adjusted EBITDA is not a measure of net income or cash flows as determined by United States generally accepted accounting principles ("GAAP").
Our senior management reviews Adjusted EBITDA monthly as a core internal management process. We believe that investors benefit from having access to the same financial measures that our management uses in evaluating our operating results. Adjusted EBITDA provides useful information to investors because it is a supplemental financial measure used by us and by external users of our financial statements, including investors, commercial banks and others, to assess:
- •
- the financial performance of our assets without regard to financing methods, capital structure or historical cost basis;
- •
- our operating performance and return on capital as compared to other companies in our industry, without regard to
financing or capital structure; and
- •
- the viability of acquisitions and capital expenditure projects and the overall rates of return on alternative investment opportunities.
Adjusted EBITDA has limitations as an analytical tool and should not be considered as an alternative to, or more meaningful than, performance measures calculated in accordance with GAAP. Some of these limitations are:
- •
- certain items excluded from Adjusted EBITDA are significant components in understanding a company's financial performance,
such as a company's cost of capital and tax structure;
- •
- Adjusted EBITDA does not reflect our cash expenditures or future requirements for capital expenditures or contractual
commitments;
- •
- Adjusted EBITDA does not reflect changes in, or cash requirements for, our working capital needs;
13
- •
- Adjusted EBITDA does not consider the potentially dilutive impact of share-based compensation;
- •
- although depreciation and amortization are non-cash charges, the assets being depreciated and amortized will
often have to be replaced in the future, and Adjusted EBITDA does not reflect any cash requirements for such replacements; and
- •
- our computations of Adjusted EBITDA may not be comparable to other similarly titled measures of other companies.
Management compensates for the limitations of Adjusted EBITDA as an analytical tool by reviewing the comparable GAAP measures, understanding the differences between the measures and incorporating that understanding into its decision-making processes.
The following tables present a reconciliation of the non-GAAP financial measure of Adjusted EBITDA to the GAAP financial measures of net income (loss) and net cash provided by operating activities.
| |
Historical | Pro Forma | |||||||||||||||||||||||
|---|---|---|---|---|---|---|---|---|---|---|---|---|---|---|---|---|---|---|---|---|---|---|---|---|---|
| |
Predecessor | Dynamic Offshore Holding, LP | |||||||||||||||||||||||
| |
January 1, 2008 Through March 13, 2008 |
Year Ended December 31, |
Nine Months Ended September 30, |
|
Nine Months Ended September 30, 2011 |
||||||||||||||||||||
| |
Year Ended December 31, 2010 |
||||||||||||||||||||||||
| |
2008 | 2009 | 2010 | 2010 | 2011 | ||||||||||||||||||||
| |
(In thousands) |
||||||||||||||||||||||||
Reconciliation of net income (loss) to Adjusted EBITDA: |
|||||||||||||||||||||||||
Net income (loss) |
$ | 27,620 | $ | 219,294 | $ | 98,735 | $ | (14,162 | ) | $ | 59,938 | $ | 149,608 | $ | 25,352 | $ | 123,302 | ||||||||
Interest expense, net |
34 | 2,492 | 7,138 | 13,541 | 10,688 | 6,409 | 12,123 | 4,324 | |||||||||||||||||
Income tax expense (benefit) |
— | 14,738 | (20,387 | ) | (14,814 | ) | (4,344 | ) | (1,544 | ) | 14,719 | 66,387 | |||||||||||||
Depreciation, depletion and amortization |
13,414 | 49,648 | 88,573 | 195,122 | 96,205 | 102,417 | 271,568 | 132,289 | |||||||||||||||||
Unrealized (gain) loss on commodity derivatives |
— | (146,671 | ) | 97,975 | 36,181 | 7,043 | (67,507 | ) | 36,181 | (67,507 | ) | ||||||||||||||
Other operating expense |
885 | 14,561 | 20,757 | 22,643 | 10,250 | 16,629 | 26,627 | 19,123 | |||||||||||||||||
Bargain purchase gain |
— | — | (161,351 | ) | (4,024 | ) | (4,024 | ) | — | (4,024 | ) | — | |||||||||||||
Other |
— | 103 | — | 1,080 | — | 146 | 1,080 | 146 | |||||||||||||||||
Adjusted EBITDA |
$ | 41,953 | $ | 154,165 | $ | 131,440 | $ | 235,567 | $ | 175,756 | $ | 206,158 | $ | 383,626 | 278,064 | ||||||||||
Reconciliation of net cash provided by operating activities to Adjusted EBITDA: |
|||||||||||||||||||||||||
Net cash provided by operating activities |
$ | 22,836 | $ | 173,704 | $ | 37,796 | $ | 157,656 | $ | 139,553 | $ | 156,602 | |||||||||||||
Derivative settlements |
— | 13,268 | 76,088 | 43,171 | 36,881 | (5,618 | ) | ||||||||||||||||||
Interest expense, net |
34 | 2,492 | 7,138 | 13,541 | 10,688 | 6,409 | |||||||||||||||||||
Exploration expense |
— | 80 | 8,999 | 2,100 | 1,736 | 7,285 | |||||||||||||||||||
Amortization in interest expense, net |
— | 315 | 219 | (287 | ) | (332 | ) | (291 | ) | ||||||||||||||||
Current income tax expense |
— | — | (2,188 | ) | — | — | — | ||||||||||||||||||
Changes in operating assets and liabilities |
18,978 | (45,784 | ) | (1,299 | ) | 19,156 | (10,806 | ) | 41,178 | ||||||||||||||||
Other |
105 | 10,090 | 4,687 | 230 | (1,964 | ) | 593 | ||||||||||||||||||
Adjusted EBITDA |
$ | 41,953 | $ | 154,165 | $ | 131,440 | $ | 235,567 | $ | 175,756 | $ | 206,158 | |||||||||||||
14
Summary Historical Operating and Reserve Data
Summary Reserve Data
The following table presents summary data with respect to our estimated net proved and probable oil and natural gas reserves as of the dates indicated. The reserve estimates at July 31, 2011 for our estimated net proved and probable oil and natural gas reserves and for the estimated net proved and probable oil and natural gas reserves that we acquired in the MOR Transaction presented in the tables below are based on reports prepared by Netherland, Sewell & Associates, Inc. ("NSAI"), independent reserve engineers, in accordance with the rules and regulations of the SEC regarding oil and natural gas reserve reporting. The estimates of the net proved and probable oil and natural gas reserves that we acquired in the XTO Acquisition at July 31, 2011 presented in the tables below are based, in part, on reports prepared by NSAI for the XTO Acquisition covering 75% of the total net proved reserves (85% of the total net proved developed reserves and 85% of the present value of the total proved reserves) in accordance with the rules and regulations of the SEC regarding oil and natural gas reserve reporting. The remaining 25% of the total net proved reserves (15% of the total net proved developed reserves and 15% of the present value of the total proved reserves) and all of the total probable reserves for the XTO Acquisition are based on estimates prepared by our internal engineers.
The reserve estimates at December 31, 2010 presented in the table below are based on estimates prepared by our internal engineers, in accordance with the rules and regulations regarding oil and natural gas reserve reporting. For more information about our summary reserve data, please read "Business—Our Operations" beginning on page 79 and NSAI's reports, which have been filed as exhibits to the registration statement containing this prospectus.
The reserve estimates and the associated PV-10 and standardized measure included in this prospectus do not include the effects of insurance costs. For more detail about our aggregate insurance costs, please read the operating expense information contained within Note 3 to the audited consolidated financial statements of Dynamic Offshore Holding, LP.
Proved reserves are reserves which, by analysis of geoscience and engineering data, can be estimated with reasonable certainty to be economically producible from a given date forward from known reservoirs under existing economic conditions, operating methods and government regulations prior to the time at which contracts providing the right to operate expire, unless evidence indicates that renewal is reasonably certain. Probable reserves are reserves that are less certain to be recovered than proved reserves but which, together with proved reserves, are as likely as not to be recovered. Estimates of probable reserves which may potentially be recoverable through additional drilling or recovery techniques are by nature more uncertain than estimates of proved reserves and accordingly are subject to substantially greater risk of not actually being realized by us.
15
| |
|
At July 31, 2011 | |||||||||||||
|---|---|---|---|---|---|---|---|---|---|---|---|---|---|---|---|
| |
At December 31, 2010(1) |
Dynamic(2) | XTO | Total | |||||||||||
Reserve Data(3): |
|||||||||||||||
Estimated proved reserves: |
|||||||||||||||
Oil (MMBbls) |
18.5 | 24.6 | 5.2 | 29.8 | |||||||||||
Natural gas (Bcf)(4) |
91.3 | 131.8 | 49.8 | 181.6 | |||||||||||
Total estimated proved reserves (MMBoe)(5) |
33.7 | 46.6 | 13.5 | 60.1 | |||||||||||
Proved developed: |
|||||||||||||||
Oil (MMBbls) |
15.0 | 19.5 | 4.4 | 24.0 | |||||||||||
Natural gas (Bcf) |
80.7 | 116.1 | 32.0 | 148.0 | |||||||||||
Total (MMBoe) |
28.5 | 38.9 | 9.8 | 48.7 | |||||||||||
Percent proved developed |
85 | % | 84 | % | 72 | % | 81 | % | |||||||
Proved undeveloped: |
|||||||||||||||
Oil (MMBbls) |
3.4 | 5.1 | 0.8 | 5.9 | |||||||||||
Natural gas (Bcf) |
10.5 | 15.7 | 17.9 | 33.6 | |||||||||||
Total (MMBoe) |
5.2 | 7.7 | 3.8 | 11.5 | |||||||||||
PV-10 of proved reserves (in millions)(6) |
$ | 947.7 | $ | 1,381.5 | $ | 328.5 | $ | 1,710.0 | |||||||
Standardized Measure (in millions)(6) |
$ | 1,184.5 | n/a | n/a | n/a | ||||||||||
Estimated probable reserves: |
|||||||||||||||
Oil (MMBbls) |
4.6 | 4.7 | 1.5 | 6.2 | |||||||||||
Natural gas (Bcf)(4) |
49.0 | 25.6 | 33.3 | 58.9 | |||||||||||
Total estimated probable reserves (MMBoe) |
12.7 | 9.0 | 7.0 | 16.0 | |||||||||||
PV-10 of probable reserves (in millions)(6) |
$ | 285.1 | $ | 282.7 | $ | 87.4 | $ | 370.1 | |||||||
- (1)
- Reflects
reserves net to our equity interests in our consolidated subsidiaries in which we owned less than 100% of the outstanding equity as of
December 31, 2010.
- (2)
- Includes
interests acquired in the MOR Transaction.
- (3)
- Our
estimated proved and probable reserves and related future net revenues and PV-10 at December 31, 2010 and July 31, 2011 and
Standardized Measure at December 31, 2010 were determined using index prices for oil and natural gas, without giving effect to derivative transactions, and were held constant throughout the
life of the properties. The unweighted arithmetic average first-day-of-the-month prices for the prior 12 months were $79.40/Bbl for oil and
$4.38/MMBtu for natural gas at December 31, 2010 and $88.44/Bbl for oil and $4.19/MMBtu for natural gas at July 31, 2011. These prices were adjusted by lease for quality, transportation
fees, geographical differentials, marketing bonuses or deductions and other factors affecting the price received at the wellhead on a historical basis.
- (4)
- Includes
NGL volumes, which we do not believe are significant.
- (5)
- One
Boe is equal to six Mcf of natural gas or one Bbl of oil or NGLs based on an approximate energy equivalency.
- (6)
- For more information about our PV-10 and Standardized Measure, please read "—PV-10 and Standardized Measure" beginning on page 17.
Price Sensitivity
The following table illustrates the sensitivity of our estimated proved and probable oil and natural gas reserves and related PV-10 to changes in product price levels. The reserve quantities and PV-10 shown below were prepared on the same basis as in the table above, except (i) that NSAI's report for the properties acquired in the XTO Acquisition covers 84% of the present value of the total proved reserves acquired and (ii) for the use of market pricing based on closing forward prices on the NYMEX for oil and natural gas on July 31, 2011 rather than average first-day-of-the-month prices for the prior 12 months as specified by the SEC. The assumed lease and well operating costs included in
16
the pricing sensitivity are based on our historical lease and well operating costs and have been held constant throughout the life of the properties. The assumed capital and abandonment costs were held constant to the date of the expenditure. Based on SEC pricing, the PV-10 of our proved oil and natural gas reserves was approximately $1.7 billion while, based on NYMEX forward pricing at July 22, 2011, as set forth below, the PV-10 of our proved oil and natural gas reserves was approximately $2.1 billion. Please read "Business—Our Operations" beginning on page 79 for further discussion of why we believe the presentation of oil and natural gas reserves using forward pricing is useful for investors.
| |
At July 31, 2011 | |||||||||||
|---|---|---|---|---|---|---|---|---|---|---|---|---|
| |
Dynamic (1) | XTO | Total | |||||||||
Reserve Data(2): |
||||||||||||
Estimated proved reserves: |
||||||||||||
Oil (MMBbls) |
25.1 | 5.3 | 30.4 | |||||||||
Natural gas (Bcf)(3) |
134.4 | 50.4 | 184.9 | |||||||||
Total estimated proved reserves (MMBoe)(4) |
47.6 | 13.7 | 61.3 | |||||||||
PV-10 of proved reserves (in millions)(5) |
$ | 1,725.9 | $ | 413.7 | $ | 2,139.6 | ||||||
Estimated probable reserves: |
||||||||||||
Oil (MMBbls) |
4.8 | 1.5 | 6.3 | |||||||||
Natural gas (Bcf)(3) |
27.5 | 37.4 | 64.9 | |||||||||
Total estimated probable reserves (MMBoe) |
9.4 | 7.7 | 17.1 | |||||||||
PV-10 of probable reserves (in millions)(5) |
$ | 349.5 | $ | 129.7 | $ | 479.2 | ||||||
- (1)
- Includes
interests acquired in the MOR Transaction.
- (2)
- Our
estimated proved reserves and related future net revenues and PV-10 at July 31, 2011 were determined using index prices for oil and
natural gas, without giving effect to derivative transactions. At July 22, 2011, the forward prices were: $100.14/Bbl for oil and $4.46/MMBtu for natural gas for the period ending
December 31, 2011; $102.61/Bbl for oil and $4.79/MMBtu for natural gas for the year ending December 31, 2012; $103.75/Bbl for oil and $5.19/MMBtu for natural gas for the year ending
December 31, 2013; and $103.53/Bbl for oil and $5.40/MMBtu for natural gas thereafter. These prices were adjusted by lease for quality, transportation fees, historical geographical
differentials, marketing bonuses or deductions and other factors affecting the price received at the wellhead.
- (3)
- Includes
NGL volumes, which we do not believe are significant.
- (4)
- One
Boe is equal to six Mcf of natural gas or one Bbl of oil or NGLs based on an approximate energy equivalency.
- (5)
- For more information about our PV-10 and Standardized Measure, please read "—PV-10 and Standardized Measure" below.
PV-10 and Standardized Measure
We and others in the oil and natural gas industry use PV-10 as a measure to compare the relative size and value of proved reserves held by a company without regard to the specific tax characteristics of the entity. Investors should be cautioned, however, that neither PV-10 nor Standardized Measure represents an estimate of the fair market value of our oil and natural gas reserves. PV-10 differs from Standardized Measure because it does not include the effects of income taxes on future net revenues. Until the completion of our corporate reorganization in connection with the closing of this offering, we will remain a limited partnership not subject to entity level taxation. Other than with respect to our corporate subsidiary, we have not provided for federal or state corporate income taxes because taxable income is passed through to our equity holders.
Standardized Measure represents the present value of estimated future cash inflows from proved oil and natural gas reserves, less future development, production and income tax expenses, discounted
17
at 10% per annum to reflect timing of future cash flows. Our Standardized Measure as of December 31, 2010 includes $170.2 million attributable to noncontrolling interests in our consolidated subsidiaries. In connection with the closing of this offering, we will be converted into a corporation which will be treated as a taxable entity for federal income tax purposes. Future calculations of Standardized Measure will include the effects of income taxes on future net revenues. Assuming our anticipated conversion into a corporation had occurred on December 31, 2010, we estimate that incremental income taxes of $372.9 million would have reduced our Standardized Measure to $898.1 million. For further discussion of income taxes, please read "Management's Discussion and Analysis of Financial Condition and Results of Operations" beginning on page 51.
The following table presents a reconciliation of the PV-10 of our proved reserves as of December 31, 2010 to our Standardized Measure at that date.
| |
At December 31, 2010 | |||
|---|---|---|---|---|
| |
(in millions) |
|||
PV-10 of proved reserves |
$ | 947.7 | ||
Proved reserves attributable to noncontrolling interests |
170.2 | |||
Proved reserves attributable to the MOR Transaction |
91.4 | |||
Discounted future net income taxes |
(24.8 | ) | ||
Standardized Measure |
$ | 1,184.5 | ||
In addition, we have disclosed PV-10 in certain other contexts in this prospectus, including: (i) PV-10 calculated as of an interim date, (ii) PV-10 of probable reserves, (iii) PV-10 of proved and probable reserves attributable to acquired properties and (iv) PV-10 of proved and probable reserves adjusted for pricing sensitivities. In each of these cases, the PV-10 disclosed differs from Standardized Measure of proved reserves as of December 31, 2010, which cannot be calculated on the same basis as the respective PV-10 amounts disclosed.
With respect to PV-10 calculated as of an interim date, including in connection with reserves attributable to acquired properties, it is not practicable to calculate the taxes for the related interim period because GAAP does not provide for disclosure of the Standardized Measure on an interim basis. For acquired properties, combining the seller's Standardized Measure with ours would not produce a meaningful number because the seller's tax status is irrelevant to our calculation on a going-forward basis. Similarly, Standardized Measure is based on proved reserves as of fiscal year end calculated using unweighted arithmetic average first-day-of-the-month prices for the prior 12 months. GAAP does not prescribe any corresponding GAAP measure for PV-10 of probable reserves or PV-10 of reserves adjusted for pricing sensitivities. For these reasons, it is not practicable for us to reconcile these additional PV-10 measures to GAAP Standardized Measure.
Because probable reserves are, by definition, less certain to be recovered than proved reserves, PV-10 of probable reserves is not equivalent to and should not be given the same weight as PV-10 of proved reserves.
18
Summary Operating Data
The following table sets forth summary data with respect to our production results, average sales prices and production costs on a historical basis for the periods presented. This summary data is presented on a basis consistent with our consolidated financial statements. The unaudited pro forma information was prepared as if our acquisition of oil and natural gas properties from Samson Resources and our XTO Acquisition had each occurred on January 1, 2010.
| |
Historical | Pro Forma | ||||||||||||||||||||||||
|---|---|---|---|---|---|---|---|---|---|---|---|---|---|---|---|---|---|---|---|---|---|---|---|---|---|---|
| |
Predecessor | Dynamic Offshore Holding, LP | ||||||||||||||||||||||||
| |
January 1, 2008 Through March 13, 2008 |
Year Ended December 31, |
Nine Months Ended September 30, |
|
Nine Months Ended September 30, 2011 |
|||||||||||||||||||||
| |
Year Ended December 31, 2010 |
|||||||||||||||||||||||||
| |
2008 | 2009 | 2010 | 2010 | 2011 | |||||||||||||||||||||
Operating data: |
||||||||||||||||||||||||||
Net sales volumes: |
||||||||||||||||||||||||||
Oil (MBbls) |
364 | 1,363 | 2,145 | 3,289 | 2,447 | 2,559 | 4,792 | 3,171 | ||||||||||||||||||
Natural gas (MMcf) |
2,575 | 6,692 | 10,555 | 18,468 | 14,086 | 14,482 | 33,403 | 20,521 | ||||||||||||||||||
Total (MBoe) |
793 | 2,478 | 3,904 | 6,367 | 4,795 | 4,973 | 10,359 | 6,591 | ||||||||||||||||||
Average net daily production (Boe/d) |
10,859 | 6,770 | 10,696 | 17,444 | 17,564 | 18,216 | 28,381 | 24,143 | ||||||||||||||||||
Average sales prices: |
||||||||||||||||||||||||||
Oil, without realized derivatives ($/Bbl) |
96.72 | 103.80 | 62.64 | 78.65 | 76.37 | 106.23 | 78.42 | 106.41 | ||||||||||||||||||
Natural gas, without realized derivatives |
8.16 | 10.12 | 4.23 | 4.72 | 4.87 | 4.74 | 4.81 | 4.81 | ||||||||||||||||||
Oil, with realized derivatives ($/Bbl)(1) |
96.72 | 113.65 | 89.95 | 86.35 | 86.32 | 99.85 | 83.71 | 101.26 | (2) | |||||||||||||||||
Natural gas, with realized derivatives ($/Mcf)(1) |
8.16 | 10.10 | 5.89 | 5.68 | 5.76 | 5.48 | 5.35 | 5.33 | ||||||||||||||||||
Oil, WTI benchmark ($/Bbl) |
96.25 | 99.75 | 62.09 | 79.61 | 77.69 | 95.47 | 79.61 | 95.47 | (2) | |||||||||||||||||
Natural gas, Henry Hub benchmark ($/MMBtu) |
8.58 | 8.90 | 4.16 | 4.38 | 4.52 | 4.21 | 4.38 | 4.21 | ||||||||||||||||||
Costs and expenses ($/Boe): |
||||||||||||||||||||||||||
Lease operating expense(3) |
11.09 | 14.82 | 15.53 | 14.04 | 13.25 | 15.89 | 12.18 | 14.96 | ||||||||||||||||||
Depreciation, depletion and amortization |
16.92 | 20.04 | 22.69 | 30.65 | 20.06 | 20.59 | 26.22 | 20.07 | ||||||||||||||||||
General and administrative expense |
2.87 | 7.20 | 6.57 | 3.82 | 4.02 | 3.89 | 2.35 | 2.93 | ||||||||||||||||||
- (1)
- Realized
prices include realized gains or losses on cash settlements for our commodity derivative contracts, which have not been designated for hedge
accounting. We have not made any estimates of the impact of commodities derivatives on the average sales price for our predecessor.
- (2)
- For
the three months ended September 30, 2011, the average realized price before the effect of commodity derivative contracts for our oil production
was $104.91 per Bbl, compared to an average WTI index price of $89.54 per Bbl for the same period.
- (3)
- Our lease operating expenses do not include the effects of insurance costs. For more detail about our aggregate insurance costs, please read the operating expense information contained within Note 3 to the audited consolidated financial statements of Dynamic Offshore Holding, LP.
19
You should carefully consider the risks described below before making an investment decision. Our business, financial condition or results of operations could be materially adversely affected by any of these risks. The trading price of our common stock could decline due to any of these risks, and you may lose all or part of your investment.
Risks Related to the Oil and Natural Gas Industry and Our Business
A substantial or extended decline in oil and natural gas prices may adversely affect our business, financial condition or results of operations and our ability to meet our capital expenditure obligations and financial commitments.
The price we receive for our oil and natural gas heavily influences our revenue, profitability, access to capital and future rate of growth. Oil and natural gas are commodities and, therefore, their prices are subject to wide fluctuations in response to relatively minor changes in supply and demand. Historically, the markets for oil and natural gas have been volatile. We expect that these markets will continue to be volatile in the future. The prices we receive for our production, and the levels of our production, depend on numerous factors beyond our control. These factors include the following:
- •
- worldwide and regional economic conditions impacting the global supply and demand for oil and natural gas;
- •
- weather conditions and natural disasters;
- •
- the actions of the Organization of Petroleum Exporting Countries;
- •
- the price and quantity of imports of foreign oil and natural gas;
- •
- political conditions in or affecting other oil-producing and natural gas-producing countries,
including the current conflicts in the Middle East and conditions in South America and Russia;
- •
- the level of global oil and natural gas exploration and production;
- •
- the level of global oil and natural gas inventories;
- •
- localized supply and demand fundamentals and transportation availability;
- •
- domestic and foreign governmental regulations;
- •
- speculation as to the future price of oil and the speculative trading of oil and natural gas futures contracts;
- •
- price and availability of competitors' supplies of oil and natural gas;
- •
- technological advances affecting energy consumption; and
- •
- the price and availability of alternative fuels.
Substantially all of our production is sold to purchasers at market-based prices. Lower oil and natural gas prices will reduce our cash flows, borrowing ability and the present value of our reserves. If oil and natural gas prices materially deteriorate, we anticipate that the revised borrowing base under our revolving credit facility may be reduced. For more information, please read "—Our exploration, development and exploitation projects require substantial capital expenditures. We may be unable to obtain needed capital or financing on satisfactory terms" beginning on page 26.
In addition, lower oil and natural gas prices may also reduce the amount of oil and natural gas that we can produce economically and may affect our proved reserves. For more information, please read "—The present value of future net revenues from our proved reserves will not necessarily be the same as the current market value of our estimated oil and natural gas reserves" beginning on page 25.
20
Our offshore operations will involve special risks that could affect operations adversely.
Offshore operations are subject to a variety of operating risks specific to the marine environment, such as capsizing, collisions and damage or loss from hurricanes or other adverse weather conditions. These conditions can cause substantial damage to facilities and interrupt production. As a result, we could incur substantial liabilities that could reduce or eliminate the funds available for exploration, development or leasehold acquisitions, or result in loss of equipment and properties. In particular, we are not intending to put in place business interruption insurance due to its high cost. We therefore may not be able to rely on insurance coverage in the event of such natural phenomena.
In addition, an oil spill on or related to our properties and operations could expose us to joint and several strict liability, without regard to fault, under applicable law for all containment and oil removal costs and a variety of public and private damages including, but not limited to, the costs of responding to a release of oil, natural resource damages, and economic damages suffered by persons adversely affected by an oil spill. If an oil discharge or substantial threat of discharge were to occur, we may be liable for costs and damages, which costs and damages could be material to our results of operations and financial position.
The geographic concentration of our properties in the Gulf of Mexico subjects us to an increased risk of loss of revenues or curtailment of production from factors affecting the Gulf of Mexico specifically.
The geographic concentration of our properties along the U.S. Gulf Coast and adjacent waters on the Outer Continental Shelf means that some or all of our properties could be affected by the same event should the Gulf of Mexico experience:
- •
- severe weather, including hurricanes and tropical storms;
- •
- delays or decreases in production, the availability of equipment, facilities or services;
- •
- changes in the status of pipelines that we depend on for transportation of our production to the marketplace;
- •
- delays or decreases in the availability of capacity to transport, gather or process production; or
- •
- changes in the regulatory environment.
Because all our properties could experience the same condition at the same time, these conditions could have a relatively greater impact on our results of operations than they might have on other operators who have properties over a wider geographic area. For example, following Hurricane Ike in 2008, all of our properties were shut-in for varying lengths of time, as were those of other operators in the Gulf of Mexico.
Relatively short production periods or reserve lives for Gulf of Mexico properties subject us to higher reserve replacement needs.
High production rates generally result in recovery of a relatively higher percentage of reserves from properties in the Gulf of Mexico during the initial few years when compared to other regions in the United States. Due to high initial production rates, production of reserves from reservoirs in the Gulf of Mexico generally decline more rapidly than from other producing reservoirs. All of our existing operations are in the Gulf of Mexico. As a result, our reserve replacement needs from new prospects may be greater than those of other oil and gas companies with longer-life reserves in other producing areas. Also, our expected revenues and return on capital will depend on prices prevailing during these relatively short production periods.
21
Drilling for and producing oil and natural gas are high-risk activities with many uncertainties that could adversely affect our business, financial condition or results of operations.
Our future financial condition and results of operations will depend on the success of our exploitation, exploration, development and production activities. Our oil and natural gas exploration and production activities are subject to numerous risks beyond our control, including the risk that drilling will not result in commercially viable oil or natural gas production. Our decisions to purchase, explore, develop or otherwise exploit drilling locations or properties will depend in part on the evaluation of data obtained through geophysical and geological analyses, production data and engineering studies, the results of which are often inconclusive or subject to varying interpretations. For a discussion of the uncertainty involved in these processes, please read "—Our estimated proved and probable reserves are based on many assumptions that may turn out to be inaccurate. Any significant inaccuracies in these reserve estimates or underlying assumptions will materially affect the quantities and present value of our reserves" below. Our cost of drilling, completing and operating wells is often uncertain before drilling commences. Overruns in budgeted expenditures are common risks that can make a particular project uneconomical. Further, many factors may curtail, delay or cancel our scheduled drilling projects, including the following:
- •
- shortages of or delays in obtaining equipment and qualified personnel;
- •
- facility or equipment malfunctions;
- •
- unexpected operational events;
- •
- pressure or irregularities in geological formations;
- •
- adverse weather conditions, such as hurricanes and tropical storms, which are common in the Gulf of Mexico during certain
times of the year;
- •
- reductions in oil and natural gas prices;
- •
- delays imposed by or resulting from compliance with regulatory requirements;
- •
- proximity to and capacity of transportation facilities;
- •
- title problems; and
- •
- limitations in the market for oil and natural gas.
Our estimated proved and probable reserves are based on many assumptions that may turn out to be inaccurate. Any significant inaccuracies in these reserve estimates or underlying assumptions will materially affect the quantities and present value of our reserves.
The process of estimating oil and natural gas reserves is complex. It requires interpretations of available technical data and many assumptions, including assumptions relating to current and future economic conditions and commodity prices. Any significant inaccuracies in these interpretations or assumptions could materially affect the estimated quantities and present value of reserves shown in this prospectus. Please read "Business—Our Operations" beginning on page 79 for information about our estimated oil and natural gas reserves and the PV-10 as of July 31, 2011.
In order to prepare our estimates, we must project production rates and the timing of development expenditures. We must also analyze available geological, geophysical, production and engineering data. The extent, quality and reliability of this data can vary. The process also requires economic assumptions about matters such as oil and natural gas prices, drilling and operating expenses, capital expenditures, taxes and availability of funds. Although the reserve information contained herein was prepared by our independent reserve engineers, estimates of oil and natural gas reserves are inherently imprecise.
22
Actual future production, oil and natural gas prices, revenues, taxes, development expenditures, operating expenses and quantities of recoverable oil and natural gas reserves will vary from our estimates. Moreover, the variability is likely to be higher for probable reserves estimates. Any significant variance could materially affect the estimated quantities and present value of reserves shown in this prospectus. In addition, we may adjust estimates of proved reserves to reflect production history, results of exploration and development, prevailing oil and natural gas prices and other factors, many of which are beyond our control.
The Macondo well explosion and ensuing oil spill could have broad adverse consequences affecting our operations in the Gulf of Mexico, some of which may be unforeseeable.
In April 2010, there was a fire and explosion aboard the rig drilling the Macondo well operated by another company in ultra deep water in the U.S. Gulf of Mexico. As a result of the explosion and ensuing fire, the rig sank, causing loss of life, and created a major oil spill that produced economic, environmental and natural resource damage in the U.S. Gulf Coast region. In response to the explosion and spill, there have been many proposals by governmental and private constituencies to address the direct impact of the disaster and to prevent similar disasters in the future. Beginning in May 2010, the U.S. Department of the Interior, initially through its federal Minerals Management Service (the "MMS"), which was subsequently renamed the Bureau of Ocean Energy Management, Regulation and Enforcement (the "BOEMRE") in June 2010, issued a series of "Notices to Lessees and Operators" ("NTLs"), imposing a variety of new safety measures and permitting requirements, and implementing a moratorium on deepwater drilling activities in the U.S. Gulf of Mexico that effectively shut down deepwater drilling activities until the moratorium was lifted by Secretary of the Interior Ken Salazar in October 2010. Despite the fact that the drilling moratorium was lifted, this spill and its aftermath have led to delays in obtaining drilling permits from the BOEMRE. Effective October 1, 2011, the BOEMRE was split into two federal bureaus, the Bureau of Ocean Energy Management (the "BOEM"), which handles offshore leasing, resource evaluation, review and administration of oil and gas exploration and development plans, renewable energy development, National Environmental Policy Act ("NEPA") analysis and environmental studies, and the Bureau of Safety and Environmental Enforcement (the "BSEE"), which is responsible for the safety and enforcement functions of offshore oil and gas operations, including the development and enforcement of safety and environmental regulations, permitting of offshore exploration, development and production activities, inspections, offshore regulatory programs, oil spill response and newly formed training and environmental compliance programs. Consequently, after October 1, 2011, we will be required to interact with two newly formed federal bureaus to obtain approval of our exploration and development plans and issuance of drilling permits, which may result in added plan approval or drilling permit delays as the functions of the former BOEMRE are fully divested and implemented in the two federal bureaus. While legislation was introduced in the U.S. Congress to expedite the process for offshore permits including limitations on the timeframe for environmental and judicial review, there is no guarantee that this or similar legislation will pass.
In addition to the drilling restrictions, new safety measures and permitting requirements already issued by the BOEMRE, there have been numerous additional proposed changes in laws, regulations, guidance and policy in response to the Macondo well explosion and oil spill that could affect our operations and cause us to incur substantial losses or expenditures. Implementation of any one or more of the various proposed responses to the disaster could materially adversely affect operations in the U.S. Gulf of Mexico by raising operating costs, increasing insurance premiums, delaying drilling operations and increasing regulatory costs, and, further, could lead to a wide variety of other unforeseeable consequences that make operations in the U.S. Gulf of Mexico more difficult, more time consuming, and more costly. For example, during the previous session of Congress, a variety of amendments to the Oil Pollution Act of 1990, (the "OPA"), were proposed in response to the Macondo well incident. The OPA and regulations adopted pursuant to the OPA impose a variety of requirements
23
related to the prevention of and response to oil spills into waters of the United States, including the Outer Continental Shelf, which includes the U.S. Gulf of Mexico where we have substantial offshore operations. The OPA subjects operators of offshore leases and owners and operators of oil handling facilities to strict joint and several liability for all containment and cleanup costs and certain other damages arising from a spill, including, but not limited to, the costs of responding to a release of oil, natural resource damages, and economic damages suffered by persons adversely affected by an oil spill. The OPA also requires owners and operators of offshore oil production facilities to establish and maintain evidence of financial responsibility to cover costs that could be incurred in responding to an oil spill. The OPA currently requires a minimum financial responsibility demonstration of $35 million for companies operating on the Outer Continental Shelf, although the Secretary of Interior may increase this amount up to $150 million in certain situations. Legislation was proposed in the previous session of Congress to amend the OPA to increase the minimum level of financial responsibility to $300 million or more and there exists the possibility that similar legislation could be introduced and adopted during the current session of Congress. If the OPA is amended during the current session of Congress to increase the minimum level of financial responsibility to $300 million, we may experience difficulty in providing financial assurances sufficient to comply with this requirement. If we are unable to provide the level of financial assurance required by the OPA, we may be forced to sell our properties or operations located on the Outer Continental Shelf or enter into partnerships with other companies that can meet the increased financial responsibility requirement, and any such developments could have an adverse effect on the value of our offshore assets and the results of our operations. We cannot predict at this time whether the OPA will be amended or whether the level of financial responsibility required for companies operating on the Outer Continental Shelf will be increased.
Regulatory requirements imposed by the BOEMRE, BOEM or BSEE could significantly delay our ability to obtain permits to drill new wells in offshore waters.
Subsequent to the Macondo well incident in the U.S. Gulf of Mexico, the BOEMRE issued a series of NTLs and other regulatory requirements imposing new standards and permitting procedures for new wells to be drilled in federal waters of the Outer Continental Shelf. These requirements include the following:
- •
- The Environmental NTL, which imposes new and more stringent requirements for documenting the environmental impacts
potentially associated with the drilling of a new offshore well and significantly increases oil spill response requirements.
- •
- The Compliance and Review NTL, which imposes requirements for operators to secure independent reviews of well design,
construction and flow intervention processes, and also requires certifications of compliance from senior corporate officers.
- •
- The Drilling Safety Rule, which prescribes tighter cementing and casing practices, imposes standards for the use of
drilling fluids to maintain wellbore integrity, and stiffens oversight requirements relating to blowout preventers and their components, including shear and pipe rams.
- •
- The Workplace Safety Rule, which requires operators to have a comprehensive safety and environmental management system ("SEMS") in order to reduce human and organizational errors as root causes of work-related accidents and offshore spills.
Only recently, on September 14, 2011, BOEMRE issued proposed rules that would amend the Workplace Safety Rule by requiring the imposition of certain added safety procedures to a company's SEMS not covered by the original rule and revising existing obligations that a company's SEMS be audited by requiring the use of an independent third party auditor who has been pre-approved by the agency to perform the auditing task. As a result of the issuance of these new regulatory requirements, the BOEMRE has been taking much longer than in the past to review and approve permits for drilling
24
operations. Moreover, effective October 1, 2011, the BOEMRE was split into two separate federal bureaus, the BOEM and the BSEE. As the new standards and procedures are being integrated into the existing framework of offshore regulatory programs, we anticipate that there may be increased costs associated with regulatory compliance and delays in obtaining permits for other operations such as recompletions, workovers and abandonment activities.
We are unsure what long-term effect, if any, the BOEMRE's, BOEM's or BSEE's additional regulatory requirements and permitting procedures will have on our offshore operations. Consequently, we may be subject to a variety of unforeseen adverse consequences arising directly or indirectly from the Macondo well incident.
Regulatory requirements imposed by the BOEMRE, BOEM or BSEE could significantly impact our estimates of future asset retirement obligations from period to period.
We are responsible for plugging and abandoning wellbores and decommissioning associated platforms, pipelines and facilitates on our oil and natural gas properties. In addition to the NTLs discussed previously, the BOEMRE issued NTL No. 2010-G05, effective October 15, 2010, which establishes a more stringent regimen for the timely decommissioning of what is known as "idle iron"—wells, platforms and pipelines that are no longer producing or serving exploration or support functions related to an operator's lease—in the U.S. Gulf of Mexico. This NTL sets forth more stringent standards for decommissioning timing requirements by applying the requirement that any well that has not been used during the past five years for exploration or production on active leases and is no longer capable of producing in paying quantities must be permanently plugged or temporarily abandoned within three years. Plugging or abandonment of wells may be delayed by two years if all of the well's hydrocarbon and sulphur zones are appropriately isolated. Similarly, platforms or other facilities that are no longer useful for operations must be removed within five years of the cessation of operations. The triggering of these plugging, abandonment and removal activities under what may be viewed as an accelerated schedule in comparison to the industry's historical decommissioning efforts may serve to increase, perhaps materially, our future plugging, abandonment and removal costs, which may translate into a need to increase our estimate of future asset retirement obligations ("AROs") required to meet such increased costs. For additional details relating to our AROs, please read Note 7 to our audited consolidated financial statements included elsewhere in this prospectus.
The present value of future net revenues from our reserves will not necessarily be the same as the current market value of our estimated oil and natural gas reserves.
You should not assume that the present value of future net revenues from our reserves is the current market value of our estimated oil and natural gas reserves. We have based the estimated discounted future net revenues from our reserves on the 12-month unweighted arithmetic average of the first-day-of-the-month price for the preceding twelve months without giving effect to derivative transactions. Actual future net revenues from our oil and natural gas properties will be affected by factors such as:
- •
- actual prices we receive for oil and natural gas;
- •
- actual cost of development and production expenditures;
- •
- the amount and timing of actual production; and
- •
- changes in governmental regulations or taxation.
The timing of both our production and our incurrence of expenses in connection with the development and production of oil and natural gas properties will affect the timing and amount of actual future net revenues from reserves, and thus their actual present value. In addition, the 10% discount factor we use when calculating discounted future net revenues may not be the most
25
appropriate discount factor based on interest rates in effect from time to time and risks associated with us or the oil and natural gas industry in general.
Actual future prices and costs may differ materially from those used in the present value estimates included in this prospectus in light of recent market volatilities. If oil prices decline by $1.00 per Bbl, then the PV-10 of our proved reserves as of July 31, 2011 would decrease approximately $21.2 million. If natural gas prices decline by $0.10 per MMBtu, then the PV-10 of our proved reserves as of July 31, 2011 would decrease approximately $15.1 million.
The unavailability or high cost of drilling rigs, equipment, supplies, personnel and oil field services could adversely affect our ability to execute exploration and exploitation plans on a timely basis and within budget, and consequently could adversely affect our anticipated cash flows.
We utilize third-party services to maximize the efficiency of our organization. The cost of oil field services may increase or decrease depending on the demand for services by other oil and gas companies. While we currently have excellent relationships with oil field service companies, there is no assurance that we will be able to contract for such services on a timely basis or that the cost of such services will remain at a satisfactory or affordable level. Shortages or the high cost of drilling rigs, equipment, supplies or personnel could delay or adversely affect our exploitation and exploration operations, which could have a material adverse effect on our business, financial condition or results of operations.
Our exploration, development and exploitation projects require substantial capital expenditures. We may be unable to obtain needed capital or financing on satisfactory terms.
Our exploration and development activities are capital intensive. We make and expect to continue to make substantial capital expenditures in our business for the development, exploitation, production and acquisition of oil and natural gas reserves. Our cash flows used in investing activities were $57.7 million and $71.5 million related to capital and exploration expenditures for the year ended December 31, 2010 and the nine months ended September 30, 2011. Our total capital expenditure budget for 2011 drilling, completion and recompletion activities is approximately $100 million. The actual amount and timing of our future capital expenditures may differ materially from our estimates as a result of, among other things, commodity prices, actual drilling results, the availability of drilling rigs and other services and equipment, and regulatory, technological and competitive developments. To date, our capital expenditures (other than for acquisitions) have been financed with net cash provided by operating activities. We may be required to raise additional capital in the future to develop all of our potential drilling locations should we elect to do so.
Our cash flows provided by operating activities and access to capital are subject to a number of variables, including:
- •
- our proved reserves;
- •
- the level of oil and natural gas we are able to produce from existing wells;
- •
- the prices at which our oil and natural gas are sold;
- •
- the costs of developing and producing our oil and natural gas production;
- •
- our ability to acquire, locate and produce new reserves;
- •
- the ability and willingness of our banks to lend; and
- •
- our ability to access the equity and debt capital markets.
26
We may be unable to make attractive acquisitions or successfully integrate acquired companies, and any inability to do so may disrupt our business and hinder our ability to grow.
One aspect of our business strategy calls for acquisitions of businesses or assets that complement or expand our current business. We may not be able to identify attractive acquisition opportunities. Even if we do identify attractive candidates, we may not be able to complete the acquisition of them or do so on commercially acceptable terms.
In addition, our revolving credit facility imposes certain limitations on our ability to enter into mergers or combination transactions. Our revolving credit facility also limits our ability to incur certain indebtedness, which could indirectly limit our ability to engage in acquisitions of businesses or assets. If we desire to engage in an acquisition that is otherwise prohibited by our revolving credit facility, we will be required to seek the consent of our lenders in accordance with the requirements of the facility, which consent may be withheld by the lenders under our revolving credit facility in their sole discretion. In addition, we may incur additional debt or issue additional equity to pay for any future acquisitions, subject to the limitations described above.
If we acquire another business or assets, we could have difficulty integrating its operations, systems, management and other personnel and technology with our own. These difficulties could disrupt our ongoing business, distract our management and employees, increase our expenses and adversely affect our results of operations.
Our acquisitions may prove to be worth less than what we paid and could expose us to potentially significant liabilities, including our P&A liabilities.
We obtained the majority of our current reserve base through acquisitions of producing properties. We expect that acquisitions will continue to contribute to our future growth. In connection with these and potential future acquisitions, we are often only able to perform limited due diligence.
Successful acquisitions of oil and natural gas properties require an assessment of a number of factors, including estimates of recoverable reserves, the timing of recovering reserves, exploration potential, future oil and natural gas prices, operating costs and potential environmental, regulatory and other liabilities, including our P&A liabilities. Such assessments are inexact, and we cannot make these assessments with a high degree of accuracy. In connection with our assessments, we perform a review of the acquired properties. However, such a review will not reveal all existing or potential problems. In addition, our review may not permit us to become sufficiently familiar with the properties to fully assess their deficiencies and capabilities.
There may be threatened, contemplated, asserted or other claims against the acquired assets related to environmental, title, regulatory, tax, contract, litigation or other matters of which we are unaware, which could materially and adversely affect our production, revenues and results of operations. We are sometimes able to obtain contractual indemnification for preclosing liabilities, including environmental liabilities, but we generally acquire interests in properties on an "as is" basis with limited remedies for breaches of representations and warranties. In addition, even when we are able to obtain such indemnification from the sellers, these indemnification obligations usually expire over time and expose us to potential unindemnified liabilities, which could materially adversely affect our production, revenues and results of operations.
If oil and natural gas prices decrease, we may be required to take write-downs of the carrying values of our oil and natural gas properties.
We review our proved oil and natural gas properties for impairment whenever events and circumstances indicate that a decline in the recoverability of their carrying value may have occurred. Based on specific market factors and circumstances at the time of prospective impairment reviews, and
27
the continuing evaluation of development plans, production data, economics and other factors, we may be required to write down the carrying value of our oil and natural gas properties. A write-down constitutes a non-cash charge to earnings. We may incur impairment charges in the future, which could have a material adverse effect on our ability to borrow under our revolving credit facility and our results of operations for the periods in which such charges are taken.
If third-party pipelines connected to our facilities become partially or fully unavailable to transport our natural gas or oil, our revenues could be adversely affected.
We depend upon third-party pipelines that provide delivery options from our facilities. Because we do not own or operate these pipelines, their continued operation is not within our control. If any one of these third-party pipelines becomes partially or fully unavailable to transport natural gas and oil, or if the gas quality specification for the natural gas pipelines changes so as to restrict our ability to transport natural gas on those pipelines, our revenues could be adversely affected. For example, following Hurricane Ike in 2008, all of our properties were shut-in for varying lengths of time, as were those of other operators in the Gulf of Mexico.
Our estimates of future asset retirement obligations may vary significantly from period to period and are especially significant because our operations are exclusively in the Gulf of Mexico.
We are required to record a liability for the present value of our AROs to plug and abandon inactive, non-producing wells, to remove inactive or damaged platforms, facilities and equipment, and to restore the land or seabed at the end of oil and natural gas production operations. These costs are typically considerably more expensive for offshore operations as compared to most land-based operations, due to increased regulatory scrutiny and the logistical issues associated with working in waters of various depths. Estimating future restoration and removal costs in the Gulf of Mexico is especially difficult because most of the removal obligations may be many years in the future, regulatory requirements are subject to change or more restrictive interpretation, and asset removal technologies are constantly evolving, which may result in additional or increased costs. As a result, we may make significant increases or decreases to our estimated AROs in future periods. For example, because we operate in the Gulf of Mexico, platforms, facilities and equipment are subject to damage or destruction as a result of hurricanes. The estimated cost to plug and abandon a well or dismantle a platform can change dramatically if the host platform from which the work was anticipated to be performed is damaged or toppled rather than structurally intact. Accordingly, our estimate of future AROs could differ dramatically from what we may ultimately incur as a result of damage from a hurricane.
As described above in the risk factor titled "Regulatory requirements imposed by the BOEMRE, BOEM or BSEE could significantly impact our estimates of future asset retirement obligations from period to period" beginning on page 25, the BOEMRE's NTL No. 2010-G05 increased our liability for AROs by accelerating the time frame for plugging, abandonment and removal for some of our platforms. In addition, the potential increase in decommissioning activity in the Gulf of Mexico over the next several years as a result of the NTL could likely result in increased demand for salvage contractors and equipment, resulting in increased estimates of plugging, abandonment and removal costs and increases in related AROs.
Our insurance may not protect us against business and operating risks.
We maintain insurance for some, but not all, of the potential risks and liabilities associated with our business. For some risks, we may not obtain insurance if we believe the cost of available insurance is excessive relative to the risks presented. Due to market conditions, premiums and deductibles for certain insurance policies can increase substantially, and in some instances, certain insurance policies are economically unavailable or available only for reduced amounts of coverage. Although we will maintain insurance at levels we believe are appropriate and consistent with industry practice, we will
28
not be fully insured against all risks, including high-cost business interruption insurance and drilling and completion risks that are generally not recoverable from third parties or insurance. In addition, pollution and environmental risks generally are not fully insurable. Losses and liabilities from uninsured and underinsured events and delay in the payment of insurance proceeds could have a material adverse effect on our financial condition and results of operations.
Due to a number of recent catastrophic events, like the terrorist attacks on September 11, 2001, Hurricanes Ivan, Katrina, Rita, Gustav and Ike, the April 20, 2010 Macondo well incident and the Japanese tsunami in 2011, insurance underwriters increased insurance premiums for many of the coverages historically maintained and issued general notices of cancellation and significant changes for a wide variety of insurance coverages. The oil and natural gas industry suffered extensive damage from Hurricanes Ivan, Katrina, Rita, Gustav and Ike. As a result, insurance costs have increased significantly from the costs that similarly situated participants in this industry have historically incurred. Insurers are requiring higher retention levels and limit the amount of insurance proceeds that are available after a major windstorm in the event that damages are incurred. If storm activity in the future is as severe as it was in 2005 or 2008, insurance underwriters may no longer insure Gulf of Mexico assets against weather-related damage. In addition, we do not have in place, and do not intend to put in place, business interruption insurance due to its high cost. If an accident or other event resulting in damage to our operations, including severe weather, terrorist acts, war, civil disturbances, pollution or environmental damage, occurs and is not fully covered by insurance or a recoverable indemnity from a vendor, it could adversely affect our financial condition and results of operations. Moreover, we may not be able to maintain adequate insurance in the future at rates we consider reasonable or be able to obtain insurance against certain risks.
Prospects that we decide to drill may not yield oil or natural gas in commercial quantities or quantities sufficient to meet our targeted rate of return.
A prospect is a property in which we own an interest or have operating rights and have what our geoscientists believe, based on available seismic and geological information, to be indications of economic accumulation of oil or natural gas. Our prospects are in various stages of evaluation, ranging from a prospect that is ready to be drilled to a prospect that will require substantial seismic data processing and interpretation. There is no way to predict in advance of drilling and testing whether any particular prospect will yield oil or natural gas in sufficient quantities to recover drilling and completion costs or to be economically viable. The use of seismic data and other technologies and the study of producing fields in the same area will not enable us to know conclusively prior to drilling whether oil or natural gas will be present or, if present, whether oil or natural gas will be present in commercial quantities. We cannot assure you that the analysis we perform using data from other wells, more fully explored prospects and/or producing fields will accurately predict the characteristics and potential reserves associated with our drilling prospects. To the extent we drill additional wells in the deepwater or on the deep shelf, our drilling activities could become more expensive and successful drilling could become less certain. As a result, there can be no assurance that we will find commercial quantities of oil and natural gas and, therefore, there can be no assurance that we will achieve positive rates of return on our investments.
The development of our proved undeveloped reserves in our areas of operation may take longer and may require higher levels of capital expenditures than we currently anticipate. Therefore, our undeveloped reserves may not be ultimately developed or produced.
Approximately 19% of our total proved reserves were classified as proved undeveloped as of July 31, 2011. Development of these reserves may take longer and require higher levels of capital expenditures than we currently anticipate. Delays in the development of our reserves or increases in costs to drill and develop such reserves will reduce the PV-10 of our estimated proved undeveloped
29
reserves and future net revenues estimated for such reserves and may result in some projects becoming uneconomic. In addition, delays in the development of reserves could cause us to have to reclassify our proved reserves as unproved reserves.
Competition in the oil and natural gas industry is intense, making it more difficult for us to acquire properties, market oil and natural gas and secure trained personnel.
Our ability to acquire additional drilling locations and to find and develop reserves in the future will depend on our ability to evaluate and select suitable properties and to consummate transactions in a highly competitive environment for acquiring properties, marketing oil and natural gas and securing equipment and trained personnel. Also, there is substantial competition for capital available for investment in the oil and natural gas industry. Many of our competitors possess and employ financial, technical and personnel resources substantially greater than ours. Those companies may be able to pay more for productive oil and natural gas properties and exploratory drilling locations or to identify, evaluate, bid for and purchase a greater number of properties and locations than our financial or personnel resources permit. Furthermore, these companies may also be better able to withstand the financial pressures of unsuccessful drilling attempts, sustained periods of volatility in financial markets and generally adverse global and industry-wide economic conditions, and may be better able to absorb the burdens resulting from changes in relevant laws and regulations, which would adversely affect our competitive position. In addition, companies may be able to offer better compensation packages to attract and retain qualified personnel than we are able to offer. The cost to attract and retain qualified personnel has increased over the past few years due to competition and may increase substantially in the future. We may not be able to compete successfully in the future in acquiring prospective reserves, developing reserves, marketing hydrocarbons, attracting and retaining quality personnel and raising additional capital, which could have a material adverse effect on our business.
Our business is difficult to evaluate because we have a limited operating history.
In considering whether to invest in our common stock, you should consider that there is only limited historical financial and operating information available on which to base your evaluation of our performance. We commenced operations in 2008 and, as a result, we have a limited operating history. We face challenges and uncertainties in financial planning as a result of the unavailability of historical data and uncertainties regarding the nature, scope and results of our future activities. New companies must develop successful business relationships, establish operating procedures, hire staff, install management information and other systems, establish facilities and obtain licenses, as well as take other measures necessary to conduct their intended business activities. We may not be successful in implementing our business strategies or in completing the development of the infrastructure necessary to conduct our business as planned. In the event that our development plan is not completed or is delayed, our operating results will be adversely affected and our operations will differ materially from the activities described in this prospectus. As a result of industry factors or factors relating specifically to us, we may have to change our methods of conducting business, which may cause a material adverse effect on our results of operations and financial condition.
Our derivative activities could result in financial losses or could reduce our income.
To achieve more predictable cash flows and to reduce our exposure to adverse fluctuations in the prices of oil and natural gas, we currently, and may in the future, enter into derivative contracts for a portion of our oil and natural gas production, including collars and fixed-price swaps. We have not designated any of our commodity derivative contracts as hedges for accounting purposes and record all commodity derivative contracts on our balance sheet at fair value. Changes in the fair value of our commodity derivative contracts are recognized in earnings. Accordingly, our earnings may fluctuate significantly as a result of changes in the fair value of our commodity derivative contracts.
30
Derivative contracts also expose us to the risk of financial loss in some circumstances, including when:
- •
- production is less than the volume covered by the derivative contracts;
- •
- the counterparty to the derivative contract defaults on its obligations; or
- •
- there is a change in the differential between the underlying price in the derivative contract and actual prices received.
In addition, these types of derivative contracts limit the benefit we would receive from increases in the prices for oil and natural gas. In the event of nonperformance by the counterparty to the derivative contract, we could be subject to significant credit risk.
Increased costs of capital could adversely affect our business.
Our business and operating results can be harmed by factors such as the availability, terms and cost of capital, increases in interest rates or a reduction in credit rating. Changes in any one or more of these factors could cause our cost of doing business to increase, limit our access to capital, limit our ability to pursue acquisition opportunities, reduce our cash flows available for drilling and place us at a competitive disadvantage. A significant reduction in the availability of credit could materially and adversely affect our ability to achieve our planned growth and operating results.
Our revolving credit facility contains certain covenants that may inhibit our ability to make certain investments, incur additional indebtedness and engage in certain other transactions, which could adversely affect our ability to meet our future goals.
Our revolving credit facility includes certain covenants that, among other things, restrict:
- •
- our investments, loans and advances and the payment of dividends and other restricted payments;
- •
- our incurrence of additional indebtedness;
- •
- the granting of liens, other than liens created pursuant to the revolving credit facility and certain permitted liens;
- •
- mergers, consolidations and sales of all or a substantial part of our business or properties;
- •
- the hedging, forward sale or swap of our production of crude oil or natural gas or other commodities;
and
- •
- the sale of assets (other than production sold in the ordinary course of business).
Our revolving credit facility requires us to maintain certain financial ratios, such as leverage and interest coverage ratios. All of these restrictive covenants may restrict our ability to expand or pursue our business strategies. Our ability to comply with these and other provisions of our revolving credit facility may be impacted by changes in economic or business conditions, results of operations or events beyond our control. The breach of any of these covenants could result in a default under our revolving credit facility, in which case, depending on the actions taken by the lenders thereunder or their successors or assignees, such lenders could elect to declare all amounts borrowed under our revolving credit facility, together with accrued interest, to be due and payable. If we were unable to repay such borrowings or interest, our lenders could proceed against their collateral. If the indebtedness under our revolving credit facility were to be accelerated, our assets may not be sufficient to repay in full such indebtedness.
31
Our level of indebtedness may increase and reduce our financial flexibility.
Upon the completion of this offering, we expect to have $88 million in outstanding indebtedness and will have available borrowing capacity of $342 million under our revolving credit facility. In the future, we may incur significant indebtedness in order to make future acquisitions or to develop our properties.
Our level of indebtedness could affect our operations in several ways, including the following:
- •
- a significant portion of our cash flows could be used to service our indebtedness;
- •
- a high level of debt would increase our vulnerability to general adverse economic and industry conditions;
- •
- the covenants contained in the agreements governing our outstanding indebtedness will limit our ability to borrow
additional funds, dispose of assets, pay dividends and make certain investments;
- •
- a high level of debt may place us at a competitive disadvantage compared to our competitors that are less leveraged and
therefore, may be able to take advantage of opportunities that our indebtedness would prevent us from pursuing;
- •
- our debt covenants may also affect our flexibility in planning for, and reacting to, changes in the economy and in our
industry;
- •
- a high level of debt may make it more likely that a reduction in our borrowing base following a periodic redetermination
could require us to repay a portion of our then-outstanding bank borrowings; and
- •
- a high level of debt may impair our ability to obtain additional financing in the future for working capital, capital expenditures, acquisitions, general corporate or other purposes.
A high level of indebtedness increases the risk that we may default on our debt obligations. Our ability to meet our debt obligations and to reduce our level of indebtedness depends on our future performance. General economic conditions, oil and natural gas prices and financial, business and other factors affect our operations and our future performance. Many of these factors are beyond our control. We may not be able to generate sufficient cash flows to pay the interest on our debt and future working capital, borrowings or equity financing may not be available to pay or refinance such debt. Factors that will affect our ability to raise cash through an offering of our capital stock or a refinancing of our debt include financial market conditions, the value of our assets and our performance at the time we need capital.
The borrowing base under our revolving credit facility could be reduced upon the next re-determination date, and may be further reduced in the future if commodity prices decline, which will limit our available funding for exploration and development.
As of September 30, 2011, total outstanding borrowings under our revolving credit facility were $385 million, and our borrowing base was $430 million. Our borrowing base is re-determined semi-annually by our lenders in their sole discretion. The lenders will re-determine the borrowing base based on an engineering report with respect to our natural gas and oil reserves, which will take into account the prevailing natural gas and oil prices at such time. In the future, we may not be able to access adequate funding under our revolving credit facility as a result of (i) a decrease in our borrowing base due to the outcome of a subsequent borrowing base redetermination, or (ii) an unwillingness or inability on the part of our lending counterparties to meet their funding obligations. If oil and natural gas commodity prices materially deteriorate, we anticipate that the revised borrowing base under our revolving credit facility may be reduced. As a result, we may be unable to obtain adequate funding under our revolving credit facility or even be required to pay down amounts outstanding under our
32
revolving credit facility to reduce our level of borrowing. If funding is not available when needed, or is available only on unfavorable terms, it could adversely affect our exploration and development plans as currently anticipated and our ability to make new acquisitions, each of which could have a material adverse effect on our production, revenues and results of operations.
The lenders can unilaterally adjust the borrowing base and the borrowings permitted to be outstanding under our revolving credit facility. Any increase in the borrowing base requires the consent of all the lenders. Outstanding borrowings in excess of the borrowing base must be repaid in six equal monthly installments. If we do not have sufficient funds and are otherwise unable to negotiate renewals of our borrowings or arrange new financing, we may have to sell significant assets. Any such sale could have a material adverse effect on our business and financial results.
The inability of one or more of our joint interest partners or purchasers to meet their obligations to us may adversely affect our financial results.
Our principal exposures to credit risk are through joint interest receivables ($20.3 million at September 30, 2011), receivables resulting from the sale of our oil and natural gas production ($56.0 million at September 30, 2011), which we market to energy marketing companies, and advances to joint interest parties ($0.9 million at September 30, 2011). In addition, from time to time we may have credit risk related to our counterparties under our commodity derivative contracts.
Joint interest receivables arise from billing entities who own a partial interest in the wells we operate. These entities participate in our wells primarily based on their ownership in leases on which we wish to drill. We have limited ability to control participation in our wells. Also, we could be responsible for plugging and abandonment and other liabilities in excess of our proportionate interest in the property if others are unwilling or unable, due to insolvency or otherwise, to contribute their portions to pay for such liabilities.
We are also subject to credit risk due to the concentration of our oil and natural gas receivables with several significant purchasers. This concentration of purchasers may impact our overall credit risk since these entities may be similarly affected by changes in economic and other conditions. We generally do not require our purchasers to post collateral. The inability or failure of our significant purchasers to meet their obligations to us or their insolvency or liquidation may adversely affect our financial results.
We are not the operator for all of our operations, and, therefore, we will not be able to control the timing of exploration or development efforts, associated costs, or the rate of production of any non-operated assets.
We may acquire additional assets in the future where we would not serve as operator. As a result, we may have limited ability to exercise influence over the operations of the drilling locations operated by our partners. If we are not willing and able to fund required capital expenditures relating to a project when required by the majority owner or operator, our interests in the project may be reduced or forfeited. Dependence on the operator could prevent us from realizing our target returns for those locations. The success and timing of exploration and development activities operated by our partners will depend on a number of factors that will be largely outside of our control, including:
- •
- the timing and amount of capital expenditures;
- •
- the operator's expertise and financial resources;
- •
- approval of other participants in drilling wells;
- •
- selection of technology; and
- •
- the rate of production of reserves, if any.
33
This limited ability to exercise control over some of our operations may cause a material adverse effect on our results of operations and financial condition.
The loss of senior management or technical personnel could adversely affect our operations.
To a large extent, we depend on the services of our senior management and technical personnel who have extensive experience and expertise in evaluating and analyzing producing oil and natural gas properties and drilling prospects, maximizing production from oil and natural gas properties, marketing oil and natural gas production, and developing and executing acquisition, financing and hedging strategies. Our ability to hire and retain our officers and key employees is important to our continued success and growth. The loss of the services of our senior management or technical personnel, including our President and Chief Executive Officer, could have a material adverse effect on our operations. We do not maintain, nor do we plan to obtain, any insurance against the loss of any of these individuals.
The recent adoption of derivatives legislation by the United States Congress could have an adverse effect on our ability to use commodity derivative contracts to reduce the effect of commodity prices, interest rate and other risks associated with our business.
The United States Congress recently adopted comprehensive financial reform legislation that establishes federal oversight and regulation of the over-the-counter derivatives market and entities, such as us, that participate in that market. The new legislation, known as the Dodd-Frank Wall Street Reform and Consumer Protection Act (the "Dodd-Frank Act") was signed into law by the President on July 21, 2010 and requires the Commodities Futures Trading Commission (the "CFTC") and the SEC to promulgate rules and regulations implementing the new legislation within 360 days from the date of enactment. In June 2011, this deadline was extended to December 31, 2011. The CFTC has proposed regulations to set position limits for certain futures and option contracts in the major energy markets and to establish minimum capital requirements, although it is not possible at this time to predict whether or when the CFTC will adopt those rules or include comparable provisions in its rulemaking under the Dodd-Frank Act. The Dodd-Frank Act may also require compliance with margin requirements and with certain clearing and trade-execution requirements in connection with certain derivative activities, although the application of those provisions is uncertain at this time. The legislation may also require the counterparties to our commodity derivative contracts to spinoff some of their derivatives activities to a separate entity, which may not be as creditworthy as the current counterparty, or cause the entity to comply with the capital requirements, which could result in increased costs to counterparties such as us.
The new legislation and any new regulations could significantly increase the cost of some commodity derivative contracts (including through requirements to post collateral, which could adversely affect our available liquidity), materially alter the terms of some commodity derivative contracts, reduce the availability of some derivatives to protect against risks we encounter, reduce our ability to monetize or restructure our existing commodity derivative contracts and potentially increase our exposure to less creditworthy counterparties. If we reduce our use of derivatives as a result of the new legislation and regulations, our results of operations may become more volatile and our cash flows may be less predictable, which could adversely affect our ability to plan for and fund capital expenditures. Increased volatility may make us less attractive to certain types of investors. Finally, the Dodd-Frank Act was intended, in part, to reduce the volatility of oil and natural gas prices, which some legislators attributed to speculative trading in derivatives and commodity instruments related to oil and natural gas. If the new legislation and regulations result in lower commodity prices, our revenues could be adversely affected. Any of these consequences could adversely affect our business, financial condition and results of operations.
34
Certain federal income tax deductions currently available with respect to natural gas and oil exploration and development may be eliminated, and additional state taxes on natural gas extraction may be imposed, as a result of future legislation.
The proposed American Jobs Act of 2011 includes potential legislation that would, if enacted into law, make significant changes to U.S. federal income tax laws, including the elimination of certain U.S. federal income tax benefits currently available to oil and gas exploration and production companies. Such proposed changes include, but are not limited to, (i) the repeal of the percentage depletion allowance for oil and gas properties; (ii) the elimination of current deductions for intangible drilling and development costs; (iii) the elimination of the deduction for certain U.S. production activities; and (iv) an extension of the amortization period for certain geological and geophysical expenditures. It is unclear, however, whether any such changes will be enacted or, if enacted, how soon such changes would be effective.
The passage of any legislation as a result of these proposals or any other similar change in U.S. federal income tax law could eliminate or postpone certain tax deductions that are currently available with respect to natural gas and oil exploration and development, and any such change, as well as any changes to or the imposition of new state or local taxes (including the imposition of, or increase in, production, severance or similar taxes), could negatively affect our financial condition and results of operations.
Our operations may incur substantial costs and liabilities to comply with environmental laws and regulations.
Our oil and natural gas operations are subject to stringent federal, regional, state and local laws and regulations relating to the release or disposal of materials into the environment or otherwise relating to environmental protection. These laws and regulations may, among other things, require the acquisition of a permit before drilling commences, restrict the types, quantities and concentration of substances that can be released into the environment in connection with drilling and production activities, limit or prohibit exploration or drilling activities on certain environmentally sensitive protected areas that may affect certain species, including marine mammals, and impose substantial liabilities for pollution resulting from our operations. We may be required to make significant capital and operating expenditures or perform other corrective actions at our wells and properties to comply with the requirements of these environmental laws and regulations or the terms or conditions of permits issued pursuant to such requirements. Failure to comply with these laws and regulations may result in the assessment of administrative, civil and criminal penalties, loss of our leases, incurrence of investigatory or remedial obligations and the imposition of injunctive relief.
There is risk of incurring significant environmental costs and liabilities in the performance of our operations as a result of our handling of petroleum hydrocarbons and wastes, air emissions and wastewater discharges related our operations, and historical operations and waste disposal practices. Spills or other releases of regulated substances, including such spills and releases that occur in the future, could expose us to material losses, expenditures and liabilities under applicable environmental laws and regulations. Under certain of such laws and regulations, we could be held strictly liable for the removal or remediation of previously released materials or property contamination, regardless of whether we were responsible for the release or contamination and regardless of whether our operations met previous standards in the industry at the time they were conducted. In addition, claims for damages to persons, property or natural resources may result from environmental and other impacts of our operations. Changes in environmental laws and regulations occur frequently and any changes that result in more stringent or costly drilling, construction, completion, water management or waste handling, storage, transport, disposal or cleanup requirements could require us to make significant expenditures to attain and maintain compliance and may otherwise have a material adverse effect on our industry in general and on our own results of operations, competitive position or financial condition. We may not be able to recover some or any of these costs from insurance.
35
Climate change legislation or regulations restricting emissions of "greenhouse gases" could result in increased operating costs and reduced demand for the oil and natural gas that we produce.
In December 2009, the U.S. Environmental Protection Agency (the "EPA") determined that emissions of carbon dioxide, methane and other "greenhouse gases" present an endangerment to public health and the environment because emissions of such gases are, according to the EPA, contributing to warming of the earth's atmosphere and other climatic changes. Based on its findings, the EPA has begun adopting and implementing regulations to restrict emissions of greenhouse gases under existing provisions of the Clean Air Act (the "CAA"). The EPA has adopted two sets of rules regulating greenhouse gas emissions under the CAA, one of which requires a reduction in emissions of greenhouse gases from motor vehicles and the other of which regulates emissions of greenhouse gases from certain large stationary sources, effective January 2, 2011. The EPA has also adopted rules requiring the reporting of greenhouse gas emissions from specified large greenhouse gas emission sources in the United States, including petroleum refineries, on an annual basis, beginning in 2011 for emissions occurring after January 1, 2010, as well as certain onshore and offshore oil and natural gas production facilities, on an annual basis, beginning in 2012 for emissions occurring in 2011.
In addition, the U.S. Congress has from time to time considered adopting legislation to reduce emissions of greenhouse gases and almost one-half of the states have already taken legal measures to reduce emissions of greenhouse gases primarily through the planned development of greenhouse gas emission inventories and/or regional greenhouse gas cap and trade programs. Most of these cap and trade programs work by requiring major sources of emissions, such as electric power plants, or major producers of fuels, such as refineries and gas processing plants, to acquire and surrender emission allowances. The number of allowances available for purchase is reduced each year in an effort to achieve the overall greenhouse gas emission reduction goal. The adoption of legislation or regulatory programs to reduce emissions of greenhouse gases could require us to incur increased operating costs, such as costs to purchase and operate emissions control systems, to acquire emissions allowances or comply with new regulatory or reporting requirements. Any such legislation or regulatory programs could also increase the cost of consuming, and thereby reduce demand for, the oil and natural gas we produce. Consequently, legislation and regulatory programs to reduce emissions of greenhouse gases could have an adverse effect on our business, financial condition and results of operations. Finally, it should be noted that some scientists have concluded that increasing concentrations of greenhouse gases in the Earth's atmosphere may produce climate changes that have significant physical effects, such as increased frequency and severity of storms, droughts, and floods and other climatic events. If any such effects were to occur, they could have an adverse effect on our financial condition and results of operations.
Risks Relating to the Offering and our Common Stock
The initial public offering price of our common stock may not be indicative of the market price of our common stock after this offering. In addition, an active liquid trading market for our common stock may not develop and our stock price may be volatile.
Prior to this offering, our common stock was not traded on any market. An active and liquid trading market for our common stock may not develop or be maintained after this offering. Liquid and active trading markets usually result in less price volatility and more efficiency in carrying out investors' purchase and sale orders. The market price of our common stock could vary significantly as a result of a number of factors, some of which are beyond our control. In the event of a drop in the market price of our common stock, you could lose a substantial part or all of your investment in our common stock. The initial public offering price will be negotiated between us, the selling stockholders and representatives of the underwriters, based on numerous factors which we discuss in the "Underwriters" section beginning on page 144, and may not be indicative of the market price of our common stock
36
after this offering. Consequently, you may not be able to sell shares of our common stock at prices equal to or greater than the price paid by you in the offering.
The following factors could affect our stock price:
- •
- our operating and financial performance and drilling locations, including reserve estimates;
- •
- quarterly variations in the rate of growth of our financial indicators, such as net income per share, net income and
revenues;
- •
- changes in revenue or earnings estimates or publication of reports by equity research analysts;
- •
- speculation in the press or investment community;
- •
- sales of our common stock by us, the selling stockholders or other stockholders, or the perception that such sales may
occur;
- •
- general market conditions, including fluctuations in commodity prices; and
- •
- domestic and international economic, legal and regulatory factors unrelated to our performance.
The stock markets in general have experienced extreme volatility that has often been unrelated to the operating performance of particular companies. These broad market fluctuations may adversely affect the trading price of our common stock.
Purchasers of common stock in this offering will experience immediate and substantial dilution of $8.01 per share.
Based on an assumed initial public offering price of $18.00 per share, purchasers of our common stock in this offering will experience an immediate and substantial dilution of $8.01 per share in the as adjusted net tangible book value per share of common stock from the initial public offering price, and our as adjusted net tangible book value as of September 30, 2011 after giving effect to this offering would be $9.99 per share. Please read "Dilution" on page 45 for a complete description of the calculation of net tangible book value.
The requirements of being a public company, including compliance with the reporting requirements of the Exchange Act and the requirements of the Sarbanes-Oxley Act, may strain our resources, increase our costs and distract management, and we may be unable to comply with these requirements in a timely or cost-effective manner.
As a public company with listed equity securities, we will need to comply with new laws, regulations and requirements, certain corporate governance provisions of the Sarbanes-Oxley Act of 2002, related regulations of the SEC and the requirements of the NYSE, with which we are not required to comply as a private company. Complying with these statutes, regulations and requirements will occupy a significant amount of time of our board of directors and management and will significantly increase our costs and expenses. We will need to:
- •
- institute a more comprehensive compliance function;
- •
- design, establish, evaluate and maintain a system of internal controls over financial reporting in compliance with the
requirements of Section 404 of the Sarbanes-Oxley Act of 2002 and the related rules and regulations of the SEC and the Public Company Accounting Oversight Board;
- •
- comply with rules promulgated by the NYSE;
- •
- prepare and distribute periodic public reports in compliance with our obligations under the federal securities laws;
37
- •
- establish new internal policies, such as those relating to disclosure controls and procedures and insider trading;
- •
- involve and retain to a greater degree outside counsel and accountants in the above activities;
and
- •
- establish an investor relations function.
Compliance with these requirements may strain our resources, increase our costs and distract management; and we may be unable to comply with these requirements in a timely or cost-effective manner.
We do not intend to pay, and we are currently subject to restrictions on paying, dividends on our common stock and, consequently, your only opportunity to achieve a return on your investment is if the price of our common stock appreciates.
We do not plan to declare dividends on shares of our common stock in the foreseeable future. Additionally, our revolving credit facility places certain restrictions on our ability to pay cash dividends. Consequently, your only opportunity to achieve a return on your investment in us will be if the market price of our common stock appreciates, which may not occur, and you sell your shares at a profit. There is no guarantee that the price of our common stock that will prevail in the market after this offering will ever exceed the price that you pay.
Future sales of our common stock in the public market could lower our stock price, and any additional capital raised by us through the sale of equity or convertible securities may dilute your ownership in us.
We may sell additional shares of common stock in subsequent public offerings. We may also issue additional shares of common stock or convertible securities. After the completion of this offering, we will have 70,533,333 outstanding shares of common stock. This number includes 16,666,667 shares that we are issuing in this offering, which may be resold immediately in the public market. Following the completion of this offering (assuming no exercise of the underwriters' over-allotment option), the selling stockholders will own 52,119,868 shares, or approximately 73.9% of our total outstanding shares (including our officers and directors, who will own 3,629,037 shares, or approximately 5.1% of our total outstanding shares), all of which are restricted from immediate resale under the federal securities laws and are subject to the lock-up agreements between such parties and the underwriters described in "Underwriters" beginning on page 144, but may be sold into the market in the future. Certain selling stockholders will be a party to a registration rights agreement with us which will require us to effect the registration of their shares in certain circumstances no earlier than the expiration of the lock-up period contained in the underwriting agreement entered into in connection with this offering. The holders of the remaining 1,002,967 shares, or approximately 1.4% of our total outstanding shares, are not subject to lock-up agreements. 743,831 of these shares will be issued under our Long-Term Incentive Plan pursuant to our registration statement on Form S-8 prior to the completion of this offering and may be sold into the public market. The remaining 259,136 shares may be sold into the public market, subject to compliance with Rule 144 under the Securities Act.
Prior to the completion of this offering, we intend to file a registration statement with the SEC on Form S-8 providing for the registration of 11,500,000 shares of our common stock issued or reserved for issuance under our stock incentive plan. Subject to the satisfaction of vesting conditions and the expiration of lock-up agreements, shares registered under this registration statement on Form S-8 will be available for resale immediately in the public market without restriction.
We cannot predict the size of future issuances of our common stock or the effect, if any, that future issuances and sales of shares of our common stock will have on the market price of our common stock. Sales of substantial amounts of our common stock (including shares issued in connection with an
38
acquisition), or the perception that such sales could occur, may adversely affect prevailing market prices of our common stock.
Our amended and restated certificate of incorporation and amended and restated bylaws, as well as Delaware law, contain provisions that could discourage acquisition bids or merger proposals, which may adversely affect the market price of our common stock.
Our amended and restated certificate of incorporation authorizes our board of directors to issue preferred stock without stockholder approval. If our board of directors elects to issue preferred stock, it could be more difficult for a third party to acquire us. In addition, some provisions of our amended and restated certificate of incorporation and amended and restated bylaws could make it more difficult for a third party to acquire control of us, even if the change of control would be beneficial to our stockholders, including:
- •
- a classified board of directors, so that only approximately one-third of our directors are elected each year;
- •
- limitations on the removal of directors; and
- •
- limitations on the ability of our stockholders to call special meetings and establish advance notice provisions for stockholder proposals and nominations for elections to the board of directors to be acted upon at meetings of stockholders.
The concentration of our capital stock ownership among our largest stockholders and their affiliates will limit your ability to influence corporate matters.
Upon completion of this offering (assuming no exercise of the underwriters' over-allotment option), we anticipate that the Riverstone/Carlyle Funds will initially own up to approximately 52.3% of our outstanding common stock. Consequently, the Riverstone/Carlyle Funds will continue to have significant influence over all matters that require approval by our stockholders, including the election of directors and approval of significant corporate transactions. This concentration of ownership will limit your ability to influence corporate matters, and as a result, actions may be taken that you may not view as beneficial.
Furthermore, conflicts of interest could arise in the future between us, on the one hand, and the Riverstone/Carlyle Funds, including their portfolio companies, on the other hand, concerning among other things, potential competitive business activities or business opportunities. Riverstone manages or advises investment funds that regularly make investments in entities in the oil and natural gas industry. As a result, such existing and future portfolio companies may compete with us for investment or business opportunities. These conflicts of interest may not be resolved in our favor. Further, while we expect that Riverstone will continue to provide us with access to potential transactions in the future, Riverstone is under no obligation to do so. As a result, it is likely that Riverstone will only provide us with such access in situations that are beneficial to Riverstone.
We have also renounced our interest in certain business opportunities. Please read "—Our amended and restated certificate of incorporation contains a provision renouncing our interest and expectancy in certain corporate opportunities, which could adversely affect our business or prospects" below.
Our amended and restated certificate of incorporation contains a provision renouncing our interest and expectancy in certain corporate opportunities, which could adversely affect our business or prospects.
Our amended and restated certificate of incorporation provides that, to the fullest extent permitted by applicable law, we renounce any interest or expectancy in, or in being offered an opportunity to participate in, any business opportunity that may be from time to time presented to the
39
Riverstone/Carlyle Funds or any of their respective officers, directors, agents, shareholders, members, partners, affiliates and subsidiaries (other than us and our subsidiaries) or business opportunities that such parties participate in or desire to participate in, even if the opportunity is one that we might reasonably have pursued or had the ability or desire to pursue if granted the opportunity to do so, and no such person shall be liable to us for breach of any fiduciary or other duty, as a director or officer or controlling stockholder or otherwise, by reason of the fact that such person pursues or acquires any such business opportunity, directs any such business opportunity to another person or fails to present any such business opportunity, or information regarding any such business opportunity, to us unless, in the case of any such person who is our director, any such business opportunity is expressly offered to such director or officer in writing solely in his or her capacity as our director.
Riverstone does not have a formal policy regarding business opportunities presented to the investment funds managed or advised by it and their respective portfolio companies. However, it is generally Riverstone's practice that any such funds may pursue or direct to a portfolio company any business opportunity that is presented both to such fund and any portfolio company of any such funds, and do not pursue business opportunities presented to an employee of an affiliate of Riverstone solely in his or her capacity as a director of a portfolio company of any such fund.
As a result, the Riverstone/Carlyle Funds or their affiliates may become aware, from time to time, of certain business opportunities, such as acquisition opportunities, and may direct such opportunities to other businesses in which they have invested, in which case we may not become aware of or otherwise have the ability to pursue such opportunities. Further, such businesses may choose to compete with us for these opportunities. As a result, our renouncing our interest and expectancy in any business opportunity that may be from time to time presented to the Riverstone/Carlyle Funds and their affiliates could adversely impact our business or prospects if attractive business opportunities are procured by such parties for their own benefit rather than for ours. Please read "Description of Capital Stock—Corporate Opportunity" on page 138.
We expect to be a "controlled company" within the meaning of the NYSE rules and, if applicable, would qualify for and will rely on exemptions from certain corporate governance requirements.
Because the Riverstone/Carlyle Funds and our other equity owners that will be party to the stockholders agreement will own a majority of our outstanding common stock following the completion of this offering, we expect to be a "controlled company" as that term is set forth in Section 303A of the NYSE Listed Company Manual. Under the NYSE rules, a company of which more than 50% of the voting power is held by another person or group of persons acting together is a "controlled company" and may elect not to comply with certain NYSE corporate governance requirements, including:
- •
- the requirement that a majority of our board of directors consist of independent directors;
- •
- the requirement that our nominating and governance committee be composed entirely of independent directors with a written
charter addressing the committee's purpose and responsibilities; and
- •
- the requirement that our compensation committee be composed entirely of independent directors with a written charter addressing the committee's purpose and responsibilities.
These requirements will not apply to us as long as we remain a "controlled company." Following this offering, we may utilize some or all of these exemptions. Accordingly, you may not have the same protections afforded to stockholders of companies that are subject to all of the corporate governance requirements of the NYSE. The significant ownership interest of the Riverstone/Carlyle Funds could adversely affect investors' perceptions of our corporate governance.
40
CAUTIONARY NOTE REGARDING FORWARD-LOOKING STATEMENTS
This prospectus contains forward-looking statements that are subject to a number of risks and uncertainties, many of which are beyond our control. All statements, other than statements of historical fact included in this prospectus, regarding our strategy, future operations, financial position, estimated revenues and losses, projected costs, prospects, plans and objectives of management are forward-looking statements. When used in this prospectus, the words "could," "believe," "anticipate," "intend," "estimate," "expect," "may," "continue," "predict," "potential," "project" and similar expressions are intended to identify forward-looking statements, although not all forward-looking statements contain such identifying words.
Forward-looking statements may include statements about our:
- •
- business strategy;
- •
- estimated future reserves and the present value thereof;
- •
- cash flows and liquidity;
- •
- financial strategy, budget, projections and operating results;
- •
- oil and natural gas realized prices;
- •
- timing and amount of future production of oil and natural gas;
- •
- availability of drilling and production equipment;
- •
- availability of oil field labor;
- •
- amount, nature and timing of capital expenditures, including future development costs;
- •
- availability and terms of capital;
- •
- competition;
- •
- marketing of oil and natural gas;
- •
- exploitation or property acquisitions;
- •
- costs of exploiting and developing our properties and conducting other operations;
- •
- general economic conditions;
- •
- effectiveness of our risk management activities;
- •
- environmental liabilities;
- •
- counterparty credit risk;
- •
- governmental regulation and taxation of the oil and natural gas industry;
- •
- developments in oil-producing and natural gas-producing countries; and
- •
- plans, objectives, expectations and intentions contained in this prospectus that are not historical.
All forward-looking statements speak only as of the date of this prospectus. You should not place undue reliance on these forward-looking statements. Although we believe that our plans, intentions and expectations reflected in or suggested by the forward-looking statements we make in this prospectus are reasonable, we can give no assurance that these plans, intentions or expectations will be achieved when anticipated or at all. We disclose important factors that could cause our actual results to differ materially from our expectations under "Risk Factors" beginning on page 20 and "Management's
41
Discussion and Analysis of Financial Condition and Results of Operations" beginning on page 51 and elsewhere in this prospectus. These factors include risks related to:
- •
- variations in the market demand for, and prices of, oil and natural gas;
- •
- uncertainties about our estimated quantities of oil and natural gas reserves;
- •
- the adequacy of our capital resources and liquidity including, but not limited to, access to additional borrowing capacity
under our revolving credit facility;
- •
- general economic and business conditions;
- •
- failure to realize expected value creation from property acquisitions;
- •
- uncertainties about our ability to replace reserves and economically develop our current reserves;
- •
- risks related to the concentration of our operations offshore in the Gulf of Mexico;
- •
- drilling results;
- •
- potential financial losses or earnings reductions from our commodity price risk management programs;
- •
- potential adoption of new governmental regulations (including any enhanced regulatory oversight attributable to the
governmental response to the Macondo well incident); and
- •
- our ability to satisfy future cash obligations and environmental costs.
These cautionary statements qualify all forward-looking statements attributable to us or persons acting on our behalf.
Reserve engineering is a process of estimating underground accumulations of oil and natural gas that cannot be measured in an exact way. The accuracy of any reserve estimate depends on the quality of available data, the interpretation of such data and price and cost assumptions made by our reserve engineers. In addition, the results of drilling, testing and production activities may justify revisions of estimates that were made previously. If significant, such revisions would change the schedule of any further production and development drilling. Accordingly, reserve estimates may differ from the quantities of oil and natural gas that are ultimately recovered.
42
We expect to receive net proceeds of approximately $277.0 million from the sale of the common stock offered by us, assuming an initial public offering price of $18.00 per share (the midpoint of the price range set forth on the cover page of this prospectus) and after deducting estimated expenses and underwriting discounts and commissions of approximately $23.0 million. An increase or decrease in the initial public offering price of $1.00 per share of common stock would cause the net proceeds that we will receive from the offering, after deducting estimated expenses and underwriting discounts and commissions, to increase or decrease by approximately $15.6 million.
We intend to use the net proceeds from this offering to repay outstanding borrowings under our revolving credit facility, of which $385 million was outstanding as of September 30, 2011. Our revolving credit facility matures on June 20, 2015 and bears interest at a variable rate, which was 3.1% as of September 30, 2011. The borrowings to be repaid were incurred primarily to fund our recently completed XTO Acquisition and our recently completed MOR Transaction. While we do not currently have any plans to immediately borrow additional amounts under the revolving credit facility, we may at any time reborrow amounts repaid under the revolving credit facility.
We will not receive any of the proceeds from the sale of shares of our common stock by the selling stockholders pursuant to any exercise of the underwriters' over-allotment option. We will pay all expenses related to this offering, other than underwriting discounts and commissions related to the shares sold by the selling stockholders.
Affiliates of certain of the underwriters are lenders under our revolving credit facility and will receive a portion of the proceeds of this offering. Accordingly, this offering is being made in compliance with Rule 5121 of FINRA. Please read "Underwriters" beginning on page 144.
We do not anticipate declaring or paying any cash dividends to holders of our common stock in the foreseeable future. We currently intend to retain future earnings, if any, to finance the expansion of our business. Our future dividend policy is within the discretion of our board of directors and will depend upon various factors, including our results of operations, financial condition, capital requirements and investment opportunities. In addition, our revolving credit facility places certain restrictions on our ability to pay cash distributions.
43
The following table sets forth the capitalization of Dynamic Offshore Holding, LP and Dynamic Offshore Resources, Inc., as applicable, as of September 30, 2011:
- •
- on an actual basis; and
- •
- on an as adjusted basis to give effect to this offering, the transactions described under "Corporate Reorganization" beginning on page 131 which will occur simultaneously with the closing of this offering, and the application of the net proceeds as set forth under "Use of Proceeds" beginning on page 43.
You should read the following table in conjunction with "Use of Proceeds" beginning on page 43, "Selected Historical Consolidated and Unaudited Pro Forma Financial Data" beginning on page 46, "Management's Discussion and Analysis of Financial Condition and Results of Operations" beginning on page 51 and our historical consolidated financial statements and unaudited pro forma financial information and related notes thereto appearing elsewhere in this prospectus.
| |
As of September 30, 2011 | |||||||
|---|---|---|---|---|---|---|---|---|
| |
Actual | As Adjusted | ||||||
| |
(In thousands) |
|||||||
Cash and cash equivalents(1) |
$ | 18,765 | $ | 18,766 | ||||
Long-term debt, including current maturities: |
||||||||
Revolving credit facility(1) |
$ | 385,000 | $ | 108,000 | ||||
Total long-term debt |
385,000 | 108,000 | ||||||
Owners'/stockholders' equity: |
||||||||
Partners' capital |
530,579 | — | ||||||
Common stock, $0.01 par value; 300,000,000 shares authorized (as further adjusted); 70,533,333 shares issued and outstanding (as further adjusted) |
— | 705 | ||||||
Preferred stock, $0.01 par value; 50,000,000 shares authorized (as further adjusted); no shares issued and outstanding (as further adjusted) |
— | — | ||||||
Additional paid-in capital |
— | 703,875 | ||||||
Retained earnings (accumulated loss)(2) |
— | — | ||||||
Total owners'/stockholders' equity |
530,579 | 704,580 | ||||||
Total capitalization |
$ | 915,579 | $ | 812,580 | ||||
- (1)
- As
of December 31, 2011, we had cash and cash equivalents of $59 million and $365 million was outstanding under our revolving credit
facility, leaving $65 million available for borrowing. This cash balance does not give effect to our subsequent $25 million approved distribution.
- (2)
- In connection with our corporate reorganization, an estimated incremental net deferred tax liability of $103.0 million will be established for differences between the tax and book basis of our assets and liabilities that are not currently subject to entity-level taxation, and a corresponding expense will be recorded to net income from continuing operations.
44
Purchasers of the common stock in this offering will experience immediate and substantial dilution in the net tangible book value per share of the common stock for accounting purposes. Our net tangible book value as of September 30, 2011, after giving pro forma effect to the transactions described under "Corporate Reorganization" beginning on page 131, was approximately $427.6 million, or $7.94 per share of common stock. Pro forma net tangible book value per share is determined by dividing our pro forma tangible net worth (tangible assets less total liabilities) by the total number of outstanding shares of common stock that will be outstanding immediately prior to the closing of this offering including giving effect to our corporate reorganization. After giving effect to the sale of the shares in this offering and further assuming the receipt of the estimated net proceeds (after deducting estimated discounts and expenses of this offering), our adjusted pro forma net tangible book value as of September 30, 2011 would have been approximately $704.6 million, or $9.99 per share. This represents an immediate increase in the net tangible book value of $2.05 per share to our existing stockholders and an immediate dilution to new investors purchasing shares in this offering of $8.01 per share, resulting from the difference between the offering price and the adjusted pro forma net tangible book value after this offering. The following table illustrates the per share dilution to new investors purchasing shares in this offering:
Assumed initial public offering price per share |
$ | 18.00 | |||||
Pro forma net tangible book value per share as of September 30, 2011 (after giving effect to our corporate reorganization) |
$ | 7.94 | |||||
Increase per share attributable to new investors in this offering |
2.05 | ||||||
Pro forma as adjusted net tangible book value per share after giving effect to our corporate reorganization and this offering |
9.99 | ||||||
Dilution in pro forma net tangible book value per share to new investors in this offering |
$ | 8.01 | |||||
The following table summarizes, on a pro forma basis as adjusted as of September 30, 2011, the total number of shares of common stock owned by existing stockholders and to be owned by new investors, the total consideration paid, and the average price per share paid by our existing stockholders and to be paid by new investors in this offering at $18.00, the midpoint of the range of the initial public offering prices set forth on the cover page of this prospectus, calculated before deduction of estimated underwriting discounts and commissions:
| |
Shares Acquired | Total Consideration | |
||||||||||||||
|---|---|---|---|---|---|---|---|---|---|---|---|---|---|---|---|---|---|
| |
Average Price Per Share |
||||||||||||||||
| |
Number | Percent | Amount | Percent | |||||||||||||
Existing stockholders(1) |
53,866,666 | 76.4 | % | $ | 427,580,000 | 58.9 | % | $ | 7.94 | ||||||||
New investors(2) |
16,666,667 | 23.6 | % | 300,000,000 | 41.1 | % | 18.00 | ||||||||||
Total |
70,533,333 | 100.0 | % | $ | 727,580,000 | 100.0 | % | $ | 10.32 | ||||||||
- (1)
- The
number of shares disclosed for the existing stockholders includes 2,500,000 shares that may be sold by the selling stockholders in this offering
pursuant to any exercise of the underwriters' over-allotment option and 743,831 shares of our common stock to be granted upon completion of this offering to the former bonus pool
participants at Dynamic Offshore Holding, LP.
- (2)
- The number of shares disclosed for the new investors does not include the 2,500,000 shares that may be purchased by the new investors from the selling stockholders in this offering pursuant to any exercise of the underwriters' over-allotment option.
45
SELECTED HISTORICAL CONSOLIDATED AND UNAUDITED PRO FORMA FINANCIAL DATA
Set forth below is (i) summary historical consolidated financial data for the period from January 1, 2008 through March 13, 2008 of SPN Resources LLC, our accounting predecessor, which has been derived from the audited financial statements of SPN Resources LLC included elsewhere in this prospectus, (ii) our summary historical consolidated financial data for the years ended December 31, 2008, 2009 and 2010, and balance sheet data at December 31, 2009 and 2010, which has been derived from the audited financial statements of Dynamic Offshore Holding, LP included elsewhere in this prospectus, (iii) our summary historical consolidated financial data for the nine months ended September 30, 2010 and 2011 and balance sheet data at September 30, 2011, which has been derived from the unaudited financial statements of Dynamic Offshore Holding, LP included elsewhere in this prospectus, and (iv) pro forma consolidated financial data for the year ended December 31, 2010 and the nine months ended September 30, 2011 and pro forma balance sheet data at September 30, 2011, which has been derived from the unaudited pro forma financial statements included elsewhere in this prospectus.
We have accounted for the MOR Transaction as a transaction between entities under common control because of our relationship with Riverstone, which also controls (as defined in the accounting standards codification master glossary) the Moreno Group companies. Transfers of net assets between entities under common control are accounted for as if the transfer occurred at the beginning of the period, and prior years are retrospectively adjusted to furnish comparative information similar to the pooling method.
The unaudited pro forma financial data for the year ended December 31, 2010, which reflects our acquisition of the Samson Acquisition Properties on July 8, 2010, our recently completed XTO Acquisition, our corporate reorganization and the effects of this offering and the application of the net proceeds, was derived from the unaudited pro forma financial information included elsewhere in this prospectus. The unaudited pro forma financial information for the year ended December 31, 2010 and the nine months ended September 30, 2011 was prepared as if each of these transactions occurred on January 1, 2010. The unaudited pro forma financial information as of September 30, 2011 was prepared as if our corporate reorganization and this offering and the application of the net proceeds had occurred on September 30, 2011.
You should read the following summary financial data in conjunction with "Corporate Reorganization" beginning on page 131, "Management's Discussion and Analysis of Financial Condition and Results of Operations" beginning on page 51, and our historical consolidated financial statements and unaudited pro forma financial information and related notes thereto included elsewhere in this prospectus. The financial information included in this prospectus may not be indicative of our future results of operations, financial position and cash flows. As a result of our numerous acquisitions and because we have grown significantly since we began operations, our historical results of operations may not be comparable from period to period. For more information on the comparability of our results, please read "Management's Discussion and Analysis of Financial Condition and Results of Operations—Factors that Significantly Affect Our Results" beginning on page 52.
46
| |
Historical | Pro Forma | ||||||||||||||||||||||||
|---|---|---|---|---|---|---|---|---|---|---|---|---|---|---|---|---|---|---|---|---|---|---|---|---|---|---|
| |
Predecessor | Dynamic Offshore Holding, LP | ||||||||||||||||||||||||
| |
January 1, 2008 Through March 13, 2008 |
Year Ended December 31, |
Nine Months Ended September 30, |
|
|
|||||||||||||||||||||
| |
|
Nine Months Ended September 30, 2011 |
||||||||||||||||||||||||
| |
Year Ended December 31, 2010 |
|||||||||||||||||||||||||
| |
2008 | 2009 | 2010 | 2010 | 2011 | |||||||||||||||||||||
| |
(In thousands) |
|||||||||||||||||||||||||
Statement of operations data: |
||||||||||||||||||||||||||
Oil and gas revenues |
$ | 56,179 | $ | 209,219 | $ | 178,992 | $ | 345,812 | $ | 255,496 | $ | 340,541 | 536,507 | 436,179 | ||||||||||||
Other operating revenues |
741 | 1,695 | 2,017 | 12,815 | 7,770 | 11,926 | 12,815 | 11,926 | ||||||||||||||||||
|
56,920 | 210,914 | 181,009 | 358,627 | 263,266 | 352,467 | 549,322 | 448,105 | ||||||||||||||||||
Operating expenses: |
||||||||||||||||||||||||||
Lease operating expense |
8,791 | 36,725 | 60,618 | 89,399 | 63,511 | 78,998 | 126,135 | 98,605 | ||||||||||||||||||
Exploration expense |
— | 80 | 8,999 | 2,100 | 1,736 | 7,285 | 2,100 | 7,285 | ||||||||||||||||||
Depreciation, depletion and amortization |
13,414 | 49,648 | 88,573 | 195,122 | 96,205 | 102,417 | 271,568 | 132,289 | ||||||||||||||||||
General and administrative expense |
2,275 | 17,843 | 25,655 | 24,328 | 19,280 | 19,328 | 24,328 | 19,328 | ||||||||||||||||||
Other operating expense(1) |
4,786 | 29,930 | 51,142 | 73,047 | 50,114 | 51,709 | 82,931 | 58,328 | ||||||||||||||||||
|
29,266 | 134,226 | 234,987 | 383,996 | 230,846 | 259,737 | 507,062 | 315,835 | ||||||||||||||||||
Income (loss) from operations |
27,654 | 76,688 | (53,978 | ) | (25,369 | ) | 32,420 | 92,730 | 42,260 | 132,270 | ||||||||||||||||
Other income (expense): |
||||||||||||||||||||||||||
Interest expense, net |
(34 | ) | (2,492 | ) | (7,138 | ) | (13,541 | ) | (10,688 | ) | (6,409 | ) | (12,123 | ) | (4,324 | ) | ||||||||||
Commodity derivative income (expense) |
— | 159,939 | (21,887 | ) | 6,990 | 29,838 | 61,889 | 6,990 | 61,889 | |||||||||||||||||
Bargain purchase gain |
— | — | 161,351 | 4,024 | 4,024 | — | 4,024 | — | ||||||||||||||||||
Other |
— | (103 | ) | — | (1,080 | ) | — | (146 | ) | (1,080 | ) | (146 | ) | |||||||||||||
Income (loss) before income taxes |
27,620 | 234,032 | 78,348 | (28,976 | ) | 55,594 | 148,064 | 40,071 | 189,689 | |||||||||||||||||
Income tax benefit (expense) |
— | (14,738 | ) | 20,387 | 14,814 | 4,344 | 1,544 | (14,719 | ) | (66,387 | ) | |||||||||||||||
Net income (loss) |
27,620 | 219,294 | 98,735 | (14,162 | ) | 59,938 | 149,608 | 25,352 | 123,302 | |||||||||||||||||
Less: Net income (loss) attributable to noncontrolling interests |
— | 34,648 | 57,663 | (4,070 | ) | 10,184 | 460 | (2,645 | ) | 299 | ||||||||||||||||
Net income (loss) attributable to Dynamic Offshore Holding, LP |
$ | 27,620 | $ | 184,646 | $ | 41,072 | $ | (10,092 | ) | $ | 49,754 | $ | 149,148 | $ | 27,997 | $ | 123,003 | |||||||||
Pro forma net income (loss) attributable to Dynamic Offshore Holding, LP/Dynamic Offshore Resources, Inc. |
$ | 129,600 | $ | 13,634 | $ | (16,883 | ) | $ | 29,516 | $ | 95,947 | $ | 27,997 | $ | 123,003 | |||||||||||
Pro forma basic and diluted earnings per share |
$ | 1.84 | $ | 0.19 | $ | (0.24 | ) | $ | 0.42 | $ | 1.36 | $ | 0.40 | $ | 1.74 | |||||||||||
Adjusted EBITDA(2) |
$ | 41,953 | $ | 154,165 | $ | 131,440 | $ | 235,567 | $ | 175,756 | $ | 206,158 | $ | 383,626 | $ | 278,064 | ||||||||||
- (1)
- Includes
insurance expense, workover expense, accretion expense, casualty loss (gain), loss on abandonments, loss (gain) on sale of assets and other.
- (2)
- Adjusted EBITDA is a non-GAAP financial measure. For a definition of Adjusted EBITDA and a reconciliation of Adjusted EBITDA to our net income (loss) and net cash provided by operating activities, please read "—Non-GAAP Financial Measure" beginning on page 48.
47
| |
As of December 31, | |
|
||||||||||
|---|---|---|---|---|---|---|---|---|---|---|---|---|---|
| |
As of September 30, 2011 |
Pro Forma As of September 30, 2011 |
|||||||||||
| |
2009 | 2010 | |||||||||||
| |
(In thousands) |
||||||||||||
Balance sheet data: |
|||||||||||||
Cash and cash equivalents |
$ | 88,457 | $ | 75,162 | $ | 18,765 | $ | 18,766 | |||||
Net property, plant and equipment |
861,204 | 864,645 | 1,145,544 | 1,145,544 | |||||||||
Total assets |
1,138,999 | 1,067,131 | 1,374,766 | 1,371,767 | |||||||||
Long-term debt |
243,000 | 203,205 | 385,000 | 108,000 | |||||||||
Total owners'/stockholders' equity |
526,244 | 475,531 | 530,579 | 704,580 | |||||||||
| |
|
Dynamic Offshore Holding, LP | |||||||||||||||||
|---|---|---|---|---|---|---|---|---|---|---|---|---|---|---|---|---|---|---|---|
| |
Predecessor | ||||||||||||||||||
| |
Years Ended December 31, |
Nine Months Ended September 30, |
|||||||||||||||||
| |
January 1, 2008 Through March 13, 2008 |
||||||||||||||||||
| |
2008 | 2009 | 2010 | 2010 | 2011 | ||||||||||||||
| |
(In thousands) |
||||||||||||||||||
Other financial data: |
|||||||||||||||||||
Net cash provided by operating activities |
$ | 22,836 | $ | 173,704 | $ | 37,796 | $ | 157,656 | $ | 139,553 | $ | 156,602 | |||||||
Net cash provided by (used in) investing activities |
(3,627 | ) | (431,423 | ) | 62,075 | (94,605 | ) | (113,576 | ) | (296,676 | ) | ||||||||
Net cash provided by (used in) financing activities |
— | 309,749 | (63,589 | ) | (76,346 | ) | 5,823 | 83,677 | |||||||||||
Set forth below is unaudited financial data regarding our predecessor's revenues and direct operating expenses. The financial data regarding revenues and direct operating expenses is not indicative of the financial condition or results of operations of SPN Resources, LLC due to the omission of various operating expenses. Prior to our acquisition, Superior did not account for SPN Resources, LLC as a separate business unit. As such, certain costs, such as depreciation, depletion and amortization, accretion of asset retirement obligations, general and administrative expense and interest expense were not allocated to SPN Resources, LLC.
| |
Years Ended December 31, | ||||||
|---|---|---|---|---|---|---|---|
| |
2006 | 2007 | |||||
| |
(In thousands) |
||||||
Oil and gas revenues |
$ | 139,726 | $ | 196,629 | |||
Other operating revenues |
2,482 | 3,449 | |||||
|
142,208 | 200,078 | |||||
Direct operating expenses |
46,565 | 44,615 | |||||
Excess of revenues over direct operating expenses |
$ | 95,683 | $ | 155,463 | |||
Non-GAAP Financial Measure
Adjusted EBITDA
Adjusted EBITDA is a supplemental non-GAAP financial measure that is used by management and external users of our consolidated financial statements, such as industry analysts, investors, lenders and rating agencies, to compare our performance across reporting periods on a consistent basis by excluding items that we do not believe are indicative of our core operating performance.
48
We define Adjusted EBITDA as revenues, including commodity derivative settlements, less lease operating expense, workover expense, insurance expense and general and administrative expense. Adjusted EBITDA is not a measure of net income or cash flows as determined by GAAP.
Our senior management reviews Adjusted EBITDA monthly as a core internal management process. We believe that investors benefit from having access to the same financial measures that our management uses in evaluating our operating results. Adjusted EBITDA provides useful information to investors because it is a supplemental financial measure used by us and by external users of our financial statements, including investors, commercial banks and others, to assess:
- •
- the financial performance of our assets without regard to financing methods, capital structure or historical cost basis;
- •
- our operating performance and return on capital as compared to other companies in our industry, without regard to
financing or capital structure; and
- •
- the viability of acquisitions and capital expenditure projects and the overall rates of return on alternative investment opportunities.
Adjusted EBITDA has limitations as an analytical tool and should not be considered as an alternative to, or more meaningful than, performance measures calculated in accordance with GAAP. Some of these limitations are:
- •
- certain items excluded from Adjusted EBITDA are significant components in understanding a company's financial performance,
such as a company's cost of capital and tax structure;
- •
- Adjusted EBITDA does not reflect our cash expenditures or future requirements for capital expenditures or contractual
commitments;
- •
- Adjusted EBITDA does not reflect changes in, or cash requirements for, our working capital needs;
- •
- Adjusted EBITDA does not consider the potentially dilutive impact of share-based compensation;
- •
- although depreciation and amortization are non-cash charges, the assets being depreciated and amortized will
often have to be replaced in the future, and Adjusted EBITDA does not reflect any cash requirements for such replacements; and
- •
- our computations of Adjusted EBITDA may not be comparable to other similarly titled measures of other companies.
Management compensates for the limitations of Adjusted EBITDA as an analytical tool by reviewing the comparable GAAP measures, understanding the differences between the measures and incorporating that understanding into its decision-making processes.
49
The following tables present a reconciliation of the non-GAAP financial measure of Adjusted EBITDA to the GAAP financial measures of net income (loss) and net cash provided by operating activities.
| |
Historical | Pro Forma | |||||||||||||||||||||||
|---|---|---|---|---|---|---|---|---|---|---|---|---|---|---|---|---|---|---|---|---|---|---|---|---|---|
| |
Predecessor | Dynamic Offshore Holding, LP | |||||||||||||||||||||||
| |
January 1, 2008 Through March 13, 2008 |
Year Ended December 31, |
Nine Months Ended September 30, |
|
|
||||||||||||||||||||
| |
|
Nine Months Ended September 30, 2011 |
|||||||||||||||||||||||
| |
Year Ended December 31, 2010 |
||||||||||||||||||||||||
| |
2008 | 2009 | 2010 | 2010 | 2011 | ||||||||||||||||||||
| |
(In thousands) |
||||||||||||||||||||||||
Reconciliation of net income (loss) to Adjusted EBITDA: |
|||||||||||||||||||||||||
Net income (loss) |
$ | 27,620 | $ | 219,294 | $ | 98,735 | $ | (14,162 | ) | $ | 59,938 | $ | 149,608 | $ | 25,352 | $ | 123,302 | ||||||||
Interest expense, net |
34 | 2,492 | 7,138 | 13,541 | 10,688 | 6,409 | 12,123 | 4,324 | |||||||||||||||||
Income tax expense (benefit) |
— | 14,738 | (20,387 | ) | (14,814 | ) | (4,344 | ) | (1,544 | ) | 14,719 | 66,387 | |||||||||||||
Depreciation, depletion and amortization |
13,414 | 49,648 | 88,573 | 195,122 | 96,205 | 102,417 | 271,568 | 132,289 | |||||||||||||||||
Unrealized (gain) loss on commodity derivatives |
— | (146,671 | ) | 97,975 | 36,181 | 7,043 | (67,507 | ) | 36,181 | (67,507 | ) | ||||||||||||||
Other operating expense |
885 | 14,561 | 20,757 | 22,643 | 10,250 | 16,629 | 26,627 | 19,123 | |||||||||||||||||
Bargain purchase gain |
— | — | (161,351 | ) | (4,024 | ) | (4,024 | ) | — | (4,024 | ) | — | |||||||||||||
Other |
— | 103 | — | 1,080 | — | 146 | 1,080 | 146 | |||||||||||||||||
Adjusted EBITDA |
$ | 41,953 | $ | 154,165 | $ | 131,440 | $ | 235,567 | $ | 175,756 | $ | 206,158 | $ | 383,626 | $ | 278,064 | |||||||||
Reconciliation of net cash provided by operating activities to Adjusted EBITDA: |
|||||||||||||||||||||||||
Net cash provided by operating activities |
$ | 22,836 | $ | 173,704 | $ | 37,796 | $ | 157,656 | $ | 139,553 | $ | 156,602 | |||||||||||||
Derivative settlements |
— | 13,268 | 76,088 | 43,171 | 36,881 | (5,618 | ) | ||||||||||||||||||
Interest expense, net |
34 | 2,492 | 7,138 | 13,541 | 10,688 | 6,409 | |||||||||||||||||||
Exploration expense |
— | 80 | 8,999 | 2,100 | 1,736 | 7,285 | |||||||||||||||||||
Amortization in interest expense, net |
— | 315 | 219 | (287 | ) | (332 | ) | (291 | ) | ||||||||||||||||
Current income tax expense |
— | — | (2,188 | ) | — | — | — | ||||||||||||||||||
Changes in operating assets and liabilities |
18,978 | (45,784 | ) | (1,299 | ) | 19,156 | (10,806 | ) | 41,178 | ||||||||||||||||
Other |
105 | 10,090 | 4,687 | 230 | (1,964 | ) | 593 | ||||||||||||||||||
Adjusted EBITDA |
$ | 41,953 | $ | 154,165 | $ | 131,440 | $ | 235,567 | $ | 175,756 | $ | 206,158 | |||||||||||||
50
MANAGEMENT'S DISCUSSION AND ANALYSIS OF
FINANCIAL CONDITION AND RESULTS OF OPERATIONS
The following discussion and analysis of our financial condition and results of operations should be read in conjunction with our consolidated financial statements and related notes appearing elsewhere in this prospectus. The following discussion contains "forward-looking statements" that reflect our future plans, estimates, beliefs and expected performance. We caution that assumptions, expectations, projections, intentions, or beliefs about future events may, and often do, vary from actual results and the differences can be material. Some of the key factors which could cause actual results to vary from our expectations include variations in the market demand for, and prices of, oil and natural gas; uncertainties about our estimated quantities of oil and natural gas reserves; the adequacy of our capital resources and liquidity including, but not limited to, access to additional borrowing capacity under our revolving credit facility; access to capital and general economic and business conditions; failure to realize expected value creation from property acquisitions; uncertainties about our ability to replace reserves and economically develop our current reserves; risks related to the concentration of our operations offshore in the Gulf of Mexico; drilling results; potential financial losses or earnings reductions from our commodity price risk management programs; potential adoption of new governmental regulations (including any enhanced regulatory oversight attributable to the governmental response to the Macondo well incident); our ability to satisfy future cash obligations and environmental costs; as well as those factors discussed below and elsewhere in the prospectus, all of which are difficult to predict. In light of these risks, uncertainties and assumptions, the forward-looking events discussed may not occur. Please read "Risk Factors" beginning on page 20 and "Cautionary Note Regarding Forward-Looking Statements" beginning on page 41.
Overview
We are an independent exploration and production company focused on the acquisition and development of producing oil and natural gas properties in the Gulf of Mexico. As of July 31, 2011, our estimated net proved reserves were 60.1 MMBoe, of which 50% was oil and 81% was proved developed, with an associated PV-10 of approximately $1.7 billion, based on SEC pricing of $88.44 per Bbl for oil and $4.19 per MMBtu for natural gas. As of that same date, our estimated net probable reserves were 16.0 MMBoe with an associated PV-10 of approximately $370.1 million. Please read "Prospectus Summary—Summary Historical Operating and Reserve Data—Summary Reserve Data" beginning on page 15 for information on our estimated net proved and probable reserves, PV-10 and related pricing. During November 2011, our properties had aggregate average net daily production in excess of 27,000 Boe per day.
A significant portion of our growth has been achieved through a series of acquisitions. Since we began operations in 2008, we have completed ten material acquisitions. For example, we recently acquired substantially all of the Gulf of Mexico assets that Exxon acquired as part of its acquisition of XTO Energy Inc. in 2010 and completed an acquisition from MOR of the remaining 25% working interest in the properties that we acquired from SPN Resources in 2008. As a result of these acquisitions and because we have grown significantly over that time, our historical results of operations may not be comparable from year-to-year.
The following table presents key metrics related to each of our material acquisitions. For additional details regarding our material acquisitions, please read "Business—Our Acquisition History"
51
beginning on page 70, "—XTO Acquisition" beginning on page 72 and "—MOR Transaction" beginning on page 73.
Acquisition
|
Acquisition Date |
Major Fields | Net Proved Reserves (MMBoe) As of Acquisition Date(1) |
|||||
|---|---|---|---|---|---|---|---|---|
SPN Resources(2) |
March 2008 | South Pass 60, West Delta 79/80 | 10.2 | |||||
Northstar |
July 2008 | Eugene Island 307, Eugene Island 32 | 8.7 | |||||
Bayou Bend Petroleum |
May 2009 | Marsh Island | 0.6 | |||||
Beryl Oil and Gas(2) |
October 2009 | Vermilion 362-371 | 14.3 | |||||
Shell |
January 2010 | Bullwinkle | 6.2 | |||||
Samson Resources |
July 2010 | Vermilion 272, High Island 52 | 4.9 | |||||
Providence Resources |
March 2011 | Ship Shoal 252/253, Main Pass 19 | 1.4 | |||||
Gryphon Exploration |
May 2011 | High Island 52, Ship Shoal 301 | 2.1 | |||||
XTO |
August 2011 | South Marsh Island 41, West Cameron 485/507 | 13.5 | |||||
MOR |
September 2011 | South Pass 60, West Delta 79/80 | (3) | 3.4 | ||||
- (1)
- Based
on reserve reports or our internally generated reserve estimates prepared at or near the acquisition date.
- (2)
- Includes
interests subsequently acquired from Superior in exchange for a 10% equity interest in us.
- (3)
- We acquired from MOR the remaining 25% interest in the properties that we acquired from SPN Resources in 2008.
Factors that Significantly Affect Our Results
Acquisitions
As described above, acquisitions and the resulting changes to our company have been our defining features since we began operations in 2008. In addition to the increases in magnitude in our operations as a result of the acquisitions, the Bullwinkle acquisition in January 2010 also changed the scope of our operations by adding operation of the associated platform, which resulted in our generating fees from production handling agreements ("PHA fees"). Before we acquired Bullwinkle, we did not generate significant amounts of PHA fees.
We intend to continue to selectively acquire companies and producing properties based on disciplined valuations of proved reserves. In addition, we believe that the Gulf of Mexico continues to represent an attractive buyer's market, which should facilitate this acquisition strategy. As with our historical acquisitions, any future acquisitions could make year-to-year comparisons of our results of operations difficult. We may also incur substantial debt or issue additional equity securities to fund future acquisitions.
We have accounted for the MOR Transaction as a transaction between entities under common control because of our relationship with the Riverstone/Carlyle Funds, which also control (as defined in the accounting standards codification master glossary) the Moreno Group companies. Transfers of net assets between entities under common control are accounted for as if the transfer occurred at the beginning of the period, and prior years are retrospectively adjusted to furnish comparative information similar to the pooling method.
Commodity Prices
Our results of operations are heavily influenced by commodity prices, which are subject to wide fluctuations in response to relatively wide changes in supply and demand. For a description of factors that may impact future commodity prices, please read "Risk Factors—Risks Related to the Oil and Natural Gas Industry and Our Business—A substantial or extended decline in oil and natural gas prices
52
may adversely affect our business, financial condition or results of operations and our ability to meet our capital expenditure obligations and financial commitments" beginning on page 20.
Oil and natural gas prices have been subject to significant fluctuations during the past several years. In general, oil prices were significantly higher during 2010 when measured against 2009 while natural gas prices were moderately higher. The NYMEX oil price and NYMEX natural gas price reached high and low daily settlement prices of $102.59 and $92.19 per Bbl and $3.78 and $2.99 per MMBtu during the period from November 1, 2011 to December 31, 2011. At December 31, 2011, the NYMEX oil price and NYMEX natural gas price were $98.83 per Bbl and $3.10 per MMBtu.
The table below sets forth the prices we receive per unit of volume for our oil and natural gas production, both including and excluding the effects of our commodity derivative contracts, and also includes the benchmark price for each product.
| |
Year Ended December 31, |
Nine Months Ended September 30, |
|||||||||||||||
|---|---|---|---|---|---|---|---|---|---|---|---|---|---|---|---|---|---|
| |
2008 | 2009 | 2010 | 2010 | 2011 | ||||||||||||
Average sales prices: |
|||||||||||||||||
Oil, without realized derivatives ($/Bbl) |
103.80 | 62.64 | 78.65 | 76.37 | 106.23 | ||||||||||||
Natural gas, without realized derivatives ($/Mcf)(1) |
10.12 | 4.23 | 4.72 | 4.87 | 4.74 | ||||||||||||
Oil, with realized derivatives ($/Bbl) |
113.65 | 89.95 | 86.35 | 86.32 | 99.85 | ||||||||||||
Natural gas, with realized derivatives ($/Mcf)(1) |
10.10 | 5.89 | 5.68 | 5.76 | 5.48 | ||||||||||||
Oil, WTI benchmark ($/Bbl) |
99.75 | 62.09 | 79.61 | 77.69 | 95.47 | ||||||||||||
Natural gas, Henry Hub benchmark ($/MMBtu) |
8.90 | 4.16 | 4.38 | 4.52 | 4.21 | ||||||||||||
- (1)
- Realized prices include realized gains or losses on cash settlements for our commodity derivative contracts, which have not been designated for hedge accounting. We have not made any estimates of the impact of commodities derivatives on the average sales price for our predecessor.
Although we cannot predict the occurrence of events that may affect future commodity prices or the degree to which these prices will be affected, the prices for any commodity that we produce will generally approximate current market prices in the geographic region of the production. We intend to continue to manage our exposure to commodity price risk in the near term while remaining opportunistic over the long term. We use a variety of hedging instruments to accomplish our risk management objectives and enhance the stability of our cash flows. Our commodity derivative contracts are currently in the form of basic swaps and collars that are designed to provide a fixed price (swaps) or defined range of prices (collars) that we will receive. We actively monitor our hedge portfolio to support our cash flow objectives. For a description of our commodity hedge position, please read "—Quantitative and Qualitative Disclosures About Market Risk—Commodity Price Risk" beginning on page 66.
Nearly all of our oil is sold at LLS, HLS and EIC prices, which have recently traded at a significant premium to NYMEX WTI benchmark prices. In general, differentials are adjustments to the benchmark price for crude oil based on grade, sulfur content and location of the sales point. Our oil production benefits from higher pricing differentials relative to many other North American crude oil producers in other areas. Moreover, these pricing differentials have been increasing in recent months. For example, for the three months ended September 30, 2011, the average realized price before the effect of commodity derivative contracts for our oil production was $104.91 per Bbl, compared to an average WTI forward index price of $89.54 per Bbl for the same period.
53
Production Volumes
The volumes of oil and natural gas that we produce are driven by several factors, including:
- •
- our acquisitions of oil and natural gas properties;
- •
- the amount of capital we invest in the development of our oil and natural gas properties, including the drilling of new
wells, which may be exploratory wells, and the recompletion of existing wells;
- •
- facility or equipment malfunctions;
- •
- adverse weather conditions, such as hurricanes and tropical storms, which are common in the Gulf of Mexico during certain
times of the year;
- •
- delays imposed by or resulting from compliance with regulatory requirements; and
- •
- the rate at which production volumes on our wells naturally decline.
The following table sets forth summary data with respect to our production volumes for the periods presented.
| |
Year Ended December 31, |
Nine Months Ended September 30, |
|||||||||||||||
|---|---|---|---|---|---|---|---|---|---|---|---|---|---|---|---|---|---|
| |
2008 | 2009 | 2010 | 2010 | 2011 | ||||||||||||
Net sales volumes: |
|||||||||||||||||
Oil (MBbls) |
1,363 | 2,145 | 3,289 | 2,447 | 2,559 | ||||||||||||
Natural gas (MMcf) |
6,692 | 10,555 | 18,468 | 14,086 | 14,482 | ||||||||||||
Total (MBoe) |
2,478 | 3,904 | 6,367 | 4,795 | 4,973 | ||||||||||||
Average net daily production (Boe/d) |
6,770 | 10,696 | 17,444 | 17,564 | 18,216 | ||||||||||||
How We Evaluate Our Operations
Our profitability is a function of the difference between the revenues we receive from our operations, including revenues from the crude oil and natural gas we sell, and the costs associated with conducting our operations, including operating and general and administrative costs and the impact of our commodity hedging activities.
Our management uses a variety of financial and operational measurements to analyze our performance. The most important of these measurements include: (1) Adjusted EBITDA, (2) production volumes and (3) operating expenses.
Adjusted EBITDA
Our senior management reviews Adjusted EBITDA monthly as a core internal management process. We believe that investors benefit from having access to the same financial measures that our management uses in evaluating our operating results. Adjusted EBITDA provides useful information to investors because it is a supplemental financial measure used by us and by external users of our financial statements, including investors, commercial banks and others, to assess:
- •
- the financial performance of our assets without regard to financing methods, capital structure or historical cost basis;
- •
- our operating performance and return on capital as compared to other companies in our industry, without regard to financing or capital structure; and
54
- •
- the viability of acquisitions and capital expenditure projects and the overall rates of return on alternative investment opportunities.
Management compensates for the limitations of Adjusted EBITDA as an analytical tool by reviewing the comparable GAAP measures, understanding the differences between the measures and incorporating that understanding into its decision-making processes. For a definition of Adjusted EBITDA and a reconciliation of Adjusted EBITDA to our net income (loss) and net cash provided by operating activities, please read "Prospectus Summary—Summary Historical Consolidated and Unaudited Pro Forma Financial Data—Non-GAAP Financial Measure" beginning on page 13.
Production Volumes
Our expected production volumes for any given period form an important part of our outlook and planning for that period. As a result, our senior management reviews actual production volumes in relation to our expected production volumes for the period on a regular basis. We identify the causes for the variance, and, based on the results of that analysis, adjust our operations accordingly, which may include increasing expenditures.
Certain factors affecting our production volumes are outside of our control. To the extent possible, based on disciplined estimates of these factors and our experience, we include these factors in estimating our future production volumes. For a description of the factors affecting our production volumes, please read "Risk Factors—Risks Related to the Oil and Natural Gas Industry and Our Business—Drilling for and producing oil and natural gas are high-risk activities with many uncertainties that could adversely affect our business, financial condition or results of operations" beginning on page 22.
Operating Expenses
Operating expenses are costs associated with conducting our operations. Lease operating expense and depreciation, depletion and amortization comprise the most significant portion of our operating expenses. For a description of our primary operating expenses, please read "—Basis of Presentation—Our Expenses" beginning on page 56.
The table below sets forth the operating expenses per unit of volume for our production.
| |
Year Ended December 31, |
Nine Months Ended September 30, |
|||||||||||||||
|---|---|---|---|---|---|---|---|---|---|---|---|---|---|---|---|---|---|
| |
2008 | 2009 | 2010 | 2010 | 2011 | ||||||||||||
Costs and expenses ($/Boe): |
|||||||||||||||||
Lease operating expense(1) |
14.82 | 15.53 | 14.04 | 13.25 | 15.89 | ||||||||||||
Depreciation, depletion and amortization |
20.04 | 22.69 | 30.65 | 20.06 | 20.59 | ||||||||||||
General and administrative expense |
7.20 | 6.57 | 3.82 | 4.02 | 3.89 | ||||||||||||
- (1)
- Our lease operating expenses do not include the effects of insurance costs. For more detail about our aggregate insurance costs, please read the operating expense information contained within Note 3 to the audited consolidated financial statements of Dynamic Offshore Holding, LP.
Basis of Presentation
Sources of Our Revenues
Oil and natural gas revenues. Our revenues are derived from the sale of oil and natural gas production and do not include the effects of derivatives. Our revenues may vary significantly from period to period as a result of changes in volumes of production sold or changes in commodity prices.
55
Other operating revenues. Other operating revenues consist primarily of PHA fees. Prior to our acquisition of Bullwinkle in January 2010, we did not generate significant amounts of PHA fees.
Our Expenses
Lease operating expense. Lease operating expense is the daily costs incurred to bring crude oil and natural gas out of the ground and to the market, together with the daily costs incurred to maintain our producing properties. Such costs include field personnel compensation, production and ad valorem taxes, utilities, maintenance, and repair expenses related to our oil and natural gas properties. We do not believe that the amounts of production and ad valorem taxes that we incur are material to our operations.
On a field-by-field basis, we do not expect personnel costs to change significantly in the near term. Transportation and equipment rental expenses depend on the level of demand for these services, which we cannot predict. Costs for fuel, lubricants and chemicals are expected to fluctuate with the price of crude oil.
Workover expense. Workover expense is major remedial operation on a completed well to restore, maintain, or improve the well's production. Because the amount of workover expense is closely correlated to the levels of workover activity, which is not regularly scheduled, workover expense is not necessarily comparable from period-to-period.
Exploration expense. Costs related to exploratory wells that do not find proved reserves are charged as exploration expense. These costs include costs for topographical, geological and geophysical studies, including seismic data, rights of access to properties and costs of carrying and retaining undeveloped properties, such as delay rentals. As with workover expense, the amount of exploration expense is non-recurring, and may not necessarily be comparable from period-to-period.
Depreciation, depletion and amortization. Depreciation, depletion and amortization ("DD&A") is the systematic expensing of the capitalized costs incurred to acquire, explore and develop oil and natural gas. As a company that utilizes the successful efforts method of accounting, we capitalize all costs associated with our acquisition and development efforts and all successful exploration efforts, and allocate these costs to each equivalent barrel produced using the units-of-production method. We also include unproved property impairment and costs associated with lease expirations. Impairment charges are recorded for proved properties if the carrying value exceeds estimated fair value.
General and administrative expense. General and administrative expense includes overhead, including payroll and benefits for our corporate staff, costs of maintaining our headquarters, costs of managing our production and development operations, franchise taxes, audit and other professional fees and legal compliance. Following this offering and giving effect to the discontinuance of our management fee payments, we anticipate incurring incremental general and administrative expenses of approximately $0.4 million per year (not including non-cash costs related to incremental executive compensation) related to being a publicly traded company. We currently pay to an affiliate of Riverstone an annual monitoring fee capped at $1.5 million. We anticipate that, although the requirement to pay the monitoring fee will be discontinued in connection with this offering, that portion of our annual general and administrative expenses will be replaced with costs of being a publicly traded company.
Insurance expense. Insurance expense includes workers' compensation, casualty insurance, pollution liability including oil spill financial responsibility, property insurance (including windstorm) and management liability.
Loss on abandonments. Loss on abandonments is the difference between the actual settlement cost of our property abandonments and the recorded amount.
56
Interest expense. We finance a portion of our working capital requirements, capital expenditures and acquisitions with borrowings under our revolving credit facility. As a result, we incur interest expense that is affected by both fluctuations in interest rates and our financing decisions. We reflect interest paid to the lenders under our revolving credit facility in interest expense. In addition, we include the amortization of deferred financing costs (including origination and amendment fees), commitment fees and annual agency fees as interest expense.
Commodity derivative income (expense). We utilize commodity derivative contracts to reduce our exposure to fluctuations in the price of crude oil and natural gas. We recognize unrealized gains and losses associated with our open commodity derivative contracts as commodity prices and commodity derivative contracts change. The commodity derivative contracts we have in place are not classified as hedges for accounting purposes. Consequently, these commodity derivative contracts are marked-to-market each quarter with fair value gains and losses, both realized and unrealized, recognized currently as a gain or loss on mark-to-market commodity derivative contracts in our income statement. Cash flow is only impacted to the extent the actual settlements under the contracts result in making or receiving a payment from the counterparty.
Bargain purchase gain. A bargain purchase gain is recognized on an acquisition if our estimate of the fair value of the net assets acquired exceeds the fair value of the total consideration paid.
Income tax benefit (expense). Our provision for income taxes is solely applicable to federal tax obligations of Dynamic Offshore Resources NS Parent, Inc. ("DOR NS"), our indirect wholly-owned subsidiary. Deferred income tax assets and liabilities are recognized for temporary differences between the assets and liabilities of DOR NS for financial reporting and tax purposes. A valuation allowance for deferred tax assets is recorded when it is more-likely-than-not that the benefit from the deferred tax assets will not be realized. Our profits and losses other than within DOR NS are reported directly to the taxing authorities by our partners. Accordingly, no provision for income taxes has been included for those profits and losses, except as they relate to DOR NS.
Corporate Reorganization
In connection with the closing of this offering, we will merge into a newly formed corporation that will be subject to federal and state entity-level taxation. As a result, a net deferred tax liability will be established for differences between the tax and book basis of our assets and liabilities that are not currently subject to entity-level taxation and a corresponding expense will be recorded to net income. We estimate the incremental net deferred tax liability to be approximately $103.0 million.
57
Results of Operations
The following table summarizes the key components of our results of operations for the periods indicated:
| |
Year Ended December 31, |
Nine Months Ended September 30, |
|||||||||||||||
|---|---|---|---|---|---|---|---|---|---|---|---|---|---|---|---|---|---|
| |
2008(1) | 2009 | 2010 | 2010 | 2011 | ||||||||||||
| |
|
|
|
(unaudited) |
|||||||||||||
| |
(In thousands) |
||||||||||||||||
Oil and gas revenues |
$ | 209,219 | $ | 178,992 | $ | 345,812 | $ | 255,496 | $ | 340,541 | |||||||
Other operating revenues |
1,695 | 2,017 | 12,815 | 7,770 | 11,926 | ||||||||||||
|
210,914 | 181,009 | 358,627 | 263,266 | 352,467 | ||||||||||||
Operating expenses: |
|||||||||||||||||
Lease operating expense |
36,725 | 60,618 | 89,399 | 63,511 | 78,998 | ||||||||||||
Exploration expense |
80 | 8,999 | 2,100 | 1,736 | 7,285 | ||||||||||||
Depreciation, depletion and amortization |
49,648 | 88,573 | 195,122 | 96,205 | 102,417 | ||||||||||||
General and administrative expense |
17,843 | 25,655 | 24,328 | 19,280 | 19,328 | ||||||||||||
Insurance expense |
14,315 | 32,688 | 36,677 | 29,121 | 26,323 | ||||||||||||
Workover expense |
1,134 | 6,696 | 15,827 | 12,479 | 16,042 | ||||||||||||
Accretion expense |
4,494 | 7,211 | 13,183 | 9,630 | 8,897 | ||||||||||||
Casualty loss (gain), net |
10,000 | — | (3,380 | ) | (2,363 | ) | (208 | ) | |||||||||
Loss (gain) on abandonments |
— | 4,687 | 2,601 | 1,550 | 2,486 | ||||||||||||
Loss (gain) on sale of assets |
— | (140 | ) | 8,139 | (303 | ) | — | ||||||||||
Other |
(13 | ) | — | — | — | (1,831 | ) | ||||||||||
|
134,226 | 234,987 | 383,996 | 230,846 | 259,737 | ||||||||||||
Income (loss) from operations |
76,688 | (53,978 | ) | (25,369 | ) | 32,420 | 92,730 | ||||||||||
Other income (expense): |
|||||||||||||||||
Interest expense, net |
(2,492 | ) | (7,138 | ) | (13,541 | ) | (10,688 | ) | (6,409 | ) | |||||||
Commodity derivative income (expense) |
159,939 | (21,887 | ) | 6,990 | 29,838 | 61,889 | |||||||||||
Bargain purchase gain |
— | 161,351 | 4,024 | 4,024 | — | ||||||||||||
Other |
(103 | ) | — | (1,080 | ) | — | (146 | ) | |||||||||
Income (loss) before income taxes |
234,032 | 78,348 | (28,976 | ) | 55,594 | 148,064 | |||||||||||
Income tax benefit (expense) |
(14,738 | ) | 20,387 | 14,814 | 4,344 | 1,544 | |||||||||||
Net income (loss) |
219,294 | 98,735 | (14,162 | ) | 59,938 | 149,608 | |||||||||||
Less: Net income (loss) attributable to noncontrolling interests |
34,648 | 57,663 | (4,070 | ) | 10,184 | 460 | |||||||||||
Net income (loss) attributable to Dynamic Offshore Holding, LP |
$ | 184,646 | $ | 41,072 | $ | (10,092 | ) | $ | 49,754 | $ | 149,148 | ||||||
Adjusted EBITDA(2) |
$ | 154,165 | $ | 131,440 | $ | 235,567 | $ | 175,756 | $ | 206,158 | |||||||
- (1)
- Does
not include the results of operations for our predecessor for the period from January 1, 2008 through March 13, 2008. For more
information about our predecessor's results of operations, please read "Selected Historical Consolidated and Unaudited Pro Forma Financial Data" beginning on page 46.
- (2)
- Adjusted EBITDA is a non-GAAP financial measure. For a definition of Adjusted EBITDA and a reconciliation of Adjusted EBITDA to our net income (loss) and net cash provided by operating activities, please read "Prospectus Summary—Summary Historical Consolidated and Unaudited Pro Forma Financial Data—Non-GAAP Financial Measure" beginning on page 13.
58
Nine Months Ended September 30, 2011 Compared to Nine Months Ended September 30, 2010
Oil and gas revenues. Oil and gas revenues increased $85.0 million, or 33%, to $340.5 million for the nine months ended September 30, 2011 as compared to the same period in 2010. Higher realized commodity prices in 2011 accounted for $74.5 million of this increase, and higher production volumes accounted for $10.5 million of the increase.
Oil production increased 0.4 MBbl per day, or 5%, to 9.4 MBbl per day for the nine months ended September 30, 2011 as compared to the same period in 2010. Production from acquisitions subsequent to September 30, 2010 increased production by 0.9 MBbl per day, partially offset by a net 0.5 MBbl per day decrease comprising: (i) a 0.3 MBbl per day increase due to the resumption of operations at fields affected by hurricanes; (ii) a 0.4 MBbl per day decrease due to gas pipeline problems, which limited a field's ability to produce oil, of which we expect the gas pipeline repairs to be completed before the end of the year; and (iii) normal production and other declines.
Natural gas production increased 1.5 MMcf per day, or 3%, to 53.0 MMcf per day for the nine months ended September 30, 2011 as compared to the same period in 2010. Production from acquisitions subsequent to September 30, 2010 increased production by 9.6 MMcf per day, while production from existing fields decreased 8.2 MMcf per day. The net decrease in production from existing fields consisted of: (i) a 5.4 MMcf per day decrease due to the gas pipeline problems discussed previously; (ii) a 4.1 MMcf per day increase due to the resumptions of operations at fields affected by hurricanes; (iii) a 2.4 MMcf per day decrease due to a field shut-in for the installation of compression facilities, which we have subsequently sold our interest in the property; and (iv) normal production and other declines.
Other operating revenues. Other operating revenues increased $4.2 million, or 53%, to $11.9 million for the nine months ended September 30, 2011 as compared to the same period in 2010. The increase primarily resulted from additional PHA fees due to increased third-party production processed on our Bullwinkle platform.
Lease operating expense. Lease operating expense increased $15.5 million, or 24%, to $79.0 million for the nine months ended September 30, 2011 as compared to the same period in 2010. Higher costs primarily for transportation, fuel and chemicals and repairs and maintenance increased lease operating expense by $6.5 million. Incremental production from our acquisitions resulted in a $9.0 million increase in lease operating expense. On a per unit basis, lease operating costs increased to $15.89 per Boe for the nine months ended September 30, 2011 versus $13.25 per Boe for the nine months ended September 30, 2010.
Exploration expense. Exploration expense increased by $5.5 million to $7.3 million for the nine months ended September 30, 2011 as compared to the same period in 2010, primarily driven by exploratory dry hole costs of $6.1 million for the nine months ended September 30, 2011.
Depreciation, Depletion and Amortization. DD&A increased $6.2 million, or 6%, to $102.4 million for the nine months ended September 30, 2011 as compared to the same period in 2010. The increase was attributable to our oil and gas depletion, primarily related to our acquisitions of Samson and XTO (which accounted for $11.7 million of the increase) and in connection with our Ship Shoal 166/167 field, which reached its economic limit after mechanical problems forced us to shut in production (with the associated reserve revision accounting for $10.0 million of the increase), partially offset by a $17.1 million decrease due to the gas pipeline problems previously discussed.
Workover expense. Workover expense increased $3.6 million to $16.0 million for the nine months ended September 30, 2011 as compared to $12.5 million for the same period in 2010, primarily as a result of increased workover activity levels.
59
Year Ended December 31, 2010 Compared to Year Ended December 31, 2009
Oil and gas revenues. Oil and gas sales revenues increased $166.8 million, or 93%, to $345.8 million for 2010 as compared to 2009. Average daily production increased by 6,748 Boe per day, or 63%, to 17,444 Boe per day, resulting in an increase in revenue of $105.1 million, primarily as a result of acquisitions. In addition, higher realized commodity prices in 2010 increased our oil and natural gas revenues by $61.7 million.
Other operating revenues. Other operating revenues increased $10.8 million to $12.8 million for 2010 as compared to 2009. The increase in other operating revenues is primarily attributable to PHA fees related to our operation of the Bullwinkle platform, which was acquired in January 2010.
Lease operating expense. Lease operating expense increased $28.8 million, or 47%, to $89.4 million for 2010 compared to 2009 due to incremental production from our acquisitions. On a per unit basis, lease operating costs decreased to $14.04 per Boe for 2010 versus $15.53 per Boe for 2009, primarily due to lower per unit costs on our Bandon acquisition in October 2009 and our 2010 acquisitions.
Exploration expense. Exploration expense decreased $6.9 million to $2.1 million for 2010 as compared to 2009. The higher exploration expense in 2009 was primarily due to $4.6 million of exploratory geological and geophysical data and services costs and $2.3 million of exploratory dry hole costs. We did not incur any dry hole costs in 2010.
Depreciation, depletion and amortization. DD&A increased $106.5 million, or 120%, to $195.1 million for 2010 as compared to 2009. The increase was attributable to our oil and gas depletion, primarily due to increased production, which accounted for $50.2 million of the increase and a higher per Boe DD&A rate, which accounted for $6.6 million of the increase. Impairments of $60.5 million for the year ended December 31, 2010 consisted primarily of: (i) $16.4 million at the West Cameron 598/599 field due to an election not to drill a proved undeveloped location when new seismic interpretation and lower gas prices yielded less reserves than previously mapped; (ii) $15.8 million at the Ship Shoal 166/167 field where a recompletion did not perform as expected, leading to reduced economics on other planned workovers in the field; (iii) $5.6 million at the Vermilion 261 field and $2.0 million at the East Cameron 320 field due to steeper production rate declines than previously forecast; and (iv) $11.9 million at the South Marsh Island 142 field and $3.8 million at the West Cameron 432 field due to downhole mechanical problems.
Workover expense. Workover expense increased $9.1 million to $15.8 million in 2010 as compared to $6.7 million in 2009, primarily as a result of increased workover activity levels following our acquisitions.
Accretion expense. Accretion expense increased $6.0 million, or 83%, to $13.2 million for 2010 as compared to $7.2 million in 2009, primarily due to acquisitions. In addition, revisions to estimates and timing of our AROs contributed to the increase.
Loss on sale of assets. In 2010, we sold our interest in a shut-in field for $11.9 million and recognized a loss of $8.4 million from the sale, which was partially offset by gains from the sale of other interests and equipment. In 2009, we had a gain on sale of assets of $0.1 million.
Interest expense. Interest expense increased $6.4 million, or 90%, to $13.5 million for 2010 as compared to 2009, primarily due to increased debt levels as a result of debt assumed in the Bandon acquisition and borrowings under our revolving credit facility to fund a portion of the Samson acquisition.
60
Bargain purchase gain. In 2010, we completed an acquisition related to a preferential purchase right where the seller had attributed a negative fair value to a property. As a result, we recognized a bargain purchase gain of $4.0 million on the acquisition. Our acquisition of Bandon in 2009 resulted in a bargain purchase gain of $161.4 million, due to our estimate of the net assets' fair value exceeding the fair value of the total consideration paid.
Year Ended December 31, 2009 Compared to the Year Ended December 31, 2008
Oil and gas revenues. Oil and gas sales revenues decreased $30.2 million, or 14%, to $179.0 million for 2009 as compared to 2008. Lower commodity prices in 2009, which resulted in a $150.5 million reduction in revenues, served as the primary driver for the decrease in revenues. This decrease was partially offset by an increase in average daily production of 3,926 Boe per day, or 58%, to 10,696 Boe per day in 2009, resulting in an increase in revenue of $120.3 million. The increase in average daily production sold was primarily due to acquisitions.
Lease operating expense. Lease operating expense increased $23.9 million, or 65%, to $60.6 million for 2009 as compared to 2008, due to incremental production from our acquisitions. On a per unit basis, lease operating costs increased to $15.53 per Boe for 2009 versus $14.82 per Boe for 2008.
Exploration expense. Exploration expense increased $8.9 million in 2009 as compared to 2008. The increase consists of $6.6 million in exploratory geological and geophysical data and services costs and $2.3 million of exploratory dry hole costs in 2009. We did not incur any dry hole costs in 2008, and our exploration operations during that period were minimal.
Depreciation, depletion and amortization. DD&A increased $38.9 million in 2009 as compared to 2008, primarily due to increased production from acquisitions. The increase was attributable to our oil and gas depletion, primarily due to increased production, which accounted for $24.3 million of the increase and a higher per Boe DD&A rate, which accounted for $10.4 million of the increase. Our per unit rate increase was primarily due to the full-year effect of the Northstar acquisition on our composite per unit rate. In addition, asset impairments of $3.8 million contributed to the increase.
General and administrative expense. General and administrative expense increased $7.8 million, or 44%, to $25.7 million for 2009 as compared to 2008, primarily due to costs related to a full year of operations in 2009 as compared to less than ten months for 2008. Increased payroll and legal costs also contributed to the increase.
Workover expense. Workover expense increased $5.6 million to $6.7 million in 2009 as compared to $1.1 million in 2008, primarily as a result of increased activity levels following our acquisitions.
Accretion expense. Accretion expense increased $2.7 million, or 60%, to $7.2 million in 2009 as compared to $4.5 million in 2008, primarily due to our acquisitions. In addition, revisions to the original estimates and timing of our AROs contributed to the increase.
Insurance expense. Insurance expense increased $18.4 million to $32.7 million from 2008 to 2009, primarily due to the significant damage to assets throughout the Gulf of Mexico caused by Hurricanes Ike and Gustav in 2008, which resulted in deterioration of commercial insurance market conditions. As a result, we experienced a 51% increase in insurance premiums from 2008 to 2009.
Casualty loss. During 2008, Hurricanes Ike and Gustav caused property damage and disruptions to our exploitation and production activities. Our insurance policies in effect on the occurrence dates of Hurricanes Ike and Gustav had a combined deductible of $10.0 million. In 2008, we satisfied our deductible requirement and recorded a casualty loss of $10.0 million. We did not have a casualty loss in 2009.
61
Loss on abandonments. In 2008, there was no loss on abandonments due to the turnkey platform abandonment contract with Superior which SPN entered into effective March 14, 2008. Under this agreement, Superior agreed to provide all well abandonment and platform decommissioning services for all properties owned and operated by SPN on that date at fixed prices upon abandonment of such properties. In 2009, we acquired properties that were not covered by the contract with Superior, and, as a result, we recognized a loss of $4.7 million on our AROs to reflect the difference between the recorded amount and the actual settlement cost.
Interest expense. Interest expense increased $4.6 million, or 186%, to $7.1 million for 2009 as compared to 2008, partially due to our assumption of debt in connection with the Bandon acquisition, and partially due to a higher weighted average outstanding debt balance of our revolving credit facility, which increased to $141.3 million for 2009 compared to $87.1 million for 2008.
Bargain purchase gain. We did not recognize any bargain purchase gain in 2008, but we recognized $161.4 million of bargain purchase gain in 2009 in connection with the Bandon acquisition.
Liquidity and Capital Resources
Historically, our primary sources of liquidity have been (i) capital contributions from our equity owners, (ii) borrowings under our revolving credit facility and (iii) cash flows from operations. Capital from these sources has been primarily used for the acquisition, exploration, development and retirement of our assets. Additionally, because of the substantial cash generated by our assets, we have paid down approximately $28.2 million of our indebtedness during the first nine months of 2011 and made distributions to our equity owners of $94 million from inception to September 30, 2011. In addition, as of the date of this prospectus, we have made total distributions to our equity owners of $137 million. At September 30, 2011, we had a working capital surplus of approximately $24.5 million. Our working capital fluctuates for various reasons, including the fair value of our commodity derivative instruments. We believe that the net proceeds from this offering, combined with our current cash, available borrowing base capacity and future cash flows from operations, will allow us to reduce existing indebtedness while funding capital expenditures through the remainder of 2011 and 2012 and to pursue additional acquisition opportunities.
Revolving Credit Facility
On June 20, 2011, we entered into a $750 million amended and restated secured credit agreement with a group of lenders led by The Royal Bank of Scotland plc. The four-year revolving credit facility, which expires on June 20, 2015, has a $430 million borrowing base, of which $385 million was outstanding as of September 30, 2011. In addition, up to $100 million of the borrowing base is available for the issuance of letters of credit.
Our borrowing base is redetermined on a semi-annual basis, effective April 1 and October 1. In addition to the scheduled semi-annual borrowing base redetermination, either we or the lenders have the right to request an additional borrowing base redetermination at any time, provided that no party has the right to request more than one such redetermination between the regularly scheduled borrowing base redeterminations. The determination of our borrowing base is subject to a number of factors, including the quantities of proved oil and natural gas reserves, the lenders' price assumptions and other various factors, some of which may be out of our control. The lenders can decrease the borrowing base if they determine that our oil and natural gas reserves, at the time of redetermination, are inadequate to support the borrowing base then in effect. In this case, we would be required to make six monthly payments each equal to one-sixth of the amount by which the aggregate outstanding loans and letters of credit exceed the borrowing base.
In connection with the XTO Acquisition and the MOR Transaction, the lenders under our credit facility approved two independent increases to our initial borrowing base of $105 million and
62
$25 million, respectively. Following the closing of the XTO Acquisition and the MOR Transaction, our borrowing base increased from $300 million to $430 million. On November 7, 2011, the lenders under our credit facility reaffirmed the borrowing base of $430 million. As of September 30, 2011, after giving effect to the application of the net proceeds of this offering, we would have had approximately $108.0 million outstanding under our revolving credit facility, with additional availability of approximately $322.0 million.
At our election, interest is generally determined by reference to:
- •
- The London interbank offered rate ("LIBOR") plus an applicable margin between 2.25% and 3.00% per annum (based upon
borrowing base usage); or
- •
- the alternate base rate plus an applicable margin between 1.25% and 2.00% per annum (based upon borrowing base usage). The alternate base rate is equal to the higher of the Royal Bank of Scotland's prime rate, the federal funds rate plus 0.5% per annum or the reference LIBOR plus 1%.
Our revolving credit facility is secured by mortgages on greater than 80% of the present value of our oil and natural gas properties. Our revolving credit facility also contains covenants that, among other things, require us to maintain specified ratios or conditions as follows:
- •
- a current ratio, consisting of consolidated current assets, including the unused amount of the total commitments, to
consolidated current liabilities of not less than 1.0 to 1.0, excluding non-cash derivative assets and liabilities, as of the last day of any fiscal quarter;
- •
- a total leverage ratio, consisting of total debt (as defined in the credit agreement) of not more than 3.5 to 1.0 for the
four quarters ended on the last day of each fiscal quarter; and
- •
- an interest coverage ratio, consisting of EBITDA (as defined in the credit agreement) to cash interest expense, of not less than 3.0 to 1.0 for the four quarters ended on the last day of each fiscal quarter.
In addition, our revolving credit facility also contains affirmative and negative covenants that are customary for credit facilities of this type. The covenants include delivery of financial statements and other financial information, notice of defaults and certain other matters, payment of obligations, compliance with laws, maintenance of books and records, certain inspection rights, execution of guarantees by material subsidiaries, further assurances, operation and maintenance of properties, limitations on liens, limitations on investments, limitations on hedging agreements, limitations on indebtedness, limitations on dispositions of properties, limitations on restricted payments, distributions and redemptions, limitations on changes in the nature of business, limitations on use of proceeds, limitations on transactions with affiliates, limitations on mergers and limitations on issuances of equity interests by guarantors. Our revolving credit facility allows for the issuance of up to $300 million in aggregate unsecured debt, provided that the borrowing base will be reduced by $0.25 for each dollar of unsecured debt that we issue.
Management believes that we were in compliance with the terms of our revolving credit facility as of September 30, 2011.
Capital Expenditures
Because our growth has occurred primarily through acquisitions, our historical capital expenditures for non-acquisition activities have been relatively modest. To the extent that we increase our efforts to grow our property base organically in the future, we expect that our capital expenditures will increase accordingly. Our total capital expenditure budget for 2011 drilling, completion and recompletion activities is approximately $100 million. Of this amount, approximately $71.5 million has been spent through September 30, 2011.
63
We expect that our 2012 budget for capital expenditures will be between $200 and $250 million, which is less than our projected cash flow for 2012. As part of our capital expenditure plan, we expect to drill between 12 and 16 wells during 2012, including between 3 and 6 wells included in the XTO Acquisition Properties.
In connection with our 2012 drilling program, we have contracted for one jackup drilling rig, with the option to extend into 2013, and one platform rig for use at the Bullwinkle field. In addition to this capital expenditure program, we expect to continue to pursue a proactive P&A program by removing inactive platforms, wellbores and pipelines in advance of legal requirements.
Other than our rig commitments and legal P&A requirements, our capital expenditure budget and P&A activities are subject to a substantial amount of discretion. As a result, we may reduce our expected spending, including if we experience sustained oil and natural gas prices significantly below current levels, failures to obtain necessary permits or partner approvals, operational problems that extend the time and cost required to complete projects, acquisition opportunities that may divert our attention or capital resources, weather delays or substantial increases in our costs. To the extent our cash flow from operations is not sufficient to meet our funding needs, we would consider funding our capital expenditures with borrowings under our credit facility or capital markets transactions.
Cash Flows
The following table summarizes our consolidated cash flows provided by or used in operating activities, investing activities and financing activities for the periods indicated (in thousands):
| |
Years Ended December 31, |
Nine Months Ended September 30, |
||||||||||||||
|---|---|---|---|---|---|---|---|---|---|---|---|---|---|---|---|---|
| |
2008 | 2009 | 2010 | 2010 | 2011 | |||||||||||
Net cash provided by operating activities |
$ | 173,704 | $ | 37,796 | $ | 157,656 | $ | 139,553 | $ | 156,602 | ||||||
Net cash provided by (used in) investing activities |
(431,423 | ) | 62,075 | (94,605 | ) | (113,576 | ) | (296,676 | ) | |||||||
Net cash provided by (used in) financing activities |
309,749 | (63,589 | ) | (76,346 | ) | 5,823 | 83,677 | |||||||||
Cash flows provided by operating activities. The changes in net cash provided by operating activities are attributable to our net income (loss) adjusted for non-cash charges, as presented in our historical consolidated financial statements and related notes thereto contained elsewhere in this prospectus, and changes in our operating assets and liabilities.
Net cash provided by operating activities increased $17.0 million for the nine months ended September 30, 2011 compared to the same period in 2010, primarily due to higher realized commodity prices and higher production related to acquisitions.
Net cash provided by operating activities increased $119.9 million in 2010 compared to 2009, primarily due to higher production related to the Bandon acquisition in 2009, which we owned for all of 2010 compared to less than three months in 2009, and the Samson and Bullwinkle acquisitions in 2010.
Net cash provided by operating activities decreased $135.9 million in 2009 compared to 2008, primarily due to lower commodity prices in 2009.
Cash flows provided by (used in) investing activities. The $183.1 million increase in cash used in investing activities from the nine months ended September 30, 2010 to the nine months ended September 30, 2011 was primarily a result of our acquisitions and derivative settlements. In the nine months ended September 30, 2011, our acquisitions resulted in our paying net cash of $219.6 million compared to 2010 when our acquisitions resulted in our paying net cash of $100.1 million. Net
64
derivative settlement losses were $5.6 million for the nine months ended September 30, 2011, compared to settlement gains of $36.9 million for the same period in 2010.
The $156.7 million increase in cash used in investing activities from 2009 to 2010 was primarily a result of changes in our cash expenditures and receipts related to our acquisitions. In 2010, we paid a total of $92.4 million for our acquisitions (net of $8.9 million cash acquired). In 2009, we received $41.7 million in connection with the Bandon acquisition. This amount was partially offset by $15.6 million paid in connection with our acquisitions in 2009, resulting in $26.1 million net received in connection with acquisitions in 2009.
The $493.5 million decrease in cash used in investing activities from 2008 to 2009 was primarily a result of changes in our cash expenditures and receipts related to our acquisitions. In 2009, we received $41.7 million in connection with the Bandon acquisition. This amount was partially offset by $15.6 million paid in connection with our acquisitions in 2009, resulting in $26.1 million net received in connection with acquisitions in 2009. In 2008, we paid a total of $376.7 million for our acquisitions (net of $32.5 million cash acquired).
Cash flows provided by financing activities. The $77.9 million increase in cash provided by financing activities from the nine months ended September 30, 2010 to the nine months ended September 30, 2011 was primarily a result of the $333.0 million increase in borrowings under our revolving credit facility, partially offset by the $120.0 million increase in repayments of borrowings outstanding under our revolving credit facility, the $58.2 million increase in repayments of the Bandon term loan, and the $68.0 million payment to MOR for our purchase of the remaining 25% working interest in the properties that we acquired from SPN Resources in 2008, which was accounted for as a transfer of assets under common control.
The $12.8 million increase in cash used in financing activities from 2009 to 2010 is primarily a result of the $32.2 million increase in distributions to our equity owners and the $34.8 million increase in repayments of borrowings outstanding under our revolving credit facility, partially offset by the $46.2 million decrease in repayments of the Bandon term loan.
The $373.3 million increase in cash used in financing activities from 2008 to 2009 is primarily a result of borrowings under our revolving credit facility in 2008, which provided $158.0 million of cash and the $229.0 million of contributions from our equity owners in 2008, compared with $22.3 million contributed in 2009. In 2009, we also increased our repayments of debt by $36.2 million.
Off-Balance Sheet Arrangements
We currently have no off-balance sheet arrangements. Please read "—Contractual Obligations" below and Note 16 to our consolidated financial statements included elsewhere in this prospectus for a discussion of our commitments and contingencies, some of which are not recognized in the consolidated balance sheets under GAAP.
65
Contractual Obligations
The following table presents a summary of our contractual cash obligations over the next several fiscal years, as of December 31, 2010:
| |
Payments Due by Period | |||||||||||||||
|---|---|---|---|---|---|---|---|---|---|---|---|---|---|---|---|---|
| |
Total | Less than 1 year |
1 to 3 years | 3 to 5 years | More than 5 years |
|||||||||||
| |
(In thousands) |
|||||||||||||||
Long-term debt obligation(1) |
$ | 203,205 | $ | — | $ | 145,000 | $ | 58,205 | $ | — | ||||||
Interest on debt obligation(1) |
24,532 | 9,032 | 11,577 | 3,923 | — | |||||||||||
Operating lease obligations(2) |
4,400 | 2,400 | 2,000 | — | — | |||||||||||
Asset retirement obligations(3) |
318,065 | 61,948 | 9,933 | 73,948 | 172,776 | |||||||||||
Total |
$ | 550,202 | $ | 73,380 | $ | 168,510 | $ | 136,076 | $ | 172,776 | ||||||
|
||||||||||||||||
- (1)
- On
June 20, 2011, we entered into an amended and restated revolving credit facility, which matures on June 20, 2015. Please read
"—Liquidity and Capital Resources—Revolving Credit Facility" beginning on page 62. As of September 30, 2011, our outstanding balance was $385 million. At
the current interest rate of 3.1% and commitment fee rate of 0.5%, our interest expense on the outstanding balance as of September 30, 2011 would be $3.1 million for the remainder
of 2011, $12.2 million for each of the years ending December 31, 2012, 2013 and 2014 and $5.7 million for the year ending December 31, 2015.
- (2)
- Please
read Note 16 to our consolidated financial statements included elsewhere in this prospectus for a description of our operating lease
obligations.
- (3)
- Represents our estimate of future asset retirement obligations on an undiscounted basis. Because these costs typically extend many years into the future, estimating these future costs requires management to make estimates and judgments that are subject to future revisions based on numerous factors, including the rate of inflation, changing technology and the political and regulatory environment. Please read Note 7 to our consolidated financial statements included elsewhere in this prospectus.
Quantitative and Qualitative Disclosures About Market Risk
We are exposed to market risk, including the effects of adverse changes in commodity prices and interest rates as described below.
The primary objective of the following information is to provide forward-looking quantitative and qualitative information about our potential exposure to market risks. The term "market risk" refers to the risk of loss arising from adverse changes in oil and natural gas prices and interest rates. The disclosures are not meant to be precise indicators of expected future losses, but rather indicators of reasonably possible losses. All of our market risk sensitive instruments were entered into for purposes other than speculative trading.
Commodity Price Risk
Our major market risk exposure is in the pricing that we receive for our oil and natural gas production. Realized pricing is primarily driven by the spot market prices applicable to our oil and natural gas production. Pricing for oil and natural gas has been volatile for several years, and we expect this volatility to continue in the future. The prices we receive for our oil and natural gas production depend on many factors outside of our control, such as the strength of the global economy.
We intend to continue to manage our exposure to commodity price risk in the near term while remaining opportunistic over the long term. We use a variety of hedging instruments to accomplish our
66
risk management objectives and enhance the stability of our cash flows. Our commodity derivative contracts are currently in the form of basic swaps and collars that are designed to provide a fixed price (swaps) or defined range of prices (collars) that we will receive. We actively monitor our hedge portfolio to support our cash flow objectives.
We had commodity derivative contracts with the following terms outstanding as of September 30, 2011, none of which have been designated as cash-flow hedges:
| |
Year Ending December 31, | ||||||||||||
|---|---|---|---|---|---|---|---|---|---|---|---|---|---|
| |
2011 | 2012 | 2013 | ||||||||||
Crude oil: |
|||||||||||||
Swaps (Bbl) |
362,000 | 1,662,000 | 1,250,000 | ||||||||||
Average WTI price ($/Bbl) |
88.48 | 91.86 | 100.47 | ||||||||||
Collars (Bbl) |
90,000 |
418,000 |
168,000 |
||||||||||
Average WTI price ($/Bbl) |
|||||||||||||
Floor price (put) |
65.00 | 82.99 | 80.00 | ||||||||||
Ceiling price (call) |
87.90 | 108.51 | 102.50 | ||||||||||
LLS-WTI Differential Spread (Bbl) |
615,000 |
2,300,000 |
— |
||||||||||
Average price ($/Bbl) |
20.03 | 17.17 | — | ||||||||||
Natural gas: |
|||||||||||||
Swaps (MMBtu) |
880,000 | 3,630,000 | — | ||||||||||
Average NYMEX price ($/MMBtu) |
5.92 | 6.16 | — | ||||||||||
Collars (MMBtu) |
1,139,000 |
8,115,000 |
6,000,000 |
||||||||||
Average NYMEX price ($/MMBtu) |
|||||||||||||
Floor price (put) |
5.26 | 4.08 | 3.75 | ||||||||||
Ceiling price (call) |
7.83 | 6.62 | 6.65 | ||||||||||
Interest Rate Risk
As of September 30, 2011, we had total debt outstanding of $385 million, accruing interest at a variable rate, which was 3.1% (a variable rate of 0.35% plus an applicable margin of 2.75%) as of that date. Assuming no change in the amount outstanding, the impact on interest expense of a 10% increase or decrease in the average variable interest rate would be approximately $0.1 million.
Counterparty and Purchaser Credit Risk
Joint interest receivables arise from entities which own partial interests in the wells we operate. These entities participate in our wells primarily based on their ownership in leases on which we operate. We have limited ability to control participation in our wells. We are also subject to credit risk due to the concentration of our oil and natural gas receivables with several significant purchasers. The inability or failure of our significant purchasers to meet their obligations to us or their insolvency or liquidation may adversely affect our financial results. In addition, our commodity derivative contracts expose us to credit risk in the event of nonperformance by counterparties.
While we generally do not require our purchasers to post collateral and do not have a formal process in place to evaluate and assess the credit standing of our significant purchasers or the counterparties on our commodity derivative contracts, we do evaluate the credit standing of our purchasers and such counterparties as we deem appropriate under the circumstances. This evaluation may include reviewing a counterparty's credit rating and latest financial information or, in the case of purchasers with which we have receivables, reviewing their historical payment record, the financial ability of the purchaser's parent company to make payment if the purchaser cannot and undertaking
67
the due diligence necessary to determine credit terms and credit limits. The counterparties on our commodity derivative contracts currently in place are lenders under our credit facilities, with investment grade ratings and we are likely to enter into any future commodity derivative contracts with these or other lenders under our new credit facility that also carry investment grade ratings. Several of our significant purchasers have a credit rating below investment grade or do not have rated debt securities. In these circumstances, we have considered the lack of investment grade credit rating in addition to the other factors described above.
Critical Accounting Policies and Estimates
The policies discussed below are considered by management to be critical to an understanding of our financial statements because their application requires the most significant judgments from management in estimating matters for financial reporting that are inherently uncertain. See the description of our accounting policies in the notes to the financial statements for additional information about our critical accounting policies and estimates.
Revenue Recognition
We record revenues from the sales of crude oil, natural gas and natural gas liquids when product is delivered at a fixed or determinable price, title has transferred and collectability is reasonably assured.
When we have an interest with other producers in properties from which natural gas is produced, we use the entitlement method to account for any imbalances. Imbalances occur when we sell more or less product than we are entitled to under our ownership percentage. Revenue is recognized only on the entitlement percentage of volumes sold. Any amount that we sell in excess of our entitlement is treated as a liability and is not recognized as revenue. Any amount of entitlement in excess of the amount we sell is recognized as revenue and a receivable is accrued.
Use of Estimates
The preparation of financial statements in conformity with GAAP requires management to make estimates and assumptions that affect the reported amounts of assets and liabilities and disclosures of contingent assets and liabilities at the date of the financial statements and the reported amounts of revenues and expenses during the period. Estimates and judgments are based on information available at the time such estimates and judgments are made. Adjustments made with respect to the use of these estimates and judgments often relate to information not previously available.
Uncertainties with respect to such estimates and judgments are inherent in the preparation of financial statements. Estimates and judgments are used in, among other things, (1) estimating unbilled revenues and operating and general and administrative costs, (2) developing fair value assumptions, including estimates of future cash flows and discount rates, (3) analyzing tangible and intangible assets for possible impairment, (4) estimating the useful lives of assets and (5) determining amounts to accrue for contingencies, guarantees and indemnifications. Actual results could differ materially from estimated amounts.
Property and Equipment
We use the successful efforts method to account for our oil and gas exploration and production activities. All costs for development wells, related plant and equipment, proved mineral interests in oil and gas properties, and related ARO costs are capitalized. Costs of exploratory wells are capitalized pending determination of whether the wells find proved reserves. Costs of wells that are assigned proved reserves remain capitalized. Costs also are capitalized for exploratory wells that have found oil and gas reserves even if the reserves cannot be classified as proved when the drilling is completed, provided the exploratory well has found a sufficient quantity of reserves to justify its completion as a
68
producing well and we are making sufficient progress toward assessing the reserves and the economic and operating viability of the project. Unproved leasehold costs are capitalized and amortized on a composite basis if we judge them to be individually insignificant based on past success, experience, and average lease-term lives. Individually significant leases are reclassified to proved properties if successful and expensed on a lease-by-lease basis if unsuccessful or if the lease term has expired. All other exploratory wells and costs are expensed. Oil and gas property costs associated with unproved oil and gas reserves arising from business combinations are assessed for transfer to proved properties based on the change in estimated field-by-field unproved reserve volumes from the acquisition closing date, beginning with the second fiscal year-end subsequent to the acquisition closing date.
Capitalized costs of producing oil and gas properties, along with support equipment and facilities, are amortized to expense by the unit-of-production method based on proved oil and gas reserves on a field-by-field basis. Upon sale or retirement, the cost and related accumulated depreciation, depletion and amortization are eliminated from the accounts and the resulting gain or loss is recognized.
Long-lived assets to be held and used, including proved and unproved oil and gas properties, are assessed for possible impairment by comparing their carrying values with their associated undiscounted, risk-weighted estimated future net cash flows. Events that can trigger assessments for possible impairments include write-downs of proved and unproved reserves based on field performance, significant decreases in the market value of an asset, significant changes in the extent or manner of use or a physical change in an asset, significant changes in the relationship between an asset's capitalized cost and the associated oil and gas reserves, and a more-likely-than-not expectation that a long-lived asset will be sold or otherwise disposed of significantly sooner than the end of its previously estimated useful life. Impaired assets are written down to their estimated fair values, generally their estimated discounted future net cash flows as adjusted by additional risk-weighting factors. For proved and unproved oil and gas properties, we perform the impairment review on an individual field basis. Impairment amounts are recorded as incremental depreciation, depletion and amortization expense. We recorded property impairment charges in 2010, 2009 and 2008 as described in Note 6 to our consolidated financial statements included elsewhere in this prospectus. It is reasonably possible that other proved and unproved oil and gas properties could become impaired in the future if commodity prices decline.
In determining the fair values of proved and unproved properties acquired in business combinations, we prepare estimates of oil and gas reserves. We estimate future prices to apply to the estimated reserve quantities acquired, and estimate future operating and development costs, to arrive at estimates of future net cash flows. For the fair value assigned to proved, probable and possible reserves, the estimated future net cash flows are discounted using a market-based weighted average cost of capital rate deemed appropriate at the time of the business combination. To compensate for the inherent risk of estimating and valuing reserves, the discounted future net cash flows of proved, probable and possible reserves are reduced by additional risk-weighting factors.
Other property and equipment, consisting primarily of office furniture, equipment, leasehold improvements, computers and computer software, is stated at cost. Depreciation on other property and equipment is calculated on the straight-line method over the estimated useful lives of the assets, which range from three to seven years.
Commodity Derivative Contracts
We record all commodity derivative contracts on the consolidated balance sheets as either assets or liabilities, measured at their estimated fair value. We have not designated any commodity derivative contracts as cash-flow hedges for accounting purposes. Changes in the fair value of our commodity derivative contracts are recorded in earnings as they occur and are included in other income (expense) in our consolidated statements of operations.
69
Overview
We are an independent exploration and production company focused on the acquisition and development of producing oil and natural gas properties in the Gulf of Mexico. Since we commenced operations in 2008, we have pursued an active growth strategy as an acquirer of producing assets that provide attractive development opportunities. We seek to maximize the value of our reserves through focused operations and exploitation to generate attractive cash returns. Our management team has an average of more than 28 years of energy industry experience, primarily in the Gulf of Mexico, and is experienced in the unique aspects of evaluating, acquiring and developing offshore properties.
As of July 31, 2011, our estimated net proved reserves were 60.1 MMBoe, of which 50% was oil and 81% was proved developed, with an associated PV-10 of approximately $1.7 billion, based on SEC pricing of $88.44 per Bbl for oil and $4.19 per MMBtu for natural gas. As of that same date, our estimated net probable reserves were 16.0 MMBoe with an associated PV-10 of approximately $370.1 million. Please read "Prospectus Summary—Summary Historical Operating and Reserve Data—Summary Reserve Data" beginning on page 15 for information on our estimated net proved and probable reserves, PV-10 and related pricing. During November 2011, our properties had aggregate average net daily production in excess of 27,000 Boe per day.
As of September 30, 2011, we had interests in approximately 270 net productive wells and over 250 offshore oil and gas leases in federal and state waters of the Gulf of Mexico, representing approximately 830,000 gross (490,000 net) acres. Importantly, we operate more than 90% of our assets based on the PV-10 of our proved oil and natural gas reserves as of July 31, 2011, allowing us to maintain better control over our asset portfolio. Our properties are predominantly located in water depths of less than 300 feet. In addition, we own a 49% interest in and operate the deepwater Bullwinkle field and associated platform, located in approximately 1,350 feet of water. Similar to our shallow water properties, the Bullwinkle field produces from a fixed-leg platform utilizing surface wellheads and blowout preventers and, consequently, is not subject to recent regulations instituted for deepwater drilling.
Our Acquisition History
A significant portion of our growth has been achieved through a series of acquisitions. Since we began operations in 2008, we have completed ten material acquisitions, creating significant value relative to the capital employed. Since inception, our principal equity owners have invested approximately $225 million and have received approximately $123 million in aggregate distributions from cash flows, for a net investment of $102 million. Over this same period, we have incurred a total of $555 million in debt, with $365 million of debt outstanding and $59 million of cash and cash equivalents as of December 31, 2011. As a result of these acquisitions and our operations, PV-10 of our proved oil and natural gas reserves totaled approximately $1.7 billion as of July 31, 2011.
We believe that the Gulf of Mexico continues to represent an attractive buyer's market, given the limited number of competitors and the availability of acquisition opportunities, as other oil and natural gas companies divest their Gulf of Mexico properties. For example, on August 31, 2011, we acquired substantially all of the Gulf of Mexico assets that Exxon acquired as part of its acquisition of XTO Energy Inc. in 2010. Please read "—XTO Acquisition" beginning on page 72. We will continue to be opportunistic in evaluating potential acquisition targets, which we expect will include both shallow water properties and properties in deeper waters with characteristics similar to the Bullwinkle field.
70
The following table presents key metrics related to each of our acquisitions.
| |
|
|
As of Acquisition Date(1) | |||||||||||
|---|---|---|---|---|---|---|---|---|---|---|---|---|---|---|
Acquisition
|
Acquisition Date |
Major Fields | Net Proved Reserves (MMBoe) |
% Oil | % Proved Developed |
|||||||||
SPN Resources(2) |
March 2008 | South Pass 60, West Delta 79/80 | 10.2 | 57 | % | 90 | % | |||||||
Northstar |
July 2008 | Eugene Island 307, Eugene Island 32 | 8.7 | 47 | % | 75 | % | |||||||
Bayou Bend Petroleum |
May 2009 | Marsh Island | 0.6 | 13 | % | 73 | % | |||||||
Beryl Oil and Gas(2) |
October 2009 | Vermilion 362-371 | 14.3 | 25 | % | 85 | % | |||||||
Shell |
January 2010 | Bullwinkle | 6.2 | 89 | % | 68 | % | |||||||
Samson Resources |
July 2010 | Vermilion 272, High Island 52 | 4.9 | 48 | % | 92 | % | |||||||
Providence Resources |
March 2011 | Ship Shoal 252/253, Main Pass 19 | 1.4 | 22 | % | 82 | % | |||||||
Gryphon Exploration |
May 2011 | High Island 52, Ship Shoal 301 | 2.1 | 12 | % | 100 | % | |||||||
XTO |
August 2011 | South Marsh Island 41, West Cameron 485/507 | 13.5 | 39 | % | 72 | % | |||||||
MOR |
September 2011 | South Pass 60, West Delta 79/80 | (3) | 3.4 | 65 | % | 92 | % | ||||||
- (1)
- Based
on reserve reports or our internally generated reserve estimates prepared at or near the aquisition date.
- (2)
- Includes
interests subsequently acquired from Superior in exchange for a 10% equity interest in us.
- (3)
- We acquired the remaining 25% working interest in the properties that we acquired from SPN Resources in 2008.
Since our inception, we have acquired 65.5 MMBoe of net proved reserves through ten material acquisitions (including the XTO Acquisition and the MOR Transaction) and as of July 31, 2011, have produced 14.7 MMBoe. At July 31, 2011, our estimated net proved reserves were 60.1 MMBoe (including the additional reserves that we acquired in the XTO Acquisition and the MOR Transaction).
The primary highlights of these acquisitions include:
- •
- In March 2008, we acquired a 66.7% membership interest in SPN Resources LLC ("SPN") from Superior for
$110 million, representing the inaugural step in our acquisition strategy. The acquisition included proved reserves of approximately 6.8 MMBoe, 57% of which were oil and 90% of which
were developed. We assumed all of SPN's employees, providing us with a fully functioning operation with a highly competent technical staff. In the first quarter of 2011, Superior exchanged, in part,
its ownership interests in SPN for a 10% equity interest in us. As a result, we now own 100% of the membership interests in SPN.
- •
- In July 2008, we acquired Northstar Exploration & Production, Inc. for approximately $235 million. Proved
reserves associated with the acquired properties are composed of approximately 8.7 MMBoe, 47% of which were oil and 75% of which were developed. The acquisition significantly increased the
scale of our operations and provided us with geographic diversification across the Gulf of Mexico shelf.
- •
- In May 2009, we acquired all of Bayou Bend Petroleum Ltd.'s U.S. oil and natural gas properties for $12.5 million.
The acquisition added proved reserves of approximately 0.6 MMBoe, 13% of which were oil and 73% of which were developed. Importantly, the acquisition provided us with a new growth area in the
Louisiana state waters and included a significant portfolio of exploratory drilling prospects centered on the Marsh Island area.
- •
- In October 2009, together with Superior, we acquired a combined 85% interest in Beryl Oil and Gas LP (which was subsequently renamed Bandon Oil and Gas LP ("Bandon")) for approximately $30 million in cash and the assumption of $125 million of second lien indebtedness. The acquired assets included 14.3 MMBoe of proved reserves, 25% of which were
71
- •
- In January 2010, together with Superior, we acquired the Bullwinkle field and the associated platform from Shell for
nominal cash consideration. We own a 49% working interest in the field and serve as operator. The Bullwinkle field added 6.2 MMBoe of proved reserves, 89% of which were oil and 68% of which
were developed. In connection with the acquisition, we assumed $49 million of fixed cost abandonment liability associated with the Bullwinkle wellbores. Importantly, we have not retained any
liability associated with the abandonment of the Bullwinkle platform.
- •
- In July 2010, we acquired the shallow water Gulf of Mexico assets of Samson Resources for approximately
$100 million. Proved reserves associated with the acquired properties are composed of approximately 4.9 MMBoe, 48% of which were oil and 92% of which were developed. The acquisition
further strengthened our Gulf of Mexico shelf presence and provided us with another major operated field.
- •
- In March 2011, we acquired the Gulf of Mexico shelf assets of Providence Resources for $15 million. The acquisition
included proved reserves of approximately 1.4 MMBoe, 22% of which were oil and 82% of which were developed. We previously operated three of the seven acquired fields, comprising more than 70%
of the acquired reserves.
- •
- In May 2011, we acquired the Gulf of Mexico assets of Gryphon Exploration Company, a wholly owned subsidiary of Woodside
Petroleum Ltd., for $27.5 million. Proved reserves associated with the acquired properties are composed of approximately 2.1 MMBoe, 12% of which were oil and 100% of which were
developed. The acquisition consolidated our existing interest in a significant property and added several higher value operated fields.
- •
- In August 2011, we acquired the Gulf of Mexico assets previously owned by XTO Energy, Inc., for approximately
$182.5 million. Proved reserves associated with the acquired properties are composed of approximately 13.5 MMBoe, 39% of which were oil. Please read "—XTO Acquisition" below.
- •
- In September 2011, we acquired the remaining 25% interest in the SPN Resources properties from Moreno Offshore Resources for $68 million. Proved reserves associated with the acquired properties are composed of approximately 3.4 MMBoe, 65% of which were oil and 92% of which were developed. The consolidated interests were substantially all comprised of operated properties, including several major fields. Please read "MOR Transaction" beginning on page 73.
oil and 85% of which were developed. In the first quarter of 2011, Superior exchanged, in part, its ownership interests in Bandon for a 10% equity interest in us. In addition, we acquired the remaining 15% equity interest in Bandon in a series of transactions between November 2009 and June 2011. As a result, we now own 100% of Bandon and have retired all of the associated second lien indebtedness.
XTO Acquisition
On August 31, 2011, we acquired from XTO Offshore Inc., HHE Energy Company and XH, LLC, each an indirect subsidiary of Exxon, certain oil and natural gas interests in the Gulf of Mexico for approximately $182.5 million (the "XTO Acquisition"). The properties acquired comprise substantially all of the Gulf of Mexico assets acquired by Exxon as part of its acquisition of XTO Energy, Inc. in 2010 (the "XTO Acquisition Properties"). As of July 31, 2011, based on a reserve report prepared by NSAI and our internally prepared reserve estimates, these properties contained 13,535 MBoe of proved reserves, of which 39% was oil, and 7,025 MBoe of probable reserves. As of that same date, the PV-10 of the proved oil and natural gas reserves was approximately $329 million, and the PV-10 of the probable oil and natural gas reserves was approximately $87 million, in each case based on SEC pricing of $88.44 per Bbl for oil and $4.19 per MMBtu for natural gas.
72
The XTO Acquisition Properties include approximately 250,000 gross (130,000 net) acres and 135 gross (62 net) producing wells. At the time of acquisition, net production from the XTO Acquisition Properties during August 2011 was greater than 7,500 Boe/d. Additionally, our geological and geophysical professionals have identified an inventory of over 30 potential drilling locations within the XTO Acquisition Properties. We operate over 90% of the XTO Acquisition Properties.
Please read "—Our Operations" beginning on page 79.
MOR Transaction
On September 14, 2011, we acquired directly from a subsidiary of Moreno Offshore Resources, LLC ("MOR") for $68.0 million the remaining 25% working interest in the properties that we acquired from SPN Resources in 2008 (the "MOR Transaction"). MOR had originally acquired this interest from SPN Resources at the same time as our initial acquisition. As of July 31, 2011, MOR's 25% working interest represented approximately 3.4 MMBoe of proved reserves, of which approximately 65% was oil, and 0.3 MMBoe of probable reserves. As of that same date, the PV-10 of the proved oil and natural gas reserves was approximately $104.2 million, and the PV-10 of the probable oil and natural gas reserves associated with MOR's working interest was approximately $10.7 million, in each case based on SEC pricing of $88.44 per Bbl for oil and $4.19 per MMBtu for natural gas. At the time of acquisition, net production attributable to MOR's 25% working interest during August 2011 was approximately 1,300 Boe/d. We currently operate substantially all of the properties we acquired in the MOR Transaction.
Our Operating Assets
All of our oil and natural gas properties are located in the federal and state waters in the Gulf of Mexico and consist of approximately 270 net productive wells. As of July 31, 2011, our total estimated net proved reserves were approximately 60.1 MMBoe, of which 50% was oil and 81% was proved developed. We operate more than 90% of our assets, based on PV-10 as of July 31, 2011. All of our assets are shallow-water assets, except for the Bullwinkle field, which is a deepwater asset. Importantly, however, all of our production in the Bullwinkle field is from a fixed-leg platform with surface blow-out preventers, making it not subject to the drilling moratorium instituted for deepwater drilling following the Macondo well incident in April 2010. Please read "Risk Factors—Risks Related to the Oil and Natural Gas Industry and Our Business—The Macondo well explosion and ensuing oil spill could have broad adverse consequences affecting our operations in the Gulf of Mexico, some of which may be unforeseeable" beginning on page 23.
When we find commercially exploitable oil or natural gas, a significant advantage to our development strategy is that the infrastructure to support the production and delivery of product is in most cases already in place and available. We believe this presents us with a material competitive advantage in bringing our discoveries on line and lowering related development costs.
Currently, all of our operations are located in the Gulf of Mexico and we have no foreign subsidiaries. However, in the future, we may apply the experience and operational expertise we have developed in the Gulf of Mexico to other locations. For example, we have recently begun preliminarily exploring options to pursue acquisition opportunities in the North Sea, which we believe represents an attractive market for acquisitions, similar to the Gulf of Mexico. As with our acquisition strategy in the Gulf of Mexico, in any such acquisition we would expect to selectively acquire companies and producing properties based on disciplined valuations of proved reserves.
73
Our Significant Fields
In the aggregate, our six largest fields accounted for approximately 66% of the PV-10 of our proved oil and natural gas reserves as of July 31, 2011. Our largest fields include the following:
Bullwinkle field: We own a 49% working interest and serve as operator in the Bullwinkle field. The Bullwinkle field is located 158 miles south-southwest of New Orleans in approximately 1,350 feet of water and encompasses all of Green Canyon blocks 65, 108 and 109. Although the Bullwinkle field is a deepwater asset, it produces from a fixed-leg platform with surface wellheads and blowout preventers. As a result, our operations in the Bullwinkle field share many key characteristics with our shallow water operations. Cumulative production from our Bullwinkle field from first production in 1989 through April 2011 totaled approximately 113 MMBbls of oil and 175 Bcf of natural gas. Our seven wells in the Bullwinkle field produced net to our interest at an average rate of 1,745 Boe/d for the month ended November 30, 2011.
We primarily target the J sands in the Bullwinkle field, which are at depths of 10,900 feet to 13,000 feet. The reservoirs primarily exhibit water drive and strati-structural traps. We own an aggregate of 17,280 gross (8,467 net) acres in the Bullwinkle field. In 2011, we engaged in an active multi-well workover and recompletion program which we intend to complete in 2012. We have identified multiple drilling opportunities in the field and intend to drill five wells in 2012, with additional drilling possible in future years.
The Bullwinkle platform is the deepest fixed-leg platform in the world and serves as a major production processing hub of third party deepwater fields for which we currently receive significant production handling revenues. The platform has processing capacity of approximately 160,000 Bbl of oil per day, 320 MMcf of natural gas per day and 65,000 Bbl of water per day. Currently, we handle production from six fields via sub-sea tie backs to the platform and have significant excess capacity to handle additional production. Since the platform commenced operation, it has processed a total of over 450 million barrels of oil equivalent.
South Marsh Island 41 field: We own a 100% working interest and serve as operator in the South Marsh Island 41 field. The South Marsh Island 41 field is located in approximately 100 feet of water and encompasses all of South Marsh Island blocks 40, 41, 44 and 45. Cumulative production from our South Marsh Island 41 field from first production in 1967 through April 2011 totaled approximately 14 MMBbls of oil and 87 Bcf of natural gas. Our 10 wells in the South Marsh Island 41 field produced net to our interest at an average rate of 1,835 Boe/d for the month ended November 30, 2011.
In the South Marsh Island 41 field, we primarily target the PA1 and PA2 sands, which are at depths of 9,500 feet to 10,300 feet. The reservoirs primarily exhibit a strong water drive and a faulted salt dome. We own an aggregate of 17,500 gross (12,500 net) acres in the field. We have identified significant recompletion and drilling opportunities in the field.
South Pass 60 field: We own a 100% working interest and serve as operator in the South Pass 60 field. The South Pass 60 field, located 97 miles southeast of New Orleans, includes 64 wells producing to eight platforms in approximately 250 feet of water and encompasses all or portions of South Pass blocks 6, 17, 59, 60, 61, 66 and 67. Cumulative production from our South Pass 60 field from first production in 1972 through April 2011 totaled approximately 229 MMBbls of oil and 498 Bcf of natural gas. Our 64 wells in the South Pass 60 field produced net to our interest at an average rate of 2,208 Boe/d for the month ended November 30, 2011.
74
We primarily target the I and K sands in the South Pass 60 field. The reservoirs primarily exhibit a solution gas drive with weak aquifer support and fault traps. We own an aggregate of 23,427 gross and net acres in the field. During 2011, we conducted nine recompletions and four tubing replacements. In addition, we believe that the field exhibits waterflood potential, which could potentially increase our production efficiency in the future. Recent studies have identified proved undeveloped and re-drill locations. In 2012, we plan to initiate two waterfloods and conduct a two well recompletion program.
West Delta 79/80 field: We own a 100% working interest and serve as operator in the West Delta 79/80 field. The West Delta 79/80 field is located 80 miles south southeast of New Orleans, includes 17 wells producing to five platforms in approximately 150 feet of water and encompasses all or portions of West Delta blocks 57, 79 and 80. Cumulative production from our West Delta 79/80 field from first production in 1970 through April 2011 totaled approximately 162 MMBbls of oil and 616 Bcf of natural gas. Our 17 wells in the West Delta 79/80 field produced net to our interest at an average rate of 1,395 Boe/d for the month ended November 30, 2011.
In the West Delta 79/80 field, we primarily target the G sands. The reservoirs primarily exhibit moderate to strong water drive and fault and anticline traps. We own an aggregate of 9,375 gross and net acres in the field. During 2011, we conducted recompletion operations on two wells. We believe that the field will support multiple wells. In 2012, we plan to conduct a seven well recompletion program.
Vermilion 362-371 field: We own an approximately 67% working interest and serve as operator in the Vermilion 362-371 field. The field, located 210 miles southwest of New Orleans, includes six wells producing to two platforms in approximately 300 feet of water and encompasses all of Vermilion blocks 362, 363 and 371. Cumulative production from our Vermilion 362-371 field from first production in 1994 through April 2011 totaled approximately 6 MMBbls of oil and 65 Bcf of natural gas. Our six wells in the Vermilion 362-371 field produced net to our interest at an average rate of 1,685 Boe/d for the month ended November 30, 2011.
We primarily target the Lentic sands in the Vermilion 362-371 field. We own an aggregate of 11,250 gross (7,500 net) acres in the field. The reservoirs primarily exhibit a depletion and partial water drive. During 2011, we conducted recompletion operations on three wells and conducted three acid jobs. In 2012, we plan to conduct two recompletions in this field.
Vermilion 272 field: We own a 100% working interest and serve as operator in the Vermilion 272 field. The Vermilion 272 field, located 180 miles southwest of New Orleans, includes 12 wells producing to four platforms in approximately 175 feet of water and encompasses all of Vermilion block 272 and all of South Marsh Island blocks 87 and 102. Cumulative production from our Vermilion 272 field from first production in 2003 through April 2011 totaled approximately 6 MMBbls of oil and 14 Bcf of natural gas. Our 12 wells in the Vermilion 272 field produced net to our interest at an average rate of 830 Boe/d for the month ended November 30, 2011.
We primarily target the Q and T sands in the Vermilion 272 field. The reservoirs primarily exhibit moderate aquifer support with salt piercement fault traps. We own an aggregate of 10,571 gross and net acres in the Vermilion 272 field. In 2011, we performed several facility upgrades in the field, which resulted in improved production. In 2012, we plan to conduct a four well recompletion program.
75
The following table presents summary data regarding our largest fields as of the date and for the period indicated:
| |
|
|
As of July 31, 2011 |
|
||||||||||
|---|---|---|---|---|---|---|---|---|---|---|---|---|---|---|
Field
|
Acquired From | Operator | Average Working Interest |
% Oil of Proved Reserves |
November 2011 Average Net Daily Production (Boe/d) |
|||||||||
Bullwinkle |
Shell | Dynamic | 49 | % | 84 | % | 1,745 | |||||||
South Marsh Island 41 |
XTO | Dynamic | 100 | % | 90 | % | 1,835 | |||||||
South Pass 60 |
SPN | Dynamic | 100 | % | 84 | % | 2,208 | |||||||
West Delta 79/80 |
SPN | Dynamic | 100 | % | 65 | % | 1,395 | |||||||
Vermilion 362-371 |
Beryl | Dynamic | 67 | % | 35 | % | 1,685 | |||||||
Vermilion 272 |
Samson | Dynamic | 100 | % | 85 | % | 830 | |||||||
Our Business Strategies
Our goal is to increase stockholder value by growing reserves, production and cash flows at an attractive return on invested capital. We seek to achieve this goal through the following strategies:
- •
- Continue to pursue strategic acquisitions. We intend to
continue to selectively acquire companies and producing properties based on disciplined valuations of proved reserves. Our acquisition strategy is focused on identifying motivated sellers of operated
properties with underworked assets where the total asset retirement obligation is proportionate to the proved reserve value of the assets. We believe these types of assets are candidates for
lower-risk production enhancement activities. By applying a disciplined valuation methodology, we reduce the risk of underperformance on the acquired properties while maintaining the
potential for higher returns on our investment. We believe that opportunities to consolidate interests in our existing properties will continue to be available and that these consolidation
transactions can generate attractive returns without the risks associated with acquiring and operating new assets. For example, we recently acquired from Moreno Offshore Resources, LLC the remaining
interests in the properties we previously acquired from SPN Resources in 2008. Please read "—Business—MOR Transaction" beginning on page 73. We also believe that
maintaining a strong financial profile through our disciplined financial policy helps position us as a preferred buyer by mitigating sellers' concerns regarding our ability to close transactions and
fund future abandonment obligations.
- •
- Enhance returns by focusing on operations and cost
efficiencies. We believe that our focus on lower risk production enhancement activities, such as workovers and recompletions on
producing and shut-in wellbores, is one of the most cost-effective ways to maintain and grow production. We are engaged in a continual effort to monitor and reduce operating
expenses by finding opportunities to safely increase operational efficiencies related to staffing, transportation and operational procedures. Moreover, our ability to accurately estimate and manage
P&A costs associated with potential acquisitions increases the likelihood of achieving our target returns on investment.
- •
- Focus primarily on the shallow waters of the Gulf of
Mexico. Our experience in the Gulf of Mexico has led us to focus our efforts in that particular region, where we are familiar with the
regulatory, geological and operational characteristics of this environment. This geographic focus enables us to minimize logistical costs and required staff.
- •
- Maintain a disciplined financial policy. We intend to continue to pursue a disciplined financial policy by maintaining a prudent capital structure and managing our exposure to interest rate and commodity price risk. We plan to continue maintaining relatively modest leverage and financing
76
- •
- Manage our exposure to commodity price risk. We intend to continue to manage our exposure to commodity price risk in the near term while remaining opportunistic over the long term. We use a variety of hedging instruments to accomplish our risk management objectives and enhance the stability of our cash flows. Our commodity derivative contracts are currently in the form of basic swaps and collars that are designed to provide a fixed price (swaps) or defined range of prices (collars) that we will receive. We actively monitor our hedge portfolio to support our cash flow objectives.
our growth with a balanced combination of equity and debt. Maintaining a balanced capital structure allows us to use our available capital to selectively pursue attractive investments or acquisition opportunities.
Our Competitive Strengths
We have a number of competitive strengths that we believe will help us to successfully execute our business strategies:
- •
- Acquisition execution capabilities. We have a proven track
record of identifying, evaluating and executing the purchase of oil and natural gas assets and companies. Since we began operations in 2008, we have completed ten material acquisitions, creating
significant value relative to the capital employed. The significant history, experience and familiarity of our executive management team with the Gulf of Mexico leads potential sellers to contact us
directly, which reduces potential competition from other buyers. We have an experienced team of professionals dedicated primarily to the technical evaluation of acquisitions and reserve analysis,
which allows us to continuously pursue opportunities without compromising the management of our existing assets. Moreover, we believe that our expertise related to the legal, financial and regulatory
aspects of mergers and acquisitions allows us to quickly and successfully close transactions.
- •
- High-quality asset base with significant production enhancement
opportunities. Our producing asset base is composed of some of the largest fields discovered in the Gulf of Mexico. Given the prolific
nature of our assets, we believe that our fields are characterized by lower-risk properties and offer significant additional development and exploration potential. Specifically, our
geological and geophysical professionals have identified a multi-year inventory of potential drilling locations in our fields associated with our proved reserves, which we believe
represent lower-risk opportunities. In addition, we have identified a substantial inventory of unproven prospects through the technical evaluation of our properties. We have licenses for
recent 3-D seismic data utilizing modern processing techniques on more than 450 offshore blocks. Our seismic data covers the vast majority of our acreage holdings, including
multiple data sets over several of our more valuable properties. Many of our fields contain several producing zones, providing us increased opportunities for production enhancement activities within
each wellbore. Additionally, we own the rights to deep intervals on the vast majority of our approximately 830,000 gross (490,000 net) acres in the Gulf of Mexico, which includes the depths at which
ultra-deep exploration is underway on the Gulf of Mexico Shelf.
- •
- Operating control over the majority of our portfolio of assets. We operate more than 90% of our assets based on the PV-10 of our proved oil and natural gas reserves as of July 31, 2011, allowing us to maintain better control over our asset portfolio. We believe that controlling operations will allow us to dictate the pace of development as well as the costs, type and timing of exploration and development activities. We also believe that maintaining operational control over the majority of our assets allows us to better pursue our strategies of enhancing returns through focusing on production enhancement opportunities, operational and cost efficiencies, maximizing hydrocarbon recovery and effectively managing our P&A liabilities.
77
- •
- Strong financial profile. We believe that our strong
financial profile positions us as a preferred buyer for potential acquisitions. After the completion of this offering, we expect to continue to have strong liquidity and financial flexibility
sufficient to fund our anticipated capital needs and future growth opportunities. As of September 30, 2011, after giving effect to the application of the net proceeds of this offering, we would
have had approximately $108.0 million outstanding under our revolving credit facility, with additional availability of approximately $322.0 million. Please read "—XTO
Acquisition" beginning on page 72, "—MOR Transaction" beginning on page 73 and "Prospectus Summary—Recent Developments—Borrowing Base Increases and
Debt Repayment; Distributions to Equity Owners" beginning on page 8. We expect that cash flows from our assets will be sufficient to fund our planned capital expenditure activities, and given
our high level of operational control, we should be able to maintain control over the pace of spending.
- •
- Significant oil exposure. As of July 31, 2011, our
estimated net proved reserves were composed of approximately 50% oil. This oil exposure allows us to benefit from the disparity between relative oil and natural gas prices, which has persisted over
the last several years and which we expect to continue in the future. Nearly all of our oil is sold at LLS, HLS and EIC prices, which have recently traded at a significant premium to NYMEX WTI
benchmark prices. Consequently, our oil production benefits from higher pricing differentials relative to many other North American crude oil producers in other areas. For example, for the three
months ended September 30, 2011, the average realized price before the effect of commodity derivative contracts for our oil production was $104.91 per Bbl, compared to an average WTI index
price of $89.54 per Bbl for the same period.
- •
- Efficient management of our P&A activities. We consider
the evaluation and execution of P&A activities to be one of our core competencies. We have an experienced internal team with a dedicated focus on managing our P&A activities and estimating P&A costs
associated with acquisition opportunities. Our ongoing effort to manage our P&A liabilities by proactively removing inactive structures, wellbores and pipelines meaningfully reduces our operating
expenses, maintenance expenses, insurance premiums and overall risk exposure.
- •
- Experienced and incentivized management team. Our
management team has an average of more than 28 years of energy industry experience, primarily focused on the Gulf of Mexico. In addition, our executive officers, management and other employees
have a meaningful economic interest in us, which is expected to total approximately 10.1% of our common stock following the completion of this offering, thereby aligning management's interests with
those of our stockholders.
- •
- Affiliation with Riverstone. Investment funds managed by Riverstone have significant energy and financial expertise to complement their investment in us. To date, affiliates of Riverstone and the Carlyle Group (such affiliates, the "Riverstone/Carlyle Funds") have committed approximately $16.0 billion to 79 investments across the midstream, upstream, power, oilfield service and renewable sectors of the energy industry. Following the completion of this offering, the Riverstone/Carlyle Funds will own an approximate 52.3% interest in us. While we expect that our relationship with Riverstone will continue to provide us with several significant benefits, including access to potential transactions and financial professionals with a successful track record of investing in energy assets, Riverstone is under no obligation to provide us with such access and is likely to do so only to the extent such access would prove beneficial to Riverstone. In addition, we have renounced our interest in certain business opportunities that may be presented to Riverstone and its affiliates. Further, affiliates of Riverstone currently have, and may make in the future, investments in other similar companies that compete with us. Please read "Certain Related Party Transactions—Riverstone/Carlyle Funds Investments in Dynamic" beginning on page 126.
78
- •
- Relationship with Superior. Superior will continue to own a significant equity interest in us following this offering and is a co-owner in Bullwinkle. We believe this relationship offers several significant benefits, including access to technical expertise related to well intervention and decommissioning and insight into offshore service market conditions. Our complementary areas of expertise and operational capabilities position us favorably in the pursuit of future acquisition opportunities. Please read "Certain Relationships and Related Party Transactions—Transactions with Superior" beginning on page 128 and "Description of Capital Stock—Corporate Opportunity" beginning on page 138.
Our Operations
The following table presents summary data with respect to our estimated net proved and probable oil and natural gas reserves as of the dates indicated. The reserve estimates at July 31, 2011 for our estimated net proved and probable oil and natural gas reserves and for the estimated net proved and probable oil and natural gas reserves that we acquired in the MOR Transaction presented in the tables below are based on reports prepared by NSAI in accordance with the rules and regulations of the SEC regarding oil and natural gas reserve reporting. The estimates of the net proved and probable oil and natural gas reserves that we acquired in the XTO Acquisition at July 31, 2011 presented in the tables below are based, in part, on reports prepared by NSAI for the XTO Acquisition covering 75% of the total net proved reserves (85% of the total net proved developed reserves and 85% of the present value of the total proved reserves) in accordance with the rules and regulations of the SEC regarding oil and natural gas reserve reporting. The remaining 25% of the total net proved reserves (15% of the total net proved developed reserves and 15% of the present value of the total proved reserves) and all of the total probable reserves for the XTO Acquisition are based on estimates prepared by our internal engineers.
The reserve estimates at December 31, 2010 presented in the table below are based on estimates prepared by our internal engineers, in accordance with the rules and regulations regarding oil and natural gas reserve reporting. For more information about our summary reserve data, please read NSAI's reports, which have been filed as exhibits to the registration statement containing this prospectus.
The reserve estimates and the associated PV-10 and standardized measure included in this prospectus do not include the effects of insurance costs. For more detail about our aggregate insurance costs, please read the operating expense information contained within Note 3 to the audited consolidated financial statements of Dynamic Offshore Holding, LP.
Proved reserves are reserves which, by analysis of geoscience and engineering data, can be estimated with reasonable certainty to be economically producible from a given date forward from known reservoirs under existing economic conditions, operating methods and government regulations prior to the time at which contracts providing the right to operate expire, unless evidence indicates that renewal is reasonably certain. Probable reserves are reserves that are less certain to be recovered than proved reserves but which, together with proved reserves, are as likely as not to be recovered. Estimates of probable reserves which may potentially be recoverable through additional drilling or
79
recovery techniques are by nature more uncertain than estimates of proved reserves and accordingly are subject to substantially greater risk of not actually being realized by us.
| |
|
At July 31, 2011 | |||||||||||||
|---|---|---|---|---|---|---|---|---|---|---|---|---|---|---|---|
| |
At December 31, 2010(1) |
||||||||||||||
| |
Dynamic(2) | XTO | Total | ||||||||||||
Reserve Data(3): |
|||||||||||||||
Estimated proved reserves: |
|||||||||||||||
Oil (MMBbls) |
18.5 | 24.6 | 5.2 | 29.8 | |||||||||||
Natural gas (Bcf)(4) |
91.3 | 131.8 | 49.8 | 181.6 | |||||||||||
Total estimated proved reserves (MMBoe)(5) |
33.7 | 46.6 | 13.5 | 60.1 | |||||||||||
Proved developed: |
|||||||||||||||
Oil (MMBbls) |
15.0 | 19.5 | 4.4 | 24.0 | |||||||||||
Natural gas (Bcf) |
80.7 | 116.1 | 32.0 | 148.0 | |||||||||||
Total (MMBoe) |
28.5 | 38.9 | 9.8 | 48.7 | |||||||||||
Percent proved developed |
85 | % | 84 | % | 72 | % | 81 | % | |||||||
Proved undeveloped: |
|||||||||||||||
Oil (MMBbls) |
3.4 | 5.1 | 0.8 | 5.9 | |||||||||||
Natural gas (Bcf) |
10.5 | 15.7 | 17.9 | 33.6 | |||||||||||
Total (MMBoe) |
5.2 | 7.7 | 3.8 | 11.5 | |||||||||||
PV-10 of proved reserves (in millions)(6) |
$ | 947.7 | $ | 1,381.5 | $ | 328.5 | $ | 1,710.0 | |||||||
Standardized Measure (in millions)(6) |
$ | 1,184.5 | n/a | n/a | n/a | ||||||||||
Estimated probable reserves: |
|||||||||||||||
Oil (MMBbls) |
4.6 | 4.7 | 1.5 | 6.2 | |||||||||||
Natural gas (Bcf)(4) |
49.0 | 25.6 | 33.3 | 58.9 | |||||||||||
Total estimated probable reserves (MMBoe) |
12.7 | 9.0 | 7.0 | 16.0 | |||||||||||
PV-10 of probable reserves (in millions)(6) |
$ | 285.1 | $ | 282.7 | $ | 87.4 | $ | 370.1 | |||||||
- (1)
- Includes
reserves net to our equity interests in our consolidated subsidiaries in which we owned less than 100% of the outstanding equity as of
December 31, 2010.
- (2)
- Includes
interests acquired in the MOR Transaction.
- (3)
- Our
estimated proved and probable reserves and related future net revenues and PV-10 at December 31, 2010 and July 31, 2011 and
Standardized Measure at December 31, 2010 were determined using index prices for oil and natural gas, without giving effect to derivative transactions, and were held constant throughout the
life of the properties. The unweighted arithmetic average first-day-of-the-month prices for the prior 12 months were $79.40/Bbl for oil and
$4.38/MMBtu for natural gas at December 31, 2010 and $88.44/Bbl for oil and $4.19/MMBtu for natural gas at July 31, 2011. These prices were adjusted by lease for quality, transportation
fees, geographical differentials, marketing bonuses or deductions and other factors affecting the price received at the wellhead on a historical basis.
- (4)
- Includes
NGL volumes, which we do not believe are significant.
- (5)
- One
Boe is equal to six Mcf of natural gas or one Bbl of oil or NGLs based on an approximate energy equivalency.
- (6)
- For more information about our PV-10 and Standardized Measure, please read "Prospectus Summary—Summary Historical Operating and Reserve Data—PV-10 and Standardized Measure" beginning on page 17.
Our proved reserves at July 31, 2011 were 60.1 MMBoe, a 78.3% increase from reserves of 33.7 MMBoe at December 31, 2010. Our proved developed reserves increased 20.0 MMBoe, or 70.2%,
80
to 48.7 MMBoe at July 31, 2011 from 28.5 MMBoe at December 31, 2010. In each case, the increases were due primarily to acquisitions.
Our proved reserves at December 31, 2010 were 33.7 MMBoe, a 39% increase from reserves of 24.3 MMBoe at December 31, 2009, based on our internal reserves estimates at December 31, 2009. Our estimated proved reserves increased 9.4 MMBoe during the year ended December 31, 2010 due primarily to acquisitions. Our proved developed reserves increased 8.2 MMBoe, or 40.4%, to 28.5 MMBoe at December 31, 2010 from 20.3 MMBoe at December 31, 2009 due primarily to acquisitions.
Price Sensitivity
The following table illustrates the sensitivity of our estimated proved and probable oil and natural gas reserves and related PV-10 to changes in product price levels. The reserve quantities and PV-10 shown below were prepared on the same basis as in the table above, except for (i) that NSAI's report for the properties acquired in the XTO Acquisition covers 84% of the present value of the total proved reserves acquired and (ii) the use of market pricing based on closing forward prices on the NYMEX for oil and natural gas on July 31, 2011 rather than average first-day-of-the-month prices for the prior 12 months as specified by the SEC. We believe that the use of forward prices provides investors with additional useful information about our reserves, as the forward prices are based on the market's forward-looking expectations of oil and natural gas prices as of a certain date. Investors should be careful to consider forward prices in addition to, and not as a substitute for, SEC prices, when considering our oil and natural gas reserves. The assumed lease and well operating costs included in the pricing sensitivity are based on our historical lease and well operating costs and have been held constant throughout the life of the properties. The assumed capital and abandonment costs were held constant to the date of the expenditure. Based on SEC pricing, the PV-10 of our proved oil and natural gas reserves was approximately $1.7 billion while, based on NYMEX forward pricing at July 22, 2011, as set forth below, the PV-10 of our proved oil and natural gas reserves was approximately $2.1 billion.
| |
At July 31, 2011 | |||||||||||
|---|---|---|---|---|---|---|---|---|---|---|---|---|
| |
Dynamic(1) | XTO | Total | |||||||||
Reserve Data(2): |
||||||||||||
Estimated proved reserves: |
||||||||||||
Oil (MMBbls) |
25.1 | 5.3 | 30.4 | |||||||||
Natural gas (Bcf)(3) |
134.4 | 50.4 | 184.9 | |||||||||
Total estimated proved reserves (MMBoe)(4) |
47.6 | 13.7 | 61.3 | |||||||||
PV-10 of proved reserves (in millions)(5) |
$ | 1,725.9 | $ | 413.7 | $ | 2,139.6 | ||||||
Estimated probable reserves: |
||||||||||||
Oil (MMBbls) |
4.8 | 1.5 | 6.3 | |||||||||
Natural gas (Bcf)(3) |
27.5 | 37.4 | 64.9 | |||||||||
Total estimated probable reserves (MMBoe) |
9.4 | 7.7 | 17.1 | |||||||||
PV-10 of probable reserves (in millions)(5) |
$ | 349.5 | $ | 129.7 | $ | 479.2 | ||||||
- (1)
- Includes
interests acquired in the MOR Transaction.
- (2)
- Our estimated proved reserves and related future net revenues and PV-10 at July 31, 2011 were determined using index prices for oil and natural gas, without giving effect to derivative transactions. At July 22, 2011, the forward prices were: $100.14/Bbl for oil and $4.46/MMBtu for natural gas for the period ending December 31, 2011; $102.61/Bbl for oil and $4.79/MMBtu for natural gas for the year ending December 31, 2012; $103.75/Bbl for oil and $5.19/MMBtu for natural gas for the year ending December 31, 2013; and $103.53/Bbl for oil and $5.40/MMBtu for natural gas thereafter. These prices were adjusted by lease for quality, transportation fees,
81
historical geographical differentials, marketing bonuses or deductions and other factors affecting the price received at the wellhead.
- (3)
- Includes
NGL volumes, which we do not believe are significant.
- (4)
- One
Boe is equal to six Mcf of natural gas or one Bbl of oil or NGLs based on an approximate energy equivalency.
- (5)
- For more information about our PV-10 and Standardized Measure, please read "Prospectus Summary—Summary Historical Operating and Reserve Data—PV-10 and Standardized Measure" beginning on page 17.
The following table sets forth the estimated future net revenues, excluding derivatives contracts, from proved reserves, the PV-10, and the expected benchmark prices used in projecting net revenues at December 31, 2010 and July 31, 2011:
| |
At December 31, 2010(1) | At July 31, 2011 | ||||||
|---|---|---|---|---|---|---|---|---|
Future net revenues |
$ | 1,197,797 | $ | 2,166,055 | ||||
Present value of future net revenues: |
||||||||
PV-10($/thousands) |
$ | 947,683 | $ | 1,710,007 | ||||
After income tax (Standardized Measure)($/thousands) |
$ | 1,184,518 | n/a | |||||
Benchmark oil price(2)($/Bbl) |
$ | 79.40 | $ | 88.44 | ||||
Benchmark natural gas price(2)($/MMBtu) |
$ | 4.38 | $ | 4.19 | ||||
- (1)
- Includes
reserves net to our equity interests in our consolidated subsidiaries in which we owned less than 100% of the outstanding equity as of
December 31, 2010.
- (2)
- Our estimated proved and probable reserves and related future net revenues and PV-10 at December 31, 2010 and July 31, 2011 and Standardized Measure at December 31, 2010 were determined using index prices for oil and natural gas, without giving effect to derivative transactions, and were held constant throughout the life of the properties. The unweighted arithmetic average first-day-of-the-month prices for the prior 12 months were $79.40/Bbl for oil and $4.38/MMBtu for natural gas at December 31, 2010 and $88.44/Bbl for oil and $4.19/MMBtu for natural gas at July 31, 2011. These prices were adjusted by lease for quality, transportation fees, geographical differentials, marketing bonuses or deductions and other factors affecting the price received at the wellhead on a historical basis.
Future net revenues represent projected revenues from the sale of proved reserves net of production and development costs (including operating expenses and production taxes). There can be no assurance that the proved reserves will be produced within the periods indicated or that prices and costs will remain constant. There are numerous uncertainties inherent in estimating reserves and related information and different reservoir engineers often arrive at different estimates for the same properties.
Proved Undeveloped Reserves
Our proved undeveloped reserves were 11.5 MMBoe at July 31, 2011, an increase of 121.2%, from 5.2 MMBoe at December 31, 2010, due primarily to acquisitions.
Our proved undeveloped reserves increased 1.2 MMBoe, or 30%, to 5.2 MMBoe at December 31, 2010 from 4.0 MMBoe at December 31, 2009, due primarily to acquisitions.
In the year ended December 31, 2010, we converted 991 MBbls of oil and 5,900 MMcf of natural gas, or 1,974 total MBoe, from proved undeveloped reserves into proved developed reserves at an investment cost of $22.4 million. For the period from January 1, 2011 through July 31, 2011, we converted 25 MBbls of oil and 12 MMcf of natural gas, or 27 total MBoe, from proved undeveloped reserves into proved developed reserves at an investment cost of $3.7 million. In total, we have converted 2,231 MBbls of oil and 8,451 MMcf of natural gas, or 3,640 total MBoe, from proved undeveloped reserves into proved developed reserves at an investment cost of $86.3 million.
82
At July 31, 2011, we had total estimated future proved undeveloped reserves of 7,679 MBoe and estimated future net cash flows associated with production of $386.7 million. At July 31, 2011, for the period from August 1, 2011 through December 31, 2011, we had estimated future proved undeveloped reserves of 74 MBoe and estimated future net cash outflows associated with production of $14.5 million. At July 31, 2011, we had estimated future proved undeveloped reserves of 1,059 MBoe, 1,845 MBoe, 1,520 MBoe, 952 MBoe and 621 MBoe and estimated future net cash flows associated with production of $1.6 million, $101.2 million, $99.2 million, $57.9 million and $32.0 million for the years ending December 31, 2012, 2013, 2014 and 2015, respectively, and for the time period thereafter. Beginning in 2012 and thereafter, the production and cash flows represent the drilling results from the respective year plus the incremental effects of proved undeveloped drilling from the preceding years.
Historically, our drilling programs have been funded from our cash flows, and our expectation in the future is to continue to fund our drilling programs primarily from our cash flows. Based on our current expectations of our cash flows and drilling programs, which includes drilling of proved undeveloped and unproven locations, we believe that we can substantially fund from our cash flows and, if needed, our credit facility, the drilling of our current inventory of proved undeveloped locations in the next five years. As of December 31, 2010, we did not have any commitments to deliver fixed or determinable quantities of oil or natural gas.
Independent Petroleum Engineers
Our estimated reserves and related future net revenues and PV-10 at July 31, 2011, a substantial majority of the estimated reserves and related future net revenues and PV-10 at July 31, 2011 of the XTO Acquisition properties and the estimated reserves and future net revenues and PV-10 at July 31, 2011 of the MOR Transaction properties are each based on reports prepared by NSAI, our independent reserve engineers, in accordance with generally accepted petroleum engineering and evaluation principles and definitions and current guidelines established by the SEC. A copy of each of these reports has been filed as an exhibit to the registration statement containing this prospectus.
Qualifications of Responsible Technical Persons—NSAI
NSAI was founded in 1961 and performs consulting petroleum engineering services under Texas Board of Professional Engineers Registration No. F-002699. Within NSAI, the technical person primarily responsible for preparing the estimates set forth in the NSAI letters, each of which is filed as an exhibit to the registration statement containing this prospectus, was Richard B. Talley, Jr., Vice President, Team Leader, and a consulting petroleum engineer. Mr. Talley is a Registered Professional Engineer in the State of Texas (License No. 102425). Mr. Talley joined NSAI in 2004 after serving as a Senior Engineer at ExxonMobil Production Company. Mr. Talley's areas of specific expertise include probabilistic assessment of exploration prospects and new discoveries, estimation of oil and gas reserves, and workovers and completions. Mr. Talley received an MBA degree from Tulane University in 2001 and a BS degree in Mechanical Engineering from University of Oklahoma in 1998. Mr. Talley meets or exceeds the education, training, and experience requirements set forth in the Standards Pertaining to the Estimating and Auditing of Oil and Gas Reserves Information promulgated by the Society of Petroleum Engineers; he is proficient in judiciously applying industry standard practices to engineering and geoscience evaluations as well as applying SEC and other industry reserves definitions and guidelines.
Technology Used to Establish Proved and Probable Reserves
Under SEC rules, proved reserves are those quantities of oil and natural gas, which, by analysis of geoscience and engineering data, can be estimated with reasonable certainty to be economically producible from known reservoirs from a given date forward, and under existing economic conditions, operating methods, and government regulations prior to the time at which contracts providing the right
83
to operate expire, unless evidence indicates that renewal is reasonably certain, regardless of whether deterministic or probabilistic methods are used for the estimation. The project to extract the hydrocarbons must have commenced or the operator must be reasonably certain that it will commence the project within a reasonable time. The term "reasonable certainty" implies a high degree of confidence that the quantities of oil and/or natural gas actually recovered will equal or exceed the estimate. Reasonable certainty can be established using techniques that have been proved effective by actual production from projects in the same reservoir or an analogous reservoir or by other evidence using reliable technology that establishes reasonable certainty. Reliable technology is a grouping of one or more technologies (including computational methods) that have been field tested and have been demonstrated to provide reasonably certain results with consistency and repeatability in the formation being evaluated or in an analogous formation.
Under SEC rules, probable reserves are those quantities of oil and natural gas, which, by analysis of geoscience and engineering data, are less certain to be recovered than proved reserves but which, together with proved reserves, are as likely as not to be recovered from a given date forward, and under existing economic conditions, operating methods, and government regulations prior to the time which contracts providing the right to operate expire, unless evidence indicates that renewal is reasonably certain, regardless of whether deterministic or probalistic methods are used for the estimation.
In order to establish reasonable certainty with respect to our estimated proved reserves, NSAI employed technologies that have been demonstrated to yield results with consistency and repeatability. The technologies and economic data used in the estimation of our proved and probable reserves include, but are not limited to, electrical logs, radioactivity logs, core analyses, geologic maps and available downhole and production data, seismic data and well test data.
Internal Controls over Reserves Estimation Process
We maintain an internal staff of petroleum engineers and geoscience professionals who work closely with our independent reserve engineers to ensure the integrity, accuracy and timeliness of data furnished to third-party reserve engineers in their reserves estimation process. Our Senior Vice President—Acquisitions & Engineering is the technical person primarily responsible for overseeing the preparation of our reserves estimates. He has over 29 years of industry experience with positions of increasing responsibility in engineering and evaluations and holds a BS degree in Petroleum Engineering. He reports directly to our President and Chief Executive Officer.
Throughout each fiscal year, our technical team meets with representatives of our independent reserve engineers to review properties and discuss methods and assumptions used in preparation of the proved reserves estimates. While we have no formal committee specifically designated to review reserves reporting and the reserves estimation process, a preliminary copy of the reserve report is reviewed by our President and Chief Executive Officer with representatives of our independent reserve engineers and internal technical staff. Following the consummation of this offering, we anticipate that our audit committee will conduct a similar review on an annual basis.
In connection with our historical reserves as of December 31, 2010, we had fully engineered reserve reports prepared by independent third-party reserve engineers in accordance with the definitions and guidelines set forth in the 2007 Petroleum Resources Management System approved by the Society of Petroleum Engineers rather than SEC definitions and guidelines. The reserve data included in this prospectus as of December 31, 2010 has been derived from these reports and modified by our internal technical staff to conform with the SEC definitions and guidelines and to reflect our net interest in the reserves.
84
Production, Revenues and Price History
Oil and natural gas are commodities. The price that we receive for the oil and natural gas we produce is largely a function of market supply and demand. Demand for oil and natural gas in the United States has increased dramatically during this decade. However, the current economic slowdown reduced this demand during the second half of 2008 and through 2009. Demand for oil increased during 2010, but demand for natural gas remained sluggish. Demand is impacted by general economic conditions, weather and other seasonal conditions, including hurricanes and tropical storms. Over or under supply of oil or natural gas can result in substantial price volatility. Historically, commodity prices have been volatile and we expect that volatility to continue in the future. A substantial or extended decline in oil or natural gas prices or poor drilling results could have a material adverse effect on our financial position, results of operations, cash flows, quantities of oil and natural gas reserves that may be economically produced and our ability to access capital markets.
The following table sets forth information regarding oil and natural gas production, revenues and realized prices and production costs for the periods presented. This summary data is presented on a basis consistent with our consolidated financial statements. The unaudited pro forma information was prepared as if our acquisition of oil and natural gas properties from Samson Resources and our XTO Acquisition had each occurred on January 1, 2010. For additional information on price calculations, please read information set forth in "Management's Discussion and Analysis of Financial Condition and Results of Operations" beginning on page 51.
| |
Historical | Pro Forma | ||||||||||||||||||||||||
|---|---|---|---|---|---|---|---|---|---|---|---|---|---|---|---|---|---|---|---|---|---|---|---|---|---|---|
| |
Predecessor | Dynamic Offshore Holding, LP | ||||||||||||||||||||||||
| |
January 1, 2008 Through March 13, 2008 |
Year Ended December 31, |
Nine Months Ended September 30, |
|
Nine Months Ended September 30, 2011 |
|||||||||||||||||||||
| |
Year Ended December 31, 2010 |
|||||||||||||||||||||||||
| |
2008 | 2009 | 2010 | 2010 | 2011 | |||||||||||||||||||||
Operating data: |
||||||||||||||||||||||||||
Net sales volumes: |
||||||||||||||||||||||||||
Oil (MBbls) |
364 | 1,363 | 2,145 | 3,289 | 2,447 | 2,559 | 4,792 | 3,171 | ||||||||||||||||||
Natural gas (MMcf) |
2,575 | 6,692 | 10,555 | 18,468 | 14,086 | 14,482 | 33,403 | 20,521 | ||||||||||||||||||
Total (MBoe) |
793 | 2,478 | 3,904 | 6,367 | 4,795 | 4,973 | 10,359 | 6,591 | ||||||||||||||||||
Average net daily production (Boe/d) |
10,859 | 6,770 | 10,696 | 17,444 | 17,564 | 18,216 | 28,381 | 24,143 | ||||||||||||||||||
Average sales prices: |
||||||||||||||||||||||||||
Oil, without realized derivatives ($/Bbl) |
96.72 | 103.80 | 62.64 | 78.65 | 76.37 | 106.23 | 78.42 | 106.41 | ||||||||||||||||||
Natural gas, without realized derivatives ($/Mcf) |
8.16 | 10.12 | 4.23 | 4.72 | 4.87 | 4.74 | 4.81 | 4.81 | ||||||||||||||||||
Oil, with realized derivatives ($/Bbl)(1) |
96.72 | 113.65 | 89.95 | 86.35 | 86.32 | 99.85 | 83.71 | 101.26 | (2) | |||||||||||||||||
Natural gas, with realized derivatives ($/Mcf)(1) |
8.16 | 10.10 | 5.89 | 5.68 | 5.76 | 5.48 | 5.35 | 5.33 | ||||||||||||||||||
Oil, WTI benchmark ($/Bbl) |
96.25 | 99.75 | 62.09 | 79.61 | 77.69 | 95.47 | 79.61 | 95.47 | (2) | |||||||||||||||||
Natural gas, Henry Hub benchmark ($/MMBtu) |
8.58 | 8.90 | 4.16 | 4.38 | 4.52 | 4.21 | 4.38 | 4.21 | ||||||||||||||||||
Costs and expenses ($/Boe): |
||||||||||||||||||||||||||
Lease operating expense(3) |
11.09 | 14.82 | 15.53 | 14.04 | 13.25 | 15.89 | 12.18 | 14.96 | ||||||||||||||||||
Depreciation, depletion and amortization |
16.92 | 20.04 | 22.69 | 30.65 | 20.06 | 20.59 | 26.22 | 20.07 | ||||||||||||||||||
General and administrative expense |
2.87 | 7.20 | 6.57 | 3.82 | 4.02 | 3.89 | 2.35 | 2.93 | ||||||||||||||||||
- (1)
- Realized prices include realized gains or losses on cash settlements for our commodity derivative contracts, which have not been designated for hedge accounting. We have not made any estimates of the impact of commodities derivatives on the average sales price for our predecessor.
85
- (2)
- For
the three months ended September 30, 2011, the average realized price before the effect of commodity derivative contracts for our oil production
was $104.91 per Bbl, compared to an average WTI index price of $89.54 per Bbl for the same period.
- (3)
- Our lease operating expenses do not include the effects of insurance costs. For more detail about our aggregate insurance costs, please read the operating expense information contained within Note 3 to the audited consolidated financial statements of Dynamic Offshore Holding, LP.
For more information about the changes in production volumes, sales prices and costs and expenses, please read "Management's Discussion and Analysis of Financial Condition and Results of Operations—Results of Operations" beginning on page 58.
Productive Wells
The following table presents the total gross and net productive wells by oil or gas completion as of September 30, 2011:
| |
Oil | Natural Gas | Total | ||||||||||||||||
|---|---|---|---|---|---|---|---|---|---|---|---|---|---|---|---|---|---|---|---|
| |
Gross | Net | Gross | Net | Gross | Net | |||||||||||||
Total productive wells |
274 | 171 | 204 | 102 | 478 | 273 | |||||||||||||
Gross wells are the number of wells in which a working interest is owned and net wells are the total of our fractional working interests owned in gross wells.
Acreage
The following table sets forth certain information regarding the developed and undeveloped acreage in which we own a working interest as of September 30, 2011. Acreage related to royalty, overriding royalty and other similar interests is excluded from this summary.
| |
Developed Acres | Undeveloped Acres(1) | Total Acres | ||||||||||||||||
|---|---|---|---|---|---|---|---|---|---|---|---|---|---|---|---|---|---|---|---|
| |
Gross | Net | Gross | Net | Gross | Net | |||||||||||||
Total acreage |
699,957 | 380,513 | 128,698 | 110,127 | 828,654 | 490,640 | |||||||||||||
- (1)
- Leases covering our undeveloped gross acreage will expire at a rate of approximately 4% on a gross basis (2% net) in 2011, 32% on a gross basis (32% net) in 2012 and 45% on a gross basis (44% net) in 2013. As of July 31, 2011, all of our proved undeveloped reserves were held by production, and, therefore, there were no proved undeveloped reserves attributed to the acreage expiring in 2011, 2012 or 2013.
86
Drilling activity
The following table summarizes our drilling activity for the periods presented. Gross wells reflect the sum of all wells in which we own an interest. Net wells reflect the sum of our working interests in gross wells.
| |
Predecessor | Dynamic Offshore Resources, LLC | ||||||||||||||||||||||||||||||||||||
|---|---|---|---|---|---|---|---|---|---|---|---|---|---|---|---|---|---|---|---|---|---|---|---|---|---|---|---|---|---|---|---|---|---|---|---|---|---|---|
| |
January 1, 2008 Through March 13, 2008 |
|
|
|
|
|
|
|
|
|
|
|||||||||||||||||||||||||||
| |
Year Ended December 31, | Nine Months Ended September 30, | ||||||||||||||||||||||||||||||||||||
| |
2008 | 2009 | 2010 | 2010 | 2011 | |||||||||||||||||||||||||||||||||
| |
Gross | Net | Gross | Net | Gross | Net | Gross | Net | Gross | Net | Gross | Net | ||||||||||||||||||||||||||
Development wells: |
||||||||||||||||||||||||||||||||||||||
Oil |
— | — | 3 | 2.5 | 2 | 2 | 1 | 0.6 | — | — | 2 | 0.3 | ||||||||||||||||||||||||||
Natural gas |
— | — | — | — | — | — | 1 | 0.4 | 1 | 0.4 | — | — | ||||||||||||||||||||||||||
Dry holes |
— | — | — | — | — | — | — | — | — | — | 1 | 0.2 | ||||||||||||||||||||||||||
Total |
— | — | 3 | 2.5 | 2 | 2 | 2 | 1.0 | — | — | 3 | 0.5 | ||||||||||||||||||||||||||
Exploratory wells: |
||||||||||||||||||||||||||||||||||||||
Oil |
— | — | — | — | — | — | — | — | — | — | — | — | ||||||||||||||||||||||||||
Natural gas |
— | — | — | — | — | — | 2 | 0.8 | 2 | 0.8 | — | — | ||||||||||||||||||||||||||
Dry holes |
— | — | 1 | 0.5 | — | — | — | — | — | — | 1 | 0.7 | ||||||||||||||||||||||||||
Total |
— | — | 1 | 0.5 | — | — | 2 | 0.8 | 2 | 0.8 | 1 | 0.7 | ||||||||||||||||||||||||||
Total wells |
— | — | 4 | 3 | 2 | 2 | 4 | 1.8 | 3 | 1.2 | 4 | 1.2 | ||||||||||||||||||||||||||
As of September 30, 2011, we had no wells in the process of drilling or completion. In the first nine months of 2011, we participated on a non-operated basis in the drilling of 3 gross (0.5 net) development wells, of which 2 gross (0.3 net) were completed as producers. During the same period, we drilled 1 gross (0.7 net) exploration well that was deemed a dry hole. In 2009 and 2010, we achieved a 100% success rate, with a total of 6 gross (3.8 net) wells, of which 2 gross (0.8 net) wells were exploration wells. In 2008, we drilled 4 gross (3.0 net) wells, of which 1 gross (0.5 net) well was deemed a dry hole and 3 gross (2.5 net) wells were completed as producers.
Because we expect to drill several wells during 2012, we recently contracted for a jackup drilling rig for 2012, with the option to extend into 2013, and one platform drilling rig for use at the Bullwinkle field.
Marketing and Major Purchasers
We sell our oil and natural gas to third-party purchasers. We are not dependent upon, or contractually limited to, any one purchaser or small group of purchasers. However, in 2010 we received over 10% of our total revenues from each of Shell Trading (US) Company, Texon LP and ConocoPhillips. Due to the nature of oil and natural gas markets and because oil and natural gas are freely traded commodities and there are numerous purchasers in the Gulf of Mexico, we do not believe the loss of a single purchaser or a few purchasers would materially affect our ability to sell our production.
Title to Properties
As is customary in the oil and natural gas industry, we initially conduct only a cursory review of the title to our properties on which we do not have proved reserves. To the extent title opinions or other investigations reflect defects affecting those properties, we are typically responsible for curing any such defects at our expense. We generally will not commence drilling operations on a property until we have cured known material title defects on such property. We have reviewed the title to substantially all of our producing properties and believe that we have satisfactory title to our producing properties in
87
accordance with standards generally accepted in the oil and natural gas industry. Prior to completing an acquisition of producing oil and natural gas properties, we perform title reviews on the most significant properties and, depending on the materiality of properties, we may obtain a title opinion or review or update previously obtained title opinions. Our oil and natural gas properties are subject to customary royalty and other interests, liens to secure borrowings under our credit facility, liens for current taxes and other burdens which we believe do not materially interfere with the use or affect our carrying value of the properties.
Seasonality
Generally, the demand for and price of natural gas increases during the winter months and decreases during the summer months. However, these seasonal fluctuations are somewhat reduced because during the summer, pipeline companies, utilities, local distribution companies and industrial users purchase and place into storage facilities a portion of their anticipated winter requirements of natural gas. Seasonal weather changes affect our operations. Tropical storms and hurricanes occur in the Gulf of Mexico during the summer and fall, which may require us to evacuate personnel and shut in production until these storms subside. Also, periodic storms during the winter often impede our ability to safely load, unload and transport personnel and equipment, which delays the installation of production facilities, thereby delaying sales of our oil and natural gas.
Competition
The oil and natural gas industry is highly competitive. We operate exclusively in the Gulf of Mexico area and compete for the acquisition of oil and natural gas properties primarily on the basis of financial strength, bidder's perceived ability to close the transaction and price for such properties. We compete with numerous entities, including major domestic and foreign oil companies, other independent oil and natural gas companies and individual producers and operators. Many of these competitors are large, well-established companies and have financial and other resources substantially greater than ours. Our ability to acquire additional oil and natural gas properties and to discover reserves in the future will depend upon our ability to evaluate and select suitable properties and consummate transactions in a highly competitive environment. For a more thorough discussion of how competition could impact our ability to successfully complete our business strategy, please read "Risk Factors" beginning on page 20.
Insurance
We maintain insurance programs to provide coverage for a high percentage of our assets in the event of physical damage and well control events. While we may not obtain insurance for some risks if we believe the cost of available insurance is excessive relative to the risks presented, we intend to continue to pursue a strong risk mitigation program by maintaining comprehensive insurance coverage related to our exposure to operational and weather related risk. For example, we believe our wind storm loss limits are higher than those of our peers. Our wind storm loss limits extend beyond historic loss levels that our properties have experienced and provide for adequate room to add assets in connection with future acquisitions.
Regulation of the Oil and Natural Gas Industry
General
Various aspects of our oil and natural gas operations are subject to extensive and continually changing regulation as legislation affecting the oil and natural gas industry is under constant review for amendment or expansion. Numerous departments and agencies, both federal and state, are authorized by statute to issue, and have issued, rules and regulations binding upon the oil and natural gas industry
88
and its individual members. The Federal Energy Regulatory Commission ("FERC") regulates the transportation and sale for resale of natural gas in interstate commerce pursuant to the Natural Gas Act of 1938 (the "NGA") and the Natural Gas Policy Act of 1978 (the "NGPA"). In 1989, however, Congress enacted the Natural Gas Wellhead Decontrol Act, which removed all remaining price and nonprice controls affecting wellhead sales of natural gas, effective January 1, 1993. While sales by producers of natural gas and all sales of crude oil, condensate and natural gas liquids can currently be made at uncontrolled market prices, Congress could reenact price controls in the future.
In addition, the Federal Trade Commission, the FERC and the CFTC hold statutory authority to monitor certain segments of the physical and futures energy commodities markets. These agencies have imposed broad regulations prohibiting fraud and manipulation of such markets. With regard to our physical sales of oil or other energy commodities, and any related hedging activities that we undertake, we are required to observe the market-related regulations enforced by these agencies, which hold substantial enforcement authority. Failure to comply with such regulations, as interpreted and enforced, could have a material adverse effect on our business, results of operations, and financial condition.
Regulation and Transportation of Natural Gas
Our sales of natural gas are affected by the availability, terms and cost of transportation. The rates and terms for access to pipeline transportation are subject to extensive regulation. In recent years, the FERC has undertaken various initiatives to increase competition within the natural gas industry. As a result of initiatives like FERC Order No. 636, issued in April 1992, the interstate natural gas transportation and marketing system has been substantially restructured to remove various barriers and practices that historically limited non-pipeline natural gas sellers, including producers, from effectively competing with interstate pipelines for sales to local distribution companies and large industrial and commercial customers. The most significant provisions of Order No. 636 require that interstate pipelines provide firm and interruptible transportation service on an open access basis that is equal for all natural gas supplies. The results of Order No. 636 and related initiatives have been to eliminate the interstate pipelines' traditional role of providing bundled sales service of natural gas and to require pipelines to offer unbundled storage, transportation, and sales services. The rates for such storage and transportation services are subject to FERC ratemaking authority, and FERC exercises its authority either by applying cost-of-service principles, allowing for the negotiation of rates where there is a cost-based alternative rate or granting market based rates in certain circumstances, typically with respect to storage services.
Similarly, natural gas pipelines may also be subject to state regulations which may change from time to time. Pipelines that operate only in a single state may be considered to be intrastate pipelines subject to regulation by state regulatory agencies with respect to safety, rates and/or terms and conditions of service, including requirements for ratable takes or non-discriminatory access to pipeline services. The basis for intrastate regulation and the degree of regulatory oversight and scrutiny given to intrastate pipelines varies from state to state. Many states operate on a complaint-based system and state commissions have generally not initiated investigations of the rates or practices of gas pipelines in the absence of a complaint.
The Outer Continental Shelf Lands Act (the "OCSLA") which was administered by the BOEMRE and, after October 1, 2011, its successors, the BOEM and the BSEE, and the FERC, requires that all pipelines operating on or across the OCS provide open access, non-discriminatory transportation service. One of the FERC's principal goals in carrying out OCSLA's mandate is to increase transparency in the market to provide producers and shippers working in the OCS with greater assurance of open access service on pipelines located on the OCS and non-discriminatory rates and conditions of service on such pipelines. On June 18, 2008, the BOEMRE's predecessor, the MMS, issued a final rule, effective August 18, 2008, that implements a hotline, alternative dispute resolution procedures, and complaint procedures for resolving claims of having been denied open and nondiscriminatory access to pipelines on the OCS.
89
The price at which we sell natural gas is not currently subject to federal rate regulation and, for the most part, is not subject to state regulation. However, with regard to our physical sales of these energy commodities, we are required to observe anti-market manipulation laws and related regulations enforced by the FERC and/or the CFTC and the Federal Trade Commission ("FTC"). Please read "—Other Federal Laws and Regulations Affecting Our Industry—Energy Policy Act of 2005" beginning on page 91 and "—FERC Market Transparency Rules" beginning on page 91.
Additional proposals and proceedings that might affect the natural gas industry are pending before Congress, the FERC, state commissions and the courts. The natural gas industry historically has been very heavily regulated. As a result, there is no assurance that the less stringent regulatory approach recently pursued by the FERC and Congress will continue.
While the changes by these federal and state regulators for the most part affect us only indirectly, they are intended to further enhance competition in natural gas markets. We cannot predict what further action the FERC, the BOEM, the BSEE or state regulators will take on these matters; however, we do not believe that any such action taken will affect us differently, in any material way, than other natural gas producers with which we compete.
Oil and Natural Gas Liquids Transportation Rates
Our sales of crude oil, condensate and natural gas liquids are not currently regulated and are transacted at market prices. In a number of instances, however, the ability to transport and sell such products is dependent on pipelines whose rates, terms and conditions of service are subject to FERC jurisdiction under the Interstate Commerce Act and the Energy Policy Act of 1992. The price we receive from the sale of oil and natural gas liquids is affected by the cost of transporting those products to market. Interstate transportation rates for oil, natural gas liquids, and other products are regulated by the FERC, and in general, these rates must be cost-based, although settlement rates and market-based rates may be permitted in certain circumstances. In addition, the FERC has established an indexing system for such transportation, which allows such pipelines to take an annual inflation-based rate increase.
In other instances involving intrastate-only transportation of oil, natural gas liquids, and other products, the ability to transport and sell such products is dependent on pipelines whose rates, terms and conditions of service are subject to regulation by state regulatory bodies under state statutes. Such pipelines may be subject to regulation by state regulatory agencies with respect to safety, rates and/or terms and conditions of service, including requirements for ratable takes or non-discriminatory access to pipeline services. The basis for intrastate regulation and the degree of regulatory oversight and scrutiny given to intrastate pipelines varies from state to state. Many states operate on a complaint-based system and state commissions have generally not initiated investigations of the rates or practices of liquids pipelines in the absence of a complaint.
Regulation of Oil and Natural Gas Exploration and Production
Our exploration and production operations are subject to various types of regulation at the federal, state and local levels. Such regulations include requiring permits, bonds and pollution liability insurance for the drilling of wells, regulating the location of wells, the method of drilling, casing, operating, plugging and abandoning wells, and governing the surface use and restoration of properties upon which wells are drilled. Many states also have statutes or regulations addressing conservation of oil and gas resources, including provisions for the unitization or pooling of oil and natural gas properties, the establishment of maximum rates of production from oil and natural gas wells and the regulation of spacing of such wells.
In 2010, there were numerous new and proposed regulations related to oil and gas exploration and production activities. Please read "Risk Factors" beginning on page 20 for more information. The
90
failure to comply with these rules and regulations can result in substantial penalties. Our competitors in the oil and natural gas industry are subject to the same regulatory requirements and restrictions that affect our operations.
Other Federal Laws and Regulations Affecting Our Industry
Energy Policy Act of 2005. On August 8, 2005, President Bush signed into law the Energy Policy Act of 2005 (the "EPAct 2005"). EPAct 2005 is a comprehensive compilation of tax incentives, authorized appropriations for grants and guaranteed loans, and significant changes to the statutory policy that affects all segments of the energy industry. Among other matters, EPAct 2005 amends the NGA to add an anti-manipulation provision which makes it unlawful for any entity to engage in prohibited behavior to be prescribed by FERC, and furthermore provides FERC with additional civil penalty authority. EPAct 2005 provides the FERC with the power to assess civil penalties of up to $1,000,000 per day for violations of the NGA and increases the FERC's civil penalty authority under the NGPA from $5,000 per violation per day to $1,000,000 per violation per day. The civil penalty provisions are applicable to entities that engage in the sale of natural gas for resale in interstate commerce. On January 19, 2006, FERC issued Order No. 670, a rule implementing the anti-manipulation provision of EPAct 2005, and subsequently denied rehearing. The rule makes it unlawful for any entity, directly or indirectly, in connection with the purchase or sale of natural gas subject to the jurisdiction of FERC, or the purchase or sale of transportation services subject to the jurisdiction of FERC, (1) to use or employ any device, scheme or artifice to defraud; (2) to make any untrue statement of material fact or omit to make any such statement necessary to make the statements made not misleading; or (3) to engage in any act, practice, or course of business that operates as a fraud or deceit upon any person. The new anti-manipulation rules do not apply to activities that relate only to intrastate or other non-jurisdictional sales or gathering, but do apply to activities of gas pipelines and storage companies that provide interstate services, such as Section 311 service, as well as otherwise non-jurisdictional entities to the extent the activities are conducted "in connection with" gas sales, purchases or transportation subject to FERC jurisdiction, which now includes the annual reporting requirements under Order No. 704. The anti-manipulation rules and enhanced civil penalty authority reflect an expansion of FERC's NGA enforcement authority. Should we fail to comply with all FERC administered statutes, rules, regulations, and orders that are applicable to us, we could be subject to substantial penalties and fines.
FERC Market Transparency Rules. On December 26, 2007, FERC issued a final rule on the annual natural gas transaction reporting requirements, as amended by subsequent orders on rehearing ("Order No. 704"). Under Order No. 704, wholesale buyers and sellers of more than 2.2 million MMBtu of physical natural gas in the previous calendar year, including interstate and intrastate natural gas pipelines, natural gas gatherers, natural gas processors, natural gas marketers and natural gas producers, are required to report, on May 1 of each year, aggregate volumes of natural gas purchased or sold at wholesale in the prior calendar year to the extent such transactions utilize, contribute to or may contribute to the formation of price indices. It is the responsibility of the reporting entity to determine which individual transactions should be reported based on the guidance of Order No. 704. Order No. 704 also requires market participants to indicate whether they report prices to any index publishers and, if so, whether their reporting complies with FERC's policy statement on price reporting.
Effective November 4, 2009, pursuant to the Energy Independence and Security Act of 2007, the FTC issued a rule prohibiting market manipulation in the petroleum industry. The FTC rule prohibits any person, directly or indirectly, in connection with the purchase or sale of crude oil, gasoline or petroleum distillates at wholesale from: (a) knowingly engaging in any act, practice or course of business, including the making of any untrue statement of material fact, that operates or would operate as a fraud or deceit upon any person; or (b) intentionally failing to state a material fact that under the circumstances renders a statement made by such person misleading, provided that such omission
91
distorts or is likely to distort market conditions for any such product. A violation of this rule may result in civil penalties of up to $1 million per day per violation, in addition to any applicable penalty under the Federal Trade Commission Act.
Additional proposals and proceedings that might affect the natural gas industry are pending before Congress, FERC and the courts. We cannot predict the ultimate impact of these or the above regulatory changes to our natural gas operations. We do not believe that we would be affected by any such action materially differently than similarly situated competitors.
Regulation of Offshore Oil and Natural Gas Exploration and Production
Most of our operations are conducted on federal oil and natural gas leases, which are administered by the BOEMRE, BOEM or BSEE pursuant to the OCSLA. The BOEMRE and its successors, the BOEM and the BSEE, regulate offshore operations, including engineering and construction specifications for production facilities, safety procedures, plugging and abandonment of wells on the Gulf of Mexico shelf, and removal of facilities. On January 19, 2011, the U.S. Department of the Interior announced that it would divide offshore oil and gas responsibilities among three separate agencies, with the reorganization to be completed in 2011. The Department of the Interior first created the Office of Natural Resources Revenue to manage revenue collection on October 1, 2010. Effective October 1, 2011, the remaining functions of BOEMRE were split into two federal bureaus, the BOEM, which handles offshore leasing, resource evaluation, review and administration of oil and gas exploration and development plans, renewable energy development, NEPA analysis and environmental studies, and the BSEE, which is responsible for the safety and enforcement functions of offshore oil and gas operations, including the development and enforcement of safety and environmental regulations, permitting of offshore exploration, development and production activities, inspections, offshore regulatory programs, oil spill response and newly formed training and environmental compliance programs. Consequently, after October 1, 2011, we will be required to interact with two newly formed federal bureaus to obtain approval of our exploration and development plans and issuance of drilling permits, which may result in added plan approval or drilling permit delays as the functions of the former BOEMRE are fully divested and implemented in the two federal bureaus. At this time, we cannot predict the impact that this reorganization, or future regulations of enforcement actions taken by the new agencies, may have on our operations. Our federal oil and natural gas leases are awarded based on competitive bidding and contain relatively standardized terms. These leases require compliance with detailed BOEMRE regulations and orders that are subject to interpretation and change by the BOEM or BSEE. The BOEMRE has promulgated other regulations governing the plugging and abandonment of wells located offshore and the installation and removal of all production facilities, structures and pipelines, and the BOEM or the BSEE may in the future amend these regulations. Please read "Risk Factors" beginning on page 20 for more information on new regulations.
To cover the various obligations of lessees on the OCS, the BOEMRE and its successors generally require that lessees have substantial net worth or post bonds or other acceptable assurances that such obligations will be satisfied. The cost of these bonds or assurances can be substantial and there is no assurance that they can be obtained in all cases. We are currently exempt from supplemental bonding requirements. As many regulations are being reviewed, we may be subject to supplemental bonding requirements in the future. Under some circumstances, the BOEM may require any of our operations on federal leases to be suspended or terminated. Any such suspension or termination could materially adversely affect our financial condition and results of operations.
Hurricanes in the Gulf of Mexico can have a significant impact on oil and gas operations on the OCS. The effects from past hurricanes have included structural damage to pipelines, wells, fixed production facilities, semi-submersibles and jack-up drilling rigs. The BOEMRE has been in the past, and the BOEM and the BSEE will be in the future, concerned about the loss of these facilities and rigs as well as the potential for catastrophic damage to key infrastructure and the resultant pollution from
92
future storms. In an effort to reduce the potential for future damage, the BOEMRE has periodically issued guidance aimed at improving platform survivability by taking into account environmental and oceanic conditions in the design of platforms and related structures. It is possible that similar, if not more stringent, requirements will be issued by the BOEM or the BSEE for future hurricane seasons. New requirements, if any, could increase our operating costs.
The Office of Natural Resources Revenue (the "ONRR") in the U.S. Department of the Interior administers the collection of royalties under the terms of the OCSLA and the oil and natural gas leases issued thereunder. The amount of royalties due is based upon the terms of the oil and natural gas leases as well as the regulations promulgated by the ONRR.
Environmental Regulation
As a lessee and operator of offshore oil and gas properties in the U.S. Gulf of Mexico, we are subject to stringent federal, regional, state and local environmental laws and regulations relating to the release or discharge of materials into the environment or otherwise relating to environmental protection. These laws and regulations, among other things, govern the issuance of permits to conduct exploration, drilling and producing operations, the amounts and types of materials that may be released into the environment, the discharge and disposal of waste materials, the remediation of contaminated sites and the reclamation and abandonment of wells, platforms and facilities. As with the industry generally, compliance with current and anticipated environmental laws and regulations increases our overall costs of business, including our capital costs to construct, maintain and upgrade equipment and facilities. Numerous governmental agencies, including the BOEMRE (formerly known as the MMS, which split into two separate federal bureaus, the BOEM and the BSEE, on October 1, 2011), the U.S. Coast Guard and the EPA issue regulations to implement and enforce such laws, which are often difficult and costly to comply with and which carry substantial civil and even criminal penalties for failure to comply.
Some laws and regulations relating to protection of the environment may, in certain circumstances, impose strict liability for environmental contamination, rendering a person liable for environmental damages and cleanup costs without regard to negligence or fault on the part of such person. Other laws and regulations may restrict the rate of oil and natural gas production below the rate that would otherwise exist or even prohibit exploration and production activities in environmentally sensitive areas. The regulatory burden on the oil and natural gas industry increases our cost of doing business and consequently affects our profitability. The remediation, reclamation and abandonment of wells, platforms and other facilities result in our incurring significant costs but these are considered a normal, recurring cost of operations for us as well as for similarly situated competitors. Environmental laws and regulations have been subject to frequent changes over the years and the imposition of more stringent requirements could have a material adverse effect upon our capital expenditures, earnings or competitive position, including the suspension or cessation of operations in affected areas. As such, there can be no assurance that material cost and liabilities will not be incurred in the future.
Following the April 2010 fire and explosion and subsequent release of oil from the Macondo well in the U.S. Gulf of Mexico, the MMS issued a moratorium on deepwater drilling activities in the U.S. Gulf of Mexico that was lifted on October 12, 2010 by the BOEMRE, and also implemented a series of environmental, technological and safety measures intended to improve offshore safety systems and environmental protection. Implementation of new BOEM or BSEE guidelines or regulations may subject us to increased costs or delays and may limit our operations in the U.S. Gulf of Mexico, which could have a material adverse effect on our results of operations and financial condition. For example, the BOEM is in the process of a comprehensive review of its application of the National Environmental Policy Act of 1969 ("NEPA") in reviewing drilling plans, lease sales and other drilling activities in the U.S. Gulf of Mexico, particularly the use of categorical exclusions under NEPA to preclude the requirement for or limit the scope of environmental assessments. Moreover, there have
93
been proposals by governmental and private constituencies to amend existing laws, regulations, guidance and policy that could affect our operations in the U.S. Gulf of Mexico and could cause us to incur substantial losses or expenditures, including increasing inspection requirements, increasing amounts of financial responsibility to conduct operations, and contemplation of an outright ban on drilling. Adoption of such proposals could have a material adverse effect on operations in the U.S. Gulf of Mexico by raising operating expenditures, increasing insurance premiums, delaying drilling operations and increasing regulatory costs.
The primary federal law for oil spill liability is the OPA which amends and augments oil spill provisions of the federal Water Pollution Control Act (the "Clean Water Act"). The OPA imposes certain duties and liabilities on "responsible parties" related to the prevention of oil spills and damages resulting from such spills in or threatening U.S. waters, including the Outer Continental Shelf (the "OCS") or adjoining shorelines. A liable "responsible party" includes the owner or operator of an onshore facility, vessel or pipeline that is a source of an oil discharge or that poses the substantial threat of discharge or, in the case of offshore facilities, the lessee or permittee of the area in which a discharging facility is located. The OPA assigns joint and several strict liability, without regard to fault, to each liable party for all containment and oil removal costs and a variety of public and private damages including, but not limited to, the costs of responding to a release of oil, natural resource damages, and economic damages suffered by persons adversely affected by an oil spill. Although defenses exist to the liability imposed by the OPA, they are limited. If an oil discharge or substantial threat of discharge were to occur, we may be liable for costs and damages, which costs and damages could be material to our results of operations and financial position.
The OPA also requires owners and operators of offshore oil production facilities to establish and maintain evidence of financial responsibility to cover costs that could be incurred in responding to an oil spill. The OPA currently requires a minimum financial responsibility demonstration of $35 million for companies operating on the OCS, although the Secretary of Interior may increase this amount up to $150 million in certain situations. As a result of the Macondo well incident, legislation was introduced, but not adopted, in last year's session of Congress to increase the minimum level of financial responsibility to $300 million or more. Whether similar legislation will be introduced and adopted in the current session or future sessions of Congress to amend the OPA to increase the minimum level of financial responsibility to $300 million is unknown, but if such legislation were to be ever adopted, we could experience difficulty in providing financial assurances sufficient to comply with this requirement. If we are unable to provide the level of financial assurance required by the OPA, we could be forced to sell our properties or operations located on the OCS or enter into partnerships with other companies that can meet the increased financial responsibility requirement, and any such developments could have an adverse effect on the value of our offshore assets and the results of our operations.
The Clean Water Act and analogous state laws prohibit the discharge of oil or hazardous substances in U.S. navigable waters or analogous state waters without a permit and impose strict liability in the form of penalties for unauthorized discharges. The regulations implementing the Clean Water Act require permits to be obtained by an operator before specified exploration activities occur. Spill prevention control and countermeasure requirements of federal laws and some state laws require containment to mitigate or prevent contamination of navigable waters in the event of an oil release. The OPA also requires covered facilities such as ours to develop and implement spill response plans intended to prepare the owner of the facility to respond to a hazardous substance or oil discharge. We maintain such plans, and where required have submitted plans and received federal and state approvals necessary to comply with the OPA, the Clean Water Act and related regulations. We are a member of Clean Gulf Associates, an industry sponsored organization that owns and operates spill response and clean up equipment. We contract with third party companies that provide qualified and trained personnel to operate the response equipment and to assist in spill mitigation. Additionally, we contract
94
with a third party company that provides an expert team of spill management professionals that make up the majority of our spill management team. Our senior management receives annual required training to fill the role of qualified individuals to assist in directing the spill management team and our operations personnel required for source control in the event of a non-permitted discharge or release.
The OCSLA authorizes regulations relating to safety and environmental protection applicable to lessees and permittees operating on the OCS. Included among these regulations are requirements mandating the preparation of spill contingency plans and the establishment of air quality standards for certain pollutants, including particulate matter, volatile organic compounds, sulfur dioxide, carbon monoxide and nitrogen oxides. Specific design and operational standards may apply to OCS vessels, rigs, platforms and structures. Violations of lease conditions or regulations related to the environment issued pursuant to OCSLA can result in substantial civil and criminal penalties, as well as potential court injunctions curtailing operations and canceling leases. Such enforcement liabilities can result from either governmental or citizen prosecution.
The Comprehensive Environmental Response, Compensation, and Liability Act ("CERCLA"), also known as the "Superfund" law, and analogous state laws impose liability without regard to fault or the legality of the original conduct, on certain classes of persons that are considered to be responsible for the release of a "hazardous substance" into the environment. These persons include the current or former owner or operator of the disposal site where the release occurred and companies that disposed or arranged for the disposal of hazardous substances released at the site. Under CERCLA, such persons are subject to joint and several strict liability for the cost of investigating and cleaning up hazardous substances that have been released into the environment, for damages to natural resources and for the cost of certain health studies. Additionally, it is not uncommon for neighboring landowners and other third parties to file claims for personal injury and property damage allegedly caused by hazardous substances or other pollutants released into the environment. We generate materials in the course of our operations that are regulated as hazardous substances.
We also may incur liability under the Resource Conservation and Recovery Act ("RCRA") and comparable state statutes, which impose requirements related to the generation, transportation, storage, treatment and disposal of solid and hazardous wastes and can require cleanup of hazardous waste disposal sites. While there exists an exclusion under RCRA from the definition of hazardous wastes for certain materials generated in the exploration, development or production of oil and natural gas, these wastes may be regulated by the EPA and state environmental agencies as non-hazardous solid wastes. Other wastes handled at exploration, development and production sites may not fall within this regulatory exclusion. Moreover, stricter standards for waste handling and disposal may be imposed on the oil and natural gas industry in the future. From time to time, legislation is proposed in Congress that would revoke or alter the current exclusion of exploration, development and production wastes from the RCRA definition of "hazardous wastes," thereby potentially subjecting such wastes to more stringent handling, disposal and cleanup requirements. In September 2010, the Natural Resources Defense Council filed a petition with the EPA, requesting them to reconsider the RCRA exemption for exploration, production and development wastes. To date, the EPA has not taken any action on the petition. If legislation is enacted or regulatory changes adopted that remove this RCRA exemption, it could have a significant impact on our operating costs as well as the oil and natural gas industry in general. The impact of future revisions to environmental laws and regulations cannot be predicted.
Our operations are also subject to the CAA and comparable state and local requirements. We may be required to incur certain capital expenditures in the future for air pollution control equipment in connection with obtaining and maintaining operating permits and approvals for air emissions. For example, on July 28, 2011, the EPA proposed four sets of new regulations which, if adopted, will impose more stringent standards for air emissions from oil and gas development and production operations which may require us to incur additional expenses to control air emissions from current operations and during new well developments by installing emissions control technologies and adhering
95
to a variety of work practice and other requirements. Any such requirements could increase the costs of development and production, though at this point, we cannot predict the final regulatory requirements or the cost to comply with such requirements. However, we believe our operations will not be materially adversely affected by any such requirements and the requirements are not expected to be any more burdensome to us than to other similarly situated companies involved in oil and natural gas exploration and production activities.
In December 2009, the EPA determined that emissions of carbon dioxide, methane and other "greenhouse gases" present an endangerment to public health and the environment because emissions of such gases are, according to the EPA, contributing to warming of the earth's atmosphere and other climatic changes. Based on these findings, the EPA has begun adopting and implementing regulations to restrict emissions of greenhouse gases under existing provisions of the CAA. The EPA has adopted rules regulating greenhouse gas emissions under the CAA, one of which requires a reduction in emissions of greenhouse gases from motor vehicles and another which regulates emissions of greenhouse gases from certain large stationary sources, effective January 2, 2011. The EPA has also adopted rules requiring the reporting of greenhouse gas emissions from specified large greenhouse gas emission sources in the United States, including petroleum refineries, on an annual basis, beginning in 2011 for emissions occurring after January 1, 2010, as well as certain onshore and offshore oil and natural gas production facilities, on an annual basis, beginning in 2012 for emissions occurring in 2011. We are not currently required to report under these rules, but if we are required to report in the future, we do not believe that our operations would be materially affected by any such requirements.
In addition, the U.S. Congress has from time to time considered adopting legislation to reduce emissions of greenhouse gases and almost one-half of the states have already taken legal measures to reduce emissions of greenhouse gases primarily through the planned development of greenhouse gas emission inventories and/or regional greenhouse gas cap and trade programs. Most of these cap and trade programs work by requiring major sources of emissions, such as electric power plants, or major producers of fuels, such as refineries and gas processing plants, to acquire and surrender emission allowances. The number of allowances available for purchase is reduced each year in an effort to achieve the overall greenhouse gas emission reduction goal. The adoption of legislation or regulatory programs to reduce emissions of greenhouse gases could require us to incur increased operating costs, such as costs to purchase and operate emissions control systems, to acquire emissions allowances or comply with new regulatory or reporting requirements. Any such legislation or regulatory programs could also increase the cost of consuming, and thereby reduce demand for, the oil and natural gas we produce. Consequently, legislation and regulatory programs to reduce emissions of greenhouse gases could have an adverse effect on our business, financial condition and results of operations. Finally, it should be noted that some scientists have concluded that increasing concentrations of greenhouse gases in the Earth's atmosphere may produce climate changes that have significant physical effects, such as increased frequency and severity of storms, droughts, and floods and other climatic events. If any such effects were to occur, they could have an adverse effect on our financial condition and results of operations in the U.S. Gulf of Mexico.
Certain flora and fauna that have officially been classified as "threatened" or "endangered" are protected by the Endangered Species Act. This law prohibits any activities that could "take" a protected plant or animal or reduce or degrade its habitat area. If endangered species are located in an area where we wish to conduct seismic surveys, development or abandonment operations, the work could be prohibited or delayed or expensive mitigation might be required.
Legal Proceedings
Although we may, from time to time, be involved in litigation and claims arising out of our operations in the normal course of business, we are not currently a party to any material legal
96
proceeding. In addition, we are not aware of any material legal or governmental proceedings against us, or contemplated to be brought against us.
Employees
As of December 31, 2011, we employed 148 people. Our future success will depend partially on our ability to attract, retain and motivate qualified personnel. We are not a party to any collective bargaining agreements and have not experienced any strikes or work stoppages. We consider our relations with our employees to be satisfactory. From time to time we utilize the services of independent contractors to perform various field and other services.
Offices
We currently lease approximately 74,000 square feet of office space in Houston, Texas at 1301 McKinney, Suite 900, where our principal offices are located. The lease for our principal Houston office expires on August 31, 2017. We believe that our facilities are adequate for our current operations and that additional leased space can be obtained if needed.
97
Directors, Executive Officers and Other Non-Executive Officers
The following table sets forth information regarding our directors, director nominees and executive officers as of January 10, 2012. There are no family relationships among any of our directors, director nominees or executive officers.
Name
|
Age | Title | ||
|---|---|---|---|---|
G.M. McCarroll |
52 | President, Chief Executive Officer and Chairman of the Board of Directors | ||
John Y. Jo |
53 | Senior Vice President, Acquisitions & Engineering | ||
Thomas R. Lamme |
44 | Senior Vice President and General Counsel | ||
Howard M. Tate |
43 | Senior Vice President, Chief Financial Officer and Secretary | ||
N. John Lancaster |
43 | Director | ||
Robert F. Fulton |
60 | Director Nominee | ||
Terence E. Hall |
66 | Director Nominee | ||
John P. Ryan |
60 | Director Nominee |
The following table sets forth information regarding other non-executive officers as of January 10, 2012.
Name
|
Age | Title | |||
|---|---|---|---|---|---|
James E. Brokmeyer |
59 | Vice President, Production | |||
Gary G. Janik, P.E. |
56 | Vice President, Exploitation and Development | |||
Carey J. Naquin |
54 | Vice President, Operations | |||
John H. Smith |
51 | Vice President, Land and Business Development | |||
William B. Swingle, CPA |
52 | Vice President and Chief Accounting Officer | |||
Set forth below is the description of the backgrounds of our directors, director nominees, executive officers and other non-executive officers.
G.M. McCarroll—President, Chief Executive Officer and Chairman of the Board of Directors. Mr. McCarroll is our founder and has been CEO since our formation in January 2008. Prior to our formation, Mr. McCarroll was President of Maritech Resources, Inc., a wholly owned subsidiary of TETRA Technologies, Inc. (NYSE: TTI) from September 2001 to October 2007. Prior to Maritech, Mr. McCarroll served as President of Augusta Petroleum Partners in Houston from 1998 to 2001. Mr. McCarroll was an original member of the Senior Management Team of Plains Resources, Inc. from 1988 to 1998, holding several management positions including Vice President of Land and Exploration. Early in his career he also held positions with Great Southern Oil and Gas in Lafayette, Louisiana and Amoco Production Company in New Orleans, Louisiana. Mr. McCarroll holds a Bachelor's Degree in Business Administration and Finance from Louisiana State University. He is an active member in numerous industry associations and currently serves on the Board of Directors of the National Ocean Industries Association. He is also a member of The Dean's Advisory Council of the E.J. Ourso College of Business at Louisiana State University.
As our founder, Mr. McCarroll is the principal driving force behind us and our success to date. Over the course of our history, Mr. McCarroll has successfully grown us through his leadership skills, operational expertise and business judgment and for this reason we believe Mr. McCarroll is a valuable asset to our board of directors and is the appropriate person to serve as Chairman of the Board.
John Y. Jo—Senior Vice President, Acquisitions & Engineering. Mr. Jo is our Senior Vice President, Acquisitions & Engineering, a position he has held since January 2008. Prior to joining us, he was
98
President and Chief Operating Officer of Turnkey E&P Corporation, a drilling services and E&P company, from December 2005 until January 2008. Prior to Turnkey E&P, Mr. Jo was Manager, Corporate Engineering with Forest Oil Corporation (NYSE: FST) from April 2004 to December 2005 after working at Apache Corporation (NYSE: APA) since July 1993 where he held various domestic and international positions including Engineering Director. Earlier in his career, Mr. Jo held positions with Hunt Petroleum Corporation including Manager of Acquisitions and Joint Operations. Mr. Jo holds a BS degree in Petroleum Engineering from the Colorado School of Mines. He is a registered Professional Engineer in the State of Texas and is a member of the Society of Petroleum Engineers. He served on various committees of industry organizations including President of the Petroleum Engineers Club of Dallas, Director and Treasurer of the SPE Dallas Section.
Thomas R. Lamme—Senior Vice President and General Counsel. Mr. Lamme is our Senior Vice President and General Counsel, a position he has held since June 2011. Mr. Lamme previously served as a senior partner at Thompson & Knight LLP, where he worked from August 1999 until June 2011. Prior to joining Thompson & Knight LLP, Mr. Lamme was an associate attorney at Brown, Parker & Leahy LLP from October 1996 until August 1999, when the firm merged with Thompson & Knight LLP. Prior to that, Mr. Lamme was employed as an accounting staff professional with Arthur Andersen LLP from September 1994 until October 1996. Mr. Lamme holds a Bachelor's of Arts degree from Dartmouth College and a J.D. from the University of Houston Law Center.
Howard M. Tate—Senior Vice President, Chief Financial Officer and Secretary. Mr. Tate is our Senior Vice President, Chief Financial Officer and Secretary, a position he has held since March 2008. Mr. Tate previously served as Vice President—Finance and Treasurer of Targa Resources, Inc. (which controlled the general partner of Targa Resources Partners, LP (NYSE: NGLS)) from September 2005 to March 2008. Prior to joining Targa, Mr. Tate served as Vice President of Finance and Capital Markets for Magnum Hunter Resources, Inc. from April 2002 until its acquisition by Cimarex Energy, Inc (NYSE: XEC) in June 2005. Early in his career, he held positions with Pride International, Inc., Tejas Gas Corporation and Tenneco, Inc. Mr. Tate holds an Accounting degree from Oklahoma State University and a Masters of Business Administration from the University of Houston.
James E. Brokmeyer—Vice President, Production. Mr. Brokmeyer is our Vice President, Production, a position he has held since March 2008. Prior to joining us, Mr. Brokmeyer held the position of VP—Production at SPN Resources from April 2004 to March 2008. Previously, he has held management positions with El Paso Production Company, Coastal Oil & Gas, British-Borneo Exploration, Inc. and Energy Development Corporation. Mr. Brokmeyer holds a petroleum engineering degree from Texas A&M University. He is a member of the Society of Petroleum Engineers and American Petroleum Institute.
N. John Lancaster—Director. Mr. Lancaster is currently a Partner and Managing Director of Riverstone, where he is responsible for managing investments across the energy industry, with a focus on oil services and exploration and production. Prior to joining Riverstone in 2000, Mr. Lancaster was a director with The Beacon Group, LLC., a privately held firm specializing in principal investing and strategic advisory services in the energy and other industries. Prior to joining Beacon, Mr. Lancaster was a Vice President with Credit Suisse First Boston's Natural Resources Group in Houston, Texas. Mr. Lancaster has served as a director of Cobalt International Energy, Inc. since 2010 and previously served as a director of Magellan Midstream Partners, L.P. from 2003 until 2007. He also currently serves as a director of several of Riverstone's private portfolio companies. Mr. Lancaster received his B.B.A. from the University of Texas at Austin and his M.B.A. from Harvard Business School.
Mr. Lancaster brings extensive business and financial expertise to our board of directors from his background in banking and private equity fund management. Mr. Lancaster also brings extensive prior board service experience to our board of directors from service on numerous other corporate boards and limited partnership advisory boards.
99
Robert F. Fulton—Director Nominee. Mr. Fulton will become a member of our board of directors concurrently with the listing of our common stock on the NYSE. Mr. Fulton also will serve as the chairman of our audit committee. He has served on the board of directors of Basic Energy Services, Inc. since August 2001 and currently is a member of Basic Energy Service's nominating and governance committee. He served as President and Chief Executive Officer of Frontier Drilling ASA, an offshore oil and gas drilling and production contractor, from September 2002 through July 2010. From December 2001 to August 2002, he managed personal investments. Prior to December 2001, he spent most of his business career in the energy service and contract drilling industry. He served as Executive Vice President and Chief Financial Officer of Merlin Offshore Holdings, Inc. from August 1999 until November 2001. From January 1998 to June 1999, Mr. Fulton served as Executive Vice President of Finance for R&B Falcon Corporation, during which time he closed the merger of Falcon Drilling Company with Reading & Bates Corporation to create R&B Falcon Corporation and then the merger of R&B Falcon Corporation with Cliffs Drilling Company. He graduated with a B.S. degree in Accountancy from the University of Illinois and an M.B.A. in finance from Northwestern University.
Mr. Fulton brings substantial experience to our board through his extensive work in the energy industry. We believe that Mr. Fulton's expertise in finance-related activities, thorough understanding of audit and accounting-related matters and experience with numerous energy companies as a senior financial officer in both the private and public sectors provides significant insight, value and perspective to the board of directors, our audit committee (as chairman and designated "financial expert") and us.
Terence E. Hall—Director Nominee. Mr. Hall will become a member of our board of directors concurrently with the listing of our common stock on the NYSE. Mr. Hall will also serve as a member of our audit committee. He has served as the Chairman of the Board and a Director of Superior Energy Services, Inc. since December 1995. From December 1995 to April 2010, he served as Superior's Chief Executive Officer, and from December 1995 until November 2004, he also served as its President. Mr. Hall also serves as a director of Whitney Holding Corp. Mr. Hall holds a B.S. and J.D. from Tulane University.
Mr. Hall's detailed knowledge of the industry in which we operate and his perspective regarding strategic and operational opportunities and challenges facing the oil and gas industry enable him to provide invaluable strategic advice and focus to our board, to our audit committee and to us.
John P. Ryan—Director Nominee. Mr. Ryan will become a member of our board of directors concurrently with the listing of our common stock on the NYSE. He served as President and Chief Executive Officer of Dresser, Inc. from April 2007 until it was acquired by GE in February 2011. From December 2004 to April 2007, he served as Dresser, Inc.'s President and Chief Operating Officer and in various other management positions at the company from February 1976 to December 2004. Mr. Ryan has served as a board member of Hudson Products, Inc. since January 2010, Flex Energy Inc. since October 2011 and The World Affairs Council of Dallas/Ft. Worth since January 2009. Mr. Ryan holds a B.A. in Psychology from Villanova University.
Mr. Ryan brings to our board extensive executive and managerial experience and competency in developing and executing corporate strategies from his background in the global energy industry. Through his prior board memberships and executive role at Dresser, Inc., including and since its sale to General Electric, Mr. Ryan provides our board with a proven ability to interface with shareholders, private equity sponsors and members of the management team.
Gary G. Janik, P.E.—Vice President, Exploitation and Development. Mr. Janik is our Vice President, Exploitation and Development, a position he has held since March 2008. Prior to joining us, Mr. Janik held the positions of Manager and VP—Acquisitions and Reserves at SPN Resources from February 2004 to March 2008. Previously, he served as Director of Oil and Gas Property Management with Duke Energy Hydrocarbons from July 2000 to August 2003. He has also served as Manager of
100
Reserves at Enron Oil & Gas, as well as held other engineering positions with Enron Oil & Gas Company, NP Energy Corporation and Amoco Production Company. Mr. Janik holds a degree in Chemical Engineering from Texas A&M University. He is a registered Professional Engineer and a member of the Society of Petroleum Engineers and the American Petroleum Institute.
Carey J. Naquin—Vice President, Operations. Mr. Naquin is our Vice President, Operations, a position he has held since March 2008. Prior to joining us, Mr. Naquin held the position of VP—Operations at SPN Resources from March 2005 to March 2008. Previously, he served as Senior Managing Consultant for Landmark and in various management and senior engineering positions for Halliburton from May 1995 to March 2005. Prior to Halliburton, he was employed in similar positions related to exploration and development for Placid Oil Company. Mr. Naquin holds a Petroleum Engineering degree from Louisiana State University. He is a member of the American Association of Drilling Engineers and Society of Petroleum Engineers.
John H. Smith—Vice President, Land and Business Development. Mr. Smith is our Vice President, Land and Business Development, a position he has held since June 2009. Prior to joining us, Mr. Smith held the position of Negotiations and Business Manager for Australia and Southeast Asia for Hess Corporation from September 2007 to June 2009. Prior to this role, Mr. Smith held numerous positions within Land and Business Development at Hess Corporation during his 26-year career there. Mr. Smith holds a BS in Business Administration from Oklahoma State University. He is a member of the Association of International Petroleum Negotiators, Independent Petroleum Association of America, and American Association of Professional Landmen.
William B. Swingle, CPA—Vice President and Chief Accounting Officer. Mr. Swingle is our Vice President and Chief Accounting Officer, a position he has held since January 2012. Mr. Swingle is responsible for all of our accounting and financial reporting functions. From December 2009 to December 2011, Mr. Swingle served as our Vice President, Accounting. Prior to joining us, he was Senior Director—Financial Reporting of Targa Resources, Inc. from December 2004 to November 2009; Assistant Controller/Accounting Manager—Financial Reporting of Plains Exploration and Production Company from July 2001 to December 2004; Controller of DA Consulting Group from August 2000 to June 2001 and held various financial management positions with PetroCorp Incorporated from May 1985 to December 1999. Mr. Swingle holds a degree in Accounting from the University of Houston. He also has a CPA license in the State of Texas.
Board of Directors
Our board of directors currently consists of two members, G.M. McCarroll, our Chief Executive Officer, and N. John Lancaster, a designee of the Riverstone/Carlyle Funds, which we expect will control a majority of the voting power of our outstanding common stock following this offering. Robert F. Fulton, Terence E. Hall and John P. Ryan will become members of our board of directors concurrent with the listing of our common stock on the NYSE. Mr. Ryan is designated by the Riverstone/Carlyle Funds. We anticipate that our board will determine each of Mr. Fulton and Mr. Hall are independent under the independence standards of the NYSE.
Pursuant to the Stockholders Agreement that we expect to enter into with the Riverstone/Carlyle Funds and certain other stockholders, the Riverstone/Carlyle Funds will have the ability to nominate three directors to our board initially, subject to reduction as their level of ownership decreases. Two of these nominees will initially be Mr. Lancaster and Mr. Ryan. The Riverstone/Carlyle Funds have not yet informed us as to their other nominee. As a result, our board may initially consist of five directors. Please read "Certain Relationships and Related Party Transactions—Stockholders Agreement" on page 126.
101
In addition to Mr. Fulton and Mr. Hall, we intend to appoint at least one additional independent director (who will not be a Riverstone/Carlyle Funds designee) to our board of directors following the completion of this offering to meet the NYSE's phase-in requirements for the composition of the audit committee following an initial public offering (i.e., a third independent member within one year). Therefore, we anticipate that within one year from the date of the offering, our board will consist of seven members, three of which will be designated by the Riverstone/Carlyle Funds.
We expect that our board will review the independence of our current directors using the independence standards of the NYSE.
In evaluating director candidates, we will assess whether a candidate possesses the integrity, judgment, knowledge, experience, skills and expertise that are likely to enhance the board's ability to manage and direct the affairs and business of the company, including, when applicable, to enhance the ability of committees of the board to fulfill their duties. We currently are in the process of identifying individuals who meet these standards and the relevant independence requirements.
Following the completion of this offering, our directors will be divided into three classes serving staggered three-year terms. Class I, Class II and Class III directors will serve until our annual meetings of stockholders in 2013, 2014 and 2015, respectively. We anticipate that Mr. Fulton will be assigned to Class I, Messrs. Hall and Ryan will be assigned to Class II and Messrs. McCarroll and Lancaster will be assigned to Class III. At each annual meeting of stockholders held after the initial classification, directors will be elected to succeed the class of directors whose terms have expired. This classification of our board of directors could have the effect of increasing the length of time necessary to change the composition of a majority of the board of directors. In general, at least two annual meetings of stockholders will be necessary for stockholders to effect a change in a majority of the members of the board of directors.
Status as a "Controlled Company"
Because the Riverstone/Carlyle Funds and our other equity owners that will be party to the stockholders agreement will own a majority of our outstanding common stock following the completion of this offering, we expect to be a "controlled company" under NYSE corporate governance standards. A controlled company need not comply with NYSE corporate governance rules that require its board of directors to have a majority of independent directors and independent compensation and nominating and corporate governance committees. We intend to avail ourselves of the controlled company exception under the NYSE corporate governance standards. Notwithstanding our status as a controlled company, we will remain subject to the NYSE corporate governance standard that requires us to have an audit committee composed entirely of independent directors. As a result, we must have at least one independent director on our audit committee by the date our common stock is listed on the NYSE, at least two independent directors within 90 days of the listing date and at least three independent directors within one year of the listing date. In connection with the completion of this offering, we expect that Mr. Fulton will become the chairman and Mr. Hall will be a member of the audit committee.
Once we cease to be a controlled company, our board of directors will be required to have a compensation committee and a nominating and governance committee, each with at least one independent director. Within 90 days of ceasing to be a controlled company, we will be required to have each of a compensation committee and a nominating and governance committee with a majority of independent directors, and within one year of ceasing to be a controlled company, a majority of our board of directors must be comprised of independent directors.
102
Committees of the Board of Directors
Upon the conclusion of this offering, we intend to have an audit committee, and in the event we are no longer a controlled company, a compensation committee and nominating and governance committee, of our board of directors, and may have such other committees as the board of directors shall determine from time to time. We anticipate that each of the standing committees of the board of directors will have the composition and responsibilities described below.
Audit Committee
We will establish an audit committee prior to completion of this offering. We anticipate that the audit committee will consist of three directors, each of whom will be independent under the rules of the SEC following the end of the NYSE's phase-in period. As required by the rules of the SEC and listing standards of the NYSE, the audit committee will consist solely of independent directors. SEC rules also require that a public company disclose whether or not its audit committee has an "audit committee financial expert" as a member. An "audit committee financial expert" is defined as a person who, based on his or her experience, possesses the attributes outlined in such rules. In connection with the completion of this offering, we expect that Mr. Fulton will become the chairman of the audit committee and Mr. Hall will serve as a member. In addition, we expect that our board will determine that Mr. Fulton is an "audit committee financial expert" as defined in the SEC rules.
This committee will oversee, review, act on and report on various auditing and accounting matters to our board of directors, including: the selection of our independent accountants, the scope of our annual audits, fees to be paid to the independent accountants, the performance of our independent accountants and our accounting practices. In addition, the audit committee will oversee our compliance programs relating to legal and regulatory requirements. Upon formation of the audit committee, we expect to adopt an audit committee charter defining the committee's primary duties in a manner consistent with the rules of the SEC and applicable stock exchange or market standards.
Compensation Committee
Because we will be a "controlled company" within the meaning of the NYSE corporate governance standards, we will not be required to, and will not, have a compensation committee.
If and when we are no longer a controlled company, we will be required to establish a compensation committee. We anticipate that the compensation committee will consist of three directors, each of whom will be "independent" under the rules of the SEC. As required by the rules of the SEC and listing standards of the NYSE, a majority of the compensation committee will be independent directors. This committee will establish salaries, incentives and other forms of compensation for officers and other employees. Our compensation committee will also administer our incentive compensation and benefit plans. Upon formation of the compensation committee, we expect to adopt a compensation committee charter defining the committee's primary duties in a manner consistent with the rules of the SEC and applicable stock exchange or market standards.
Nominating and Corporate Governance Committee
Because we will be a "controlled company" within the meaning of the NYSE corporate governance standards, we will not be required to, and will not, have a nominating and corporate governance committee. While we are a controlled company, our board of directors will identify and evaluate potential candidates for nomination as a director and recommend any such candidates to our board of directors.
If and when we are no longer a controlled company, we will be required to establish a nominating and corporate governance committee. We anticipate that the nominating and corporate governance
103
committee will consist of three directors. As required by the rules of the SEC and listing standards of the NYSE, the nominating and corporate governance committee will consist of a majority of independent directors. This committee will identify, evaluate and recommend qualified nominees to serve on our board of directors, develop and oversee our internal corporate governance processes and maintain a management succession plan. Upon formation of the nominating and corporate governance committee, we expect to adopt a nominating and corporate governance committee charter defining the committee's primary duties in a manner consistent with the rules of the SEC and applicable stock exchange or market standards.
Compensation Committee Interlocks and Insider Participation
Because we will be a "controlled company" within the meaning of the NYSE corporate governance standards, we will not be required to, and will not, have a compensation committee. None of our executive officers serve on the board of directors or compensation committee of a company that has an executive officer that serves on our board or compensation committee. No member of our board is an executive officer of a company in which one of our executive officers serves as a member of the board of directors or compensation committee of that company.
Code of Business Conduct and Ethics
Prior to the completion of this offering, our board of directors will adopt a code of business conduct and ethics applicable to our employees, directors and officers, in accordance with applicable U.S. federal securities laws and the corporate governance rules of the NYSE. Any waiver of this code may be made only by our board of directors and will be promptly disclosed as required by applicable U.S. federal securities laws and the corporate governance rules of the NYSE.
Corporate Governance Guidelines
Prior to the completion of this offering, our board of directors will adopt corporate governance guidelines in accordance with the corporate governance rules of the NYSE.
104
COMPENSATION DISCUSSION AND ANALYSIS
Overview of Executive Compensation
As a private company, our compensation arrangements with our executive officers have been determined on an individual basis, based on negotiations between the individual and our chief executive officer (our "CEO"), in consultation with Riverstone. Our CEO negotiated his own compensation directly with Riverstone in connection with the Riverstone/Carlyle Funds' initial equity commitment in us. All of our executive officers have entered into employment agreements, which will be amended and restated in connection with the closing of this offering.
Historically, we have operated as a limited partnership. As a limited partnership, our operations are managed by our general partner and all of our employees, including our executive officers, are employed by our general partner. When we refer to "our employees," "our executive officers" or "our board," or make similar statements, we are referring to individuals who are employed by or serve our general partner on our behalf. When we refer to our "named executive officers" within this "Compensation Discussion and Analysis" for the 2011 fiscal year, we are referring to: (1) G.M. McCarroll, our CEO, President and Chairman of the Board; (2) Howard M. Tate, our Senior Vice President, Chief Financial Officer and Secretary; (3) John Y. Jo, our Senior Vice President, Acquisitions & Engineering; and (4) Thomas R. Lamme, our Senior Vice President and General Counsel. Messrs. McCarroll, Tate, Jo and Lamme were our only executive officers during the year ended December 31, 2011. Following our merger with and into Dynamic Offshore Resources, Inc., our employees, including our executive officers, will become employees of the corporation.
Although we have not historically had a formal compensation committee, our CEO and one of the managing directors of Riverstone, N. John Lancaster, currently operate as an informal compensation committee of our board. In 2011, we, through our informal compensation committee, began the process of analyzing our executive compensation program with the goal of modifying it to be more suitable for a public company. Going forward, we believe that our executive compensation program will help us attract, motivate and retain key executives and reward executives for creating and improving the value of our company. To aid in this process, in 2011, we engaged Longnecker & Associates ("Longnecker"), a nationally recognized compensation consulting firm with experience in assisting similar companies that own and operate upstream oil and natural gas assets, including properties in the Gulf of Mexico. We are working with Longnecker to refine our executive compensation programs to ensure (i) that our executive total direct compensation is in line with total direct compensation among our peer group and (ii) that our overall compensation aligns our executives' interests with those of our stockholders by tying a meaningful portion of each executive's cash and equity compensation to the achievement of performance targets and by including time-based vesting requirements in our long-term equity grants.
Following the completion of this offering, we expect to be a "controlled company" within the meaning of the NYSE listing rules. If we are a controlled company, we will not be required to have a compensation committee composed entirely of independent directors. If we do not form a formal compensation committee comprised entirely of independent directors, we intend to continue to rely on our informal compensation committee process. Future independent directors that we add to our board may be included in this process.
If we cease to be a controlled company, our board of directors will be required to have a compensation committee with at least one independent director. Within 90 days of ceasing to be a controlled company, we will be required to have a compensation committee with a majority of independent directors, and within one year of ceasing to be a controlled company, our compensation committee would have to be composed of entirely independent directors.
105
Goals of the Compensation Program
We are focused on establishing an executive compensation program that is intended to attract, motivate, and retain key executives and to reward executives for creating and increasing the value of our company. In meeting those objectives, we intend to use peer group total direct compensation data to develop a general targeted range for our executive compensation. To that end, we worked closely with Longnecker to identify an appropriate peer group of similarly situated U.S.-based oil and natural gas exploration and production companies using factors such as revenues, asset book value, EBITDA, and assumed market value and including our direct competitors with whom we compete for employees and management personnel. As a result of that collaborative analysis, we have identified the following companies as an appropriate peer group:
| Cobalt International, Inc. | Eagle Rock Energy Partners, L.P. | W&T Offshore | ||
Berry Petroleum |
Stone Energy Corporation |
Energy XXI Limited |
||
ATP Oil & Gas Corporation |
Swift Energy Company |
McMoRan Exploration Co. |
||
Comstock Resources, Inc. |
Rosetta Resources Inc. |
Venoco, Inc. |
||
Energy Partners, Ltd. |
Petroquest Energy, Inc. |
Goodrich Petroleum Corporation |
||
Carrizo Oil & Gas, Inc. |
Oasis Petroleum Inc. |
Endeavour International Corporation |
Longnecker prepared a compensation study in 2011, utilizing published survey information and publicly filed proxy statements of our peer group companies to assist us in developing the general range of targeted overall total direct compensation. The compensation data included a breakdown of compensation amounts in the 25th, 50th, and 75th percentiles for our peer group. Our executive officers' combined base salary and bonus (other than the CEO) paid in 2010 (the year reflected in the study) generally fell below the market 50th percentile, and our CEO's combined base salary and bonus paid in 2010 is at the market 25th percentile. We anticipate that our executives' 2011 base salary and bonus levels will fall within these same percentiles. We are in the process of determining an appropriate compensation philosophy and the appropriate targeted range for our executive compensation going forward. The Longnecker study provided reflective pay data for companies with average revenues of approximately $425 million that maintain areas of oil and gas operations which are similar to our business strategies and against whom we compete for executive talent.
Although we intend to rely most heavily on the peer group data, we also reviewed additional information to gain a sense of total direct compensation trends in the broader public company market. In 2011, we reviewed additional compensation data provided by Longnecker for individuals holding positions similar to our executive officers obtained from compensation survey sources and proxy statements. Survey data presented were collected from a combination of industry-specific and general industry sources, including: 2011 Economic Research Institute Executive Compensation Assessor, 2011 US Mercer MTCS for the Energy Sector, World at Work's 2010/2011 Total Salary Increase Budget Survey, 2010 ECI Oil & Gas E&P Industry Compensation Survey and 2010/2011 Towers Watson Top Management Compensation. Longnecker will prepare an updated survey for us during the 2012 year covering overall total direct compensation within our industry for the fiscal year ended December 31, 2011.
Components of Our Executive Compensation Program
Our executive compensation program currently has the following three principal elements: base salary, cash bonuses and equity. Each component is set forth in each executive officer's employment
106
agreement and restricted unit grant agreement (the Class B Units described below). We believe this mix of compensation appropriately aligns our executives' compensation with our short term and long term goals. The employment agreements we maintain with our named executive officers govern essentially all terms of compensation outside of the equity-based compensation awards that the executives may receive, and we feel that these agreements are beneficial to both the executive and the company in that all expectations and obligations of both parties are clearly set forth.
Below is a description of each of the principal elements of our current compensation program and our current view on these elements going forward. We recognize that as the structure of our compensation committee (either formal or informal) changes, the goals themselves and the methods of implementing those goals may change.
Base Salary
2011. Each named executive officer's base salary is a fixed component of compensation for each year and does not vary in a given year depending on the level of performance achieved. As described above, our executive officers' base salaries were originally set pursuant to negotiations with our CEO, in consultation with Riverstone (or, in the case of our CEO, directly with Riverstone) based on prevailing average market salaries for professionals in the oil and natural gas industry, as published in the most recent ECI Oil & Gas E&P Industry Compensation Survey, and based on the respective named executive officer's experience and knowledge in the industry. The original base salary levels were minimums subject to increase by our board of directors based on our growth and individual performance by the executive. Since it was originally determined, our CEO's base salary has been increased by approximately 30% as a reward for growing the company and demonstrating a strong ability to lead a successful management team. For 2011, base salaries for our named executive officers were set by our board as follows: Mr. McCarroll—$400,000; Mr. Tate—$245,000; Mr. Jo—$255,000; and Mr. Lamme—$300,000. In November 2010, in connection with our normal salary review process, the base salaries for Messrs. Tate and Jo were increased from $220,000 and $245,000, respectively, to reflect a more appropriate level of base salary for those executive officers but no changes were made to salaries during the 2011 year.
2012 and going forward. For 2012 and subsequent years, we are analyzing the appropriateness of all of our executive officers' base salaries in light of the targeted range of base salaries from our peer group, both on a standalone basis and as a component of total direct compensation. As a result of that analysis, our board determined that certain of our named executive officers' salaries for 2012 should be increased in connection with this offering as follows: Mr. McCarroll—$600,000; Mr. Tate—$295,000; and Mr. Jo—$285,000. In the future, we expect to review base salaries on an annual basis to determine if the company's financial and operational performance and the executive officer's personal performance (both individually and as a leader of his respective team) support any adjustment to base salary. We expect that each executive officer's employment agreement will set forth the initial determination as a minimum base salary; for more information about the amended and restated employment agreements that we intend to enter into with our named executive officers, please read "—Actions To Be Taken Following the 2011 Fiscal Year" beginning on page 114. We anticipate that a formal compensation committee, if constituted, would continue similar analyses with respect to base salary.
Cash Bonus
General. Each executive officer's (other than our CEO's, which is set at the discretion of the board) current employment agreement sets a general targeted bonus opportunity expressed as a percentage of base salary; for Messrs. Tate and Jo, the target annual bonus will be set by our board of directors on an annual basis in the target range of 60-75%. For Mr. Lamme, the target is 60%. Each named executive officer's employment agreement requires us to make his bonus payment, if any, no
107
earlier than January 1st, but no later than March 15th, of the year following the year to which the bonus relates. Messrs. Tate, Jo and Lamme's employment agreements requires them to remain employed with us until the last day of the calendar year to which the bonus relates, and Mr. McCarroll's agreement requires him to remain employed with us until January 1 of the calendar year following the applicable year with respect to which the bonus relates, in order to be eligible to receive a bonus. In general, our board has discretion to decide whether the executive bonuses will be subject to any particular performance criteria.
2010. For 2010, our board determined that it would be appropriate to review our company's annual performance (such as our actual adjusted EBITDA and cash flow performance) as compared to budgeted and anticipated amounts, as well as each executive officer's individual performance, in determining whether bonuses were warranted for the executive officers. During 2010, the company performed in excess of 85% of our budgeted plan performance, and while our board did not set or communicate to any officer any particular company performance metrics, our board felt that any bonuses actually paid at the end of the year should take into account the company's performance in a variety of areas. With respect to individual performance, our CEO provided our board with a qualitative assessment of each executive officer's performance during the 2010 year. Our CEO's performance and associated bonus was determined entirely in the board's discretion, although the board reviewed both company performance and individual actions for our CEO, as it did for our other executive officers. Our board believes that this process of largely analyzing qualitative standards provides an incentive to the executive officers to maximize our overall performance rather than requiring the executives to focus solely on one particular or decisive factor. The primary qualitative items discussed for each of the three named executive officers for 2010 included effective leadership, communication to team members, and dedication to performing his duties. Because the bonus amounts are generally limited by the range set forth in the employment agreements and are determined at the board's discretion, we believe that we have historically created a cooperative atmosphere among the executive officers.
We believe it is important that our board, or the compensation committee, as the case may be, maintain ultimate discretion in assessing our CEO's individual performance. We expect that our CEO will maintain ultimate discretion in assessing the individual performances of our other executive officers. Our board, or the compensation committee, as the case may be, will maintain ultimate discretion in determining whether our corporate financial or operational goals have been met in a satisfactory manner to warrant paying cash bonuses and, if applicable, the amount of such cash bonuses.
For 2010, our board authorized the payment of cash bonuses (which were paid in 2011) to each of our executive officers; for Messrs. Tate and Jo, the bonuses were authorized within the named executive officer's target bonus amount set forth in his employment agreement. As described above, the bonus generally consisted of our board's determination of performance in two areas: performance of the company during 2010 as compared to our budgeted plan and individual performance. Each component could earn the executive up to 50% of the bonus amount that our board determined to pay in the aggregate. Based on its analysis of our performance in 2010 and based on recommendations of our CEO on individual performances of each executive (or, in the case of our CEO, our board's evaluation of his performance), our board authorized cash bonuses for our named executive officers as follows:
- •
- Mr. McCarroll—$400,000, or 100% of base salary;
- •
- Mr. Tate—$155,000, or 70% of base salary; and
- •
- Mr. Jo—$175,000, or 71% of base salary.
2011. Our board has not met to consider bonuses for the fiscal year ending December 31, 2011. We anticipate that our board will follow the same process for 2011 as described above for 2010.
108
2012 and going forward. For 2012 and subsequent years, we intend to continue to provide annual incentive cash bonuses to reward achievement of financial or operational goals so that total direct compensation more accurately reflects actual company and individual performance. We expect that any formal compensation committee of our board would continue this policy. We are reviewing information prepared by Longnecker to determine the appropriate types of goals to be used in determining cash bonuses to align our executive officers' compensation with the performance of the company as a whole. We expect that specific details regarding each executive's future bonus potential will be set forth in the amended and restated employment agreements that are described in greater detail below.
Long-Term Incentives
As a private limited partnership, we historically have offered long-term incentives to our executive officers through grants of Class B Units in Dynamic Offshore Holding, LP ("DOH"). These Class B Units represent an interest in the future profits of DOH and are intended to be treated as "profits interests" for federal income tax purposes rather than capital interests. Profits interests have no value for tax purposes on the date of grant, but instead are designed to gain value only after DOH has realized a certain return hurdle, defined in the DOH partnership agreement as the amount of aggregate capital contributions plus a preferred rate of return on the capital contributions. Generally, this means that DOH distributions will first be made to "Class A Unit" holders until such holders have received a full return on their capital contributions to DOH. Second, distributions will be divided between the Class A Unit and Class B Unit holders, with the Class B Unit holders receiving an individual sharing percentage of 20% of the total distribution.
The Class B Units are subject to both time-vesting requirements as well as the return hurdle requirement, which we believe provides an incentive for our named executive officers to grow the value of our company. Each unit will vest in equal installments annually over a four year period, although vesting will be immediately accelerated upon a DOH change in control or liquidity event (which is described in more detail within the "Potential Payments Upon Termination or a Change in Control" section below). If a Class B Unit holder terminates his or her employment prior to vesting, the unit will be forfeited. The actual number of Class B Units held by our named executive officers and the associated vesting schedules are described in the "Outstanding Equity Awards at 2011 Fiscal Year-End" table below.
As part of our corporate reorganization in connection with this offering, DOH will be merged into Dynamic Offshore Resources, Inc., and the Class B Units will be converted into the right to receive common stock at a conversion rate to be determined based on the offering price of our common stock to the public. All of the Class B Units also will fully vest upon the completion of this offering. Please read "Corporate Reorganization" beginning on page 131.
To create incentives for our executive officers to continue to grow our company, we are in the process of evaluating a formal long-term incentive plan. We intend to adopt the formal plan in connection with the completion of this offering. The material terms of the plan that we intend to adopt are described below. We believe that having an equity component to our compensation program is vital to align our executive officers' interests with our stockholders' interests through shared ownership. Longnecker will help us design the long-term incentive plan by providing a survey of the main components of long-term incentive plans for similarly-situated public companies.
2012 Long Term Incentive Plan
Our board of directors intends to adopt a 2012 Long Term Incentive Plan (the "LTIP") to be effective prior to the consummation of this offering, in order to attract and retain the best personnel for positions of substantial responsibility, to provide additional incentives to our employees, directors and consultants, and to promote the success of our business. The LTIP will provide for grants of
109
(a) incentive stock options qualified as such under the Code, (b) nonqualified stock options that do not qualify as incentive stock options, (c) stock appreciation rights ("SARs"), (d) restricted stock awards, (e) restricted stock units, (f) performance awards, (g) stock awards, (h) other incentive awards, or (i) any combination of such awards.
The LTIP is not subject to the Employee Retirement Income Security Act of 1974, as amended ("ERISA"). The LTIP, for a limited period of time following this offering, will qualify for an exception to the deductibility limitations imposed by Section 162(m) of the Code. As a result, during that limited period of time, certain awards will be exempt from the limitations on the deductibility of compensation that exceeds $1,000,000.
Shares Available. The maximum aggregate number of shares of our common stock that may be reserved and available for delivery in connection with awards under the LTIP is 11,500,000, subject to adjustment in accordance with the terms of the LTIP. This number includes 743,831 shares of our common stock to be granted in connection with this offering to the former bonus pool participants at DOH (none of whom is an executive officer). If common stock subject to any award is not issued or transferred, or ceases to be issuable or transferable for any reason, including stock subject to an award that is cancelled, forfeited or settled in cash, those shares of common stock will again be available for delivery under the LTIP to the extent allowable by law. Except for adjustments made in accordance with the terms of the LTIP, no award may be repriced, replaced, regranted through cancellation or modified without shareholder approval, if the effect would be to reduce the exercise price for the shares underlying such award, and the Plan Administrator may not cancel an outstanding option that is under water for the purpose of granting a replacement award of a different type. The maximum number of shares of common stock that may be subject to stock options and SARs granted under the LTIP to any one participant during a fiscal year is 3,450,000 shares. The maximum aggregate number of shares that may be issued under the LTIP through incentive stock options is 11,500,000 shares.
Eligibility. Any individual who provides services to us or our affiliates, including officers, employees, non-employee directors and consultants, is eligible to participate in the LTIP (each, an "Eligible Person"). Each Eligible Person who is designated by the board of directors (or a committee thereof performing the functions of a compensation committee) (the "Plan Administrator") to receive an award under the LTIP will be a "Participant." An Eligible Person will be eligible to receive an award pursuant to the terms of the LTIP and subject to any limitations imposed by appropriate action of the Plan Administrator.
Administration. The Plan Administrator will administer the LTIP pursuant to its terms, except in the event our board of directors chooses to take action under the LTIP. Unless otherwise limited by our board of directors, the Plan Administrator has broad discretion to administer the LTIP, including the power to determine to whom and when awards will be granted, to determine the amount of such awards (measured in cash, shares of common stock or as otherwise designated), to prescribe and interpret the terms and provisions of each award agreement, to accelerate the exercise terms of any award, to delegate duties under the LTIP and to execute all other responsibilities permitted or required under the LTIP.
Terms of Options. The Plan Administrator may grant options to Eligible Persons including (a) incentive stock options (only to our employees) that comply with Section 422 of the Code and (b) nonqualified stock options. The exercise price for an option must not be less than the greater of (a) the par value per share of common stock or (b) the fair market value per share as of the date of grant. Options may be exercised as the Plan Administrator determines, but not later than ten years from the date of grant. Any incentive stock option granted to an employee who possesses more than 10% of the total combined voting power of all classes of our shares within the meaning of Section 422(b)(6) of the Code must have an exercise price of at least 110% of the fair market value of
110
the underlying shares at the time the option is granted and may not be exercised later than five years from the date of grant.
Terms of SARs. SARs may be awarded in connection with or separate from an option. A SAR is the right to receive an amount equal to the excess of the fair market value of one share of our common stock on the date of exercise over the grant price of the SAR. The grant price of a SAR must be at least equal to the fair market value of a share of our common stock on the date of the grant. SARs will be exercisable as the Plan Administrator determines. The term of a SAR will be for a period determined by the Plan Administrator but will not exceed ten years. SARs may be paid in cash, common stock or a combination of cash and stock, as provided for by the Plan Administrator in the award agreement.
Restricted Stock Awards. A restricted stock award is a grant of shares of common stock subject to a risk of forfeiture, restrictions on transferability, and any other restrictions imposed by the Plan Administrator in its discretion. Except as otherwise provided under the terms of the LTIP or an award agreement, the holder of a restricted stock award may have rights as a stockholder, including the right to vote or to receive dividends (subject to any mandatory reinvestment or other requirements imposed by the Plan Administrator). A restricted stock award that is subject to forfeiture restrictions may be forfeited upon termination of employment or service. Common stock distributed in connection with a stock split or stock dividend, and other property distributed as a dividend, may be subject to the same restrictions and risk of forfeiture as the restricted stock with respect to which the distribution was made.
Restricted Stock Units. Restricted stock units are rights to receive common stock, cash or a combination of both at the end of a specified period or upon a specified event. Restricted stock units may be subject to restrictions, including a risk of forfeiture, as specified in the award agreement. Restricted stock units may be settled in common stock, cash or any combination thereof, as determined by the Plan Administrator. Except as otherwise provided by the Plan Administrator in the award agreement or otherwise, restricted stock units subject to forfeiture restrictions will be forfeited upon termination of a participant's employment or services prior to the end of the specified period or the occurrence of the specified event. The Plan Administrator may, in its sole discretion, grant dividend equivalents with respect to restricted stock units.
Performance Awards. The LTIP also provides for the grant of performance awards that may be granted in the form of common stock, cash or a combination of both. Each performance award will set forth (a) the amount, including a threshold, target and maximum amount if applicable, a Participant may earn in the form of cash or shares of Common Stock or a formula for determining that amount, (b) the performance criteria and level of achievement versus the criteria that will determine the amount payable or number of shares of our common stock to be granted, issued, retained and/or vested, (c) the performance period over which performance is to be measured, (d) the timing of any payments to be made, (e) restrictions on the transferability of the award and (f) such other terms and conditions as our Plan Administrator may determine.
For awards that may be subject to Section 162(m) of the Code, the Plan Administrator will have the discretion to determine whether all or any portion of a performance award is intended to satisfy the requirements for "performance-based compensation" under Section 162(m). Section 162(m) generally disallows deductions for compensation in excess of $1,000,000 for some executive officers unless the compensation qualifies as "performance-based compensation."
For any performance award that is intended to satisfy this performance-based compensation exception, the Plan Administrator may establish a performance goal or goals based on one or more of the following criteria specified in the LTIP:
111
(a) earnings or earnings per share (whether on a pre-tax, after-tax, operational or other basis); (b) growth in earnings or earnings per share; (c) pre-tax earnings before interest, depreciation and amortization; (d) pre-tax operating earnings after interest expense and before incentives, service fees and extraordinary or special items; (e) pre-tax earnings after lease operating expenses and general administrative expenses; (f) earnings before interest and taxes; (g) net earnings; (h) return on equity or average stockholders' equity; (i) return on assets or net assets; (j) return on investment; (k) cash flow (whether as an absolute number or percentage change), cash flow return, operating cash flow or cash flow per equivalent barrel or Mcf, increase in cash flow, increase in cash flow from operations or increase in cash flow return, EBITDA or EBITDAX; (l) revenues or increases in revenues; (m) return on operating revenue; (n) income, pre-tax income, net income (either before or after interest, taxes, depreciation and/or amortization), operating income or net operating income; (o) net income per share; (p) operating budget; (q) cash provided by operating activities; (r) expenses or costs or expense levels or cost levels (absolute or per unit); (s) cost reductions, controls or savings; (t) one or more operating ratios; (u) growth in stockholder value, including relative to the moving average of the S&P 500 Index or a peer group index (Total Shareholder Return or TSR); (v) operating efficiency; (w) the accomplishment of mergers, acquisitions, dispositions, public offerings or similar extraordinary business transactions; (x) net asset value per share; (y) individual business objectives; (z) strategic initiatives; (aa) improvement in workforce diversity; (bb) environmental health and safety record or environmental health and safety programs; and (cc) finding and development costs, finding and development cost per unit, finding, development and acquisition costs (FD&A) or finding costs per equivalent barrel or Mcf.
These criteria may be applied to an individual holder of a performance award, the company as a whole or a relevant portion of the company's operations. The performance goals established using these criteria may be expressed on an absolute or a relative basis, and may employ comparisons based on internal targets or the performance of other companies, or the historical performance of the company or any of its operating units or divisions. Any earnings-based measures may use comparisons relating to capital, shareholder's equity, shares outstanding, assets or net assets.
The maximum amount that may be paid in cash pursuant to a performance award granted to any holder with respect to any single fiscal year, if the award is intended to satisfy the qualified performance-based compensation requirements of Code Section 162(m), is $2,000,000. If a performance award provides for a performance period longer than one fiscal year, the maximum amount that may be paid to the holder under that award is $2,000,000 multiplied by the number of full fiscal years in the performance period. The LTIP also provides that the maximum number of shares of common stock for which awards may be granted to any single participant during a fiscal year, including awards the vesting or payment of which is subject to the achievement of performance goals, is 3,450,000 (which is 30% of the number of shares initially reserved for issuance under the LTIP in the aggregate).
Before payment is made under any performance award that is intended to satisfy the qualified performance-based compensation requirements of Code Section 162(m), the Plan Administrator must certify the extent to which the performance goals and other material terms of the award have been satisfied, and the Plan Administrator has the discretion to reduce, but not to increase, the amount payable and the number of shares that may be received.
The class of persons eligible to receive performance awards under the LTIP is the same class eligible to receive awards under the LTIP generally, that is, all employees and other service providers, including non-employee directors.
Stock Awards. Stock awards are awards of common stock not subject to vesting or forfeiture restrictions. Stock awards may be issued for cash consideration or no cash consideration. The Plan Administrator may require a Participant to pay a purchase price for each share of common stock covered by a stock award.
112
Other Incentive Awards. Eligible Persons may be granted, subject to applicable legal limitations and the terms of the LTIP and the intended purposes of the LTIP, other awards related to common stock. Such awards may include, but are not limited to, common stock awarded as a bonus, dividend equivalents, convertible or exchangeable debt securities, other rights convertible or exchangeable into common stock, purchase rights for common stock, awards with value and payment contingent upon our performance or any other factors designated by the Plan Administrator, and awards valued by reference to the value of common stock or the value of securities of or the performance of specified subsidiaries. The Plan Administrator will determine terms and conditions of all such awards. Long-term cash awards also may be made under the LTIP. Cash awards also may be granted as an element of or a supplement to any awards permitted under the LTIP. Awards may also be granted in lieu of obligations to pay cash or deliver other property under the LTIP or under other plans or compensation arrangements, subject to any applicable provision under Section 16 of the Exchange Act.
Severance and Change of Control Benefits
We maintain employment agreements with our named executive officers that provide for severance and/or change in control protections. We believe that severance protection provisions create important retention tools for us, as post-termination payments allow employees to leave our employment with value in the event of certain terminations of employment that were beyond their control. Post-termination payments allow management to focus their attention and energy on making the best objective business decisions that are in our interest without allowing personal considerations to cloud the decision-making process. Further, we believe that change in control protections maximize equity holder value by encouraging the named executive officers to review objectively any proposed transaction in determining whether such proposal or termination is in the best interest of our equity holders, whether or not the executive will continue to be employed. Executive officers at other companies in our industry and the general market, against which we compete for executive talent, commonly have post-termination payments, and we have provided this benefit to the named executive officers to remain competitive in attracting and retaining skilled professionals in our industry. A more detailed description of the severance and change in control provisions in effect prior to this offering with our named executive officers can be found in the "Potential Payments Upon Termination or a Change in Control" section below. We expect that the amended and restated employment agreements that we intend to enter into with our named executive officers in connection with this offering will have similar provisions.
Other Compensation Elements
We offer participation in broad-based retirement, health and welfare plans to all of our employees. We currently maintain a plan intended to qualify under section 401(k) of the Internal Revenue Code of 1986, as amended (the "Code"), where employees are allowed to contribute portions of their base compensation into a retirement account. During 2011, we provided a matching contribution in amounts up to 4% of the employees' eligible compensation, and all matching contributions we made during the 2011 fiscal year with respect to our named executive officers are reported in the Summary Compensation Table below. Effective January 1, 2012, this matching contribution amount will be increased to up to 6% of the employee's eligible compensation.
We have also historically provided limited perquisites to certain employees. Perquisites such as cell phone service, and, with respect to Messrs. McCarroll and Jo, club membership dues were provided during 2011 as a means of additional compensation through the availability of a benefit that provides them convenience in light of the extraordinary demands on their time. As part of our general review of our executive compensation programs, we will review the benefits and costs of such perquisites and determine if, or to what extent, the continuation of these limited perquisites may be appropriate for our named executive officers going forward.
113
Actions To Be Taken Following the 2011 Fiscal Year
2012 Annual Incentive Compensation Plan
Our board of directors intends to adopt a 2012 Annual Incentive Compensation Plan (our "Bonus Plan") to be effective prior to the consummation of this offering. The purpose of our Bonus Plan is to create incentives and rewards that are designed to motivate participating employees to put forth maximum effort toward our success and growth and to enable us to attract and retain experienced individuals who by their position, ability and diligence are able to make important contributions to our success. Our Bonus Plan provides for variable cash compensation earned when established performance objectives are achieved.
Our board will determine which of our employees will receive awards under our Bonus Plan and will prescribe and interpret the terms and provisions of each award. Each award will set forth the performance goals with respect to each selected performance measure and such other terms and conditions as our board may determine. Our board may adjust the performance goals established for a particular performance period to account for certain extraordinary events such as significant acquisitions or divestitures. After the end of the performance period, our board will determine the extent to which the applicable performance goals have been satisfied and the amount, if any, payable to each award recipient. Our board has discretion to increase, decrease or eliminate an award based on its assessment of the award recipient's individual performance, subject to the exceptions for awards intended to qualify as performance-based compensation as described below. Our board has discretion to determine whether an award recipient whose employment terminates for reasons other than cause will receive payment pursuant to an award, provided that the board may not take action that would cause an award intended to qualify as "qualified performance-based compensation" under Section 162(m) to not so qualify. Award recipients who are terminated for cause will not be eligible to receive an award payment. In the future, a compensation committee of our board may be instituted to assume these functions on the board's behalf.
For a limited period of time following this offering, the Bonus Plan will qualify for an exception to the deductibility limitations imposed by Section 162(m) of the Code. For more details on "performance-based" compensation and Section 162(m) of the Code, please read "—Impact of Financial Reporting and Tax Accounting Rules."
If our compensation committee determines that an award granted to an employee who is likely to be a covered employee under Section 162(m) of the Code should qualify as performance-based compensation for purposes of Section 162(m) of the Code, the award will be subject to additional terms under our Bonus Plan. Our compensation committee may establish performance goals based on one or more of the business criteria specified in our Bonus Plan. Awards may contain performance measures based on one or more of the following criteria: (a) earnings or earnings per share (whether on a pre-tax, after-tax, operational or other basis); (b) growth in earnings or earnings per share; (c) pre-tax earnings before interest, depreciation and amortization; (d) pre-tax operating earnings after interest expense and before incentives, service fees and extraordinary or special items; (e) pre-tax earnings after lease operating expenses and general administrative expenses; (f) earnings before interest and taxes; (g) net earnings; (h) return on equity or average stockholders' equity; (i) return on assets or net assets; (j) return on investment; (k) cash flow (whether as an absolute number or percentage change), cash flow return, operating cash flow or cash flow per equivalent barrel or Mcf, increase in cash flow, increase in cash flow from operations or increase in cash flow return, EBITDA or EBITDAX; (l) revenues or increases in revenues; (m) return on operating revenue; (n) income, pre-tax income, net income (either before or after interest, taxes, depreciation and/or amortization), operating income or net operating income; (o) net income per share; (p) operating budget; (q) cash provided by operating activities; (r) expenses or costs or expense levels or cost levels (absolute or per unit); (s) cost reductions, controls or savings; (t) one or more operating ratios; (u) growth in stockholder value,
114
including relative to the moving average of the S&P 500 Index or a peer group index; (v) operating efficiency; (w) the accomplishment of mergers, acquisitions, dispositions, public offerings or similar extraordinary business transactions; (x) net asset value per share; (y) individual business objectives; (z) strategic initiatives; (aa) improvement in workforce diversity; (bb) environmental health and safety record or environmental health and safety programs; and (cc) finding and development costs, finding and development cost per unit, finding, development and acquisition costs (FD&A) or finding costs per equivalent barrel or Mcf.
These criteria may be applied to the company on a consolidated basis and/or for specified subsidiaries or business or geographical units of the company (except with respect to the total stockholder return and earnings per share criteria). Payment of awards may also be contingent upon individual performance goals. Performance goals applicable to awards for covered employees generally must be established not later than 90 days after the beginning of the applicable calendar year performance period.
After the end of the applicable performance period, the compensation committee will determine the amount payable to a covered employee. The amount may be reduced or adjusted to reflect certain events or occurrences, but the compensation committee may not exercise discretion to increase any such amount if the award is intended to qualify as performance-based compensation under Section 162(m) of the Code. The maximum amount that may be paid in cash pursuant to an award granted to a covered employee with respect to the company's fiscal year that is intended to qualify as performance-based compensation under Section 162(m) of the Code is $2,000,000.
Employment Agreements
We anticipate entering into amended and restated employment agreements with each of the named executive officers in connection with the closing of this offering. The new employment agreements would be substantially consistent between each of the named executive officers in form and substance, with individualized compensation numbers for certain compensation items. An exhibit will be attached to each employment agreement that sets forth the applicable executive's: (i) position, title, and primary place of employment; (ii) the initial term for the agreement; (iii) base salary, target bonus, and equity participation opportunities; (iv) vacation time and other applicable employee benefits; (v) potential severance pay and the number of months following a termination that the severance will be paid, if not a lump sum; (vi) provisions regarding severance and bonus opportunities in connection with a termination that occurs in connection with a change in control (which will be defined as on the date of a change in control or during a set number of months following a change in control, to be determined individually for each officer); and (vii) the number of months following a termination that the executive would be subject to noncompetition and other restrictive covenants. Details regarding the exact numbers or terms described above for any specific executive officer are still being negotiated as of the date of this filing.
We intend for the agreements to terminate upon the executive's death or disability, by us with or without cause, by the executive with or without good reason, or by a non-extension of the agreement's term by either party. With respect to any termination of employment, each executive will receive payments of accrued benefits, expenses or unpaid compensation due to the executive at the time of the termination. In the event of a termination by us without cause, a resignation by the executive for good reason or our non-extension of the executive's employment term (each an "involuntary termination") that is not in connection with a change in control, the executive will receive, subject to the executive's execution and non-revocation of a release in our favor, a severance payment and continued coverage under COBRA for the period of time to be set forth in his or her employment agreement exhibit. If the executive incurs an involuntary termination in connection with a change in control, the executive will receive, in lieu of the severance provided above and subject to the executive's execution and non-revocation of a release in our favor, a lump sum cash payment equal to a multiple of his or her
115
base salary and target bonus, as well as continued coverage under COBRA for the period of time to be set forth in his or her employment agreement exhibit.
We expect that the amended and restated employment agreements will define the severance related terms as follows:
- •
- "Cause" shall generally mean a finding by our board of directors that the acts of the executive constitute one of the
following: (i) gross negligence or material misconduct; (ii) a material failure to comply with the lawful directives of the board of directors or the executive's immediate supervisor, as
applicable; (iii) a material failure to devote the executive's full working time to his duties and responsibilities; (iv) conduct that is materially detrimental to us or our affiliates,
monetarily or otherwise; (v) a material breach by the executive of the employment agreement; (vi) a breach of duty involving dishonesty, fraud or a conflict of interest; (vii) a
material violation of, or the failure to report or enforce, our personnel, ethical or operational policies or those of our affiliates; (viii) the failure to cooperate with any investigation or
inquiry authorized by us, our affiliates or a governmental agency; or (ix) the executive's conviction of, or entry of a plea agreement or consent decree with respect to, any felony or other
serious criminal offense or securities law violation. In order for us to exercise our right to terminate an executive under clauses (i) through (viii) above, our board of directors will provide
a written notice to the executive that provides him with a reasonable period of time to cure the "Cause" event if our board of directors has determined that the event can be cured by the executive.
- •
- "Change in Control" shall generally mean (a) a person acquires 50% or more of our outstanding stock or outstanding voting
securities, subject to certain limited exceptions, (b) individuals who serve as board members on the effective date of the employment agreements (or who are subsequently approved by a majority
of such individuals) cease for any reason to constitute at least a majority of the board of directors, or (c) a person acquires 50% or more of the total gross fair market value of our assets,
subject to certain limited exceptions. However, a "Change in Control" shall not occur as a result of (i) the initial public offering of our common stock or (ii) additional issuances of
our common stock for capital raising purposes.
- •
- "Good Reason" shall generally be defined as one of the following actions (if taken without the executive's consent): (a) a material reduction in the executive's base salary (or, if such salary has been increased, a material reduction that is not the result of a generally applicable reduction in base salaries of similarly situated executives); (b) a material reduction in the executive's authority, responsibilities or duties; (c) a permanent and material relocation of the executive's principal location of employment to a location that is outside of a 100 mile radius from the location where the executive served immediately prior to the relocation. In the event that the executive wishes to terminate his employment for "Good Reason," he must provide us with written notice within 60 days of the occurrence of the applicable event, after which we will have a 30 day period to remedy the event. If we do not cure the "Good Reason" event during that time period and the executive does not provide us with a proper notice of termination within 100 days of the date that the condition first arose, he will be deemed to have accepted the event as a new condition of his employment with us.
In the event that any payments provided to an executive in connection with a change in control could be deemed "parachute payments" under Section 280G of the Internal Revenue Code, we intend to design any such payment to be reduced to $1.00 below the amount that would otherwise become subject to the excise taxes imposed on such a parachute payment, or paid in full, whichever produced the best net after-tax result to the Employee. We will not provide any executive with a gross-up payment for any potential excise taxes imposed on payments under the revised employment agreements.
116
Executives who enter into the new employment agreements will be subject to confidentiality restrictions and will be prohibited from engaging in any activity that could reasonably be deemed as competing with us, both during and for a set period of time following a termination with us. Any inventions or discoveries made by the executive while in our employ or during the restricted period of time following his or her employment will remain our property. The revised employment agreements will also require the executives to abide by any compensation recovery, recoupment or other applicable policy applicable to our executive officers necessitated by the Dodd-Frank Act.
Impact of Financial Reporting and Tax Accounting Rules
Historically, we have not been required to recognize any compensation cost relating to share-based payments. Going forward, we will recognize compensation costs relating to any share-based payments, which will be measured based on the fair value of the equity issued after taking into account any vesting requirements or forfeiture obligations. We anticipate that recognition of this compensation cost will result from equity grants under any long-term incentive plan and that the fair market value of these awards will be based in part on the closing price of our common stock as reported by the NYSE.
Section 162(m) of the Code limits the deductibility of certain compensation expenses in excess of $1,000,000 to any one individual in any fiscal year. Compensation that is "performance based" is excluded from this limitation. For compensation to be "performance based," it must meet certain criteria, including predetermined objective standards approved by a compensation committee. However, companies that have become public pursuant to a public offering are allowed an exception to this rule for certain awards for a period of time following the offering and we are currently within this reliance period. In approving the amount and form of compensation for our named executive officers in the future, our board of directors (or a committee performing the functions of a compensation committee) will consider all elements of the cost to our company of providing such compensation, including the potential impact of Section 162(m). However, our board of directors (or a committee performing the functions of a compensation committee) may, in its judgment, authorize compensation payments that do not comply with the exemptions in Section 162(m) when it believes that such payments are appropriate to attract and retain executive talent.
117
Summary Compensation Table
The table below sets forth the annual compensation earned during the 2010 and 2011 fiscal years by our named executive officers as of December 31, 2011:
Name and Principal Position
|
Year | Salary ($) |
Bonus ($)(1) |
Options ($)(2) |
All Other Compensation ($)(3) |
Total ($) |
||||||||||||||
|---|---|---|---|---|---|---|---|---|---|---|---|---|---|---|---|---|---|---|---|---|
| G.M. McCarroll | 2011 | $ | 400,000 | — | — | $ | 49,006 | $ | 449,006 | |||||||||||
| President, Chief Executive Officer and Chairman of the Board of Directors | 2010 | 400,000 | $ | 400,000 | — | 51,977 | 851,977 | |||||||||||||
Howard M. Tate |
2011 |
245,000 |
— |
— |
11,592 |
256,592 |
||||||||||||||
| Senior Vice President, Chief Financial Officer and Secretary | 2010 | 221,923 | 155,000 | — | 11,563 | 388,486 | ||||||||||||||
John Y. Jo |
2011 |
255,000 |
— |
— |
20,895 |
275,895 |
||||||||||||||
| Senior Vice President, Acquisitions & Engineering | 2010 | 245,769 | 175,000 | — | 18,978 | 439,747 | ||||||||||||||
Thomas R. Lamme |
2011 |
138,462 |
— |
0 |
5,809 |
144,271 |
||||||||||||||
| Senior Vice President and General Counsel | ||||||||||||||||||||
- (1)
- Amounts
shown in the 2010 rows reflect amounts paid for service in 2010 pursuant to our board's discretionary assessment of our overall performance during
2010 as compared to budgeted performance for the year, and paid in 2011. Bonuses with respect to the 2011 calendar cannot be calculated as of the date of this filing. We intend to award bonuses, if
any, prior to March 15, 2012.
- (2)
- Amounts
reflected in this column for Mr. Lamme reflect a grant date fair value of the Class B Units of DOH in accordance with FASB ASC
Topic 718 of $0. The grant-date fair value of a Class B unit is determined on the award date based on an assumed liquidation value of the Partnership. As such, new awards of
Class B Units have immaterial initial value. We believe that, despite the fact that profits interests do not require the payment of an exercise price, they are most similar economically to
stock options, and as such, they are properly classified as "options" under the definition provided in Item 402(a)(6)(i) of Regulation S-K as an instrument with an
"option-like feature."
- (3)
- The following items are reported in the "All Other Compensation" column for the most recently completed fiscal year:
| |
Year | 401(k) Match | Club Dues | Group Term Life Insurance |
Cell Phone | Total | ||||||||||||||
|---|---|---|---|---|---|---|---|---|---|---|---|---|---|---|---|---|---|---|---|---|
G.M. McCarroll |
2011 | $ | 9,800 | $ | 35,171 | $ | 2,070 | $ | 1,965 | $ | 49,006 | |||||||||
|
2010 | 9,800 | 37,353 | 1,879 | 2,945 | 51,977 | ||||||||||||||
Howard M. Tate |
2011 | 9,800 | — | 528 | 1,264 | 11,592 | ||||||||||||||
|
2010 | 9,640 | — | 500 | 1,423 | 11,563 | ||||||||||||||
John Y. Jo |
2011 | 9,800 | 8,372 | 1,270 | 1,453 | 20,895 | ||||||||||||||
|
2010 | 9,800 | 6,553 | 1,219 | 1,406 | 18,978 | ||||||||||||||
Thomas R. Lamme |
2011 | 5,077 | — | 305 | 427 | 5,809 | ||||||||||||||
118
Grants of Plan-Based Awards for the 2011 Fiscal Year
Name (a) |
Grant Date |
All Other Option Awards: Number of Securities Underlying Options (#) |
Exercise or Base Price of Option Awards ($/Sh) |
Grant Date Fair Value of Stock and Option Awards ($)(2) |
||||||||
|---|---|---|---|---|---|---|---|---|---|---|---|---|
Thomas R. Lamme |
6/30/2011 | 50 | (1) | N/A | 0 | |||||||
- (1)
- In
connection with the commencement of his employment with us, Mr. Lamme received a grant of 50 Class B Units in DOH. These Class B
Units are scheduled to vest in four equal annual installments on each anniversary of the grant date, beginning on June 30, 2012. In connection with the closing of this offering, however, the
Class B Units granted to Mr. Lamme will vest in full. Awards reflected in this column represent the number of Class B Units of DOH granted to Mr. Lamme, rather than actual
"option" awards. Awards reflected in this column represent the number of Class B Units of DOH granted to Mr. Lamme, rather than actual "option" awards. As noted above in
footnote 4 to the Summary Compensation Table, while the awards are comprised solely of DOH Class B Units, the awards are economically similar to options and thus have been reflected in
the "Option Award" column of this table.
- (2)
- Amounts reflected in this column also reflect the grant date fair value of the Class B Units of DOH in accordance with FASB ASC Topic 718 (please see footnote 4 to the Summary Compensation Table above for more details).
Narrative Description to the Summary Compensation Table and the Grant of Plan-Based Awards Table for the 2011 Fiscal Year
We have entered into employment agreements with each of the named executive officers. The employment agreements generally govern the executives' annual compensation and benefit opportunities, provide for severance payments in the event of certain terminations of the executives' employment with us, and subject the executive to standard non-compete, confidentiality and non-solicitation restrictions following his employment with us. The employment agreements became effective on January 25, 2008, March 31, 2008, January 31, 2008 and June 30, 2011 for Messrs. McCarroll, Tate, Jo and Lamme, respectively. Mr. McCarroll's agreement had an initial term ending on December 31, 2010, although the term of his agreement will be extended for successive three year periods absent our or Mr. McCarroll's prior notice of a non-extension. Mr. Lamme's initial period ends on June 30, 2012, and the term will be extended for successive one-year terms absent our or Mr. Lamme's prior notice of a non-extension. With respect to Messrs. Tate and Jo, the initial term ended on December 31, 2009 and the terms will be extended for successive one year periods absent our or the executive's prior notice of a non-extension. The potential severance payments and restrictive covenants that the executives' employment agreements, as well as those associated with the Class B Units, also address is described in greater detail below in the section titled "Potential Payments Upon Termination or Change in Control." We anticipate entering into amended and restated employment agreements in connection with the completion of this offering.
Outstanding Equity Awards at 2011 Fiscal Year-End
The following table provides information on the current Class B Units of DOH held by the named executive officers as of December 31, 2011. The Class B Units will be converted into a number of shares of our common stock in connection with the completion of this offering based on the dissolution provisions in DOH's limited partnership agreement and based on the price we offer our shares of common stock to the public. This table includes unvested Class B Units. The vesting dates for each
119
award are shown in the accompanying footnotes. Notwithstanding those vesting dates, all of the Class B Units will automatically vest in connection with this offering.
| |
Option Awards | |||||||||
|---|---|---|---|---|---|---|---|---|---|---|
Name
|
Number of Securities Underlying Unexercised Options (#) Unexercisable (*) |
Option Exercise Price ($) |
Option Expiration Date |
|||||||
G.M. McCarroll |
— | N/A | N/A | |||||||
Howard M. Tate |
25 | N/A | N/A | |||||||
John Y. Jo |
25 | N/A | N/A | |||||||
Thomas R. Lamme |
50 | N/A | N/A | |||||||
- *
- As explained above, the applicable equity awards that are disclosed in these tables are DOH Class B Units rather than traditional "option" awards. We believe that, despite the fact that profits interests do not require the payment of an exercise price, they are most similar economically to stock options due to the fact that they have no value for tax purposes at grant and will obtain value only as the price of the underlying unit rises, and as such, are reported in the "Option Awards" columns above. Each profits interest award reflected in this table is subject to a four year vesting schedule pursuant to which 25% of the award vests on each anniversary of the grant date. Mr. McCarroll's units fully vested on November 1, 2011; Mr. Tate's remaining units will fully vest on March 31, 2012; Mr. Jo's remaining units will fully vest on January 31, 2012; and Mr. Lamme's units will vest in four equal annual installments on each anniversary of the grant date, beginning on June 30, 2012. In connection with our corporate reorganization, which will occur immediately prior to or concurrently with the closing of this offering, the Class B Units will be converted into shares of common stock and will not be subject to further vesting requirements. Please read "Corporate Reorganization" beginning on page 131.
Option Exercises in the 2011 Fiscal Year
The following table provides information, on an aggregate basis, about stock options that were exercised and stock awards that vested during the fiscal year ended December 31, 2011 for each of the named executive officers.
| |
Option Awards | ||||||
|---|---|---|---|---|---|---|---|
Name
|
Number of Shares Acquired on Exercise (#)(1) |
Value Realized on Exercise ($)(2) |
|||||
G.M. McCarroll |
200 | 0 | |||||
Howard M. Tate |
25 | 0 | |||||
John Y. Jo |
25 | 0 | |||||
Thomas R. Lamme |
— | 0 | |||||
- (1)
- As
explained above, the applicable equity awards that are disclosed in these tables are DOH Class B Units rather than traditional "option" awards.
Upon vesting, the named executive officers did not actually receive any DOH units nor may they exercise any rights to receive a DOH common unit. The numbers shown here reflect only the number of
Class B Units that became vested.
- (2)
- Amounts shown in this column reflect our best estimate of the value of the Class B Units as of December 31, 2011. As described in greater detail within our Compensation Discussion and
120
Analysis above, the Class B Units will not begin receiving distributions until such time as DOH satisfies a certain capital return hurdle which has not been satisfied as of the date of this filing.
Pension Benefits
We do not maintain any defined benefit pension plans.
Nonqualified Deferred Compensation
We do not have any plan that provides for the deferral of compensation on a basis that is not tax qualified.
Potential Payments Upon Termination or a Change in Control
We provide our named executive officers with certain severance and change in control benefits. The rationale for providing these benefits to our executives is described in detail in the "Compensation Discussion and Analysis" above.
Existing Employment Agreements
In the event that an executive's employment is terminated for any reason, we will promptly pay the executive any earned but unpaid base salary, any earned but unpaid portion of the executive's annual bonus for the year that precedes the year in which the termination occurs, accrued vacation pay and any amounts related to business expense reimbursements that have not then been paid (the "Accrued Benefits").
If an executive is terminated due to a death, disability, for cause, he resigns without good reason ("cause" and "good reason" are defined below), or the employment relationship terminates due to a notice by either party of non-extension of the employment agreement, the executive shall receive the Accrued Benefits.
If we terminate Mr. McCarroll without cause, or he terminates his employment for good reason, Mr. McCarroll will receive certain severance benefits in addition to his Accrued Benefits. Subject to Mr. McCarroll executing a release in our favor, and complying with the non-compete and non-solicitation provisions within his agreement, Mr. McCarroll will also receive a $500,000 payment on the tenth day following his termination of employment, a $500,000 payment on the one year anniversary of his termination of employment, and continued coverage under our group medical plans for Mr. McCarroll and his dependents for a period of one year following his termination of employment (or the date he becomes eligible to participate in another employee benefit plan, if earlier).
In the event that we terminate Messrs. Tate or Jo without cause or the executive terminates his employment for good reason, the executive will receive a severance amount equal to the larger of (a) executive's then-current annual base salary or (b) the portion of the executive's annual base salary that otherwise would have been paid to the executive from the date of termination until the end of the current term of the employment agreement. If we terminate Messrs. Tate or Jo by providing the executive with a notice of non-extension of the employment agreement, the executive will receive a severance amount equal to the executive's then-current annual base salary. In the event that we terminate Mr. Lamme without cause or he terminates his employment for good reason, he will receive a severance amount equal to the greater of (a) one-half of his then-current annual base salary or (b) the portion of his annual base salary that otherwise would have been paid to him from the date of termination until the end of the current term of the employment agreement. If we terminate Mr. Lamme by providing him with a notice of non-extension of the employment agreement, he will receive a severance amount equal to one-half of his then-current annual base salary. In each case, payment of the severance amount will be made (a) in equal monthly installments (up to 24 months), with respect to the portion of the payment exempt from the deferred compensation provisions of
121
Section 409A of the Code and (b) in a lump sum, with respect to the portion of the payment not exempt from the deferred compensation provisions of Section 409A of the Code. Any severance payments provided to Messrs. Tate, Jo or Lamme are subject to the executive executing a release in our favor and complying with the non-compete and non-solicitation provisions within his employment agreement. Each executive is eligible to elect continued coverage under our group health plans and we will either pay or reimburse him for such costs pursuant to the Consolidated Omnibus Budget Reconciliation Act of 1985 ("COBRA") until the earlier to occur of eighteen months and the date the executive is no longer entitled to continuation coverage under COBRA.
The named executive officers are each subject to a restricted period of twelve months following his termination of employment for any reason (the "Restricted Period"). He may not become directly or indirectly involved with a company that competes with us, nor can he recruit or solicit any of our employees or clients during this Restricted Period. The named executive officers are each prohibited from disclosing our confidential information at any time, and they must return all company property to us immediately upon their termination. The named executive officers have also agreed that any discoveries, inventions or improvements that the executive may invent or discover during the term of his employment will remain our property.
The following terms are defined similarly in each of the named executive officer's employment agreements:
- •
- Cause will be found if: (a) the executive's gross negligence or material misconduct in the performance of his
duties; (b) the executive's insubordination or failure to devote his time and best efforts to the performance of his duties and services; (c) the executive's engagement in activities
that could be materially injurious to us or our affiliates; (d) the executive's material breach of his employment agreement; (e) the executive's conviction of, or entry of a plea
agreement with respect to, any felony or other serious criminal offense; (f) the executive becoming the subject of any order issued by the Securities Exchange Commission or similar governing
body; (g) the executive's material breach of duty; or (h) the executive's failure to cooperate with an investigation or inquiry authorized by us or our affiliates conducted by a
governmental authority.
- •
- Good Reason will exist if any of the following actions are taken without the executive's prior written consent:
(a) a material reduction in the executive's base salary; (b) a material reduction in the executive's authority, responsibilities or duties; (c) a permanent relocation of the
executive's principal place of employment of more than 50 miles; or (d) our material breach of the employment agreement.
- •
- Disability (or "Inability to Perform" within the employment agreements) will be deemed to occur if the executive has been determined to be eligible under our long-term disability plan, or, if such a plan does not exist, the executive's inability to perform the essential functions of his position due to an illness or injury for 180 days.
DOH Class B Units
Each DOH Class B Unit award is subject to a four year time-based vesting schedule in addition to the capital return hurdle requirement. If the executive's employment with DOH, Dynamic Offshore Holding GP, LLC, DOH's general partner ("DOH GP") or any affiliate of either DOH or DOH GP is terminated for any reason prior to the time that a unit becomes vested, that unit is forfeited. DOH, or its nominee, shall have the right to repurchase any vested Class B Units for a six month period following an executive's termination of employment at fair market value. In the event that the termination of employment is due to a termination for cause, however, the vested Class B Units will be forfeited. In the event that a change in control or a liquidation event (each term defined below) occurs in the twelve month period following our termination of an executive's employment without cause or his resignation for good reason, any previously forfeited Class B Units will be deemed to be vested
122
units in the hands of the previous holder and DOH will provide a payment to the holder equal to the fair market value of the units.
The four year vesting schedule will be fully and immediately accelerated, however, in the event that a change in control or a liquidation event occurs. A "change in control" is generally defined in the DOH partnership agreement as (i) a transaction or series of transactions where any person or group (other than DOH or its affiliates, or an employee benefit plan maintained by DOH or its affiliates) acquires the beneficial ownership of DOH's or DOH GP's securities that hold more than 50% of the combined voting power of DOH's securities immediately after such an acquisition; or (ii) (a) DOH's consummation of a merger, consolidation, reorganization or business combination, (b) a disposition of all or substantially all of DOH's assets, or (c) DOH's acquisition of stock or assets of another entity, in each case, that results in DOH's voting securities that were outstanding immediately prior to the transaction continuing to represent at least a majority of the combined voting power of the successor entity's outstanding voting securities immediately after the transaction. A "liquidation event" for purposes of the DOH partnership agreement means either (i) DOH GP's consent to a complete dissolution of DOH, (ii) an event that causes the dissolution of DOH under the Delaware Revised Uniform Limited Partnership Act, or (iii) the sale of all or substantially all of DOH's assets.
The table below shows our best estimate of the amount of payments and benefits that each of the named executive officers would receive upon a termination of employment or a change in control if that event had occurred on December 31, 2011. Amounts payable upon any event will not be determinable until the actual occurrence of any particular event. Estimates below do not include the
123
value of any Accrued Benefits, as all such amounts have been assumed to be paid current at the time of the event in question.
Executive
|
Termination of Employment due to Our Non-Renewal of Employment Agreement ($) |
Termination of Employment for Cause, Death, Disability, Executive Resignation without Good Reason ($) |
Termination of Employment By Us without Cause or by Executive for Good Reason ($) |
Change in Control or Liquidity Event (Without a Termination of Employment) ($) |
|||||||||||
|---|---|---|---|---|---|---|---|---|---|---|---|---|---|---|---|
| G.M. McCarroll | |||||||||||||||
| Base Salary(1) | N/A | N/A | $1,000,000 | N/A | |||||||||||
| Continued Medical | N/A | N/A | $24,299 | N/A | |||||||||||
| Accelerated Equity(2) | — | — | — | — | |||||||||||
| Total | — | — | $1,024,299 | N/A | |||||||||||
Howard M. Tate |
|||||||||||||||
| Base Salary(1) | $ | 245,000 | N/A | $245,000 | N/A | ||||||||||
| Continued Medical | N/A | N/A | $24,299 | N/A | |||||||||||
| Accelerated Equity(2) | N/A | — | — | — | |||||||||||
| Total | $ | 245,000 | — | $269,299 | N/A | ||||||||||
John Y. Jo |
|||||||||||||||
| Base Salary(1) | $ | 255,000 | N/A | $255,000 | N/A | ||||||||||
| Continued Medical | N/A | N/A | $24,299 | N/A | |||||||||||
| Accelerated Equity(2) | N/A | — | — | — | |||||||||||
| Total | $ | 255,000 | — | $279,299 | N/A | ||||||||||
Thomas R. Lamme |
|||||||||||||||
| Base Salary(1) | $ | 150,000 | N/A | $150,000 | N/A | ||||||||||
| Continued Medical | N/A | N/A | $24,299 | N/A | |||||||||||
| Accelerated Equity(2) | N/A | — | — | — | |||||||||||
| Total | $ | $150,000 | — | $174,299 | N/A | ||||||||||
- (1)
- Amounts
shown here reflect our hypothetical obligations to the executives had he been terminated as of December 31, 2011 under the current
agreements. The amounts shown here for Messrs. Tate and Jo reflect one year of their annual base salary in effect on December 31, 2011. The amounts shown here for Mr. Lamme
reflect one-half of his annual base salary in effect on December 31, 2011. All unvested Class B Units would be forfeited upon a termination for any
reason.
- (2)
- With respect to any termination of employment, there would be a forfeiture of all unvested Class B Units. For any vested Class B Units held as of December 31, 2011, we have assumed that DOH did not repurchase any such units at the time of the executive's termination of employment and thus there is no value associated with the vested Class B Units upon a termination of employment. Upon a change in control or liquidity event, we have shown our best estimate of the accelerated value of the Class B Units if a distribution event had occurred on December 31, 2011; for such purposes we assumed that the Class A Unit holders would not have received a full return on their capital contributions as of December 31, 2011, thus the units would not have provided any value to the named executive officers at that time.
Risk Assessment
Our board of directors has reviewed our compensation policies as generally applicable to our employees and believes that our policies do not encourage excessive and unnecessary risk-taking and that the level of risk that they do encourage is not reasonably likely to have a material adverse effect on us. Our board of directors has reviewed and discussed the design features, characteristics, and performance metrics utilized at our company, primarily actual adjusted EBITDA and cash flow, to
124
determine whether any of these policies or programs could create risks that are reasonably likely to have a material adverse effect on us.
Because our compensation philosophy applies to all of our employees and is tied to base salary, annual bonus and long-term equity-based awards, the sole components of compensation, and because the annual bonuses are fixed at a minimum amount each year, our compensation program encourages growth without taking material undue risks.
Director Compensation
We did not award any compensation to our non-employee directors during 2011. Going forward, our board of directors believes that attracting and retaining qualified non-employee directors will be critical to the future value growth and governance of our company. Our board of directors also believes that the compensation package for our non-employee directors should require a significant portion of the total compensation package to be equity-based to align the interests of these directors with our stockholders.
We are reviewing with Longnecker the non-employee director compensation paid by our peer group and are considering a non-employee director compensation program consisting of one or more of the following components:
- •
- an annual cash retainer fee and cash payments for each board of directors' meeting attended and for each committee meeting
attended;
- •
- an initial equity award of restricted stock; and
- •
- an annual equity award of shares of our restricted stock.
We expect to continue to work with Longnecker to establish the appropriate payment amounts, equity grants and vesting schedules.
Directors who are also our employees will not receive any additional compensation for their service on the board of directors.
We expect that each director will be reimbursed for (i) travel and miscellaneous expenses to attend meetings and activities of our board of directors or its committees; (ii) travel and miscellaneous expenses related to such director's participation in our general education and orientation program for directors; and (iii) travel and miscellaneous expenses for each director's spouse who accompanies a director to attend meetings and activities of our board of directors or any of our committees.
125
CERTAIN RELATIONSHIPS AND RELATED PARTY TRANSACTIONS
Corporate Reorganization
In connection with our corporate reorganization, we will engage in transactions with certain affiliates and our existing equity holders. Please read "Corporate Reorganization" beginning on page 131 for a description of these transactions.
Riverstone/Carlyle Funds Investments in Dynamic
From time to time since its inception, DOH has issued limited partnership interests in connection with capital contributions from its limited partners, which include the Riverstone/Carlyle Funds and certain members of management. Following the completion of this offering, the Riverstone/Carlyle Funds will own an approximate 52.3% interest in us. Aggregate capital contributions to DOH were $174.0 million, $22.3 million and $28.6 million for the years ended December 31, 2008, 2009 and 2010, respectively. There were no capital contributions during the nine months ended September 30, 2011. DOH paid distributions to its limited partners in aggregate amounts of $33.0 million, $48.3 million and $12.5 million for the years ended December 31, 2009 and 2010 and the nine months ended September 30, 2011, respectively. In the fourth quarter of 2011 and in January 2012, DOH paid additional distributions to its limited partners in aggregate amounts of $18.0 million and $25.0 million, respectively. There were no distributions to limited partners during the year ended December 31, 2008.
As required by Dynamic Offshore Holding, LP's limited partnership agreement, we paid an affiliate of Riverstone a management fee of $1.1 million, $1.5 million and $1.5 million for the years ended December 31, 2008 and 2009 and 2010, respectively. Prior to the completion of this offering, we expect to pay Riverstone a management fee of $1.5 million for the year ended December 31, 2011. Following the completion of this offering, we will not pay Riverstone any management fee in the future.
Stockholders Agreement
In connection with the closing of this offering, we expect to enter into a stockholders agreement (the "Stockholders Agreement") with R/C Dynamic Holdings, L.P., an affiliate of the Riverstone/Carlyle Funds; R/C Energy IV Direct Partnership, L.P., an affiliate of the Riverstone/Carlyle Funds; Michel B. Moreno (or his affiliate); Mr. McCarroll, our President and Chief Executive Officer; SESI, L.L.C. and Superior Energy Investments, LLC, each an affiliate of Superior; and other stockholders who were partners in DOH, including the other members of our management team. The Stockholders Agreement will contain several provisions relating to the sale of our common stock by the parties thereto, including that (i) prior to the date that is the earlier of (a) the second anniversary of the execution of the Stockholders Agreement and (b) the date on which the Riverstone/Carlyle Funds have received cash proceeds in an amount equal to their investment in Dynamic Offshore Holding, LP (plus a pre-defined return), no management stockholder will be permitted to transfer any shares of their common stock, subject to certain limited exceptions; (ii) so long as the Riverstone/Carlyle Funds collectively hold at least 45% of the issued and outstanding shares of our common stock, the Riverstone/Carlyle Funds shall have the right to cause the other parties to the Stockholder Agreement to vote in favor and tender his shares of common stock to a third-party in connection with a sale of our company; and (iii) if a Riverstone/Carlyle Fund stockholder proposes to transfer all or a portion of its shares of our common stock to a non-affiliated third party, each management stockholder has the right to sell up to the same percentage of common stock as that being sold by the Riverstone/Carlyle Fund stockholder (subject to certain limitations).
The Stockholders Agreement will also grant the Riverstone/Carlyle Funds the right to nominate three members of our board of directors so long as the Riverstone/Carlyle Funds hold at least 25% of our outstanding common stock, two members of our board of directors so long as the Riverstone/Carlyle Funds hold at least 10% of our outstanding common stock, and one member of our board of
126
directors so long as the Riverstone/Carlyle Funds hold at least 5% of our outstanding common stock. The Stockholders Agreement also will require the stockholders party thereto to take the necessary actions, including voting their shares of common stock, for the election of the Riverstone/Carlyle Funds' nominees, our President and Chief Executive Officer, Mr. McCarroll, and the board's other nominees.
Registration Rights Agreement
In connection with the closing of this offering, we will enter into a registration rights agreement (the "Registration Rights Agreement") with the stockholders who were previously Class A Unitholders in DOH, including R/C Dynamic Holdings, L.P., an affiliate of the Riverstone/Carlyle Funds; R/C Energy IV Direct Partnership, L.P., an affiliate of the Riverstone/Carlyle Funds; Michel B. Moreno (or his affiliate); Mr. McCarroll, our President and Chief Executive Officer; SESI, L.L.C. and Superior Energy Investments, LLC, each an affiliate of Superior; and certain other stockholders. Pursuant to the Registration Rights Agreement, we have agreed to register the sale of shares of our common stock under certain circumstances.
Demand Registration Rights. At any time after six months after the closing of this offering, the Riverstone/Carlyle Funds have the right to require us by written notice to register the sale of a number of their shares of common stock in an underwritten offering. We are required to provide notice of the request within 30 days following the receipt of such demand request, to all additional holders of our common stock, who may, in certain circumstances, participate in the registration. The Riverstone/Carlyle Funds have the right to cause up to an aggregate of five such demand registrations. In no event shall more than one demand registration occur during any six-month period or within 180 days after the effective date of a registration statement we file. Further, we are not obligated to effect any demand registration in which the anticipated aggregate offering price included in such offering is less than $50,000,000. Once we are eligible to effect a registration on Form S-3, any such demand registration may be for a shelf registration statement. We will be required to maintain the effectiveness of any such registration statement until the earlier of 90 days after the effective date and the consummation of the distribution by the participating holders.
Piggy-back Registration Rights. If, at any time, we propose to register an offering of common stock (subject to certain exceptions) for our own account, then we must give at least ten days' notice (subject to reduction to five days' or one day's notice in connection with certain offerings) to all holders of registrable securities to allow them to include a specified number of their shares in that registration statement.
Conditions and Limitations; Expenses. These registration rights are subject to certain conditions and limitations, including the right of the underwriters to limit the number of shares to be included in a registration and our right to delay or withdraw a registration statement under certain circumstances. We will generally pay all registration expenses in connection with our obligations under the Registration Rights Agreement, regardless of whether a registration statement is filed or becomes effective. The obligations to register shares under the Registration Rights Agreement will terminate when no registrable common stock remains outstanding. Registrable common stock means all common stock other than shares (i) sold in a transaction that is not an exempt transfer pursuant to the Stockholders Agreement, (ii) sold pursuant to an effective registration statement under the Securities Act, (iii) sold in a transaction exempt from registration under the Securities Act (including transactions pursuant to Rule 144), or (iv) that can be sold without volume limitations within 90 days under Rule 144.
Transactions with the Moreno Group
We have conducted a number of transactions with the Moreno Group, LLC and its affiliates (collectively, the "Moreno Group"), which is affiliated with the Riverstone/Carlyle Funds, making it an affiliate of ours as well. In addition, Michel B. Moreno, the Chief Executive Officer of the Moreno
127
Group, served on the board of managers of the general partner of DOH and has been one of DOH's limited partners since its inception. In addition, Mr. McCarroll, our President and Chief Executive Officer, served as an officer of Moreno Offshore Resources, LLC ("MOR"), a subsidiary of the Moreno Group, LLC. Mr. McCarroll resigned from this position effective September 15, 2011.
Moreno Group Services Arrangements
In the ordinary course of business, we purchase offshore services from certain companies that are owned by or affiliated with the Moreno Group. We believe that these services were negotiated on an arms' length basis and that the terms are no less favorable than those we could obtain from unrelated third parties. During the years ended December 31, 2008, 2009 and 2010 and the nine months ended September 30, 2011, the amounts paid for these services totaled $6.2 million, $10.0 million, $6.4 million and $4.0 million, respectively.
MOR Transaction
On September 14, 2011, we acquired from MOR the remaining 25% working interest in the properties that we acquired from SPN Resources in 2008 for $68.0 million. For more information about the MOR Transaction, please read "Business—MOR Transaction" beginning on page 73. The MOR Transaction was negotiated on an arms' length basis.
Transactions with Superior
Since our inception, Superior has provided a substantial amount of the field-level work on our oil and natural gas properties. Following the completion of this offering, Superior will own an approximate 7.2% interest in us and remain a co-owner in Bullwinkle. Effective January 1, 2011, we entered into an Amended and Restated Preferred Provider Agreement with Superior (the "Preferred Provider Agreement"), which replaced a similar agreement that we had entered into with Superior in connection with our acquisition of SPN Resources in 2008. The Preferred Provider Agreement makes Superior and its affiliates the preferred provider of field-level services for our oil and natural gas properties and governs all of the work that Superior performs for us.
In the aggregate, we incurred approximately $13.4 million, $13.1 million, $25.9 million and $13.5 million of costs with Superior during the years ended December 31, 2008, 2009 and 2010 and the nine months ended September 30, 2011.
Preferred Provider Agreement
Under the Preferred Provider Agreement, we are obligated to offer Superior and its affiliates the first opportunity to perform such field-level services for us. If Superior and its affiliates are unable or unwilling to perform any requested field-level services, or if Superior's and its affiliates' price for such services is not competitive with third parties' prices, then we are entitled to engage a third party to perform the requested services.
In addition, the Preferred Provider Agreement makes us party to Superior's Master Services Agreement to the extent that such agreement sets the pricing and quality terms for many common field-level services. With respect to field-level services for which the price is not set by Superior's Master Service Agreement, the Preferred Provider Agreement states that Superior has the discretion to determine the price at which it will provide any requested services. Although the Preferred Provider Agreement does not expressly grant us the right to negotiate prices, Superior has typically engaged in negotiations with us to reach a mutually agreeable price for requested services. If we are unable to agree on a price that is competitive with third parties' prices, we are entitled to engage a third party to perform the requested services. We incurred approximately $9.9 million, $8.3 million, $17.3 million and $13.0 million of costs under the Preferred Provider Agreement during the years ended December 31,
128
2008, 2009 and 2010 and the nine months ended September 30, 2011. We expect that the Preferred Provider Agreement will continue to be in force following the completion of this offering.
Abandonment Contract
On March 14, 2008, we entered into a Turnkey Platform Decommissioning and Well Plugging and Abandonment Contract with Superior, which was amended on January 1, 2011 (as amended, the "Abandonment Contract"). The Abandonment Contract obligates Superior to perform certain decommissioning and plugging and abandonment work with respect to the wells and platforms that we acquired in the SPN Resources acquisition in 2008. We estimate that the aggregate remaining plugging and abandonment liability associated with the properties covered by the Abandonment Contract is approximately $133.4 million. For each well and platform serviced under the Abandonment Contract, we pay Superior the greater of (i) a negotiated fixed price stated in the Abandonment Contract or (ii) an amount based on Superior's actual cost to perform the service. We believe that these prices are lower than the current market rate that a third party service provider would charge. We incurred approximately $3.4 million, $4.8 million, $6.8 million and $0.5 million of costs under the Abandonment Contract during the years ended December 31, 2008, 2009 and 2010 and the nine months ended September 30, 2011.
Bullwinkle Decommissioning Agreement
On January 31, 2010, we entered into a Decommissioning Obligations Letter Agreement (the "Bullwinkle Agreement") with Superior pursuant to which Superior agreed to provide the decommissioning and plugging and abandonment work related to the Bullwinkle field. Pursuant to the Bullwinkle Agreement, Superior is obligated to bear all of the plugging and abandonment obligations for the Bullwinkle field wells that we acquired in 2010 in exchange for our agreeing to pay an aggregate of $49 million over a three-year period. Regardless of Superior's costs, we will not be obligated to pay in excess of $49 million with respect to the covered wells. Through September 30, 2011, we had paid Superior an aggregate of $26.2 million under the Bullwinkle Agreement. We will bear our proportionate share of the plugging and abandonment liabilities for wells that have been drilled subsequent to our initial acquisition. We do not bear any liability for plugging and abandonment liabilities related to the Bullwinkle platform or pipelines.
Contribution Agreement
Before 2011, Superior owned minority interests in SPN Resources and Bandon, two of our consolidated subsidiaries, but did not have any other material non-commercial relationships with us. Effective January 1, 2011, we entered into a Contribution Agreement with Superior (the "Contribution Agreement") pursuant to which we acquired Superior's interests in SPN Resources and Bandon in exchange for a 10% limited partner interest in DOH. In addition to making Superior one of our substantial equity holders, the Contribution Agreement granted Superior the right to appoint one member of the board of directors of the general partner of DOH.
Procedures for Approval of Related Person Transactions
A "Related Party Transaction" is a transaction, arrangement or relationship in which we or any of our subsidiaries was, is or will be a participant, the amount of which involved exceeds $120,000, and in which any related person had, has or will have a direct or indirect material interest. A "Related Person" means:
- •
- any person who is, or at any time during the applicable period was, one of our executive officers or one of our directors;
- •
- any person who is known by us to be the beneficial owner of more than 5.0% of our common stock;
129
- •
- any immediate family member of any of the foregoing persons, which means any child, stepchild, parent, stepparent, spouse,
sibling, mother-in-law, father-in-law, son-in-law, daughter-in-law,
brother-in-law or sister-in-law of a director, executive officer or a beneficial owner of more than 5.0% of our common stock, and any person (other than
a tenant or employee) sharing the household of such director, executive officer or beneficial owner of more than 5.0% of our common stock; and
- •
- any firm, corporation or other entity in which any of the foregoing persons is a partner or principal or in a similar position or in which such person has a 10.0% or greater beneficial ownership interest.
We anticipate that our board of directors will adopt a written related party transactions policy prior to the completion of this offering. Pursuant to this policy, we expect that our audit committee will review all material facts of all Related Party Transactions and either approve or disapprove entry into the Related Party Transaction, subject to certain limited exceptions. In determining whether to approve or disapprove entry into a Related Party Transaction, the audit committee will take into account, among other factors, the following: (1) whether the Related Party Transaction is on terms no less favorable than terms generally available to an unaffiliated third-party under the same or similar circumstances and (2) the extent of the Related Person's interest in the transaction. Further, we expect that the policy will require that all Related Party Transactions required to be disclosed in our filings with the SEC be so disclosed in accordance with applicable laws, rules and regulations.
130
Dynamic Offshore Resources, Inc. is a Delaware corporation that was formed for the purpose of making this offering. Contemporaneously with or immediately prior to the closing of this offering, we will complete a reorganization to convert from a limited partnership to a corporation, which we believe is appropriate for a publicly-traded entity. Pursuant to the terms of this corporate reorganization, all of the interests in Dynamic Offshore Holding, LP will be transferred to its wholly owned subsidiary, Dynamic Offshore Resources, Inc., through a combination of a contribution of such interests and a merger of Dynamic Offshore Holding, LP into Dynamic Offshore Resources, Inc. As a result, (i) the limited partner interests in Dynamic Offshore Holding, LP will be converted into the right to receive common stock of Dynamic Offshore Resources, Inc., (ii) the membership interests in Dynamic Offshore Holding, LP's general partner will be contributed to Dynamic Offshore Resources, Inc., and the general partner interest in Dynamic Offshore Holding, LP will be cancelled and (iii) the common stock of Dynamic Offshore Resources, Inc., held by Dynamic Offshore Holding, LP, will be cancelled and the common stock of Dynamic Offshore Resources, Inc. held by affiliates of the Riverstone/Carlyle Funds will remain issued and outstanding. Therefore, investors in this offering will only receive, and this prospectus only describes the offering of, shares of common stock of Dynamic Offshore Resources, Inc. Our business will continue to be conducted through our wholly owned subsidiary, Dynamic Offshore Resources LLC, and its subsidiaries.
Our current equity owners' limited partnership interests will be converted into a number of shares of common stock using a valuation of the company based on the public offering price set forth on the cover of this prospectus and their current relative levels of ownership interest in Dynamic Offshore Holding, LP. Please read "Principal and Selling Stockholders" beginning on page 132 for more information about our equity owners' interests and "Description of Capital Stock" beginning on page 135 for additional information regarding the terms of our amended and restated certificate of incorporation and amended and restated bylaws as will be in effect upon the closing of this offering.
Under Dynamic Offshore Holding, LP's limited partnership agreement, a portion of the units representing limited partnership interests in Dynamic Offshore Holding, LP were set aside as discretionary incentive compensation for certain of our non-management employees to be issued in connection with a liquidity event. As part of our corporate reorganization, those units will be converted into an aggregate of 910,498 shares of common stock, 743,831 of which will be held as treasury stock and 166,667 of which will be cancelled. Prior to the completion of this offering, we expect to grant those remaining shares of treasury stock to certain non-management employees under our Long-Term Incentive Plan. In addition, we expect to pay aggregate cash bonuses to those employees of approximately $3 million, which represent the approximate value of prior tax distributions which would have been paid to holders of these units had they been issued upon the initial formation of Dynamic Offshore Holding, LP.
131
PRINCIPAL AND SELLING STOCKHOLDERS
The following table sets forth information with respect to the beneficial ownership of our common stock as of January 17, 2012 by:
- •
- the selling stockholders;
- •
- each of our named executive officers;
- •
- each of our directors; and
- •
- all of our directors and executive officers as a group.
Except as otherwise indicated, the person or entities listed below have sole voting and investment power with respect to all shares of our common stock beneficially owned by them, except to the extent this power may be shared with a spouse. Except as disclosed below, (i) none of the selling stockholders is a broker-dealer registered under Section 15 of the Exchange Act or an affiliate of a broker-dealer registered under Section 15 of the Exchange Act and (ii) each selling stockholder, director, named executive officer and principal stockholder named below will have sole voting and investment power with respect to the shares listed (except to the extent such power may be shared with a spouse). All information with respect to beneficial ownership has been furnished by the respective directors, officers or 5% or more stockholders, as the case may be. Unless otherwise noted, the address for each selling stockholder and each of the directors and named executive officers is 1301 McKinney, Suite 900, Houston, Texas 77010.
The selling stockholders have granted the underwriters the right to purchase up to an additional 2,500,000 shares of common stock to cover over-allotments and will sell shares only to the extent such option is exercised. The number of shares being offered by each selling stockholder in the table below assumes a full exercise of the underwriters' over-allotment option.
| |
Shares Beneficially Owned Prior to the Offering(1) |
|
Shares Beneficially Owned After Offering |
|||||||||||||
|---|---|---|---|---|---|---|---|---|---|---|---|---|---|---|---|---|
| |
Shares Being Offered |
|||||||||||||||
Name and Address of Beneficial Owner
|
Number | Percentage | Number | Percentage | ||||||||||||
Greater than 5% Stockholders: |
||||||||||||||||
R/C Dynamic Holdings LP(2) |
25,692,928 | 36.4 | % | 1,232,396 | 24,460,532 | 34.7 | % | |||||||||
R/C Energy Direct Partnership, L.P.(2) |
11,194,203 | 15.9 | % | 536,945 | 10,657,258 | 15.1 | % | |||||||||
MOR DOH Holdings, L.L.C.(3) |
3,928,594 | 5.6 | % | 188,440 | 3,740,154 | 5.3 | % | |||||||||
SESI, L.L.C. (4) |
3,814,272 | 5.4 | % | 182,957 | 3,631,315 | 5.1 | % | |||||||||
Superior Energy Investments, L.L.C.(4) |
1,232,137 | 1.7 | % | 59,101 | 1,173,036 | 1.7 | % | |||||||||
Directors and Named Executive Officers: |
||||||||||||||||
G.M. McCarroll(5) |
2,677,349 | 3.8 | % | 128,422 | 2,548,927 | 3.6 | % | |||||||||
John Y. Jo(6) |
421,648 | * | 20,225 | 401,423 | * | |||||||||||
Thomas R. Lamme(7) |
163,018 | * | 7,819 | 155,199 | * | |||||||||||
Howard M. Tate(8) |
367,093 | * | 17,608 | 349,485 | * | |||||||||||
N. John Lancaster |
— | — | — | — | — | |||||||||||
Robert F. Fulton |
— | — | — | — | — | |||||||||||
Terence E. Hall |
— | — | — | — | — | |||||||||||
John P. Ryan |
— | — | — | — | — | |||||||||||
All directors and named executive officers as a group(8) |
3,629,108 | 5.1 | % | 174,074 | 3,455,034 | 4.9 | % | |||||||||
Other Selling Stockholders: |
||||||||||||||||
Dan Bomersbach(9) |
68,879 | * | 3,304 | 65,575 | * | |||||||||||
James E. Brokmeyer(10) |
242,910 | * | 11,651 | 231,259 | * | |||||||||||
Mike Dane(9) |
48,903 | * | 2,346 | 46,557 | * | |||||||||||
Lacey K. Davis Trust(11) |
58,307 | * | 2,798 | 55,509 | * | |||||||||||
Leslie Demny(9) |
44,558 | * | 2,137 | 42,421 | * | |||||||||||
132
| |
Shares Beneficially Owned Prior to the Offering(1) |
|
Shares Beneficially Owned After Offering |
|||||||||||||
|---|---|---|---|---|---|---|---|---|---|---|---|---|---|---|---|---|
| |
Shares Being Offered |
|||||||||||||||
Name and Address of Beneficial Owner
|
Number | Percentage | Number | Percentage | ||||||||||||
R. Joey Farmer(9) |
106,710 | * | 5,118 | 101,592 | * | |||||||||||
Phillip Flato(9) |
102,308 | * | 4,907 | 97,401 | * | |||||||||||
Dennis Giovannetti(9) |
102,308 | * | 4,907 | 97,401 | * | |||||||||||
Ingrid Hillhouse(9) |
102,308 | * | 4,907 | 97,401 | * | |||||||||||
Edie Hunt(9) |
44,494 | * | 2,134 | 42,360 | * | |||||||||||
Gary G. Janik(12) |
245,911 | * | 11,796 | 234,115 | * | |||||||||||
Kyle Z. Janik Trust(13) |
58,307 | * | 2,798 | 55,509 | * | |||||||||||
Michelle Mauzy(9) |
111,118 | * | 5,330 | 105,788 | * | |||||||||||
Scott Moore(9) |
101,554 | * | 4,871 | 96,683 | * | |||||||||||
Mark Mozell(9) |
103,472 | * | 4,693 | 98,509 | * | |||||||||||
Carey J. Naquin(14) |
251,438 | * | 12,061 | 239,377 | * | |||||||||||
John Seeger(9) |
86,099 | * | 4,130 | 81,969 | * | |||||||||||
John H. Smith(15) |
384,129 | * | 18,425 | 365,704 | * | |||||||||||
Terry Thibodeaux(9) |
143,236 | * | 6,871 | 136,365 | * | |||||||||||
Randy Willmon(9) |
111,118 | * | 5,330 | 105,788 | * | |||||||||||
Ben Winkelman(9) |
110,559 | * | 5,303 | 105,256 | * | |||||||||||
- *
- Less
than 1%.
- (1)
- Prior
to the completion of our corporate reorganization (which will occur immediately prior to or contemporaneously with the completion of this offering),
the ownership interests of the selling stockholders, our significant stockholders and our directors and named executive officers are represented by Class A and Class B units representing
limited partnership interests in Dynamic Offshore Holding, LP. The amounts shown in the table are based on an estimated valuation of the company using an assumed price of $18.00 per share, the
mid-point of the range set forth on the cover page of this prospectus, and their current relative levels of limited partnership interests in Dynamic Offshore Holding, LP.
- (2)
- Following
the corporate restructuring described elsewhere in this prospectus, R/C Dynamic Holdings, L.P. and R/C Energy IV Direct Partnership,
L.P. will be the record holders of 25,692,928 and 11,194,203 shares of common stock, respectively. Riverstone/Carlyle Energy Partners IV, L.P. is the general partner of each of
R/C Dynamic Holdings, L.P. and R/C Energy IV Direct Partnership, L.P.; however, its general partner, R/C Energy GP IV, LLC, exercises investment discretion and
control over the shares held by each of R/C Dynamic Holdings, L.P. and R/C Energy IV Direct Partnership, L.P. Accordingly, R/C Energy GP IV, LLC and
Riverstone/Carlyle Energy Partners IV, L.P. may each be deemed to share beneficial ownership of the shares of our common stock owned of record by each of R/C Dynamic Holdings, L.P. and
R/C Energy IV Direct Partnership, L.P.
- For
a description of our relationships with the Riverstone/Carlyle Funds, including these selling stockholders, please read "Certain
Relationships and Related Party Transactions" beginning on page 126.
- R/C Energy GP IV, LLC is managed by an eight person managing board. Pierre F. Lapeyre, Jr., David M. Leuschen, Andrew W. Ward, Michael B. Hoffman, Lord John Browne, N. John Lancaster, Daniel A. D'Aniello and Edward J. Mathias, as the members of the managing board of R/C Energy GP IV, LLC, may be deemed to share beneficial ownership of the shares beneficially owned by R/C Dynamic Holdings, L.P. and R/C Energy IV Direct Partnership, L.P. Such individuals expressly disclaim any such beneficial ownership. The business address of each of R/C Dynamic Holdings, L.P. and R/C Energy IV Direct Partnership, L.P. is c/o Riverstone Holdings LLC, 712 Fifth Avenue, 51st Floor, New York, NY 10019.
133
- (3)
- MOR
DOH Holdings, L.L.C. is owned 50% by MBM 2011 DOH GRAT and 50% by TCM 2011 DOH GRAT. The managing trustee of the MBM 2011 DOH GRAT and the TCM 2011 DOH
GRAT is Dalis M. Waguespack, who has voting and investment power over the shares held by the trusts. Michel B. Moreno, the manager of MOR DOH Holdings, L.L.C., serves on the board of directors of
Dynamic Offshore Holding GP, LLC, the general partner of Dynamic Offshore Holding, LP. The business address of MOR DOH Holdings, L.L.C. is 4023 Ambassador Caffery, Ste. 200, Lafayette,
Louisiana 70503.
- For
a description of our relationships with affiliates of MOR DOH Holdings, L.L.C., including Mr. Moreno, please read "Certain
Relationships and Related Party Transactions" beginning on page 126.
- (4)
- SESI,
L.L.C. and Superior Energy Investments, L.L.C. are both wholly-owned subsidiaries of Superior Energy Services, Inc., a publicly traded company listed
on the New York Stock Exchange. David Dunlap is the chief executive officer of Superior Energy Services, Inc. and has dispositive and voting control of the shares owned by the selling stockholder.
Mr. Dunlap expressly disclaims any beneficial ownership of such shares. The business address of each of SESI, L.L.C. and Superior Energy Investments, L.L.C. is 601 Poydras Street,
Suite 2400, New Orleans, Louisiana 70130.
- For
a description of our relationships with Superior, including these selling stockholders, please read "Certain Relationships and Related Party
Transactions" beginning on page 126.
- (5)
- Mr. McCarroll
serves as our President, Chief Executive Officer and Chairman of the Board of Directors. In addition, the shares listed do not include
691,097 shares of common stock attributable to limited partnership interests that Mr. McCarroll previously contributed to trusts for the benefit of certain of his family members.
Mr. McCarroll is not the trustee of these trusts and disclaims beneficial ownership of those shares of common stock.
- (6)
- Mr. Jo
serves as our Senior Vice President, Acquisitions & Engineering.
- (7)
- Mr. Lamme
serves as our Senior Vice President and General Counsel.
- (8)
- Mr. Tate
serves as our Senior Vice President, Chief Financial Officer and Secretary. In addition, the shares listed do not include
92,888 shares of common stock attributable to limited partnership interests that Mr. Tate previously contributed to trusts for the benefit of certain of his family members.
Mr. Tate is not the trustee of these trusts and disclaims beneficial ownership of those shares of common stock.
- (9)
- The
selling stockholder is our employee.
- (10)
- Mr. Brokmeyer
serves as our Vice President, Production.
- (11)
- Lacey K.
Davis, as trustee of the selling stockholder, exercises sole voting and investment power with respect to the shares listed.
- (12)
- Mr. Janik
serves as our Vice President, Exploitation and Development.
- (13)
- Kyle Z.
Janik, as trustee of the selling stockholder, exercises sole voting and investment power with respect to the shares listed.
- (14)
- Mr. Naquin
serves as our Vice President, Operations.
- (15)
- Mr. Smith serves as our Vice President, Land and Business Development.
134
Upon completion of this offering, the authorized capital stock of Dynamic Offshore Resources, Inc. will consist of 300,000,000 shares of common stock, $0.01 par value per share, of which 70,533,333 shares will be issued and outstanding, and 50,000,000 shares of preferred stock, $0.01 par value per share, of which no shares will be issued and outstanding.
The following summary of the anticipated capital stock and amended and restated certificate of incorporation and amended and restated bylaws of Dynamic Offshore Resources, Inc. does not purport to be complete and is qualified in its entirety by reference to the provisions of applicable law and to our amended and restated certificate of incorporation and amended and restated bylaws, which will be filed as exhibits to the registration statement of which this prospectus is a part.
Common Stock
Except as provided by law or in a preferred stock designation, holders of common stock are entitled to one vote for each share held of record on all matters submitted to a vote of the stockholders, will have the exclusive right to vote for the election of directors and do not have cumulative voting rights. Except as otherwise required by law, holders of common stock, as such, are not entitled to vote on any amendment to the certificate of incorporation (including any certificate of designations relating to any series of preferred stock) that relates solely to the terms of any outstanding series of preferred stock if the holders of such affected series are entitled, either separately or together with the holders of one or more other such series, to vote thereon pursuant to the amended and restated certificate of incorporation (including any certificate of designations relating to any series of preferred stock) or pursuant to the General Corporation Law of the State of Delaware. Subject to preferences that may be applicable to any outstanding shares or series of preferred stock, holders of common stock are entitled to receive ratably such dividends (payable in cash, stock or otherwise), if any, as may be declared from time to time by our board of directors out of funds legally available for dividend payments. All outstanding shares of common stock are fully paid and non-assessable, and the shares of common stock to be issued upon completion of this offering will be fully paid and non-assessable. The holders of common stock have no preferences or rights of conversion, exchange, preemption or other subscription rights. There are no redemption or sinking fund provisions applicable to the common stock. In the event of any liquidation, dissolution or winding-up of our affairs, holders of common stock will be entitled to share ratably in our assets that are remaining after payment or provision for payment of all of our debts and obligations and after liquidation payments to holders of outstanding shares of preferred stock, if any.
Preferred Stock
Our amended and restated certificate of incorporation will authorize our board of directors, subject to any limitations prescribed by law, without further stockholder approval, to establish and to issue from time to time one or more classes or series of preferred stock, par value $0.01 per share, covering up to an aggregate of 50,000,000 shares of preferred stock. Each class or series of preferred stock will cover the number of shares and will have the powers, preferences, rights, qualifications, limitations and restrictions determined by the board of directors, which may include, among others, dividend rights, liquidation preferences, voting rights, conversion rights, preemptive rights and redemption rights. Except as provided by law or in a preferred stock designation, the holders of preferred stock will not be entitled to vote at or receive notice of any meeting of stockholders.
Anti-Takeover Effects of Provisions of Our Amended and Restated Certificate of Incorporation, Our Amended and Restated Bylaws and Delaware Law
Some provisions of Delaware law, and our amended and restated certificate of incorporation and our amended and restated bylaws described below, will contain provisions that could make the following transactions more difficult: acquisitions of us by means of a tender offer, a proxy contest or
135
otherwise; or removal of our incumbent officers and directors. These provisions may also have the effect of preventing changes in our management. It is possible that these provisions could make it more difficult to accomplish or could deter transactions that stockholders may otherwise consider to be in their best interest or in our best interests, including transactions that might result in a premium over the market price for our shares.
These provisions, summarized below, are expected to discourage coercive takeover practices and inadequate takeover bids. These provisions are also designed to encourage persons seeking to acquire control of us to first negotiate with us. We believe that the benefits of increased protection and our potential ability to negotiate with the proponent of an unfriendly or unsolicited proposal to acquire or restructure us outweigh the disadvantages of discouraging these proposals because, among other things, negotiation of these proposals could result in an improvement of their terms.
Opt Out of Section 203 of the Delaware General Corporation Law
In our amended and restated certificate of incorporation, we will elect not to be subject to the provisions of Section 203 of the Delaware General Corporation Law ("DGCL") regulating corporate takeovers. In general, those provisions prohibit a Delaware corporation, including those whose securities are listed for trading on the NYSE, from engaging in any business combination with any interested stockholder for a period of three years following the date that the stockholder became an interested stockholder, unless:
- •
- the transaction is approved by the board of directors before the date the interested stockholder attained that status;
- •
- upon consummation of the transaction that resulted in the stockholder becoming an interested stockholder, the interested
stockholder owned at least 85% of the voting stock of the corporation outstanding at the time the transaction commenced; or
- •
- on or after such time the business combination is approved by the board of directors and authorized at a meeting of stockholders by at least two-thirds of the outstanding voting stock that is not owned by the interested stockholder.
Amended and Restated Certificate of Incorporation and Amended and Restated Bylaws
Among other things, upon the completion of this offering, our amended and restated certificate of incorporation and amended and restated bylaws will:
- •
- establish advance notice procedures with regard to stockholder proposals relating to the nomination of candidates for
election as directors or new business to be brought before meetings of our stockholders. These procedures provide that notice of stockholder proposals must be timely given in writing to our corporate
secretary prior to the meeting at which the action is to be taken. Generally, to be timely, notice must be received at our principal executive offices not less than 90 days nor more than
120 days prior to the first anniversary date of the annual meeting for the preceding year. Our amended and restated bylaws specify the requirements as to form and content of all stockholders'
notices. These requirements may preclude stockholders from bringing matters before the stockholders at an annual or special meeting;
- •
- provide our board of directors the ability to authorize undesignated preferred stock. This ability makes it possible for
our board of directors to issue, without stockholder approval, preferred stock with voting or other rights or preferences that could impede the success of any attempt to change control of us. These
and other provisions may have the effect of deferring hostile takeovers or delaying changes in control or management of our company;
- •
- provide that the authorized number of directors may be changed only by resolution of the board of directors (subject to the requirement under the Stockholders Agreement that the Riverstone/Carlyle Funds consent to any such increase);
136
- •
- provide that all vacancies, including newly created directorships, may, except as otherwise required by law or, if
applicable, the rights of holders of a series of preferred stock, be filled by the affirmative vote of a majority of directors then in office, even if less than a quorum (subject to the
Riverstone/Carlyle Funds' right under the Stockholders Agreement to fill vacancies related to their director nominees);
- •
- at any time after the Riverstone/Carlyle Funds, Superior, Mr. Moreno, Mr. McCarroll and their respective
affiliates no longer collectively own more than 50% of the outstanding shares of our common stock,
- •
- provide that any action required or permitted to be taken by the stockholders must be effected at a duly called annual or
special meeting of stockholders and may not be effected by any consent in writing in lieu of a meeting of such stockholders, subject to the rights of the holders of any series of preferred stock with
respect to such series (prior to such time, such actions may be taken without a meeting by written consent of holders of common stock having not less than the minimum number of votes that would be
necessary to authorize such action at a meeting);
- •
- provide our certificate of incorporation and bylaws may be amended by the affirmative vote of the holders of at least
two-thirds of our then outstanding common stock (prior to such time, our certificate of incorporation and bylaws may be amended by the affirmative vote of the holders of a majority of our
then outstanding common stock); and
- •
- provide that special meetings of our stockholders may only be called by the board of directors, the chief executive
officer or the chairman of the board (prior to such time, a special meeting may also be called at the request of stockholders holding a majority of the outstanding shares entitled to vote);
- •
- provide for our board of directors to be divided into three classes of directors, with each class as nearly equal in
number as possible, serving staggered three year terms, other than directors which may be elected by holders of preferred stock, if any. For more information on the classified board of directors,
please read "Management" beginning on page 98. This system of electing and removing directors may tend to discourage a third party from making a tender offer or otherwise attempting to obtain
control of us, because it generally makes it more difficult for stockholders to replace a majority of the directors;
- •
- provide that we renounce any interest in the business opportunities of the Riverstone/Carlyle Funds or any of their
officers, directors, agents, stockholders, members, partners, affiliates and subsidiaries (other than our directors that are presented business opportunities in their capacity as our directors) and
that they have no obligation to offer us those opportunities; and
- •
- provide that our bylaws can be amended or repealed at any regular or special meeting of stockholders or by the board of directors, including the requirement that any amendment by the stockholders at a meeting, at any time after the Riverstone/Carlyle Funds, Superior, Mr. Moreno, Mr. McCarroll and their respective affiliates no longer own more than 50% of the outstanding shares of our common stock, be upon the affirmative vote of at least 662/3% of the shares of common stock generally entitled to vote in the election of directors.
Limitation of Liability and Indemnification Matters
Our amended and restated certificate of incorporation will limit the liability of our directors for monetary damages for breach of their fiduciary duty as directors, except for liability that cannot be eliminated under the DGCL. Delaware law provides that directors of a company will not be personally liable for monetary damages for breach of their fiduciary duty as directors, except for liabilities:
- •
- for any breach of their duty of loyalty to us or our stockholders;
137
- •
- for acts or omissions not in good faith or which involve intentional misconduct or a knowing violation of law;
- •
- for unlawful payment of dividend or unlawful stock repurchase or redemption, as provided under Section 174 of the
DGCL; or
- •
- for any transaction from which the director derived an improper personal benefit.
Any amendment, repeal or modification of these provisions will be prospective only and would not affect any limitation on liability of a director for acts or omissions that occurred prior to any such amendment, repeal or modification.
Our amended and restated certificate of incorporation and amended and restated bylaws will also provide that we will indemnify our directors and officers to the fullest extent permitted by Delaware law. Our amended and restated bylaws will also permit us to purchase insurance on behalf of any officer, director, employee or other agent for any liability arising out of that person's actions as our officer, director, employee or agent, regardless of whether Delaware law would permit indemnification. We intend to enter into indemnification agreements with each of our current and future directors and officers. These agreements will require us to indemnify these individuals to the fullest extent permitted under Delaware law against liability that may arise by reason of their service to us, and to advance expenses incurred as a result of any proceeding against them as to which they could be indemnified. We believe that the limitation of liability provision in our amended and restated certificate of incorporation and the indemnification agreements will facilitate our ability to continue to attract and retain qualified individuals to serve as directors and officers.
Corporate Opportunity
Our amended and restated certificate of incorporation will provide that, to the fullest extent permitted by applicable law, we renounce any interest or expectancy in, or in being offered an opportunity to participate in, any business opportunity that may be from time to time presented to the Riverstone/Carlyle Funds or any of their respective officers, directors, agents, shareholders, members, partners, affiliates and subsidiaries (other than us and our subsidiaries) or business opportunities that such parties participate in or desire to participate in, even if the opportunity is one that we might reasonably have pursued or had the ability or desire to pursue if granted the opportunity to do so, and no such person shall be liable to us for breach of any fiduciary or other duty, as a director or controlling stockholder or otherwise, by reason of the fact that such person pursues or acquires any such business opportunity, directs any such business opportunity to another person or fails to present any such business opportunity, or information regarding any such business opportunity, to us, unless, in the case of any such person who is our director, any such business opportunity is expressly offered to such director in writing solely in his or her capacity as our director.
Transfer Agent and Registrar
The transfer agent and registrar for our common stock will be American Stock Transfer & Trust Company, LLC.
Listing
We have been approved, subject to official notice of issuance, to list our common stock for quotation on the NYSE under the symbol "DOR".
138
SHARES ELIGIBLE FOR FUTURE SALE
Prior to this offering, there has been no public market for our common stock. Future sales of our common stock in the public market, or the availability of such shares for sale in the public market, could adversely affect market prices prevailing from time to time. As described below, only a limited number of shares will be available for sale shortly after this offering due to contractual and legal restrictions on resale. Nevertheless, sales of a substantial number of shares of our common stock in the public market after such restrictions lapse, or the perception that those sales may occur, could adversely affect the prevailing market price at such time and our ability to raise equity-related capital at a time and price we deem appropriate.
Sales of Restricted Shares
Upon the closing of this offering, we will have an aggregate of 70,533,333 outstanding shares of common stock. Of these shares, all of the 16,666,667 shares of common stock to be sold by us in this offering, the 2,500,000 shares of common stock that may be sold by the selling stockholders if the underwriters exercise their over-allotment option and the 743,831 shares of common stock that we will issue to certain non-management employees under our Long-Term Incentive Plan pursuant to a registration statement on Form S-8 will be freely tradable without restriction or further registration under the Securities Act, unless the shares are held by any of our "affiliates" as such term is defined in Rule 144 of the Securities Act. All remaining shares of common stock held by existing stockholders will be deemed "restricted securities" as such term is defined under Rule 144. The restricted securities were issued and sold by us in private transactions and are eligible for public sale only if registered under the Securities Act or if they qualify for an exemption from registration under Rule 144 or Rule 701 under the Securities Act, which rules are summarized below.
As a result of the lock-up agreements described below and the provisions of Rule 144 and Rule 701 under the Securities Act, all of the shares of our common stock (excluding the shares to be sold in this offering) will be available for sale in the public market upon the expiration of the lock-up agreements, beginning 180 days after the date of this prospectus (subject to extension) and when permitted under Rule 144 or Rule 701.
Lock-up Agreements
We, all of our directors and officers and the selling stockholders have agreed not to sell any common stock for a period of 180 days from the date of this prospectus, subject to certain exceptions and extensions. Please read "Underwriters" beginning on page 144 for a description of these lock-up provisions.
Rule 144
In general, under Rule 144 as currently in effect, a person (or persons whose shares are aggregated) who is not deemed to have been an affiliate of ours at any time during the three months preceding a sale, and who has beneficially owned restricted securities within the meaning of Rule 144 for at least six months (including any period of consecutive ownership of preceding non-affiliated holders), would be entitled to sell those shares, subject only to the availability of current public information about us. A non-affiliated person who has beneficially owned restricted securities within the meaning of Rule 144 for at least one year would be entitled to sell those shares without regard to the provisions of Rule 144.
In connection with our corporate reorganization, we expect to exchange certain equity interests in Dynamic Offshore Holding, LP held by our employees for 4,583,352 shares of common stock in Dynamic Offshore Resources, Inc. Subject to certain exceptions, the holders of these shares of common stock will be entitled to "tack" their pre-exchange holding period for purposes of compliance with Rule 144. Because these equity interests in Dynamic Offshore Holding, LP were issued more than one
139
year before the closing of this offering, all 4,583,352 of these shares are expected to be eligible for resale by the holders thereof 90 days following the closing of this offering.
A person (or persons whose shares are aggregated) who is deemed to be an affiliate of ours and who has beneficially owned restricted securities within the meaning of Rule 144 for at least six months would be entitled to sell within any three-month period a number of shares that does not exceed the greater of one percent of the then outstanding shares of our common stock or the average weekly trading volume of our common stock reported through the New York Stock Exchange during the four calendar weeks preceding the filing of notice of the sale. Such sales are also subject to certain manner of sale provisions, notice requirements and the availability of current public information about us.
Rule 701
In general, under Rule 701, any of our employees, directors, officers, consultants or advisors who purchases shares from us in connection with a compensatory stock or option plan or other written agreement before the effective date of this offering is entitled to sell such shares 90 days after the effective date of this offering in reliance on Rule 144, without having to comply with the holding period requirement of Rule 144 and, in the case of non-affiliates, without having to comply with the public information, volume limitation or notice filing provisions of Rule 144. The SEC has indicated that Rule 701 will apply to typical stock options granted by an issuer before it becomes subject to the reporting requirements of the Exchange Act, along with the shares acquired upon exercise of such options, including exercises after the date of this prospectus.
Stock Issued Under Employee Plans
On the date of effectiveness of the registration statement to which this prospectus forms a part, we intend to file a registration statement on Form S-8 under the Securities Act to register stock issuable under our Long-Term Incentive Plan. This registration statement is expected to be filed following the effective date of the registration statement of which this prospectus is a part and will be effective upon filing. Accordingly, shares registered under such registration statement will be available for sale in the open market following the effective date, unless such shares are subject to vesting restrictions with us, Rule 144 restrictions applicable to our affiliates or the lock-up restrictions described above.
In connection with our corporate reorganization and this offering, we expect to grant 743,831 shares of common stock to certain non-management employees under our Long-Term Incentive Plan. For more information about this distribution, please read "Corporate Reorganization" on page 131.
Registration Rights
In connection with the closing of this offering, we expect to enter into the Registration Rights Agreement with certain of our existing equity owners. Please read "Certain Relationships and Related Party Transactions—Registration Rights Agreement" for more information about the terms of the Registration Rights Agreement.
140
MATERIAL U.S. FEDERAL INCOME TAX CONSIDERATIONS TO NON-U.S. HOLDERS
The following is a general discussion of the material U.S. federal income tax consequences of the acquisition, ownership and disposition of our common stock to a non-U.S. holder. For the purpose of this discussion, a non-U.S. holder is any beneficial owner of our common stock that is not for U.S. federal income tax purposes any of the following:
- •
- an individual citizen or resident of the U.S.;
- •
- a corporation (or other entity treated as a corporation for U.S. federal income tax purposes) created or organized in the
U.S. or under the laws of the U.S. or any state or the District of Columbia;
- •
- a partnership (or other entity treated as a partnership or other pass-through entity for U.S. federal income
tax purposes);
- •
- an estate whose income is subject to U.S. federal income tax regardless of its source; or
- •
- a trust (x) whose administration is subject to the primary supervision of a U.S. court and which has one or more U.S. persons who have the authority to control all substantial decisions of the trust or (y) which has made a valid election to be treated as a U.S. person.
If a partnership (or an entity treated as a partnership for U.S. federal income tax purposes) holds our common stock, the tax treatment of a partner in the partnership will generally depend on the status of the partner and upon the activities of the partnership. Accordingly, we urge partnerships that hold our common stock and partners in such partnerships to consult their tax advisors.
This discussion assumes that a non-U.S. holder will hold our common stock issued pursuant to the offering as a capital asset (generally, property held for investment). This discussion does not address all aspects of U.S. federal income taxation (including alternative minimum tax, gift and estate tax) or any aspects of state, local or non-U.S. taxation, nor does it consider any U.S. federal income tax considerations that may be relevant to non-U.S. holders that may be subject to special treatment under U.S. federal income tax laws, including, without limitation, U.S. expatriates, life insurance companies, tax-exempt or governmental organizations, dealers in securities or currency, banks or other financial institutions, investors whose functional currency is other than the U.S. dollar, "passive foreign investment companies," "controlled foreign corporations," persons who at any time hold more than 5% of the fair market value of any class of our stock and investors that hold our common stock as part of a hedge, straddle or conversion transaction. Furthermore, the following discussion is based on current provisions of the Internal Revenue Code of 1986, as amended, and Treasury Regulations and administrative and judicial interpretations thereof, all as in effect on the date hereof, and all of which are subject to change, possibly with retroactive effect.
We urge each prospective investor to consult a tax advisor regarding the U.S. federal, state, local and non-U.S. income and other tax consequences of acquiring, holding and disposing of shares of our common stock.
Distributions
We have not made any distributions on our common stock, and we do not plan to make any distributions for the foreseeable future. However, if we do make distributions on our common stock, those payments will constitute dividends for U.S. tax purposes to the extent paid from our current or accumulated earnings and profits, as determined under U.S. federal income tax principles. To the extent those distributions exceed our current and accumulated earnings and profits, the distributions will constitute a return of capital and will first reduce a holder's adjusted tax basis in the common stock, but not below zero, and then will be treated as gain from the sale of the common stock (see "—Gain on Disposition of Common Stock" beginning on page 142).
141
Any dividends (out of earnings and profits) paid to a non-U.S. holder of our common stock that are not effectively connected with a U.S. trade or business conducted by the non-U.S. holder generally will be subject to U.S. withholding tax either at a rate of 30% of the gross amount of the dividend or such lower rate as may be specified by an applicable tax treaty. To receive the benefit of a reduced treaty rate, a non-U.S. holder must provide us with an Internal Revenue Service ("IRS") Form W-8BEN or other appropriate version of IRS Form W-8 certifying qualification for the reduced rate.
Dividends received by a non-U.S. holder that are effectively connected with a U.S. trade or business conducted by the non-U.S. holder are exempt from such withholding tax. To obtain this exemption, the non-U.S. holder must provide us with an IRS Form W-8ECI properly certifying such exemption. Such effectively connected dividends, although not subject to withholding tax, will be subject to U.S. federal income tax on a net income basis at the same graduated rates generally applicable to U.S. persons, subject to any applicable tax treaty providing otherwise. In addition to the income tax described above, dividends received by corporate non-U.S. holders that are effectively connected with a U.S. trade or business of the corporate non-U.S. holder may be subject to a branch profits tax at a rate of 30% or such lower rate as may be specified by an applicable tax treaty.
A non-U.S. holder of our common stock may obtain a refund of any excess amounts withheld if the non-U.S. holder is eligible for a reduced rate of United States withholding tax and an appropriate claim for refund is timely filed with the IRS.
Gain on Disposition of Common Stock
A non-U.S. holder generally will not be subject to U.S. federal income tax on any gain realized upon the sale or other disposition of our common stock unless:
- •
- the gain is effectively connected with a U.S. trade or business of the non-U.S. holder and, if required by an
applicable tax treaty, is attributable to a U.S. permanent establishment maintained by such non-U.S. holder;
- •
- the non-U.S. holder is an individual who is present in the United States for a period or periods aggregating
183 days or more during the calendar year in which the sale or disposition occurs and certain other conditions are met; or
- •
- we are or have been a "U.S. real property holding corporation" for U.S. federal income tax purposes and the non-U.S. holder holds or has held, directly or indirectly, at any time within the shorter of the five-year period preceding the disposition or the non-U.S. holder's holding period, more than 5% of our common stock. Generally, a corporation is a United States real property holding corporation if the fair market value of its United States real property interests equals or exceeds 50% of the sum of the fair market value of its worldwide real property interests and its other assets used or held for use in a trade or business. We believe that we are, and will remain for the foreseeable future, a "U.S. real property holding corporation" for U.S. federal income tax purposes.
Unless an applicable tax treaty provides otherwise, gain described in the first bullet point above will be subject to U.S. federal income tax on net income basis at the same graduated rates generally applicable to U.S. persons. Corporate non-U.S. holders also may be subject to a branch profits tax equal to 30% (or such lower rate as may be specified by an applicable tax treaty) of its earnings and profits that are effectively connected with a U.S. trade or business.
Gain described in the second bullet point above (which may be offset by U.S. source capital losses, provided that the non-U.S. holder has timely filed U.S. federal income tax returns with respect to such losses) will be subject to a flat 30% U.S. federal income tax (or such lower rate as may be specified by an applicable tax treaty).
142
Non-U.S. holders should consult a tax advisor regarding potentially applicable income tax treaties that may provide for different rules.
Backup Withholding and Information Reporting
Generally, we must report annually to the IRS the amount of dividends paid to each non-U.S. holder, the name and address of the recipient, and the amount, if any, of tax withheld with respect to those dividends. A similar report is sent to each non-U.S. holder. These information reporting requirements apply even if withholding was not required. Pursuant to tax treaties or other agreements, the IRS may make its reports available to tax authorities in the recipient's country of residence.
Payments of dividends to a non-U.S. holder may be subject to backup withholding (at the applicable rate) unless the non-U.S. holder establishes an exemption, for example, by properly certifying its non-U.S. status on an IRS Form W-8BEN or another appropriate version of IRS Form W-8. Notwithstanding the foregoing, backup withholding may apply if either we or our paying agent has actual knowledge, or reason to know, that the beneficial owner is a U.S. person that is not an exempt recipient.
Payments of the proceeds from sale or other disposition by a non-U.S. holder of our common stock effected outside the U.S. by or through a foreign office of a broker generally will not be subject to information reporting or backup withholding. However, information reporting (but not backup withholding) will apply to those payments if the broker does not have documentary evidence that the holder is a non-U.S. holder, an exemption is not otherwise established, and the broker has certain relationships with the United States.
Payments of the proceeds from a sale or other disposition by a non-U.S. holder of our common stock effected by or through a U.S. office of a broker generally will be subject to information reporting and backup withholding (at the applicable rate) unless the non-U.S. holder establishes an exemption, for example, by properly certifying its non-U.S. status on an IRS Form W-8BEN or another appropriate version of IRS Form W-8. Notwithstanding the foregoing, information reporting and backup withholding may apply if the broker has actual knowledge, or reason to know, that the holder is a U.S. person that is not an exempt recipient.
Backup withholding is not an additional tax. Rather, the U.S. income tax liability of persons subject to backup withholding will be reduced by the amount of tax withheld. If withholding results in an overpayment of taxes, a refund may be obtained, provided that the required information is timely furnished to the IRS.
Legislation Affecting Common Stock Held Through Foreign Accounts
On March 18, 2010, President Obama signed into law the Hiring Incentives to Restore Employment Act (the "HIRE Act"), which may result in materially different withholding and information reporting requirements than those described above, for payments made after December 31, 2012 (subject to certain transition rules). The HIRE Act limits the ability of non-U.S. holders who hold our common stock through a foreign financial institution to claim relief from U.S. withholding tax in respect of dividends paid on our common stock unless the foreign financial institution agrees, among other things, to annually report certain information with respect to "United States accounts" maintained by such institution. The HIRE Act also limits the ability of certain non-financial foreign entities to claim relief from U.S. withholding tax in respect of dividends paid by us to such entities unless (1) those entities meet certain certification requirements; (2) the withholding agent does not know or have reason to know that any such information provided is incorrect and (3) the withholding agent reports the information provided to the IRS. The HIRE Act provisions will have a similar effect with respect to dispositions of our common stock after December 31, 2012 (subject to certain transition rules). A non-U.S. holder generally would be permitted to claim a refund to the extent any tax withheld exceeded the holder's actual tax liability. Non-U.S. holders are encouraged to consult with their tax advisers regarding the possible implication of the HIRE Act on their investment in respect of the common stock.
143
Citigroup Global Markets Inc., Credit Suisse Securities (USA) LLC, Deutsche Bank Securities Inc., Tudor, Pickering, Holt & Co. Securities, Inc. and UBS Securities, LLC are acting as joint-book-running managers of this offering. Under the terms and subject to the conditions contained in an underwriting agreement dated , 2012, we have agreed to sell to the underwriters named below, for whom Citigroup Global Markets Inc. and Credit Suisse Securities (USA) LLC are acting as representatives (the "Representatives"), the following respective numbers of shares of common stock:
Underwriter
|
Number of Shares | ||||
|---|---|---|---|---|---|
Citigroup Global Markets Inc. |
|||||
Credit Suisse Securities (USA) LLC |
|||||
Deutsche Bank Securities Inc. |
|||||
Tudor, Pickering, Holt & Co. Securities, Inc. |
|||||
UBS Securities, LLC |
|||||
Capital One Southcoast, Inc. |
|||||
FBR Capital Markets & Co. |
|||||
Howard Weil Incorporated |
|||||
IBERIA Capital Partners L.L.C. |
|||||
Johnson Rice & Company L.L.C. |
|||||
Dahlman Rose & Company, LLC |
|||||
Morgan Keegan & Company, Inc. |
|||||
Natixis Securities Americas LLC |
|||||
RBS Securities Inc. |
|||||
Total |
16,666,667 | ||||
The underwriting agreement provides that the underwriters are obligated to purchase all the shares of common stock in the offering if any are purchased, other than those shares covered by the over-allotment option described below. The underwriting agreement also provides that if an underwriter defaults, the purchase commitments of non-defaulting underwriters may be increased or the offering may be terminated.
The selling stockholders have granted to the underwriters a 30-day option to purchase on a pro rata basis up to 2,500,000 additional shares from the selling stockholders at the initial public offering price less the underwriting discounts and commissions. The option may be exercised only to cover any over-allotments of common stock.
The underwriters propose to offer the shares of common stock initially at the public offering price on the cover page of this prospectus and to selling group members at that price less a selling concession of $ per share. After the initial public offering the Representatives may change the public offering price and concession. The offering of the shares of common stock by the underwriters is subject to receipt and acceptance and subject to the underwriters' right to reject any order in whole or in part.
144
The following table summarizes the compensation and estimated expenses we and the selling stockholders will pay:
| |
Per Share | Total | |||||||||||
|---|---|---|---|---|---|---|---|---|---|---|---|---|---|
| |
Without Over-allotment |
With Over-allotment |
Without Over-allotment |
With Over-allotment |
|||||||||
Underwriting discounts and commissions paid by us |
$ | $ | $ | $ | |||||||||
Expenses payable by us |
$ | $ | $ | $ | |||||||||
Underwriting discounts and commissions paid by the selling stockholders |
$ | $ | $ | $ | |||||||||
Expenses payable by the selling stockholders |
$ | $ | $ | $ | |||||||||
The underwriters have agreed to reimburse us for certain of the expenses we incur with respect to this offering.
The Representatives have informed us that the underwriters do not expect sales to accounts over which the underwriters have discretionary authority to exceed 5% of the shares of common stock being offered.
We have agreed, subject to certain exceptions, that we will not offer, sell, issue, contract to sell, pledge or otherwise dispose of, directly or indirectly, or file with the SEC a registration statement under the Securities Act of 1933 (the "Securities Act") relating to, any shares of our common stock or securities convertible into or exchangeable or exercisable for any shares of our common stock, enter into a transaction that would have the same effect, or enter into any swap, hedge or other arrangement that transfers, in whole or in part, any of the economic consequences of ownership of our common stock, whether any of these transactions are to be settled by delivery of our common stock or other securities, in cash or otherwise, or publicly disclose the intention to make any offer, sale, pledge, disposition or filing, without the prior written consent of the Representatives for a period of 180 days after the date of this prospectus. However, in the event that either (1) during the last 17 days of the "lock-up" period, we release earnings results or material news or a material event relating to us occurs or (2) prior to the expiration of the "lock-up" period, we announce that we will release earnings results during the 16-day period beginning on the last day of the "lock-up" period, then in either case the expiration of the "lock-up" will be extended until the expiration of the 18-day period beginning on the date of the release of the earnings results or the occurrence of the material news or event, as applicable, unless the Representatives waive, in writing, such an extension.
Our officers, directors and the selling shareholders have agreed, subject to certain exceptions, that they will not offer, sell, contract to sell, pledge or otherwise dispose of, directly or indirectly, any shares of our common stock or securities convertible into or exchangeable or exercisable for any shares of our common stock, enter into a transaction that would have the same effect, or enter into any swap, hedge or other arrangement that transfers, in whole or in part, any of the economic consequences of ownership of our common stock, whether any of these transactions are to be settled by delivery of our common stock or other securities, in cash or otherwise, or publicly disclose the intention to make any offer, sale, pledge or disposition, or to enter into any transaction, swap, hedge or other arrangement, without, in each case, the prior written consent of the Representatives for a period of 180 days after the date of this prospectus. However, in the event that either (1) during the last 17 days of the "lock-up" period, we release earnings results or material news or a material event relating to us occurs or (2) prior to the expiration of the "lock-up" period, we announce that we will release earnings results during the 16-day period beginning on the last day of the "lock-up" period, then in either case the expiration of the "lock-up" will be extended until the expiration of the 18-day period beginning on the date of the release of the earnings results or the occurrence of the material news or event, as applicable, unless the Representatives waive, in writing, such an extension. The Representatives, in their
145
sole discretion, may release any of the securities subject to the lock-up agreements contemplated in this section at any time, which, in the case of officers and directors, shall be with notice.
At our request, the underwriters have reserved up to 5% of the common stock being offered by this prospectus for sale at the initial public offering price to our directors, officers, employees and other individuals associated with us and members of their families. The sales will be made by UBS Financial Services Inc., a selected dealer affiliated with UBS Securities LLC, an underwriter of this offering, through a directed share program. We do not know if these persons will choose to purchase all or any portion of these reserved shares, but any purchases they do make will reduce the number of shares available to the general public. Any reserved shares not so purchased will be offered by the underwriters to the general public on the same terms as the other shares of common stock. Participants in the directed share program shall be subject to a 25-day lock-up with respect to any shares sold to them pursuant to that program. This lock-up will have similar restrictions (other than the extension provision) to the lock-up agreements described above. Any shares sold in the directed share program to our directors, executive officers or selling stockholders shall be subject to the lock-up agreements described in the preceding paragraph.
We have been approved, subject to official notice of issuance, to list our common stock on the NYSE under the symbol "DOR".
In connection with the listing of the common stock on the NYSE, the underwriters will undertake to sell round lots of 100 shares or more to the minimum number of beneficial owners necessary to meet the NYSE distribution requirements for trading.
Prior to this offering, there has been no public market for our common stock. The initial public offering price has been determined by a negotiation among us, the selling stockholders and the Representatives and will not necessarily reflect the market price of our common stock following the offering. The principal factors that were considered in determining the public offering price included:
- •
- the information presented in this prospectus;
- •
- the history of and prospects for the industry in which we will compete;
- •
- the ability of our management;
- •
- the prospects for our future earnings;
- •
- the present state of our development and current financial condition;
- •
- the recent market prices of, and the demand for, publicly traded shares of generally comparable companies; and
- •
- the general condition of the securities markets at the time of this offering.
We offer no assurances that the initial public offering price will correspond to the price at which shares of our common stock will trade in the public market subsequent to the offering or that an active trading market for our common stock will develop and continue after the offering.
In connection with the offering the underwriters may engage in stabilizing transactions, over-allotment transactions, syndicate covering transactions and penalty bids in accordance with Regulation M under the Exchange Act.
- •
- Stabilizing transactions permit bids to purchase the underlying security so long as the stabilizing bids do not exceed a
specified maximum.
- •
- Over-allotment involves sales by the underwriters of shares in excess of the number of shares the underwriters are obligated to purchase, which creates a syndicate short position. The short position may be either a covered short position or a naked short position. In a covered short position, the number of shares over-allotted by the underwriters is not greater than the number of shares that they may purchase in the over-allotment option. In a naked short position, the
146
- •
- Syndicate covering transactions involve purchases of the common stock in the open market after the distribution has been
completed in order to cover syndicate short positions. In determining the source of shares to close out the short position, the underwriters will consider, among other things, the price of shares
available for purchase in the open market as compared to the price at which they may purchase shares through the over-allotment option. If the underwriters sell more shares than could be
covered by the over-allotment option, a naked short position, the position can only be closed out by buying shares in the open market. A naked short position is more likely to be created
if the underwriters are concerned that there could be downward pressure on the price of the shares in the open market after pricing that could adversely affect investors who purchase in the offering.
- •
- Penalty bids permit the Representatives to reclaim a selling concession from a syndicate member when the common stock originally sold by the syndicate member is purchased in a stabilizing or syndicate covering transaction to cover syndicate short positions.
number of shares involved is greater than the number of shares in the over-allotment option. The underwriters may close out any covered short position by either exercising their over-allotment option and/or purchasing shares in the open market.
These stabilizing transactions, syndicate covering transactions and penalty bids, as well as purchases by the underwriters for their own accounts, may have the effect of raising or maintaining the market price of our common stock or preventing or retarding a decline in the market price of the common stock. As a result the price of our common stock may be higher than the price that might otherwise exist in the open market. These transactions may be effected on the NYSE or otherwise and, if commenced, may be discontinued at any time.
Conflicts of Interest
The underwriters are full service financial institutions engaged in various activities, which may include securities trading, commercial and investment banking, financial advisory, investment management, principal investment, hedging, financing and brokerage activities. Certain of the underwriters and their respective affiliates have, from time to time, performed, and may in the future perform, various financial advisory, lending and investment banking services for us and our affiliates, for which they received or will receive customary fees and reimbursement of expenses. In the ordinary course of their various business activities, certain of the underwriters and their respective affiliates may make or hold a broad array of investments and actively trade debt and equity securities (or related derivative securities) and financial instruments (which may include bank loans and/or credit default swaps) for their own account and for the accounts of their customers and may at any time hold long and short positions in such securities and instruments. Such investment and securities activities may involve our securities and instruments.
In addition, affiliates of Citigroup Global Markets Inc., Credit Suisse Securities (USA) LLC, Deutsche Bank Securities Inc., UBS Securities LLC, Capital One Southcoast, Inc., IBERIA Capital Partners L.L.C., Natixis Securities Americas LLC and RBS Securities Inc. are lenders, and in several cases, agents for the lenders, under our credit facility and may receive more than 5% of the net proceeds of this offering in connection with our repayment of outstanding borrowings under our credit facility. See "Use of Proceeds" on page 43. A "conflict of interest" under Rule 5121 of FINRA is therefore deemed to exist. Accordingly, this offer is being made in compliance with Rule 5121. Rule 5121 requires that a "qualified independent underwriter" participate in the preparation of this prospectus and the registration statement of which this prospectus is a part and exercise the usual standards of due diligence with respect thereto. Rule 5121 also requires that the initial offering price of the shares of common stock must not be higher than that recommended by the qualified independent underwriter. Tudor, Pickering, Holt & Co. ("Tudor Pickering") has assumed the responsibilities of acting as the qualified independent underwriter in this offering. No underwriter having a conflict of
147
interest under FINRA Rule 5121 will confirm sales to any account over which the underwriter exercises discretionary authority without the specific written approval of the accountholder. We will not pay Tudor Pickering any compensation for its role. We have agreed to indemnify Tudor Pickering against liabilities incurred in connection with acting as a qualified independent underwriter, including liabilities under the Securities Act.
We and the selling stockholders have agreed to indemnify the underwriters against liabilities under the Securities Act or contribute to payments that the underwriters may be required to make in that respect.
Sales Outside of the United States
The shares of our common stock are offered for sale in those jurisdictions in the United States, Europe, Asia and elsewhere where it is lawful to make such offers.
Each of the underwriters has represented and agreed that it has not offered, sold or delivered and will not offer, sell or deliver any of the shares of our common stock directly or indirectly, or distribute this prospectus or any other offering material relating to the shares, in or from any jurisdiction except under circumstances that will result in compliance with the applicable laws and regulations thereof and that will not impose any obligations on us except as set forth in the underwriting agreement.
Notice to Prospective Investors in the European Economic Area
In relation to each member state of the European Economic Area that has implemented the Prospectus Directive (each, a "Relevant Member State"), with effect from and including the date on which the Prospectus Directive is implemented in that relevant member state (the "Relevant Implementation Date"), an offer of the shares of our common stock described in this prospectus may not be made to the public in that Relevant Member State other than:
- •
- to any legal entity which is a qualified investor as defined in the Prospectus Directive;
- •
- to fewer than 100 or, if the Relevant Member State has implemented the relevant provision of the 2010 PD Amending
Directive, 150 natural or legal persons (other than qualified investors as defined in the Prospectus Directive), as permitted under the Prospectus Directive, subject to obtaining the prior consent of
the relevant Dealer or Dealers nominated by us for any such offer; or
- •
- in any other circumstances falling within Article 3(2) of the Prospectus Directive,
provided that no such offer of our common stock shall require us or any underwriter to publish a prospectus pursuant to Article 3 of the Prospectus Directive.
For purposes of this provision, the expression an "offer of securities to the public" in any Relevant Member State means the communication in any form and by any means of sufficient information on the terms of the offer and the shares of our common stock to be offered so as to enable an investor to decide to purchase or subscribe for the shares, as the expression may be varied in that member state by any measure implementing the Prospectus Directive in that member state, and the expression "Prospectus Directive" means Directive 2003/71/EC (and amendments thereto, including the 2010 PD Amending Directive, to the extent implemented in the Relevant Member State) and includes any relevant implementing measure in the Relevant Member State. The expression "2010 PD Amending Directive" means Directive 2010/73/EU.
The sellers of the shares of our common stock have not authorized and do not authorize the making of any offer of the shares through any financial intermediary on their behalf, other than offers made by the underwriters with a view to the final placement of the shares as contemplated in this prospectus. Accordingly, no purchaser of the shares of our common stock, other than the underwriters, is authorized to make any further offer of the shares on behalf of the sellers or the underwriters.
148
Notice to Prospective Investors in the United Kingdom
This prospectus is only being distributed to, and is only directed at, persons in the United Kingdom that are "qualified investors" within the meaning of Article 2(1)(e) of the Prospectus Directive that are also (i) investment professionals falling within Article 19(5) of the Financial Services and Markets Act 2000 (Financial Promotion) Order 2005 (the "Order") or (ii) high net worth entities, and other persons to whom it may lawfully be communicated, falling within Article 49(2)(a) to (d) of the Order (each such person being referred to as a "relevant person"). This prospectus and its contents are confidential and should not be distributed, published or reproduced (in whole or in part) or disclosed by recipients to any other persons in the United Kingdom. Any person in the United Kingdom that is not a relevant person should not act or rely on this document or any of its contents.
Notice to Prospective Investors in France
Neither this prospectus nor any other offering material relating to the shares described in this prospectus has been submitted to the clearance procedures of the Autorité des Marchés Financiers or of the competent authority of another member state of the European Economic Area and notified to the Autorité des Marchés Financiers. The shares have not been offered or sold and will not be offered or sold, directly or indirectly, to the public in France. Neither this prospectus nor any other offering material relating to the shares has been or will be:
- •
- released, issued, distributed or caused to be released, issued or distributed to the public in France;
or
- •
- used in connection with any offer for subscription or sale of the shares to the public in France.
Such offers, sales and distributions will be made in France only:
- •
- to qualified investors (investisseurs qualifiés) and/or to
a restricted circle of investors (cercle restreint d'investisseurs), in each case investing for their own account, all as defined in, and in accordance
with articles L.411-2, D.411-1, D.411-2, D.734-1, D.744-1, D.754-1 and D.764-1 of the French Code monétaire et financier;
- •
- to investment services providers authorized to engage in portfolio management on behalf of third parties;
or
- •
- in a transaction that, in accordance with article L.411-2-II-1°-or-2°-or 3° of the French Code monétaire et financier and article 211-2 of the General Regulations (Règlement Général) of the Autorité des Marchés Financiers, does not constitute a public offer (appel public à l'épargne).
The shares may be resold directly or indirectly, only in compliance with articles L.411-1, L.411-2, L.412-1 and L.621-8 through L.621-8-3 of the French Code monétaire et financier.
Notice to Prospective Investors in Hong Kong
The shares may not be offered or sold in Hong Kong by means of any document other than (i) in circumstances which do not constitute an offer to the public within the meaning of the Companies Ordinance (Cap. 32, Laws of Hong Kong), or (ii) to "professional investors" within the meaning of the Securities and Futures Ordinance (Cap. 571, Laws of Hong Kong) and any rules made thereunder, or (iii) in other circumstances which do not result in the document being a "prospectus" within the meaning of the Companies Ordinance (Cap. 32, Laws of Hong Kong), and no advertisement, invitation or document relating to the shares may be issued or may be in the possession of any person for the purpose of issue (in each case whether in Hong Kong or elsewhere), which is directed at, or the contents of which are likely to be accessed or read by, the public in Hong Kong (except if permitted to do so under the laws of Hong Kong) other than with respect to shares which are or are intended to be disposed of only to persons outside Hong Kong or only to "professional investors" within the meaning
149
of the Securities and Futures Ordinance (Cap. 571, Laws of Hong Kong) and any rules made thereunder.
Notice to Prospective Investors in Singapore
This prospectus has not been registered as a prospectus with the Monetary Authority of Singapore. Accordingly, this prospectus and any other document or material in connection with the offer or sale, or invitation for subscription or purchase, of the shares may not be circulated or distributed, nor may the shares be offered or sold, or be made the subject of an invitation for subscription or purchase, whether directly or indirectly, to persons in Singapore other than (i) to an institutional investor under Section 274 of the Securities and Futures Act, Chapter 289 of Singapore (the "SFA"), (ii) to a relevant person, or any person pursuant to Section 275(1A), and in accordance with the conditions, specified in Section 275 of the SFA or (iii) otherwise pursuant to, and in accordance with the conditions of, any other applicable provision of the SFA, in each case subject to compliance with conditions set forth in the SFA.
Where the shares are subscribed or purchased under Section 275 by a relevant person which is:
- •
- a corporation (which is not an accredited investor (as defined in Section 4A of the SFA)) the sole business of
which is to hold investments and the entire share capital of which is owned by one or more individuals, each of whom is an accredited investor; or
- •
- a trust (where the trustee is not an accredited investor) whose sole purpose is to hold investments and each beneficiary of the trust is an individual who is an accredited investor,
shares, debentures and units of shares and debentures of that corporation or the beneficiaries' rights and interest (howsoever described) in that trust shall not be transferred within six months after that corporation or that trust has acquired the shares under Section 275 of the SFA except:
- •
- to an institutional investor (for corporations, under Section 274 of the SFA) or to a relevant person defined in
Section 275(2) of the SFA, or to any person pursuant to an offer that is made on terms that such shares, debentures and units of shares and debentures of that corporation or such rights and
interest in that trust are acquired at a consideration of not less than S$200,000 (or its equivalent in a foreign currency) for each transaction, whether such amount is to be paid for in cash or by
exchange of securities or other assets, and further for corporations, in accordance with the conditions specified in Section 275 of the SFA
- •
- where no consideration is or will be given for the transfer; or
- •
- where the transfer is by operation of law.
Notice to Prospective Investors in Japan
The shares offered in this prospectus have not been and will not be registered under the Securities and Exchange Law of Japan and each underwriter has agreed that it will not offer or sell any shares, directly or indirectly, in Japan or to, or for the benefit of, any resident of Japan (which term as used herein means any person resident in Japan, including any corporation or other entity organized under the laws of Japan), or to others for re-offering or resale, directly or indirectly, in Japan or to a resident of Japan, except pursuant to an exemption from the registration requirements of, and otherwise in compliance with, the Securities and Exchange Law of Japan and any other applicable laws, regulations and ministerial guidelines of Japan.
A prospectus in electronic format may be made available on the web sites maintained by one or more of the underwriters, or selling group members, if any, participating in this offering and one or more of the underwriters participating in this offering may distribute prospectuses electronically. The representatives may agree to allocate a number of shares to underwriters and selling group members for sale to their online brokerage account holders. Internet distributions will be allocated by the underwriters and selling group members that will make internet distributions on the same basis as other allocations.
150
The validity of our common stock offered by this prospectus will be passed upon for us by Vinson & Elkins L.L.P., Houston, Texas. Certain legal matters in connection with this offering will be passed upon for the underwriters by Latham & Watkins LLP, Houston, Texas.
The consolidated financial statements of Dynamic Offshore Holding, LP as of December 31, 2009 and 2010 and for each of the years ended December 31, 2008, 2009 and 2010, included in this prospectus have been so included in reliance on the report of Hein & Associates LLP, an independent registered public accounting firm, given on the authority of said firm as experts in auditing and accounting.
The balance sheet of Dynamic Offshore Resources, Inc. as of September 30, 2011, included in this prospectus has been so included in reliance on the report of Hein & Associates LLP, an independent registered public accounting firm, given on the authority of said firm as experts in auditing and accounting.
The financial statements of SPN Resources LLC for the period from January 1, 2008 through March 13, 2008, included in this prospectus have been so included in reliance on the report of Hein & Associates LLP, an independent registered public accounting firm, given on the authority of said firm as experts in auditing and accounting.
The consolidated financial statements of Northstar Exploration & Production, Inc. for the period from January 1, 2008 through July 16, 2008, included in this prospectus have been so included in reliance on the report of Hein & Associates LLP, an independent registered public accounting firm, given on the authority of said firm as experts in auditing and accounting.
The financial statements of Beryl Oil and Gas LP as of December 31, 2008, and for the year then ended have been included herein in reliance upon the report of KPMG LLP, independent registered public accounting firm, appearing elsewhere herein, and upon the authority of said firm as experts in accounting and auditing.
The financial statements of Beryl Oil and Gas LP for the period from January 1, 2009 through October 12, 2009, included in this prospectus have been so included in reliance on the report of Hein & Associates LLP, an independent registered public accounting firm, given on the authority of said firm as experts in auditing and accounting.
The statement of revenues and direct operating expenses of the Samson Acquisition Properties for the period from January 1, 2010 through July 7, 2010, included in this prospectus have been so included in reliance on the report of Hein & Associates LLP, an independent registered public accounting firm, given on the authority of said firm as experts in auditing and accounting.
The information included in this prospectus regarding estimated quantities of proved and probable reserves, the future net revenues from those reserves and their present value as of July 31, 2011 is based, in part, on estimates of the proved reserves and present values of proved reserves as of July 31, 2011, which are based on reports prepared by Netherland, Sewell & Associates, Inc., independent reserve engineers. These estimates are included in this prospectus in reliance upon the authority of such firm as an expert in these matters.
151
WHERE YOU CAN FIND MORE INFORMATION
We have filed with the SEC a registration statement on Form S-1 (including the exhibits, schedules and amendments thereto) under the Securities Act, with respect to the shares of our common stock offered hereby. This prospectus does not contain all of the information set forth in the registration statement and the exhibits and schedules thereto. For further information with respect to us and the common stock offered hereby, we refer you to the registration statement and the exhibits and schedules filed therewith. Statements contained in this prospectus as to the contents of any contract, agreement or any other document are summaries of the material terms of this contract, agreement or other document. With respect to each of these contracts, agreements or other documents filed as an exhibit to the registration statement, reference is made to the exhibits for a more complete description of the matter involved. A copy of the registration statement, and the exhibits and schedules thereto, may be inspected without charge at the public reference facilities maintained by the SEC at 100 F Street NE, Washington, D.C. 20549. Copies of these materials may be obtained, upon payment of a duplicating fee, from the Public Reference Section of the SEC at 100 F Street NE, Washington, D.C. 20549. Please call the SEC at 1-800-SEC-0330 for further information on the operation of the public reference facility. The SEC maintains a website that contains reports, proxy and information statements and other information regarding registrants that file electronically with the SEC. The address of the SEC's website is www.sec.gov.
152
F-1
F-2
DYNAMIC OFFSHORE RESOURCES, INC.
UNAUDITED PRO FORMA CONDENSED FINANCIAL STATEMENTS
The following unaudited pro forma condensed financial statements of Dynamic Offshore Resources, Inc. reflect the unaudited and audited historical results of Dynamic Offshore Holding, LP, our accounting predecessor, on a pro forma basis to give effect to the "XTO Properties Acquisition," the "Samson Properties Acquisition" and the "Reorganization and Offering," each of which is described below. Please read Note 1—Basis of Presentation, the Offering and Corporate Reorganization.
The unaudited pro forma financial information for the year ended December 31, 2010 and the nine months ended September 30, 2011 was prepared as if each of these transactions occurred on January 1, 2010. The unaudited pro forma financial information as of September 30, 2011 was prepared as if the Reorganization and Offering had occurred on September 30, 2011.
The unaudited pro forma financial statements do not reflect the pro forma effect of any of our other recent acquisitions discussed in this prospectus, as they were deemed not significant. We believe that the assumptions used to prepare the unaudited pro forma financial statements provide a reasonable basis for presenting the significant effects directly attributable to the transactions. The following unaudited pro forma financial statements do not purport to represent what our results of operations or financial condition would have been if the transactions had occurred on the dates assumed and should be read in conjunction with our historical consolidated financial statements and the notes to those financial statements and the accompanying statements of revenues and direct operating expenses for the XTO Properties Acquisition and for the Samson Properties Acquisition included elsewhere in this prospectus. The unaudited pro forma financial statements below are also not indicative of our financial condition or results of operations going forward due to both changes in the business and the omission of various operating expenses. Production and reserves, as well as costs and expenses, associated with the acquired properties as operated by us may differ significantly from those characteristics when such properties were operated by their previous owners. During the periods presented, the acquired properties were not accounted for as separate business units. As such, certain costs, such as depreciation, depletion and amortization, accretion of asset retirement obligations, general and administrative expense and interest expense were not allocated to the acquired properties.
XTO Properties Acquisition
On August 31, 2011 we acquired from XTO Offshore Inc., HHE Energy Company and XH, LLC, each an indirect subsidiary of Exxon Mobil Corporation ("Exxon"), certain oil and natural gas interests in the Gulf of Mexico for approximately $173.7 million. The properties acquired are composed of substantially all of the Gulf of Mexico assets that Exxon acquired as part of its acquisition of XTO Energy, Inc. in 2010.
Samson Properties Acquisition
In July 2010, we acquired the shallow water Gulf of Mexico assets of Samson Resources for approximately $98 million.
Reorganization and Offering
Pursuant to the terms of a corporate reorganization that will be completed immediately prior to the closing of this offering, Dynamic Offshore Holding, LP will merge into its wholly owned subsidiary, Dynamic Offshore Resources, Inc., and all limited partner interests in Dynamic Offshore Holding, LP
F-3
DYNAMIC OFFSHORE RESOURCES, INC.
UNAUDITED PRO FORMA CONDENSED FINANCIAL STATEMENTS (Continued)
will be converted into the right to receive common stock of Dynamic Offshore Resources, Inc. For more information regarding our corporate reorganization, please read "Corporate Reorganization."
For the purposes of the unaudited pro forma condensed financial statements, the offering is assumed to consist of the issuance and sale to the public by us of shares of common stock for $300 million and our application of the net proceeds as described in "Use of Proceeds" in this prospectus.
F-4
DYNAMIC OFFSHORE RESOURCES, INC.
UNAUDITED PRO FORMA CONDENSED BALANCE SHEET
September 30, 2011
(In thousands)
| |
Historical | |
|
|||||||||
|---|---|---|---|---|---|---|---|---|---|---|---|---|
| |
Dynamic Offshore Holding, LP |
Reorganization and Offering |
Pro Forma | |||||||||
Assets |
||||||||||||
Current assets: |
||||||||||||
Cash and cash equivalents |
$ | 18,765 | $ | 1 | (c) | $ | 18,766 | |||||
|
300,000 | (d) | ||||||||||
|
(19,500 | )(e) | ||||||||||
|
(3,500 | )(f) | ||||||||||
|
(277,000 | )(g) | ||||||||||
Accounts receivable |
79,054 | — | 79,054 | |||||||||
Derivative assets |
33,548 | — | 33,548 | |||||||||
Other current assets |
22,391 | (3,000 | )(c) | 19,391 | ||||||||
Total current assets |
153,758 | (2,999 | ) | 150,759 | ||||||||
Property and equipment, net |
1,145,544 | — | 1,145,544 | |||||||||
Other assets |
44,872 | — | 44,872 | |||||||||
Long-term derivative assets |
30,592 | — | 30,592 | |||||||||
Total assets |
$ | 1,374,766 | $ | (2,999 | ) | $ | 1,371,767 | |||||
Liabilities and Owners' Equity |
||||||||||||
Current liabilities: |
||||||||||||
Accounts payable |
$ | 31,840 | $ | — | $ | 31,840 | ||||||
Asset retirement obligations |
42,494 | — | 42,494 | |||||||||
Other current liabilities |
54,960 | 8,000 | (c) | 62,960 | ||||||||
Total current liabilities |
129,294 | 8,000 | 137,294 | |||||||||
Long-term debt |
385,000 | (277,000 | )(g) | 108,000 | ||||||||
Asset retirement obligations |
264,029 | — | 264,029 | |||||||||
Deferred income taxes |
48,017 | 92,000 | (c) | 140,017 | ||||||||
Other long-term liabilities |
17,847 | — | 17,847 | |||||||||
Total liabilities |
844,187 | (177,000 | ) | 667,187 | ||||||||
Common stockholders' equity |
— | 1 | (c) | 704,580 | ||||||||
|
530,579 | (c) | ||||||||||
|
(103,000 | )(c) | ||||||||||
|
300,000 | (d) | ||||||||||
|
(19,500 | )(e) | ||||||||||
|
(3,500 | )(f) | ||||||||||
Partners' capital |
530,579 | (530,579 | )(c) | — | ||||||||
Total liabilities and owners' equity |
$ | 1,374,766 | $ | (2,999 | ) | $ | 1,371,767 | |||||
See notes to unaudited pro forma condensed financial statements
F-5
DYNAMIC OFFSHORE RESOURCES, INC.
UNAUDITED PRO FORMA CONDENSED STATEMENT OF OPERATIONS
Nine Months Ended September 30, 2011
(In thousands, except per share amounts)
| |
Historical | |
|
|||||||||||
|---|---|---|---|---|---|---|---|---|---|---|---|---|---|---|
| |
Dynamic Offshore Holding, LP | XTO Acquisition Properties | Pro forma Adjustments | Pro Forma | ||||||||||
Operating revenues |
$ | 352,467 | $ | 95,638 | — | 448,105 | ||||||||
Operating expenses: |
||||||||||||||
Lease operating expense |
78,998 | 19,607 | — | 98,605 | ||||||||||
Exploration expense |
7,285 | — | — | 7,285 | ||||||||||
Depreciation, depletion and amortization |
102,417 | — | 29,872 | (a) | 132,289 | |||||||||
General and administrative expense |
19,328 | — | — | 19,328 | ||||||||||
Other operating expense |
51,709 | 4,125 | 2,494 | (a) | 58,328 | |||||||||
|
259,737 | 23,732 | 32,366 | 315,835 | ||||||||||
Income (loss) from operations |
92,730 | 71,906 | (32,366 | ) | 132,270 | |||||||||
Other income (expense): |
||||||||||||||
Interest expense, net |
(6,409 | ) | — | (3,504) | (a) | (4,324 | ) | |||||||
|
5,589 | (g) | ||||||||||||
Commodity derivative income |
61,889 | — | — | 61,889 | ||||||||||
Other |
(146 | ) | — | — | (146 | ) | ||||||||
Income (loss) before income taxes |
148,064 | 71,906 | (30,281 | ) | 189,689 | |||||||||
Income tax benefit (expense) |
1,544 | — | (67,931) | (h) | (66,387 | ) | ||||||||
Net income (loss) |
149,608 | 71,906 | (98,212 | ) | 123,302 | |||||||||
Less: Net income (loss) attributable to noncontrolling interests |
460 | — | (161) | (h) | 299 | |||||||||
Net income (loss) attributable to Dynamic Offshore Holding, LP/Dynamic Offshore Resources, Inc. |
$ | 149,148 | $ | 71,906 | $ | (98,051 | ) | $ | 123,003 | |||||
Net income per common share |
$ | 1.74 | ||||||||||||
Weighted average number of common shares outstanding |
70,533 | |||||||||||||
See notes to unaudited pro forma condensed financial statements
F-6
DYNAMIC OFFSHORE RESOURCES, INC.
UNAUDITED PRO FORMA CONDENSED STATEMENT OF OPERATIONS
Year Ended December 31, 2010
(In thousands, except per share amounts)
| |
Historical | |
|
||||||||||||||
|---|---|---|---|---|---|---|---|---|---|---|---|---|---|---|---|---|---|
| |
Dynamic Offshore Holding, LP | Samson Acquisition Properties(b) | XTO Acquisition Properties(a) | Pro Forma Adjustments | Pro Forma | ||||||||||||
Operating revenues |
$ | 358,627 | $ | 36,328 | $ | 154,367 | — | 549,322 | |||||||||
Operating expenses: |
|||||||||||||||||
Lease operating expense |
89,399 | 5,068 | 31,668 | — | 126,135 | ||||||||||||
Exploration expense |
2,100 | — | — | — | 2,100 | ||||||||||||
Depreciation, depletion and amortization |
195,122 | — | — | 15,620 | (b) | 271,568 | |||||||||||
|
60,826 | (a) | |||||||||||||||
General and administrative expense |
24,328 | — | — | — | 24,328 | ||||||||||||
Other operating expense |
73,047 | 38 | 5,862 | 404 | (b) | 82,931 | |||||||||||
|
3,580 | (a) | |||||||||||||||
|
383,996 | 5,106 | 37,530 | 80,430 | 507,062 | ||||||||||||
Income (loss) from operations |
(25,369 | ) | 31,222 | 116,837 | (80,430 | ) | 42,260 | ||||||||||
Other income (expense): |
|||||||||||||||||
Interest expense, net |
(13,541 | ) | — | — | (819) | (b) | (12,123 | ) | |||||||||
|
(5,284) | (a) | |||||||||||||||
|
7,521 | (g) | |||||||||||||||
Commodity derivative income |
6,990 | — | — | — | 6,990 | ||||||||||||
Bargain purchase gain |
4,024 | — | — | — | 4,024 | ||||||||||||
Other |
(1,080 | ) | — | — | — | (1,080 | ) | ||||||||||
Income (loss) before income taxes |
(28,976 | ) | 31,222 | 116,837 | (79,012 | ) | 40,071 | ||||||||||
Income tax benefit (expense) |
14,814 | — | — | (29,533) | (h) | (14,719 | ) | ||||||||||
Net income (loss) |
(14,162 | ) | 31,222 | 116,837 | (108,545 | ) | 25,352 | ||||||||||
Less: Net income (loss) attributable to noncontrolling interests |
(4,070 | ) | — | — | 1,425 | (h) | (2,645 | ) | |||||||||
Net income (loss) attributable to Dynamic Offshore Resources, Inc. |
$ | (10,092 | ) | $ | 31,222 | $ | 116,837 | $ | (109,970 | ) | $ | 27,997 | |||||
Net income per common share |
$ | 0.40 | |||||||||||||||
Weighted average number of common shares outstanding |
70,533 | ||||||||||||||||
See notes to unaudited pro forma condensed financial statements
F-7
DYNAMIC OFFSHORE RESOURCES, INC.
NOTES TO UNAUDITED PRO FORMA CONDENSED FINANCIAL STATEMENTS
Except as noted within the context of each footnote disclosure, the dollar amounts presented in the tabular data within these footnote disclosures are stated in thousands of dollars.
Note 1—Basis of Presentation, the Offering and Corporate Reorganization
The historical financial information is derived from the historical balance sheet of Dynamic Offshore Resources, Inc., the historical consolidated financial statements of Dynamic Offshore Holding, LP, the historical statements of revenue and direct operating expenses of the XTO Acquisition Properties and the historical statement of revenues and direct operating expenses of the Samson Acquisition Properties. The unaudited pro forma condensed financial information has been prepared by applying pro forma adjustments to the historical audited and unaudited financial statements of Dynamic Offshore Holding, LP. The pro forma adjustments have been prepared as if our acquisitions of the Samson Acquisition Properties and the XTO Acquisition Properties and our corporate reorganization to be effected at the closing of this offering had taken place as of January 1, 2010, in the case of the pro forma statements of operations for the year ended December 31, 2010 and the nine months ended September 30, 2011, and as if our corporate reorganization had taken place on September 30, 2011, in the case of the pro forma balance sheet as of September 30, 2011.
Upon completion of this offering, we anticipate incurring incremental general and administrative expenses of approximately $0.4 million per year (not including non-cash costs related to incremental executive compensation) related to being a publicly traded company, including compensation and benefit expenses of our executive management personnel, costs associated with annual and quarterly reports to shareholders, investor relations activities, registrar and transfer agent fees, incremental director and officer liability insurance costs and director compensation. The unaudited pro forma condensed financial statements do not reflect these anticipated incremental general and administrative expenses.
Note 2—Pro Forma Adjustments and Assumptions
Purchase of XTO Acquisition Properties
Our purchase of the XTO Acquisition Properties was completed on August 31, 2011. As a result, the acquisition is included in the historical financial statements of Dynamic Offshore Holding, LP with effect from that date.
- (a)
- Reflects
our purchase of the XTO Acquisition Properties, including:
- •
- depreciation, depletion and amortization expense and accretion expense based on our preliminary fair value determination
and our closing date oil and gas reserve estimates;
- •
- interest expense on $173.7 million in borrowings for the year ended December 31, 2010 and for the period from January 1, 2011 through August 31, 2011, at an estimated annual rate of approximately 3.0%. A one percentage point change in the interest rate would change pro forma interest expense by $1.7 million for the year ended December 31, 2010 and $1.2 million for the nine months ended September 30, 2011.
Purchase of Samson Acquisition Properties
Our purchase of the Samson Acquisition Properties was completed on July 8, 2010. As a result, the acquisition is included in the historical financial statements of Dynamic Offshore Holding, LP with effect from that date.
F-8
DYNAMIC OFFSHORE RESOURCES, INC.
NOTES TO UNAUDITED PRO FORMA CONDENSED FINANCIAL STATEMENTS (Continued)
Note 2—Pro Forma Adjustments and Assumptions (Continued)
- (b)
- Reflects
our purchase of the Samson Acquisition Properties, including:
- •
- depreciation, depletion and amortization expense and accretion expense based on our fair value determination of the assets
acquired and liabilities assumed in the acquisition and our closing date oil and gas reserve estimates;
- •
- interest expense on $57.0 million in borrowings under our revolving credit facility for the period from January 1, 2010 through July 7, 2010, at an estimated annual rate of approximately 3.0%. A one percentage point change in the interest rate would change pro forma interest expense by $0.3 million for the year ended December 31, 2010.
Reorganization and Offering
- (c)
- Reflects
the merger of Dynamic Offshore Resources, Inc. and Dynamic Offshore Holding, LP, together with the recognition of
$103.0 million of additional net deferred tax liability, consisting of a net $11.0 million current deferred tax liability and a $92.0 million long-term deferred tax
liability.
- (d)
- Reflects
the gross proceeds to us of $300.0 million from the issuance and sale of common shares in this offering.
- (e)
- Reflects
the payment of estimated underwriting discounts of $19.5 million.
- (f)
- Reflects
the payment of $3.5 million in estimated expenses associated with this offering.
- (g)
- Reflects
the repayment of $277.0 million of borrowings by us under our credit facility from the net offering proceeds and the reversal of the
associated interest expense.
- (h)
- Reflects income tax expense at a statutory rate of 35%, calculated as follows:
| |
Nine Months Ended September 30, 2011 |
Year Ended December 31, 2010 |
|||||
|---|---|---|---|---|---|---|---|
Pro forma income before income taxes |
$ | 189,689 | $ | 40,071 | |||
Less net loss previously taxed |
(4,399 | ) | (44,309 | ) | |||
Pro forma income not previously taxed |
$ | 194,008 | $ | 84,380 | |||
Income tax expense at the 35% statutory rate |
$ | 67,931 | $ | 29,533 | |||
Income tax adjustment on income (loss) attributable to noncontrolling interest at the 35% statutory rate |
$ | (161 | ) | $ | 1,425 | ||
The effective rate on the net loss previously taxed differs from the 35% statutory rate due to IRS audit and return to provision adjustments for the year ended December 31, 2010.
Note 3—Pro Forma Net Income Per Share
Pro forma net income per common share is determined by dividing the pro forma net income by the weighted average number of common shares expected to be outstanding. All shares were assumed to have been outstanding since January 1, 2010.
F-9
DYNAMIC OFFSHORE RESOURCES, INC.
NOTES TO UNAUDITED PRO FORMA CONDENSED FINANCIAL STATEMENTS (Continued)
Summary Pro Forma Oil and Gas Reserve Information
Except as noted within the context of each footnote disclosure, the dollar amounts presented in the tabular data within these footnote disclosures are stated in thousands of dollars.
The following table sets forth summary pro forma information with respect to estimated net proved oil and gas reserves as of December 31, 2010.
Estimated Quantities of Oil and Gas Reserves at December 31, 2010
| |
Historical | |
|||||||||
|---|---|---|---|---|---|---|---|---|---|---|---|
| |
Dynamic Offshore Holding, L.P. |
XTO Acquisition Properties |
Pro Forma | ||||||||
Proved Reserves |
|||||||||||
Oil (MBbl) |
24,344 | 5,755 | 30,099 | ||||||||
Natural gas (MMcf) |
123,703 | 54,732 | 178,435 | ||||||||
MBOE |
44,961 | 14,877 | 59,838 | ||||||||
Proved Developed Reserves |
|||||||||||
Oil (MBbl) |
20,191 | 4,958 | 25,149 | ||||||||
Natural gas (MMcf) |
110,253 | 36,878 | 147,131 | ||||||||
MBOE |
38,567 | 11,104 | 49,671 | ||||||||
Standardized Measure of Discounted Future Net Cash Flows at December 31, 2010
| |
Historical | |
|
||||||||||
|---|---|---|---|---|---|---|---|---|---|---|---|---|---|
| |
Dynamic Offshore Holding, L.P. | XTO Acquisition Properties | Pro Forma Adjustments | Pro Forma | |||||||||
Future cash inflows |
$ | 2,528,761 | $ | 768,243 | $ | — | $ | 3,297,004 | |||||
Future production costs |
(499,846 | ) | (153,562 | ) | — | (653,408 | ) | ||||||
Future development and abandonment costs |
(511,596 | ) | (178,912 | ) | — | (690,508 | ) | ||||||
Future income tax expense |
(30,106 | ) | — | (530,495 | )(c) | (560,601 | ) | ||||||
Future net cash flows |
1,487,213 | 435,769 | (530,495 | ) | 1,392,487 | ||||||||
10% annual discount for estimated timing of cash flows |
(302,695 | ) | (101,813 | ) | 124,216 | (c) | (280,292 | ) | |||||
Standardized measure of discounted future net cash flows |
$ | 1,184,518 | $ | 333,956 | $ | (406,279 | ) | $ | 1,112,195 | ||||
F-10
DYNAMIC OFFSHORE HOLDING, LP
CONSOLIDATED BALANCE SHEETS
(In thousands)
(Unaudited)
| |
September 30, 2011 |
December 31, 2010 |
|||||||
|---|---|---|---|---|---|---|---|---|---|
Assets |
|||||||||
Current assets: |
|||||||||
Cash and cash equivalents |
$ | 18,765 | $ | 75,162 | |||||
Accounts receivable |
79,054 | 57,802 | |||||||
Derivative assets |
33,548 | 11,990 | |||||||
Current portion of notes receivable—abandonments |
4,156 | 4,922 | |||||||
Other current assets |
18,235 | 16,722 | |||||||
Total current assets |
153,758 | 166,598 | |||||||
Property and equipment: |
|||||||||
Oil and gas properties, successful efforts method |
1,603,026 | 1,220,407 | |||||||
Other property and equipment |
3,939 | 3,223 | |||||||
Accumulated depreciation, depletion and amortization |
(461,421 | ) | (358,985 | ) | |||||
Property and equipment, net |
1,145,544 | 864,645 | |||||||
Long-term derivative assets |
30,592 | 4,919 | |||||||
Notes receivable—abandonments |
17,108 | 15,274 | |||||||
Other assets |
27,764 | 15,695 | |||||||
Total assets |
$ | 1,374,766 | $ | 1,067,131 | |||||
Liabilities and Owners' Equity |
|||||||||
Current liabilities: |
|||||||||
Accounts payable—third parties |
$ | 30,715 | $ | 26,846 | |||||
Accounts payable—affiliates |
1,125 | 1,550 | |||||||
Current portion of asset retirement obligations |
42,494 | 71,225 | |||||||
Other current liabilities |
54,960 | 56,780 | |||||||
Total current liabilities |
129,294 | 156,401 | |||||||
Long-term debt |
385,000 | 203,205 | |||||||
Asset retirement obligations |
264,029 | 161,845 | |||||||
Deferred income taxes |
48,017 | 49,561 | |||||||
Other long-term liabilities |
17,847 | 20,588 | |||||||
Total liabilities |
844,187 | 591,600 | |||||||
Commitments and contingencies (see Note 14) |
|||||||||
Owners' equity: |
|||||||||
Partners' capital |
530,579 | 379,883 | |||||||
Noncontrolling interests in subsidiaries |
— | 95,648 | |||||||
Total owners' equity |
530,579 | 475,531 | |||||||
Total liabilities and owners' equity |
$ | 1,374,766 | $ | 1,067,131 | |||||
See notes to consolidated financial statements
F-11
DYNAMIC OFFSHORE HOLDING, LP
CONSOLIDATED STATEMENTS OF OPERATIONS
(In thousands, except per share amounts)
(Unaudited)
| |
Nine Months Ended September 30, |
||||||||
|---|---|---|---|---|---|---|---|---|---|
| |
2011 | 2010 | |||||||
Oil and gas revenues |
$ | 340,541 | $ | 255,496 | |||||
Other operating revenues |
11,926 | 7,770 | |||||||
|
352,467 | 263,266 | |||||||
Operating expenses: |
|||||||||
Lease operating expense |
78,998 | 63,511 | |||||||
Exploration expense |
7,285 | 1,736 | |||||||
Depreciation, depletion and amortization |
102,417 | 96,205 | |||||||
General and administrative expense |
19,328 | 19,280 | |||||||
Other operating expense |
51,709 | 50,114 | |||||||
|
259,737 | 230,846 | |||||||
Income from operations |
92,730 | 32,420 | |||||||
Other income (expense): |
|||||||||
Interest expense, net |
(6,409 | ) | (10,688 | ) | |||||
Commodity derivative income |
61,889 | 29,838 | |||||||
Bargain purchase gain |
— | 4,024 | |||||||
Other |
(146 | ) | — | ||||||
Income before income taxes |
148,064 | 55,594 | |||||||
Deferred income tax benefit |
1,544 | 4,344 | |||||||
Net income |
149,608 | 59,938 | |||||||
Less: Net income attributable to noncontrolling interests |
460 | 10,184 | |||||||
Net income attributable to Dynamic Offshore Holding, LP |
$ | 149,148 | $ | 49,754 | |||||
Pro forma information (unaudited): |
|||||||||
Income before income taxes |
$ | 148,064 | $ | 55,594 | |||||
Income tax (provision) benefit |
|||||||||
Historical |
1,544 | 4,344 | |||||||
Pro forma |
(53,362 | ) | (23,802 | ) | |||||
|
(51,818 | ) | (19,458 | ) | |||||
Pro forma net income |
96,246 | 36,136 | |||||||
Less: pro forma net income attributable to noncontrolling interest |
299 | 6,620 | |||||||
Pro forma net income attributable to Dynamic Offshore Holding, LP |
$ | 95,947 | $ | 29,516 | |||||
Pro forma basic and diluted earnings per share |
$ | 1.36 | $ | 0.42 | |||||
Pro forma basic and diluted weighted average common shares outstanding |
70,533 | 70,533 | |||||||
See notes to consolidated financial statements
F-12
DYNAMIC OFFSHORE HOLDING, LP
CONSOLIDATED STATEMENTS OF CASH FLOWS
(In thousands)
(Unaudited)
| |
Nine Months Ended September 30, |
||||||||
|---|---|---|---|---|---|---|---|---|---|
| |
2011 | 2010 | |||||||
Cash flows from operating activities: |
|||||||||
Net income |
$ | 149,608 | $ | 59,938 | |||||
Adjustments to reconcile net income to net cash |
|||||||||
provided by operating activities: |
|||||||||
Amortization in interest expense |
291 | 332 | |||||||
Accretion of asset retirement obligations |
8,897 | 9,630 | |||||||
Depreciation, depletion and amortization |
102,417 | 96,205 | |||||||
Commodity derivative income |
(61,889 | ) | (29,838 | ) | |||||
Deferred income tax benefit |
(1,544 | ) | (4,344 | ) | |||||
Bargain purchase gain |
— | (4,024 | ) | ||||||
Other |
— | 1,151 | |||||||
Gain on sale of assets |
— | (303 | ) | ||||||
Changes in operating assets and liabilities, net of acquisitions: |
|||||||||
Accounts receivable and other assets |
(21,451 | ) | 24,354 | ||||||
Accounts payable and other liabilities |
(19,727 | ) | (13,548 | ) | |||||
Net cash provided by operating activities |
156,602 | 139,553 | |||||||
Cash flows from investing activities: |
|||||||||
Additions to property and equipment |
(71,498 | ) | (55,758 | ) | |||||
Acquisitions, net of cash acquired |
(219,560 | ) | (100,146 | ) | |||||
Derivative settlements |
(5,618 | ) | 36,881 | ||||||
Proceeds from asset sales |
— | 5,447 | |||||||
Net cash used in investing activities |
(296,676 | ) | (113,576 | ) | |||||
Cash flows from financing activities: |
|||||||||
Borrowings from revolving credit facility |
390,000 | 57,000 | |||||||
Repayments of revolving credit facility |
(150,000 | ) | (30,000 | ) | |||||
Repayment of second lien term loan |
(58,205 | ) | — | ||||||
Contributions from partners |
524 | 28,571 | |||||||
Distributions to partners |
(20,244 | ) | (39,350 | ) | |||||
Distribution for net assets transferred under common control |
(68,000 | ) | — | ||||||
Commitment fees to partners |
— | (571 | ) | ||||||
Net distributions to noncontrolling interest |
— | (9,827 | ) | ||||||
Acquisition of noncontrolling interest in DBH, LLC |
(6,840 | ) | — | ||||||
Debt issuance costs |
(3,558 | ) | — | ||||||
Net cash provided by financing activities |
83,677 | 5,823 | |||||||
Net increase (decrease) in cash and cash equivalents |
(56,397 | ) | 31,800 | ||||||
Cash and cash equivalents, beginning of period |
75,162 | 88,457 | |||||||
Cash and cash equivalents, end of period |
$ | 18,765 | $ | 120,257 | |||||
See notes to consolidated financial statements
F-13
DYNAMIC OFFSHORE HOLDING, LP
CONSOLIDATED STATEMENTS OF OWNERS' EQUITY
(In thousands)
(Unaudited)
| |
Dynamic Offshore Holding, LP | |
|
||||||||||||||||
|---|---|---|---|---|---|---|---|---|---|---|---|---|---|---|---|---|---|---|---|
| |
Class A Partners |
Class B Partners |
Net Parent Investment |
Total | Noncontrolling Interests |
Total | |||||||||||||
Balance, December 31, 2010 |
$ | 312,301 | $ | 23,765 | $ | 43,817 | $ | 379,883 | $ | 95,648 | $ | 475,531 | |||||||
Contributions |
— | 524 | — | 524 | — | 524 | |||||||||||||
Distributions |
(11,142 | ) | (1,405 | ) | (7,697 | ) | (20,244 | ) | — | (20,244 | ) | ||||||||
Acquisition of noncontrolling interests in subsidiaries |
88,262 | 1,006 | — | 89,268 | (96,108 | ) | (6,840 | ) | |||||||||||
Book value of net assets transferred under common control |
42,518 | — | (42,518 | ) | — | — | — | ||||||||||||
Distribution for net assets transferred under common control |
(68,000 | ) | — | — | (68,000 | ) | — | (68,000 | ) | ||||||||||
Net income |
116,293 | 26,457 | 6,398 | 149,148 | 460 | 149,608 | |||||||||||||
Balance, September 30, 2011 |
$ | 480,232 | $ | 50,347 | $ | — | $ | 530,579 | $ | — | $ | 530,579 | |||||||
See notes to consolidated financial statements
F-14
Dynamic Offshore Holding, LP
Notes to Consolidated Financial Statements
Except as noted within the context of each footnote disclosure, the dollar amounts presented in the tabular data within these footnote disclosures are stated in thousands of dollars.
Note 1—Organization and Basis of Presentation
Dynamic Offshore Holding, LP ("DOH") is a Delaware limited partnership that was formed on January 25, 2008 for the purpose of acquiring and developing oil and gas properties. Unless the context requires otherwise, references to "we", "us", "our", or "the Partnership" are intended to mean the consolidated business and operations of DOH. The Partnership's general partner is Dynamic Offshore Holding GP, LLC ("DOH GP").
The Partnership owns 100% of the membership interest in Dynamic Offshore Resources, LLC ("DOR").
In September 2011, we acquired certain oil and natural gas properties in the Gulf of Mexico from a subsidiary of Moreno Group Holdings, LLC ("MOR") for $68.0 million. Because the Partnership and MOR are under the common control (as defined in the accounting standards codification master glossary) of Riverstone Holdings, LLC ("Riverstone"), the acquisitions were accounted for as transactions between entities under common control, similar to a pooling of interests, whereby the assets and liabilities of the acquired properties were recorded at MOR's carrying value and the Partnership's historical financial information was recast to include the acquired properties for all periods in which the Partnership and MOR were under the common control of Riverstone. Accordingly, the consolidated financial statements and notes thereto reflect the historical results of the Partnership combined with those of the acquired properties.
Basis of Presentation. These unaudited consolidated financial statements have been prepared in accordance with accounting principles generally accepted in the United States of America ("GAAP") for interim financial information and with the instructions to Form 10-Q and Article 10 of Regulation S-X. Accordingly, they do not include all of the information and footnotes required by GAAP for complete financial statements. The year-end balance sheet data was derived from audited financial statements, but does not include all disclosures required by GAAP. The unaudited consolidated financial statements for the nine months ended September 30, 2011 and 2010 include all adjustments, both normal and recurring, which are, in the opinion of management, necessary for a fair statement of the results for the interim periods. All significant intercompany balances and transactions have been eliminated in consolidation. Our financial results for the nine months ended September 30, 2011 are not necessarily indicative of the results that may be expected for the full year ending December 31, 2011. These unaudited consolidated financial statements and other information included in this interim report should be read in conjunction with our consolidated financial statements and notes thereto included in our annual report for the year ended December 31, 2010, included elsewhere in this prospectus.
In preparing the accompanying consolidated financial statements, the Partnership has reviewed, as determined necessary by the Partnership's management, events that have occurred after September 30, 2011, up until the issuance of the consolidated financial statements, which occurred on November 10, 2011.
Pro Forma Financial Information. As discussed in Note 1 of the Notes to Consolidated Financial Statements in our audited financial statements for the year ended December 31, 2010 included elsewhere in this prospectus, DOH was originally organized in the form of a limited partnership. Immediately prior to the closing of our proposed initial public offering ("IPO"), our capital structure
F-15
Dynamic Offshore Holding, LP
Notes to Consolidated Financial Statements (Continued)
Note 1—Organization and Basis of Presentation (Continued)
will be changed to that of a corporation. The change will result in the post-IPO company becoming obligated for the tax liabilities for 100% of its income generated subsequent to the date of the proposed IPO, whereas the previous income and associated liability attributable to its profits and losses, other than within Dynamic Offshore Resources NS Parent, Inc., was passed through to DOH's partners.
Pursuant to Securities and Exchange Commission Staff Accounting Bulletin Number 1B.2 "Pro Forma Financial Statements and Earnings per Share" ("SAB 1B.2"), the pro forma information in our consolidated statements of operations reflects the impact of DOH's change in capital structure as if it had occurred at the beginning of the earliest period presented. This presentation reflects us generating income tax expense on 100% of our earnings during the periods presented and having the common shares outstanding immediately following the proposed IPO.
Note 2—Significant Accounting Policies and Related Matters
The accounting policies followed by the Partnership are set forth in Note 2 of the Notes to Consolidated Financial Statements in our annual financial statements for the year ended December 31, 2010 included elsewhere in this prospectus. There have been no significant changes to these policies during the nine months ended September 30, 2011.
Recent Accounting Pronouncements. In December 2010, the Financial Accounting Standards Board ("FASB") issued authoritative guidance clarifying the acquisition date that should be used for reporting the pro forma financial information disclosures when comparative financial statements are presented. The guidance also improves the usefulness of the pro forma revenue and earnings disclosures by requiring a description of the nature and amount of material, nonrecurring pro forma adjustments that are directly attributable to the business combination. We adopted the provisions of this standard effective January 1, 2011, and it did not have a significant impact on our consolidated financial position, results of operations or cash flows.
In May 2011, the FASB issued authoritative guidance amending certain accounting and disclosure requirements related to fair value measurements. The guidance clarifies (i) the requirement that the highest and best use concept is only relevant for measuring nonfinancial assets, (ii) requirements to measure the fair value of instruments classified in shareholders' equity and (iii) the requirement to disclose quantitative information about the unobservable inputs used in a fair value measurement that is categorized within Level 3 of the fair value hierarchy. The guidance also (i) permits a reporting entity to measure the fair value of certain financial assets and liabilities managed in a portfolio at the price that would be received to sell a net asset position or transfer a net liability position for a particular risk, (ii) eliminates premiums or discounts related to size as a characteristic of the reporting entity's holding and (iii) expands disclosures for fair value measurement. The guidance is effective for interim and annual periods beginning after December 15, 2011. Early adoption is not permitted. We are currently evaluating the impact of this guidance.
F-16
Dynamic Offshore Holding, LP
Notes to Consolidated Financial Statements (Continued)
Note 3—Consolidated Financial Statements Information
The following table shows additional consolidated balance sheets information at the dates indicated:
| |
September 30, 2011 |
December 31, 2010 |
||||||
|---|---|---|---|---|---|---|---|---|
Accounts receivable from third parties |
||||||||
Operating revenues |
$ | 56,004 | $ | 40,749 | ||||
Joint interest receivables |
20,262 | 13,908 | ||||||
Derivative assets |
56 | 195 | ||||||
Other |
2,732 | 2,950 | ||||||
|
$ | 79,054 | $ | 57,802 | ||||
Other current assets |
||||||||
Prepaid insurance |
$ | 5,945 | $ | 5,982 | ||||
Prepaid royalties |
7,812 | 5,871 | ||||||
Advances to operators |
859 | 644 | ||||||
Deferred income taxes |
3,291 | 3,292 | ||||||
Insurance receivable |
— | 933 | ||||||
Other |
328 | — | ||||||
|
$ | 18,235 | $ | 16,722 | ||||
Other assets |
||||||||
Natural gas imbalances receivable(1) |
$ | 22,459 | $ | 12,916 | ||||
Debt issue costs, net |
3,805 | 1,279 | ||||||
Restricted cash |
1,500 | 1,500 | ||||||
|
$ | 27,764 | $ | 15,695 | ||||
Other current liabilities |
||||||||
Accrued expenses |
$ | 50,418 | $ | 37,372 | ||||
Derivative liabilities |
4,542 | 17,176 | ||||||
Other |
— | 2,232 | ||||||
|
$ | 54,960 | $ | 56,780 | ||||
Other long-term liabilities |
||||||||
Natural gas imbalances payable(1) |
$ | 17,561 | $ | 11,012 | ||||
Long-term derivative liabilities |
286 | 9,254 | ||||||
Other |
— | 322 | ||||||
|
$ | 17,847 | $ | 20,588 | ||||
- (1)
- As of September 30, 2011 and December 31, 2010, natural gas imbalances receivable were 6,082 MMcf and 3,946 MMcf. Natural gas imbalances payable were 3,913 MMcf and 3,516 MMcf as of those dates.
F-17
Dynamic Offshore Holding, LP
Notes to Consolidated Financial Statements (Continued)
Note 3—Consolidated Financial Statements Information (Continued)
Other operating expense comprised the following for the periods indicated:
| |
Nine Months Ended September 30, |
|||||||
|---|---|---|---|---|---|---|---|---|
| |
2011 | 2010 | ||||||
Other operating expense |
||||||||
Insurance expense |
$ | 26,323 | $ | 29,121 | ||||
Workover expense |
16,042 | 12,479 | ||||||
Accretion expense |
8,897 | 9,630 | ||||||
Casualty gain, net |
(208 | ) | (2,363 | ) | ||||
Loss on abandonments |
2,486 | 1,550 | ||||||
Gain on sale of assets |
— | (303 | ) | |||||
Other operating income |
(1,831 | ) | — | |||||
|
$ | 51,709 | $ | 50,114 | ||||
Note 4—Acquisitions
On August 31, 2011, we acquired certain oil and natural gas interests in the Gulf of Mexico from XTO Offshore Inc. and other related subsidiaries of ExxonMobil Corporation ("Exxon"), for $173.7 million (the "XTO Acquisition"). This acquisition further strengthens our Gulf of Mexico shelf presence. The purchase price allocation was preliminary as of September 30, 2011. Acquisition-related expenses of $0.2 million are included in general and administrative expense in the accompanying consolidated statements of operations. The following depicts the fair value of the consideration paid and the fair value allocation of assets acquired and liabilities assumed for the XTO Acquisition for the nine months ended September 30, 2011:
| |
XTO | |||||
|---|---|---|---|---|---|---|
Consideration paid |
||||||
Cash |
$ | 173,732 | ||||
|
$ | 173,732 | ||||
Assets acquired: |
||||||
Other assets |
$ | 10,737 | ||||
Property and equipment |
246,508 | |||||
Total assets acquired |
257,245 | |||||
Liabilities assumed: |
||||||
Other liabilities |
7,903 | |||||
AROs, noncurrent portion |
75,610 | |||||
Total liabilities assumed |
83,513 | |||||
Net assets acquired |
$ | 173,732 | ||||
Actual and Pro Forma Impact of 2011 Acquisition (Unaudited). Revenues attributable to the XTO Acquisition included in the Partnership's consolidated statement of operations for the nine months ended September 30, 2011 were $10.0 million.
F-18
Dynamic Offshore Holding, LP
Notes to Consolidated Financial Statements (Continued)
Note 4—Acquisitions (Continued)
The following table presents pro forma information for the Partnership as if the XTO Acquisition occurred on January 1, 2010:
| |
Nine Months Ended September 30, |
||||||
|---|---|---|---|---|---|---|---|
| |
2011 | 2010 | |||||
Revenues |
$ | 448,105 | $ | 384,230 | |||
Income from operations |
132,270 | 74,369 | |||||
Net income |
189,148 | 101,887 | |||||
Less: Net income attributable to noncontrolling interests |
460 | 10,184 | |||||
Net income attributable to Dynamic Offshore Holding, LP |
188,688 | 91,703 | |||||
The historical financial information was adjusted to give effect to the pro forma events that were directly attributable to the acquisitions and factually supportable. The unaudited pro forma results are not necessarily indicative of what the Partnership's consolidated results of operations actually would have been had the acquisitions been completed on January 1, 2010. In addition, the unaudited pro forma results do not purport to project the future results of operations of the combined company. The unaudited pro forma results reflect the direct operating expenses of the properties acquired and an adjustment to recognize incremental depreciation, depletion and amortization expense, using the unit-of-production method, resulting from the purchase of the properties.
On September 14, 2011, we acquired certain oil and natural gas properties in the Gulf of Mexico from a subsidiary of Moreno Group Holdings, LLC ("MOR") for $68.0 million. Because the Partnership and MOR are under the common control (as defined in the accounting standards codification master glossary) of Riverstone Holdings, LLC ("Riverstone"), the acquisitions were accounted for as transactions between entities under common control, similar to a pooling of interests, whereby the assets and liabilities of the acquired properties were recorded at MOR's carrying value and the Partnership's historical financial information was recast to include the acquired properties for all periods in which the Partnership and MOR were under the common control of Riverstone. Accordingly, the consolidated financial statements and notes thereto, including the historical financial statements and notes thereto, reflect the results of the Partnership combined with those of the acquired properties.
Note 5—Property and Equipment
The components of property and equipment were as follows at the dates indicated:
| |
September 30, 2011 |
December 31, 2010 |
|||||
|---|---|---|---|---|---|---|---|
Proved oil and gas properties |
$ | 1,467,435 | $ | 1,080,031 | |||
Unproved oil and gas properties |
135,591 | 140,376 | |||||
Other property and equipment |
3,939 | 3,223 | |||||
|
1,606,965 | 1,223,630 | |||||
Accumulated depreciation, depletion and amortization |
(461,421 | ) | (358,985 | ) | |||
|
$ | 1,145,544 | $ | 864,645 | |||
Substantially all of the Partnership's assets serve as collateral under DOR's debt agreements, as discussed in Note 9.
F-19
Dynamic Offshore Holding, LP
Notes to Consolidated Financial Statements (Continued)
Note 6—Asset Retirement Obligations
The following table summarizes the activity for the Partnership's asset retirement obligations for the nine months ended September 30, 2011:
Beginning of period |
$ | 233,070 | ||
Liabilities acquired |
95,411 | |||
Liabilities settled |
(30,252 | ) | ||
Accretion |
8,897 | |||
Revisions to previous estimates |
(603 | ) | ||
End of period |
$ | 306,523 | ||
Current portion |
$ | 42,494 | ||
Long-term portion |
264,029 | |||
|
$ | 306,523 | ||
SPN Resources, LLC ("SPN"), a subsidiary of DOR, has a turnkey platform abandonment contract with Superior Energy Services, Inc. ("Superior") whereby Superior will provide all well abandonment and platform decommissioning services for all properties owned and operated by SPN on March 14, 2008 at fixed prices upon abandonment of such properties. On March 10, 2011, the contract was modified whereby Superior will provide well abandonment and pipeline and platform decommissioning services with respect to the specified properties for the greater of its actual cost or the original turnkey amount. This contract covers only routine end-of-life well abandonment and pipeline and platform decommissioning for properties owned and operated by SPN at March 14, 2008 and has a remaining fixed price of approximately $133.4 million as of September 30, 2011. For any additional wells drilled and completed after March 15, 2008, the abandonment liability was estimated based on similar wells in the field.
Note 7—Notes Receivable
Notes receivable consist primarily of contractual obligations of sellers of oil and gas properties to reimburse the Partnership a specified amount following the abandonment of acquired properties. The Partnership invoices the seller specified amounts following the performance of decommissioning operations (abandonment and structure removal) in accordance with the applicable agreements with the seller. These receivables are recorded at present value, and the related discounts are amortized to interest income, based on the expected timing of the decommissioning.
F-20
Dynamic Offshore Holding, LP
Notes to Consolidated Financial Statements (Continued)
Note 8—Noncontrolling Interests in Subsidiaries
The following is a reconciliation of our noncontrolling interests for the nine months ended September 30, 2011 and 2010:
| |
Noncontrolling Interests |
|||
|---|---|---|---|---|
Balance, December 31, 2010 |
$ | 95,648 | ||
Acquisition of noncontrolling interests in subsidiaries |
(96,108 | ) | ||
Net income |
460 | |||
Balance, September 30, 2011 |
$ | — | ||
Balance, December 31, 2009 |
$ | 116,145 | ||
Distributions |
(9,827 | ) | ||
Net income |
10,184 | |||
Balance, September 30, 2010 |
$ | 116,502 | ||
On March 10, 2011, the Partnership acquired a Superior affiliate's membership interests in SPN and DBH, LLC ("DBH"). Consideration for the acquisition was a 10% ownership interest in the Partnership and a modification of SPN's turnkey platform abandonment contract with Superior as described in Note 6. As a result of this transaction, the Partnership owns a 100% indirect controlling interest in SPN.
During 2011, DOR repurchased the remaining member interests in DBH from various members for $6.8 million. The Partnership's capital accounts were adjusted for the $5.1 million difference between the settlement price paid to the withdrawing members and the book value of the withdrawing members' share of total members' capital at the time of the withdrawal. As of June 1, 2011, the Partnership owns a 100% indirect controlling interest in DBH.
Note 9—Long-Term Debt
The Partnership had the following debt outstanding at the dates indicated:
| |
September 30, 2011 |
December 31, 2010 |
||||||
|---|---|---|---|---|---|---|---|---|
Obligation of DOR(1) |
||||||||
Revolving Credit Agreement, variable rate, due June 2015 |
$ | 385,000 | $ | 145,000 | ||||
Obligation of Bandon Oil and Gas, LP |
||||||||
Second Lien Term Loan, variable rate, due October 2014 |
— | 58,205 | ||||||
|
$ | 385,000 | $ | 203,205 | ||||
Letters of credit issued |
$ | — | $ | — | ||||
- (1)
- The Partnership consolidates the debt of DOR and Bandon Oil and Gas, LP; however, the debt of DOR is secured by substantially all of the assets of DOR (other than its ownership in Bandon) and the debt of Bandon is secured by substantially all of the assets of Bandon. DOH does not provide guarantees of the indebtedness and none of DOH's directly owned assets are pledged as collateral for the indebtedness.
F-21
Dynamic Offshore Holding, LP
Notes to Consolidated Financial Statements (Continued)
Note 9—Long-Term Debt (Continued)
Description of Debt Obligations
Obligation of DOR
$750 Million Amended and Restated Credit Agreement
On June 20, 2011, DOR amended and restated its existing credit agreement to provide for a four year $750 million revolving credit facility (the "DOR Credit Facility") with a group of financial institutions (the "Lenders"). As of September 30, 2011 the borrowing base under the DOR Credit Facility was $430 million. In addition, $100 million of the borrowing base is available for the issuance of letters of credit.
The DOR Credit Facility is subject to semi-annual borrowing base redeterminations on April 1 and October 1 of each year, except that for 2011 the first redetermination was effective November 1, 2011. In addition to the scheduled semi-annual borrowing base redeterminations, the Lenders or the Partnership have the right to re-determine the borrowing base at any time, provided that no party can request more than one such redetermination between the regularly scheduled borrowing base redeterminations. The determination of the Partnership's borrowing base is subject to a number of factors, including the quantities of proved oil and gas reserves, the Lenders' price assumptions and other various factors, some of which may be out of the Partnership's control. The Lenders can re-determine the borrowing base to a lower level than the current borrowing base if they determine that the Partnership's oil and gas reserves, at the time of redetermination, are inadequate to support the borrowing base then in effect. In this case, the Partnership would be required to make six monthly payments each equal to one sixth of the amount by which the aggregate outstanding loans and letters of credit exceed the borrowing base.
Obligations under the DOR Credit Facility are secured by liens on substantially all of the Partnership's assets. The DOR Credit Facility also contains other restrictive covenants, including, among other items, maintenance of leverage ratio, interest coverage ratio and current ratio (all as defined in the credit agreement), restrictions on cash dividends and restrictions on incurring additional indebtedness. The DOR Credit Facility also requires DOR to enter into commodity price hedging agreements for at least half of its estimated oil and gas production from proved developed producing reserves.
At our election, outstanding balances bear interest at either the alternate base rate plus a margin (based on a sliding scale of 1.25% to 2.00% based upon borrowing base usage) or the London Interbank Offered Rate ("LIBOR") plus a margin (based on a sliding scale of 2.25% to 3.00% based upon borrowing base usage). The alternate base rate is equal to the higher of The Royal Bank of Scotland's prime rate or the federal funds rate plus 0.5% per annum or the reference LIBOR plus 1%, and the LIBOR is equal to the applicable British Bankers' Association LIBOR for deposits in U.S. dollars. The DOR Credit Facility also provides for commitment fees (based on a margin of 0.5%) calculated on the difference between the borrowing base and the aggregate outstanding loans and letters of credit under the DOR Credit Facility.
The Partnership's management believes DOR was in compliance with its debt covenants as of September 30, 2011.
F-22
Dynamic Offshore Holding, LP
Notes to Consolidated Financial Statements (Continued)
Note 9—Long-Term Debt (Continued)
Obligations of Bandon Oil and Gas, LP
Second Lien Amended and Restated Credit Agreement
On October 13, 2009, Bandon Oil and Gas, LP, a wholly-owned subsidiary of DBH, entered into a Second Lien Amended and Restated Credit Agreement (the "Second Lien Agreement"). During 2011 the outstanding balance of the Second Lien Agreement was repaid and retired.
Note 10—Risk Management Activities
The Partnership's principal market risks are its exposure to changes in commodity prices, particularly to the prices of oil and gas, nonperformance by the Partnership's counterparties, and changes in interest rates.
The Partnership's revenues are derived principally from the sale of oil and gas. The prices of oil and gas are subject to market fluctuations in response to changes in supply, demand, market uncertainty and a variety of additional factors beyond the Partnership's control. The Partnership monitors these risks and enters into commodity derivative transactions designed to mitigate the impact of commodity price fluctuations on the Partnership's business.
The primary purpose of the Partnership's commodity risk management activities is to hedge the Partnership's exposure to commodity price risk and reduce fluctuations in the Partnership's operating cash flows despite fluctuations in commodity prices. As of September 30, 2011, the Partnership has hedged the commodity price associated with a portion of its expected oil and gas sales volumes for the years 2011 through 2013 by entering into derivative financial instruments comprising swaps, basis swaps and collars. The percentages of the Partnership's expected oil and gas that are hedged decrease over time.
With swaps, the Partnership receives an agreed upon fixed price for a specified notional quantity of oil or gas and the Partnership pays the hedge counterparty a floating price for that same quantity based upon published index prices. Since the Partnership receives from its oil and gas marketing counterparties a price based on the same floating index price from the sale of the underlying physical commodity, these transactions are designed to effectively lock-in the agreed fixed price in advance for the volumes hedged.
For basis swaps, the Partnership receives a fixed differential between two regional oil index prices and pays a floating differential on the same two index prices to the contract counterparty. Since the Partnership receives from its oil and gas marketing counterparties a price based on the same floating differential from the sale of the underlying physical commodity, these transactions are designed to effectively lock-in the agreed fixed differential in advance for the volumes hedged.
In order to avoid having a greater volume hedged than the Partnership's actual oil and gas sales volumes, the Partnership typically limits its use of swaps and basis swaps to hedge the prices of less than the Partnership's expected sales volumes.
In a typical collar transaction, if the floating price based on a market index is below the floor price in the derivative contract, the Partnership receives from the counterparty an amount equal to this difference multiplied by the specified volume. If the floating price exceeds the floor price and is less than the ceiling price, no payment is required by either party. If the floating price exceeds the ceiling price, the Partnership must pay the counterparty an amount equal to the difference multiplied by the
F-23
Dynamic Offshore Holding, LP
Notes to Consolidated Financial Statements (Continued)
Note 10—Risk Management Activities (Continued)
specified volume. If the Partnership has less production than the volumes specified under the collar transaction when the floating price exceeds the ceiling price, the Partnership must make payments against which there is no offsetting revenues from production.
The Partnership's commodity hedges may expose the Partnership to the risk of financial loss in certain circumstances. The Partnership's hedging arrangements provide the Partnership protection on the hedged volumes if market prices decline below the prices at which these hedges are set. If market prices rise above the prices at which the Partnership has hedged, the Partnership will receive less revenue on the hedged volumes than in the absence of hedges.
Interest Rate Risk. The Partnership is exposed to changes in interest rates, primarily as a result of variable rate borrowings under its debt agreements. To the extent that interest rates increase, interest expense for the Partnership's variable rate debt will also increase.
Credit Risk. The Partnership's credit exposure related to commodity derivative instruments is represented by the fair value of contracts with a net positive fair value to the Partnership at the reporting date. At such times, these outstanding instruments expose the Partnership to credit loss in the event of nonperformance by the counterparties to the agreements. Should the creditworthiness of one or more of the Partnership's counterparties decline, the Partnership's ability to mitigate nonperformance risk is limited to a counterparty agreeing to either a voluntary termination and subsequent cash settlement or a novation of the derivative contract to a third party. In the event of a counterparty default, the Partnership may sustain a loss and the Partnership's cash receipts could be negatively impacted.
As of September 30, 2011, Citibank, Natixis, and affiliates of RBS and Regions accounted for 49%, 17%, 14% and 13%, respectively, of the Partnership's counterparty credit exposure related to commodity derivative instruments. These counterparties are major financial institutions possessing investment grade credit ratings, based upon minimum credit ratings assigned by Standard & Poor's Ratings Services, a division of the McGraw-Hill Companies, Inc.
F-24
Dynamic Offshore Holding, LP
Notes to Consolidated Financial Statements (Continued)
Note 10—Risk Management Activities (Continued)
The Partnership had commodity derivatives with the following terms outstanding as of September 30, 2011, none of which have been designated as cash-flow hedges:
| |
Year Ending December 31, | ||||||||||||
|---|---|---|---|---|---|---|---|---|---|---|---|---|---|
| |
2011 | 2012 | 2013 | ||||||||||
Crude Oil |
|||||||||||||
Swaps (Bbl) |
362,000 | 1,662,000 | 1,250,000 | ||||||||||
Average price ($ per Bbl) |
88.48 | 91.86 | 100.47 | ||||||||||
Collars (Bbl) |
90,000 |
418,000 |
168,000 |
||||||||||
Average price ($ per Bbl) |
|||||||||||||
Floor price (put) |
65.00 | 82.99 | 80.00 | ||||||||||
Ceiling price (call) |
87.90 | 108.51 | 102.50 | ||||||||||
LLS-WTI Differential Spread (Bbl) |
615,000 |
2,300,000 |
— |
||||||||||
Average price ($ per Bbl) |
20.03 | 17.17 | — | ||||||||||
Natural Gas |
|||||||||||||
Swaps (MMBtu) |
880,000 | 3,630,000 | — | ||||||||||
Average price ($ per MMBtu) |
5.92 | 6.16 | — | ||||||||||
Collars (MMBtu) |
1,139,000 |
8,115,000 |
6,000,000 |
||||||||||
Average price ($ per MMBtu) |
|||||||||||||
Floor price (put) |
5.26 | 4.08 | 3.75 | ||||||||||
Ceiling price (call) |
7.83 | 6.62 | 6.65 | ||||||||||
The following reflects the fair values of derivative instruments in the Partnership's consolidated balance sheets as of the dates indicated:
| |
Asset Derivatives | ||||||||
|---|---|---|---|---|---|---|---|---|---|
| |
|
Fair Value as of | |||||||
Derivatives not designated as hedging instruments under ASC 815
|
Balance Sheet Location | September 30, 2011 | December 31, 2010 | ||||||
Commodity derivatives |
Current assets | $ | 33,548 | $ | 11,990 | ||||
|
Long-term assets | 30,592 | 4,919 | ||||||
| |
Liability Derivatives | ||||||||
|---|---|---|---|---|---|---|---|---|---|
| |
|
Fair Value as of | |||||||
Derivatives not designated as hedging instruments under ASC 815
|
Balance Sheet Location | September 30, 2011 |
December 31, 2010 |
||||||
Commodity derivatives |
Current liabilities | $ | 4,542 | $ | 17,176 | ||||
|
Long-term liabilities | 286 | 9,254 | ||||||
See Note 11 for additional disclosures related to derivative instruments.
F-25
Dynamic Offshore Holding, LP
Notes to Consolidated Financial Statements (Continued)
Note 11—Fair Value Measurements
Accounting standards pertaining to fair value measurements establish a three-tier fair value hierarchy, which prioritizes the inputs used in measuring fair value. These tiers include:
- •
- Level 1, defined as observable inputs such as quoted prices in active markets;
- •
- Level 2, defined as inputs other than quoted prices in active markets that are either directly or indirectly
observable; and
- •
- Level 3, defined as unobservable inputs in which little or no market data exists, therefore requiring an entity to develop its own assumptions.
The Partnership's derivative contracts are reported in its consolidated financial statements at fair value. These contracts consist of over-the-counter swaps and collars, which are not traded on a public exchange.
The fair values of swap contracts are determined based on inputs that are readily available in public markets or can be derived from information available in publicly quoted markets. Therefore, the Partnership has categorized these swap contracts as Level 2.
For collars, the Partnership estimates the option value of the contract floors and ceilings using an option pricing model which takes into account market volatility, market prices and contract terms. Therefore, the Partnership has categorized its collars as Level 2.
The Partnership has consistently applied these valuation techniques and believes it has obtained the most accurate information available for the types of derivative contracts it holds.
The following table sets forth, by level within the fair value hierarchy, the Partnership's financial assets and liabilities measured at fair value on a recurring basis as of the dates indicated:
As of September 30, 2011
|
Total | Level 1 | Level 2 | Level 3 | |||||||||
|---|---|---|---|---|---|---|---|---|---|---|---|---|---|
Commodity derivative assets |
$ | 64,140 | $ | — | $ | 64,140 | $ | — | |||||
Commodity derivative liabilities |
$ | 4,828 | $ | — | $ | 4,828 | $ | — | |||||
As of December 31, 2010
|
Total | Level 1 | Level 2 | Level 3 | |||||||||
|---|---|---|---|---|---|---|---|---|---|---|---|---|---|
Commodity derivative assets |
$ | 16,909 | $ | — | $ | 16,909 | $ | — | |||||
Commodity derivative liabilities |
$ | 26,430 | $ | — | $ | 26,430 | $ | — | |||||
These financial assets and liabilities are classified in their entirety based on the lowest level of input that is significant to the fair value measurement. The Partnership's assessment of the significance of a particular input to the fair value measurement requires judgment, and may affect the fair value of assets and liabilities and their placement within the fair value hierarchy levels.
F-26
Dynamic Offshore Holding, LP
Notes to Consolidated Financial Statements (Continued)
Note 12—Related Party Transactions
Relationship with Superior
Affiliates of Superior own a noncontrolling interest in the Partnership, and are party to the turnkey platform abandonment contract described in Note 6. Superior provides various field-level services to the Partnership. These transactions were recorded in the consolidated financial statements as follows:
| |
Nine Months Ended September 30, |
||||||
|---|---|---|---|---|---|---|---|
| |
2011 | 2010 | |||||
Insurance receivable |
$ | 7 | $ | 1,317 | |||
Additions to property and equipment |
7,028 | 1,345 | |||||
Asset retirement obligations settled |
2,639 | 11,569 | |||||
Lease operating expense |
1,324 | 1,329 | |||||
Workover expense |
2,497 | 427 | |||||
|
$ | 13,495 | $ | 15,987 | |||
Relationship with DOH GP
The Partnership has no employees. DOH GP charges all of its employee costs to the Partnership, at cost, as part of the administrative services agreement between DOH GP and DOR. DOR allocates employee costs charged by DOH GP and other general and administrative costs, at cost, among its consolidated subsidiaries based on an agreed sharing percentage. For the nine months ended September 30, 2011 and 2010, DOH GP charged DOR $16.0 million and $11.3 million under the agreement, which is included in the accompanying consolidated statements of operations as general and administrative expense and lease operating expense.
Affiliate receivables and payables were as follows as of the dates indicated:
| |
September 30, 2011 |
December 31, 2010 |
|||||
|---|---|---|---|---|---|---|---|
Payable to Superior and its affiliates |
$ | — | $ | 50 | |||
Payable to Riverstone Equity Partners, LP |
1,125 | 1,500 | |||||
Total amounts due to affiliates |
$ | 1,125 | $ | 1,550 | |||
F-27
Dynamic Offshore Holding, LP
Notes to Consolidated Financial Statements (Continued)
Note 13—Supplemental Cash Flow Information
The following table provides supplemental cash flow information for the periods indicated:
| |
Nine Months Ended September 30, |
|||||||
|---|---|---|---|---|---|---|---|---|
| |
2011 | 2010 | ||||||
Non-cash: |
||||||||
Purchase of noncontrolling interests in subsidiaries (see Note 8) |
89,268 | — | ||||||
Note 14—Commitments and Contingencies
Operating Leases
During the nine months ended September 30, 2011 and September 30, 2010, the Partnership paid $1.6 million and $1.4 million in rent under its operating leases. There has been no material change in the Partnership's noncancellable commitments since December 31, 2010.
Legal Proceedings
From time to time, the Partnership may be involved in litigation arising out of the normal course of its business. In management's opinion, the Partnership is not involved in any litigation, the outcome of which would have a material effect on its consolidated financial position, results of operations, or liquidity.
F-28
REPORT OF INDEPENDENT REGISTERED PUBLIC ACCOUNTING FIRM
To
the Board of Partners of
Dynamic Offshore Holding, LP
We have audited the accompanying consolidated balance sheets of Dynamic Offshore Holding, LP (the "Partnership") as of December 31, 2010 and 2009, and the related consolidated statements of operations, cash flows and owners' equity for the years ended December 31, 2010, 2009 and 2008. These consolidated financial statements are the responsibility of the Partnership's management. Our responsibility is to express an opinion on these consolidated financial statements based on our audits.
We conducted our audits in accordance with the standards of the Public Company Accounting Oversight Board (United States). Those standards require that we plan and perform the audits to obtain reasonable assurance about whether the consolidated financial statements are free of material misstatement. An audit includes examining, on a test basis, evidence supporting the amounts and disclosures in the consolidated financial statements. An audit also includes assessing the accounting principles used and significant estimates made by management, as well as evaluating the overall financial statement presentation. We believe that our audits provide a reasonable basis for our opinion.
In our opinion, the consolidated financial statements referred to above present fairly, in all material respects, the consolidated financial position of Dynamic Offshore Holding, LP as of December 31, 2010 and 2009 and the results of their consolidated operations and their consolidated cash flows for the years ended December 31, 2010, 2009 and 2008, in conformity with accounting principles generally accepted in the United States of America.
Hein &
Associates LLP
Houston, Texas
August 25, 2011, except as it relates to the transaction with a subsidiary of Moreno Group Holdings, LLC as described in Note 1, which is dated October 17, 2011.
F-29
DYNAMIC OFFSHORE HOLDING, LP
CONSOLIDATED BALANCE SHEETS
(In thousands)
| |
December 31, | ||||||||
|---|---|---|---|---|---|---|---|---|---|
| |
2010 | 2009 | |||||||
Assets |
|||||||||
Current assets: |
|||||||||
Cash and cash equivalents |
$ | 75,162 | $ | 88,457 | |||||
Accounts receivable—third parties |
57,796 | 51,038 | |||||||
Accounts receivable—affiliates |
6 | 26 | |||||||
Insurance receivable |
933 | 49,665 | |||||||
Derivative assets |
11,990 | 30,123 | |||||||
Current portion of notes receivable—abandonments |
4,922 | 3,473 | |||||||
Other current assets |
15,789 | 18,036 | |||||||
Total current assets |
166,598 | 240,818 | |||||||
Property and equipment: |
|||||||||
Oil and gas properties, successful efforts method |
1,220,407 | 1,023,908 | |||||||
Other property and equipment |
3,223 | 2,891 | |||||||
Accumulated depreciation, depletion and amortization |
(358,985 | ) | (165,595 | ) | |||||
Property and equipment, net |
864,645 | 861,204 | |||||||
Long-term derivative assets |
4,919 | 3,704 | |||||||
Notes receivable—abandonments |
15,274 | 17,349 | |||||||
Other assets |
15,695 | 15,924 | |||||||
Total assets |
$ | 1,067,131 | $ | 1,138,999 | |||||
Liabilities and Owners' Equity |
|||||||||
Current liabilities: |
|||||||||
Accounts payable—third parties |
$ | 26,846 | $ | 24,654 | |||||
Accounts payable—affiliates |
1,550 | 2,514 | |||||||
Current portion of asset retirement obligations |
71,225 | 49,622 | |||||||
Other current liabilities |
56,780 | 42,060 | |||||||
Total current liabilities |
156,401 | 118,850 | |||||||
Long-term debt |
203,205 | 243,000 | |||||||
Asset retirement obligations |
161,845 | 169,280 | |||||||
Deferred income taxes |
49,561 | 64,192 | |||||||
Other long-term liabilities |
20,588 | 17,433 | |||||||
Total liabilities |
591,600 | 612,755 | |||||||
Commitments and contingencies (see Note 17) |
|||||||||
Owners' equity: |
|||||||||
Partners' capital |
379,883 | 410,099 | |||||||
Noncontrolling interests in subsidiaries |
95,648 | 116,145 | |||||||
Total owners' equity |
475,531 | 526,244 | |||||||
Total liabilities and owners' equity |
$ | 1,067,131 | $ | 1,138,999 | |||||
See notes to consolidated financial statements
F-30
DYNAMIC OFFSHORE HOLDING, LP
CONSOLIDATED STATEMENTS OF OPERATIONS
(In thousands, except per share amounts)
| |
Year Ended December 31, | |||||||||||
|---|---|---|---|---|---|---|---|---|---|---|---|---|
| |
2010 | 2009 | 2008 | |||||||||
Oil and gas revenues |
$ | 345,812 | $ | 178,992 | $ | 209,219 | ||||||
Other operating revenues |
12,815 | 2,017 | 1,695 | |||||||||
|
358,627 | 181,009 | 210,914 | |||||||||
Operating expenses: |
||||||||||||
Lease operating expense |
89,399 | 60,618 | 36,725 | |||||||||
Exploration expense |
2,100 | 8,999 | 80 | |||||||||
Depreciation, depletion and amortization |
195,122 | 88,573 | 49,648 | |||||||||
General and administrative expense |
24,328 | 25,655 | 17,843 | |||||||||
Other operating expense |
73,047 | 51,142 | 29,930 | |||||||||
|
383,996 | 234,987 | 134,226 | |||||||||
Income (loss) from operations |
(25,369 | ) | (53,978 | ) | 76,688 | |||||||
Other income (expense): |
||||||||||||
Interest expense, net |
(13,541 | ) | (7,138 | ) | (2,492 | ) | ||||||
Commodity derivative income (expense) |
6,990 | (21,887 | ) | 159,939 | ||||||||
Bargain purchase gain |
4,024 | 161,351 | — | |||||||||
Other |
(1,080 | ) | — | (103 | ) | |||||||
Income (loss) before income taxes |
(28,976 | ) | 78,348 | 234,032 | ||||||||
Income tax benefit (expense) |
14,814 | 20,387 | (14,738 | ) | ||||||||
Net income (loss) |
(14,162 | ) | 98,735 | 219,294 | ||||||||
Less: Net income (loss) attributable to noncontrolling interests |
(4,070 | ) | 57,663 | 34,648 | ||||||||
Net income (loss) attributable to Dynamic Offshore Holding, LP |
$ | (10,092 | ) | $ | 41,072 | $ | 184,646 | |||||
Pro forma information (unaudited): |
||||||||||||
Income (loss) before income taxes |
$ | (28,976 | ) | $ | 78,348 | $ | 234,032 | |||||
Income tax (provision) benefit |
||||||||||||
Historical |
14,814 | 20,387 | (14,738 | ) | ||||||||
Pro forma |
(5,367 | ) | (47,620 | ) | (67,173 | ) | ||||||
|
9,447 | (27,233 | ) | (81,911 | ) | |||||||
Pro forma net income (loss) |
(19,529 | ) | 51,115 | 152,121 | ||||||||
Less: pro forma net income (loss) attributable to noncontrolling interest |
(2,646 | ) | 37,481 | 22,521 | ||||||||
Pro forma net income (loss) attributable to Dynamic Offshore Holding, LP |
$ | (16,883 | ) | $ | 13,634 | $ | 129,600 | |||||
Pro forma basic and diluted earnings per share |
$ | (0.24 | ) | $ | 0.19 | $ | 1.84 | |||||
Pro forma basic and diluted weighted average common shares outstanding |
70,533 | 70,533 | 70,533 | |||||||||
See notes to consolidated financial statements
F-31
DYNAMIC OFFSHORE HOLDING, LP
CONSOLIDATED STATEMENTS OF CASH FLOWS
(In thousands)
| |
Year Ended December 31, | |||||||||||
|---|---|---|---|---|---|---|---|---|---|---|---|---|
| |
2010 | 2009 | 2008 | |||||||||
Cash flows from operating activities: |
||||||||||||
Net income (loss) |
$ | (14,162 | ) | $ | 98,735 | $ | 219,294 | |||||
Adjustments to reconcile net income (loss) to net cash provided by operating activities: |
||||||||||||
Amortization in interest expense, net |
287 | (219 | ) | (315 | ) | |||||||
Accretion of asset retirement obligations |
13,183 | 7,211 | 4,494 | |||||||||
Depreciation, depletion and amortization |
195,122 | 88,573 | 49,648 | |||||||||
Commodity derivative (income) expense |
(6,990 | ) | 21,887 | (159,939 | ) | |||||||
Deferred income tax (benefit) expense |
(14,814 | ) | (18,199 | ) | 14,738 | |||||||
Bargain purchase gain |
(4,024 | ) | (161,351 | ) | — | |||||||
Other |
71 | — | — | |||||||||
(Gain) loss on sale of assets |
8,139 | (140 | ) | — | ||||||||
Changes in operating assets and liabilities, net of acquisitions: |
||||||||||||
Accounts receivable and other assets |
51,716 | 18,172 | 52,773 | |||||||||
Accounts payable and other liabilities |
(70,872 | ) | (16,873 | ) | (6,989 | ) | ||||||
Net cash provided by operating activities |
157,656 | 37,796 | 173,704 | |||||||||
Cash flows from investing activities: |
||||||||||||
Additions to property and equipment |
(57,726 | ) | (42,154 | ) | (67,965 | ) | ||||||
Acquisitions, net of cash acquired |
(92,442 | ) | 26,072 | (376,726 | ) | |||||||
Derivative settlements |
43,171 | 76,088 | 13,268 | |||||||||
Proceeds from asset sales |
12,392 | 2,069 | — | |||||||||
Net cash provided by (used in) investing activities |
(94,605 | ) | 62,075 | (431,423 | ) | |||||||
Cash flows from financing activities: |
||||||||||||
Borrowings from revolving credit facility |
— | — | 158,000 | |||||||||
Repayments of revolving credit facility |
(39,795 | ) | (5,000 | ) | (15,000 | ) | ||||||
Repayment of second lien term loan |
— | (46,223 | ) | — | ||||||||
Payment on note payable to partner |
— | — | (1,000 | ) | ||||||||
Payments on insurance note payable |
— | (1,111 | ) | (2,744 | ) | |||||||
Contributions from partners |
28,571 | 22,306 | 229,000 | |||||||||
Distributions to partners |
(51,576 | ) | (33,599 | ) | (35,318 | ) | ||||||
Commitment fees to partners |
(571 | ) | (447 | ) | (3,480 | ) | ||||||
Net contributions from (distributions to) noncontrolling interest |
(11,375 | ) | 2,844 | (17,000 | ) | |||||||
Acquisition of noncontrolling interest in DBH, LLC |
(1,600 | ) | (2,160 | ) | — | |||||||
Debt issuance costs |
— | (199 | ) | (2,709 | ) | |||||||
Net cash provided by (used in) financing activities |
(76,346 | ) | (63,589 | ) | 309,749 | |||||||
Net increase (decrease) in cash and cash equivalents |
(13,295 | ) | 36,282 | 52,030 | ||||||||
Cash and cash equivalents, beginning of period |
88,457 | 52,175 | 145 | |||||||||
Cash and cash equivalents, end of period |
$ | 75,162 | $ | 88,457 | $ | 52,175 | ||||||
See notes to consolidated financial statements
F-32
DYNAMIC OFFSHORE HOLDING, LP
CONSOLIDATED STATEMENTS OF OWNERS' EQUITY
(In thousands)
| |
Dynamic Offshore Holding, LP | |
|
|
|||||||||||||||
|---|---|---|---|---|---|---|---|---|---|---|---|---|---|---|---|---|---|---|---|
| |
Class A Partners |
Class B Partners |
Net Parent Investment |
Total | Noncontrolling Interests |
Total | |||||||||||||
Balance, January 1, 2008 |
$ | (652 | ) | $ | — | $ | — | $ | (652 | ) | $ | — | $ | (652 | ) | ||||
Acquisition of SPN Resources, LLC |
— | — | — | — | 41,425 | 41,425 | |||||||||||||
Contributions |
174,000 | — | 55,000 | 229,000 | — | 229,000 | |||||||||||||
Distributions |
(555 | ) | — | (34,763 | ) | (35,318 | ) | (17,000 | ) | (52,318 | ) | ||||||||
Commitment fees to partners |
(3,480 | ) | — | — | (3,480 | ) | — | (3,480 | ) | ||||||||||
Net income |
130,181 | 30,476 | 23,989 | 184,646 | 34,648 | 219,294 | |||||||||||||
Balance, December 31, 2008 |
299,494 | 30,476 | 44,226 | 374,196 | 59,073 | 433,269 | |||||||||||||
Contributions |
22,333 | — | — | 22,333 | 15,886 | 38,219 | |||||||||||||
Distributions |
(28,149 | ) | (5,450 | ) | — | (33,599 | ) | (9,933 | ) | (43,532 | ) | ||||||||
Commitment fees to partners |
(447 | ) | — | — | (447 | ) | — | (447 | ) | ||||||||||
Acquisition of noncontrolling interest in DBH, LLC |
5,235 | 1,309 | — | 6,544 | (6,544 | ) | — | ||||||||||||
Net income (loss) |
35,249 | 5,980 | (157 | ) | 41,072 | 57,663 | 98,735 | ||||||||||||
Balance, December 31, 2009 |
333,715 | 32,315 | 44,069 | 410,099 | 116,145 | 526,244 | |||||||||||||
Contributions |
28,571 | — | — | 28,571 | — | 28,571 | |||||||||||||
Distributions |
(44,337 | ) | (4,802 | ) | (2,437 | ) | (51,576 | ) | (11,375 | ) | (62,951 | ) | |||||||
Commitment fees to partners |
(571 | ) | — | — | (571 | ) | — | (571 | ) | ||||||||||
Acquisition of noncontrolling interest in DBH, LLC |
2,762 | 690 | — | 3,452 | (5,052 | ) | (1,600 | ) | |||||||||||
Net income (loss) |
(7,839 | ) | (4,438 | ) | 2,185 | (10,092 | ) | (4,070 | ) | (14,162 | ) | ||||||||
Balance, December 31, 2010 |
$ | 312,301 | $ | 23,765 | $ | 43,817 | $ | 379,883 | $ | 95,648 | $ | 475,531 | |||||||
See notes to consolidated financial statements
F-33
Dynamic Offshore Holding, LP
Notes to Consolidated Financial Statements
Except as noted within the context of each footnote disclosure, the dollar amounts presented in the tabular data within these footnote disclosures are stated in thousands of dollars.
Note 1—Organization and Basis of Presentation
Dynamic Offshore Holding, LP ("DOH") is a Delaware limited partnership that was formed on January 25, 2008 for the purpose of acquiring and developing oil and gas properties. Unless the context requires otherwise, references to "we", "us", "our", or "the Partnership" are intended to mean the consolidated business and operations of DOH. The Partnership's general partner is Dynamic Offshore Holding GP, LLC ("DOH GP").
The Partnership owns 100% of the membership interest in Dynamic Offshore Resources, LLC ("DOR").
Basis of Presentation. The accompanying consolidated financial statements have been prepared in accordance with accounting principles generally accepted in the United States of America ("GAAP").
In September 2011, we acquired certain oil and natural gas properties in the Gulf of Mexico from a subsidiary of Moreno Group Holdings, LLC ("MOR") for $68.0 million. Because the Partnership and MOR are under the common control (as defined in the accounting standards codification master glossary) of Riverstone Holdings, LLC ("Riverstone"), the acquisitions were accounted for as transactions between entities under common control, similar to a pooling of interests, whereby the assets and liabilities of the acquired properties were recorded at MOR's carrying value and the Partnership's historical financial information was recast to include the acquired properties for all periods in which the Partnership and MOR were under the common control of Riverstone. Accordingly, the consolidated financial statements and notes thereto reflect the historical results of the Partnership combined with those of the acquired properties.
The effect of recasting the Partnership's consolidated financial statements to account for this common control transaction is shown below:
| |
December 31, 2010 | December 31, 2009 | |||||||||||||||||
|---|---|---|---|---|---|---|---|---|---|---|---|---|---|---|---|---|---|---|---|
| |
Historical | MOR | Recast | Historical | MOR | Recast | |||||||||||||
Current assets |
$ | 163,209 | $ | 3,389 | $ | 166,598 | $ | 241,915 | $ | (1,097 | ) | $ | 240,818 | ||||||
Property and equipment |
809,035 | 55,610 | 864,645 | 798,255 | 62,949 | 861,204 | |||||||||||||
Other assets |
35,870 | 18 | 35,888 | 36,937 | 40 | 36,977 | |||||||||||||
Total assets |
$ | 1,008,114 | $ | 59,017 | $ | 1,067,131 | $ | 1,077,107 | $ | 61,892 | $ | 1,138,999 | |||||||
Current liabilities |
$ | 155,328 | $ | 1,073 | $ | 156,401 | $ | 116,636 | $ | 2,214 | $ | 118,850 | |||||||
Long-term liabilities |
421,072 | 14,127 | 435,199 | 478,296 | 15,609 | 493,905 | |||||||||||||
Owners' equity |
431,714 | 43,817 | 475,531 | 482,175 | 44,069 | 526,244 | |||||||||||||
Total liabilities and owners' equity |
$ | 1,008,114 | $ | 59,017 | $ | 1,067,131 | $ | 1,077,107 | $ | 61,892 | $ | 1,138,999 | |||||||
| |
Year Ended December 31, 2010 | Year Ended December 31, 2009 | Year Ended December 31, 2008 | |||||||||||||||||||||||||
|---|---|---|---|---|---|---|---|---|---|---|---|---|---|---|---|---|---|---|---|---|---|---|---|---|---|---|---|---|
| |
Historical | MOR | Recast | Historical | MOR | Recast | Historical | MOR | Recast | |||||||||||||||||||
Operating revenues |
$ | 330,136 | $ | 28,491 | $ | 358,627 | $ | 157,153 | $ | 23,856 | $ | 181,009 | $ | 164,822 | $ | 46,092 | $ | 210,914 | ||||||||||
Operating expenses |
(357,690 | ) | (26,306 | ) | (383,996 | ) | (210,974 | ) | (24,013 | ) | (234,987 | ) | (112,116 | ) | (22,110 | ) | (134,226 | ) | ||||||||||
Net income (loss) |
(16,347 | ) | 2,185 | (14,162 | ) | 98,892 | (157 | ) | 98,735 | 195,305 | 23,989 | 219,294 | ||||||||||||||||
F-34
Dynamic Offshore Holding, LP
Notes to Consolidated Financial Statements (Continued)
Note 1—Organization and Basis of Presentation (Continued)
On October 13, 2009 (the "acquisition date"), DBH, LLC ("DBH") acquired Bandon Oil and Gas, LP and Bandon Oil and Gas GP, LLC ("Bandon LP" and "Bandon GP"; collectively, "Bandon"). DBH accounted for its acquisition of Bandon using the acquisition method, under which 100% of Bandon's assets and liabilities were recorded at fair value as of the acquisition date. During the measurement period, which ended October 12, 2010, DBH finalized the acquisition date valuation of certain assets and liabilities related to the acquisition. As a result, the bargain purchase gain increased $0.5 million. See Note 4 and Note 5. The consolidated balance sheet at December 31, 2009 and the consolidated statement of operations for the year ended December 31, 2009 have been retrospectively adjusted to reflect these adjustments as required by the business combinations accounting guidance.
The Partnership adopted the guidance of Accounting Standards Codification ("ASC") 810 on January 1, 2009. ASC 810 requires entities to report noncontrolling interests in subsidiaries as a separate component of equity in the consolidated statement of financial position, to clearly identify consolidated net income attributable to the parent and to the noncontrolling interest on the face of the consolidated statement of operations, and to provide sufficient disclosure that clearly identifies and distinguishes between the interest of the parent and the interests of noncontrolling owners. ASC 810 also establishes accounting and reporting standards for changes in a parent's ownership interest and the valuation of retained noncontrolling equity investments when a subsidiary is deconsolidated. As a result of the Partnership's adoption of the guidance, previously presented amounts have been conformed to the required presentation and additional disclosures have been provided.
Certain other reclassifications have been made to the prior year financial statements to conform to the current year presentation. These other reclassifications had no affect on total net assets, owners' equity or net income.
In preparing the accompanying consolidated financial statements, the Partnership has reviewed, as determined necessary by the Partnership's management, events that have occurred after December 31, 2010, up until the issuance of the consolidated financial statements, which occurred on August 25, 2011, except as it relates to the transaction with MOR as described above, as to which the date is October 17, 2011. See Note 4, Note 9 and Note 18.
Note 2—Significant Accounting Policies and Related Matters
Asset Retirement Obligations ("AROs"). AROs are legal obligations associated with the retirement of tangible long-lived assets that result from the asset's acquisition, construction, development and/or normal operations. The Partnership's AROs are based on the estimated costs of dismantlement, removal, site reclamation and similar activities associated with its oil and gas properties. An ARO is initially measured at its estimated fair value. Upon initial recognition, the Partnership records an increase to the carrying amount of the related long-lived asset and an offsetting ARO liability. The cost of the long-lived asset (including the ARO-related increase) is depreciated using a systematic and rational allocation method over the period during which the long-lived asset is expected to provide benefits. After the initial period of ARO recognition, the ARO will change as a result of either the passage of time or revisions to the original estimates of either the amounts of estimated cash flows or their timing. Changes due to the passage of time increase the carrying amount of the liability because there are fewer periods remaining from the initial measurement date until the settlement date; therefore, the present values of the discounted future settlement amount increases. These changes are recorded as a period cost called accretion expense. Upon settlement, AROs will be extinguished by the
F-35
Dynamic Offshore Holding, LP
Notes to Consolidated Financial Statements (Continued)
Note 2—Significant Accounting Policies and Related Matters (Continued)
Partnership at either the recorded amount or the Partnership will recognize a gain or loss on the difference between the recorded amount and the actual settlement cost.
Cash and Cash Equivalents. Cash and cash equivalents include all cash on hand, demand deposits, and investments with original maturities of three months or less. The Partnership considers cash equivalents to include short-term, highly liquid investments that are readily convertible to known amounts of cash and which are subject to an insignificant risk of changes in value. As of December 31, 2009, accounts payable included $3.6 million of outstanding checks that were reclassified from cash and cash equivalents. There was no reclassification necessary as of December 31, 2010.
Concentration of Credit Risk. Financial instruments which potentially subject the Partnership to concentrations of credit risk consist primarily of trade accounts receivable and commodity derivative instruments.
The Partnership extends credit, primarily in the form of uncollateralized oil and gas sales and joint interest owners' receivables, to various companies in the oil and gas industry, which results in a concentration of credit risk. The concentration of credit risk may be affected by changes in economic or other conditions within the Partnership's industry and may accordingly impact its overall credit risk. The Partnership believes that the risk of these unsecured receivables is mitigated by the size, reputation and nature of the companies to which the Partnership extends credit.
The following table lists the percentage of the Partnership's consolidated oil and gas revenues with purchasers that accounted for more than 10% of the Partnership's consolidated oil and gas revenues for the periods indicated:
| |
Year Ended December 31, |
|||||||||
|---|---|---|---|---|---|---|---|---|---|---|
| |
2010 | 2009 | 2008 | |||||||
Shell Trading (US) Company |
45 | % | 23 | % | 30 | % | ||||
Texon LP |
14 | % | 20 | % | 9 | % | ||||
Conoco Phillips Corporation |
13 | % | 28 | % | 26 | % | ||||
Badger Oil Corporation |
0 | % | <1 | % | 11 | % | ||||
Estimated losses on accounts receivable are provided through an allowance for doubtful accounts, based on the specific identification method. In evaluating the collectability of accounts receivable, the Partnership makes judgments regarding each party's ability to make required payments, economic events and other factors. As the financial condition of any party changes, circumstances develop or additional information becomes available, adjustments to an allowance for doubtful accounts may be required. The Partnership did not have an allowance for doubtful accounts as of December 31, 2010 and 2009.
The Partnership uses commodity derivative instruments to mitigate the effects of commodity price fluctuations. These derivative instruments expose the Partnership to counterparty credit risk. The Partnership's counterparties are generally major banks or financial institutions. All derivative instruments are executed under master agreements which allow the Partnership, in the event of default, to elect early termination of all contracts with the defaulting counterparty. If the Partnership chooses to elect early termination, all asset and liability positions with the defaulting counterparty would be net settled at the time of election. The Partnership monitors the creditworthiness of its counterparties.
F-36
Dynamic Offshore Holding, LP
Notes to Consolidated Financial Statements (Continued)
Note 2—Significant Accounting Policies and Related Matters (Continued)
However, the Partnership is not able to predict sudden changes in its counterparties' creditworthiness. Should a financial counterparty not perform, the Partnership may not realize the benefit of some of its derivative instruments under lower commodity prices as well as incur a loss.
As of December 31, 2010, an affiliate of The Royal Bank of Scotland ("RBS") accounted for 100% of the Partnership's counterparty credit exposure related to commodity derivative instruments. RBS is a major financial institution possessing an investment grade credit rating, based upon minimum credit ratings assigned by Standard & Poor's Ratings Services, a division of the McGraw-Hill Companies, Inc.
Consolidation Policy. The Partnership's consolidated financial statements include the accounts of the Partnership and those subsidiaries in which the Partnership has a direct or indirect controlling interest, after the elimination of all material intercompany accounts and transactions. Third-party or affiliate ownership interests in the Partnership's controlled subsidiaries are presented as noncontrolling interests.
Contingencies. Certain conditions may exist as of the date the Partnership's consolidated financial statements are issued, which may result in a loss to the Partnership but which will only be resolved when one or more future events occur or fail to occur. The Partnership's management and its legal counsel assess such contingent liabilities, and such assessment inherently involves an exercise in judgment.
In assessing loss contingencies related to legal proceedings that are pending against the Partnership or unasserted claims that may result in proceedings, the Partnership's management and legal counsel evaluate the perceived merits of any legal proceedings or unasserted claims as well as the perceived merits of the amount of relief sought or expected to be sought therein. If the assessment of a contingency indicates that it is probable that a material loss has been incurred and the amount of liability can be estimated, then the estimated liability would be accrued in the Partnership's consolidated financial statements. If the assessment indicates that a potentially material loss contingency is not probable but is reasonably possible, or is probable but cannot be estimated, then the nature of the contingent liability, together with an estimate of the range of possible loss (if determinable and material), is disclosed.
Liabilities for environmental remediation costs arising from claims, assessments, litigation, fines, and penalties and other sources are charged to expense when it is probable that a liability has been incurred and the amount of the assessment and/or remediation can be reasonably estimated.
Loss contingencies considered remote are generally not disclosed unless they involve guarantees, in which case the guarantees would be disclosed.
Debt Issue Costs. Costs incurred in connection with the issuance of long-term debt are capitalized and charged to interest expense over the term of the related debt.
Income Taxes. The Partnership's provision for income taxes is solely applicable to federal tax obligations of Dynamic Offshore Resources NS Parent, Inc. ("DOR NS"), a wholly-owned subsidiary of the Partnership. Deferred income tax assets and liabilities are recognized for temporary differences between the assets and liabilities of DOR NS for financial reporting and tax purposes. A valuation allowance for deferred tax assets is recorded when it is more-likely-than-not that the benefit from the
F-37
Dynamic Offshore Holding, LP
Notes to Consolidated Financial Statements (Continued)
Note 2—Significant Accounting Policies and Related Matters (Continued)
deferred tax assets will not be realized. The profits and losses of the Partnership's consolidated operations other than within DOR NS are reported directly to the taxing authorities by the partners of the Partnership. Accordingly, no provision for income taxes has been included for those profits and losses in the accompanying consolidated financial statements, except as they relate to DOR NS.
The Partnership must recognize the tax effects of any uncertain tax positions it may adopt, if the position taken by it is more-likely-than-not sustainable. If a tax position meets such criteria, the tax effect to be recognized by the Partnership would be the largest amount of benefit with more than a 50% chance of being realized upon settlement. See Note 12 for additional information regarding income taxes.
Pro Forma Financial Information. As discussed in Note 1, DOH was originally organized in the form of a limited partnership. Immediately prior to the closing of our proposed initial public offering ("IPO"), our capital structure will be changed to that of a corporation. The change will result in the post-IPO company becoming obligated for the tax liabilities for 100% of its income generated subsequent to the date of the proposed IPO, whereas the previous income and associated liability attributable to its profits and losses other than within DOR NS was passed through to DOH's partners.
Pursuant to Securities and Exchange Commission Staff Accounting Bulletin Number 1B.2 "Pro Forma Financial Statements and Earnings per Share" ("SAB 1B.2"), pro forma information on the face of our consolidated statements of operations has been presented which reflects the impact of DOH's change in capital structure as if it had occurred at the beginning of the earliest period presented. This presentation reflects us generating income tax expense on 100% of our earnings during the periods presented and having the common shares outstanding immediately following its proposed IPO.
Natural Gas Imbalances. Quantities of natural gas over-delivered or under-delivered are recorded monthly as receivables and payables using weighted average prices as of the time the imbalance was created. Imbalances not governed by operational balancing agreements are subject to annual adjustment to the lower of cost or market. Certain contracts require cash settlement of imbalances on a current basis. Under these contracts, imbalance cash-outs are recorded in the consolidated statements of operations as a sale or purchase of natural gas, as appropriate.
Derivative Instruments (Hedging). All derivative instruments not qualifying for the normal purchases and normal sales exception are recorded on the consolidated balance sheets at fair value. The Partnership does not designate its commodity derivative instruments as cash-flow hedges. Changes in the fair value of the Partnership's commodity derivative instruments are recorded in earnings as they occur and are included in other income (expense) in the Partnership's consolidated statements of operations.
Property and Equipment. The Partnership uses the successful efforts method to account for its oil and gas exploration and production activities. All costs for development wells, related plant and equipment, proved mineral interests in oil and gas properties, and related ARO costs are capitalized. Costs of exploratory wells are capitalized pending determination of whether the wells find proved reserves. Costs of wells that are assigned proved reserves remain capitalized. Costs also are capitalized for exploratory wells that have found oil and gas reserves even if the reserves cannot be classified as proved when the drilling is completed, provided the exploratory well has found a sufficient quantity of reserves to justify its completion as a producing well and the Partnership is making sufficient progress
F-38
Dynamic Offshore Holding, LP
Notes to Consolidated Financial Statements (Continued)
Note 2—Significant Accounting Policies and Related Matters (Continued)
toward assessing the reserves and the economic and operating viability of the project. Unproved leasehold costs are capitalized and amortized on a composite basis if individually insignificant, based on past success, experience, and average lease-term lives. Individually significant leases are reclassified to proved properties if successful and expensed on a lease-by-lease basis if unsuccessful or the lease term has expired. All other exploratory wells and costs are expensed. Capitalized costs of producing oil and gas properties, along with support equipment and facilities, are amortized to expense by the unit-of-production method based on proved oil and gas reserves on a field-by-field basis. Upon sale or retirement, the cost and related accumulated depreciation, depletion and amortization are eliminated from the accounts and the resulting gain or loss is recognized.
Oil and gas property costs associated with unproved oil and gas reserves arising from business combinations are periodically assessed for transfer to proved properties or impairment on an individual property basis.
Long-lived assets to be held and used, including proved oil and gas properties, are assessed for possible impairment by comparing their carrying values with their associated undiscounted, risk-weighted estimated future net cash flows. Events that can trigger assessments for possible impairments include write-downs of proved and unproved reserves based on field performance, significant decreases in the market value of an asset, significant changes in the extent or manner of use or a physical change in an asset, significant changes in the relationship between an asset's capitalized cost and the associated oil and gas reserves, and a more-likely-than-not expectation that a long-lived asset will be sold or otherwise disposed of significantly sooner than the end of its previously estimated useful life. Impaired assets are written down to their estimated fair values, generally their estimated discounted future net cash flows as adjusted by additional risk-weighting factors. The Partnership performs the impairment review on a field-by-field basis that may include costs associated with proved and unproved reserves, related facilities and equipment.
Impairment amounts are recorded as incremental depreciation, depletion and amortization expense. The Partnership recorded property impairment charges in 2010, 2009 and 2008 as described in Note 6. It is reasonably possible that other proved and unproved oil and gas properties could become impaired in the future if commodity prices decline.
In determining the fair values of proved and unproved properties acquired in business combinations, the Partnership prepares estimates of oil and gas reserves. The Partnership estimates future prices to apply to the estimated reserve quantities acquired, and estimates future operating and development costs, to arrive at estimates of future net cash flows. For the fair value assigned to proved, probable and possible reserves, the estimated future net cash flows are discounted using a market-based weighted average cost of capital rate deemed appropriate at the time of the business combination. To compensate for the inherent risk of estimating and valuing reserves, the discounted future net cash flows of proved, probable and possible reserves are reduced by additional risk-weighting factors.
Other property and equipment, consisting primarily of office furniture, equipment, leasehold improvements, computers and computer software, is stated at cost. Depreciation on other property and equipment is calculated on the straight-line method over the estimated useful lives of the assets, which range from three to seven years.
F-39
Dynamic Offshore Holding, LP
Notes to Consolidated Financial Statements (Continued)
Note 2—Significant Accounting Policies and Related Matters (Continued)
Revenue Recognition. The Partnership records revenues from the sales of crude oil, natural gas and natural gas liquids when product is delivered at a fixed or determinable price, title has transferred and collectability is reasonably assured.
When the Partnership has an interest with other producers in properties from which natural gas is produced, the Partnership uses the entitlement method to account for any imbalances. Imbalances occur when the Partnership sells more or less product than the Partnership is entitled to under its ownership percentage. Revenue is recognized only on the entitlement percentage of volumes sold. Any amount that the Partnership sells in excess of its entitlement is treated as a liability and is not recognized as revenue. Any amount of entitlement in excess of the amount the Partnership sells is recognized as revenue and a receivable is accrued.
Segment Information. The Partnership acquires, exploits, develops, explores for and produces oil and gas. All of the Partnership's operations are located in the United States. The Partnership's management team administers all properties as a whole rather than as discrete operating segments. The Partnership tracks basic operational data by area. However, the Partnership measures financial performance as a single enterprise and not on an area-by-area basis. The Partnership allocates capital resources on a project-by-project basis across its entire asset base to maximize profitability without regard to individual areas or segments.
Use of Estimates. The preparation of financial statements in conformity with GAAP requires management to make estimates and assumptions that affect the reported amounts of assets and liabilities and disclosures of contingent assets and liabilities as of the date of the financial statements and the reported amounts of revenues and expenses during the period. Estimates and judgments are based on information available at the time such estimates and judgments are made. Adjustments made with respect to the use of these estimates and judgments often relate to information not previously available.
Uncertainties with respect to such estimates and judgments are inherent in the preparation of financial statements. Estimates and judgments are used in, among other things, (1) estimating oil and gas reserves, (2) estimating uncollected revenues, unbilled operating and general and administrative costs, capital expenditures and abandonment costs, (3) developing fair value assumptions, including estimates of future cash flows and discount rates, (4) analyzing long-lived assets for possible impairment, (5) estimating the useful lives of assets and (6) determining amounts to accrue for contingencies, guarantees and indemnifications. Actual results could differ materially from estimated amounts.
Recent Accounting Pronouncements
In June 2009, the Financial Accounting Standards Board ("FASB") established the ASC as the source of authoritative GAAP for U.S. companies. The ASC reorganized GAAP into a topical format and significantly changes the way users research accounting issues. For SEC registrants, the rules and interpretive releases of the SEC under federal securities laws are also sources of authoritative GAAP. References to specific GAAP in the Partnership's financial statements now refer exclusively to the ASC. The Partnership adopted the codification on December 31, 2009.
Business Combinations. In December 2007, FASB issued new guidance on business combinations. The new standard provides revised guidance on how acquirers recognize and measure the consideration
F-40
Dynamic Offshore Holding, LP
Notes to Consolidated Financial Statements (Continued)
Note 2—Significant Accounting Policies and Related Matters (Continued)
transferred, identifiable assets acquired, liabilities assumed, noncontrolling interests, and goodwill acquired in a business combination. The new standard also expands required disclosures surrounding the nature and financial effects of business combinations. The standard is effective, on a prospective basis, for fiscal years beginning after December 15, 2008. This guidance, which impacts business combinations with a closing date on or after January 1, 2009, did not have a material impact on the Partnership's financial position or results of operations upon adoption.
In April 2009, FASB issued new guidance on business combinations to amend and clarify application issues associated with initial recognition and measurement, subsequent measurement and accounting, and disclosure of assets and liabilities arising from contingencies in a business combination. The guidance is effective for assets or liabilities arising from contingencies in business combinations for which the acquisition date is on or after the beginning of the first annual reporting period beginning on or after December 15, 2008. The implementation of this standard did not have a material impact on the Partnership's financial position or results of operations.
Fair Value Measurements. In February 2008, FASB issued authoritative guidance deferring the effective date of the fair value guidance for all nonfinancial assets and nonfinancial liabilities to fiscal years beginning after November 15, 2008. The implementation of the fair value guidance for nonfinancial assets and nonfinancial liabilities, effective January 1, 2009, did not have a material impact on the Partnership's financial position or results of operations. See Note 11 for additional fair value information and disclosure for financial and nonfinancial assets and liabilities.
In September 2009, FASB issued additional guidance on measuring the fair value of liabilities effective for the first reporting period beginning after issuance. Implementation is not expected to have a material impact on the Partnership's financial position or results of operations.
Oil and Gas Reserve Estimation and Disclosure. In January 2010, FASB issued authoritative guidance on extractive activities for oil and gas reserve estimation and disclosures. The new guidance, among other purposes, is primarily intended to provide investors with a more meaningful and comprehensive understanding of oil and gas reserves by expanding the definition of proved oil and gas producing activities, requiring disclosure of geographical areas that represent a certain percentage of proved reserves, updating the reserve estimation requirements for changes in practice and technology that have occurred over the past several decades, amending the definition of proved oil and gas reserves to change the pricing used in estimating reserves to the simple arithmetic average of the prices posted on the first day of each month in the entity's fiscal year and requiring that an entity continue to disclose separately the amounts and quantities for consolidated and equity method investments. The implementation of this guidance did not have a material impact on the Partnership's financial position or results of operations.
Other. In May 2009, FASB issued new guidance on subsequent events, particularly with respect to management's assessment of subsequent events. The guidance is effective prospectively for interim and annual periods ending after June 15, 2009. The implementation of this guidance did not have a material impact on the Partnership's financial position or results of operations. See Note 1, Note 4, Note 9 and Note 18.
In December 2008, FASB provided for a deferral until fiscal periods beginning after December 15, 2008 of the effective date of ASC 740 as it pertains to accounting for uncertainty in income taxes for certain nonpublic enterprises. The Partnership previously elected this deferral and accordingly has
F-41
Dynamic Offshore Holding, LP
Notes to Consolidated Financial Statements (Continued)
Note 2—Significant Accounting Policies and Related Matters (Continued)
adopted the deferred guidance as of January 1, 2009. The Partnership's adoption of the guidance did not have a material effect on its consolidated financial statements.
Note 3—Consolidated Financial Statements Information
The following table shows additional consolidated balance sheets information at the dates indicated:
| |
December 31, | |||||||
|---|---|---|---|---|---|---|---|---|
| |
2010 | 2009 | ||||||
Accounts receivable from third parties |
||||||||
Operating revenues |
$ | 40,749 | $ | 37,580 | ||||
Joint interest receivables |
13,908 | 8,330 | ||||||
Derivative assets |
195 | 3,061 | ||||||
Other |
2,944 | 2,067 | ||||||
|
$ | 57,796 | $ | 51,038 | ||||
Other current assets |
||||||||
Prepaid insurance |
$ | 5,982 | $ | 11,256 | ||||
Prepaid royalties |
5,871 | 3,247 | ||||||
Advances to operators |
644 | 2,012 | ||||||
Deferred income taxes |
3,292 | 993 | ||||||
Other |
— | 528 | ||||||
|
$ | 15,789 | $ | 18,036 | ||||
Other assets |
||||||||
Natural gas imbalances receivable(1) |
$ | 12,916 | $ | 13,106 | ||||
Debt issue costs, net |
1,279 | 1,818 | ||||||
Restricted cash |
1,500 | 1,000 | ||||||
|
$ | 15,695 | $ | 15,924 | ||||
Other current liabilities |
||||||||
Accrued expenses |
$ | 37,372 | $ | 40,246 | ||||
Derivative liabilities |
17,176 | 1,761 | ||||||
Other |
2,232 | 53 | ||||||
|
$ | 56,780 | $ | 42,060 | ||||
F-42
Dynamic Offshore Holding, LP
Notes to Consolidated Financial Statements (Continued)
Note 3—Consolidated Financial Statements Information (Continued)
| |
December 31, | |||||||
|---|---|---|---|---|---|---|---|---|
| |
2010 | 2009 | ||||||
Other long-term liabilities |
||||||||
Natural gas imbalances payable(1) |
$ | 11,012 | $ | 11,417 | ||||
Long-term derivative liabilities |
9,254 | 5,406 | ||||||
Other |
322 | 610 | ||||||
|
$ | 20,588 | $ | 17,433 | ||||
- (1)
- As of December 31, 2010 and 2009, natural gas imbalances receivable were 3,946 MMcf and 3,512 MMcf. Natural gas imbalances payable were 3,516 MMcf and 2,395 MMcf as of the same dates.
Other operating expense comprised the following for the periods indicated:
| |
Year Ended December 31, | ||||||||||
|---|---|---|---|---|---|---|---|---|---|---|---|
| |
2010 | 2009 | 2008 | ||||||||
Other operating expense |
|||||||||||
Insurance expense |
$ | 36,677 | $ | 32,688 | $ | 14,315 | |||||
Workover expense |
15,827 | 6,696 | 1,134 | ||||||||
Accretion expense |
13,183 | 7,211 | 4,494 | ||||||||
Casualty loss (gain), net |
(3,380 | ) | — | 10,000 | |||||||
Loss on abandonments |
2,601 | 4,687 | — | ||||||||
Loss (gain) on sale of assets |
8,139 | (140 | ) | — | |||||||
Other |
— | — | (13 | ) | |||||||
|
$ | 73,047 | $ | 51,142 | $ | 29,930 | |||||
Note 4—DBH, LLC
DBH, which changed its name from Dynamic Beryl Holdings, LLC in January 2010, is a Delaware limited liability company that was formed on September 24, 2009 to acquire and own Bandon. On October 13, 2009, DBH issued member interests in the following transactions:
- •
- DOR made a $21.9 million cash contribution for a 62% member interest;
- •
- Superior Energy Investments, LLC ("SEI"), an affiliate of Superior Energy Services, Inc. ("Superior"), made
an $8.1 million cash contribution for a 23% member interest; and
- •
- the lenders under Bandon LP's second lien credit agreement contributed their loan receivable (fair value of $5.3 million) from Bandon LP for a 15% member interest.
In December 2010 DOR repurchased a 2.4% member interest for $1.6 million. The Partnership's capital accounts were adjusted for the $3.5 million difference between the settlement price paid to the withdrawing member and the book value of the withdrawing member's share of total members' capital at the time of the withdrawal. This amount is reflected in the consolidated statements of owners' equity.
F-43
Dynamic Offshore Holding, LP
Notes to Consolidated Financial Statements (Continued)
Note 4—DBH, LLC (Continued)
In November 2009 DBH repurchased a 4.3% member interest for $2.2 million. The repurchase was funded by capital contributions from the members of DBH, including $1.5 million contributed by DOR. The remaining members' capital accounts were adjusted for the difference between the settlement price paid to the withdrawing member and the book value of the withdrawing member's share of total members' capital at the time of the withdrawal. DOR apportionment of $6.5 million is reflected in the consolidated statements of owners' equity.
As of December 31, 2010, the Partnership owned a 68.7% controlling interest in DBH.
Subsequent Events. In 2011 DOR repurchased the remaining member interests in DBH from various members for $6.8 million. The Partnership's capital accounts were adjusted for the $5.1 million between the settlement price paid to the withdrawing members and the book value of the withdrawing members' share of total members' capital at the time of the withdrawal. As of June 1, 2011, the Partnership owns a 100% indirect controlling interest in DBH.
Note 5—Acquisitions
2010 Acquisitions
Bullwinkle Acquisition. On February 1, 2010, DOR and a wholly-owned subsidiary of Superior acquired the deepwater Gulf of Mexico Bullwinkle field and related infrastructure. DOR is now the operator and 49% owner of the field with Superior retaining the remaining interest. DOR is required to fund its share of the assumed asset retirement obligations, which has been capped at $49 million, by no later than January 31, 2013. The $49 million is payable in the following increments: (i) $1.8 million upon the permanent abandonment of each existing wellbore, (ii) sixteen monthly payments of $1.5 million, beginning on the last business day of February 2010, (iii) $1.0 million on the last business day of June 2011, and (iv) any remainder on January 31, 2013. In addition to the revenue generated from oil and gas production, the platform also generates revenue from several production handling arrangements for other third-party fields. Acquisition-related expenses of $0.1 million are included in general and administrative expense in the accompanying consolidated statements of operations.
Samson Acquisition. On July 8, 2010, DOR purchased substantially all of the oil and gas properties of Samson Offshore Company and Samson Contour Energy E&P, LLC (collectively, "Samson") located in the Gulf of Mexico for $97.7 million. Acquisition-related expenses of $0.1 million
F-44
Dynamic Offshore Holding, LP
Notes to Consolidated Financial Statements (Continued)
Note 5—Acquisitions (Continued)
are included in general and administrative expense in the accompanying consolidated statements of operations. The acquisition broadens the Partnership's leasehold footprint in the Gulf of Mexico.
| |
Year Ended December 31, 2010 | ||||||||||||||
|---|---|---|---|---|---|---|---|---|---|---|---|---|---|---|---|
| |
Bullwinkle | Samson | Other(1) | Total | |||||||||||
Consideration paid |
|||||||||||||||
Cash |
$ | — | $ | 97,693 | $ | 3,664 | $ | 101,357 | |||||||
|
$ | — | $ | 97,693 | $ | 3,664 | $ | 101,357 | |||||||
Assets acquired: |
|||||||||||||||
Cash |
$ | 3,498 | $ | — | $ | 5,417 | $ | 8,915 | |||||||
Prepaids |
— | 1,775 | — | 1,775 | |||||||||||
Property and equipment |
43,761 | 109,567 | 4,107 | 157,435 | |||||||||||
Other noncurrent assets |
148 | — | 17 | 165 | |||||||||||
Total assets acquired |
47,407 | 111,342 | 9,541 | 168,290 | |||||||||||
Liabilities assumed: |
|||||||||||||||
AROs, current portion |
34,079 | — | 1,410 | 35,489 | |||||||||||
Other current liabilities |
— | 70 | — | 70 | |||||||||||
AROs, noncurrent portion |
13,328 | 13,579 | 443 | 27,350 | |||||||||||
Total liabilities assumed |
47,407 | 13,649 | 1,853 | 62,909 | |||||||||||
Net assets acquired |
$ | — | $ | 97,693 | $ | 7,688 | $ | 105,381 | |||||||
Bargain purchase gain |
$ | — | $ | — | $ | 4,024 | $ | 4,024 | |||||||
- (1)
- Includes an acquisition pursuant to a preferential purchase right, wherein the seller had attributed a negative fair value to a property. As a result, the Partnership received $5.4 million in cash and the property, and recognized a bargain purchase gain of $4.0 million.
Actual and Pro Forma Impact of 2010 Acquisitions (Unaudited). Revenues attributable to the Bullwinkle and Samson acquisitions included in the Partnership's consolidated statement of operations for the year ended December 31, 2010 were $38.3 million and $26.8 million. Direct operating expenses attributable to the acquisitions included in the consolidated statement of operations for the same period were $5.8 million and $4.2 million.
F-45
Dynamic Offshore Holding, LP
Notes to Consolidated Financial Statements (Continued)
Note 5—Acquisitions (Continued)
The following table presents pro forma information for the Partnership as if the Bullwinkle and Samson acquisitions occurred on January 1, 2009:
| |
Year ended December 31, |
||||||
|---|---|---|---|---|---|---|---|
| |
2010 | 2009 | |||||
Revenues |
$ | 398,971 | $ | 308,846 | |||
Income (loss) from operations |
(4,871 | ) | 25,295 | ||||
Net income |
5,270 | 175,977 | |||||
Less: Net income (loss) attributable to noncontrolling interests |
(4,070 | ) | 57,663 | ||||
Net income attributable to Dynamic Offshore Holding, LP |
9,340 | 118,314 | |||||
The historical financial information was adjusted to give effect to the pro forma events that were directly attributable to the acquisitions and factually supportable. The unaudited pro forma consolidated results are not necessarily indicative of what the Partnership's consolidated results of operations actually would have been had the acquisitions been completed on January 1, 2009. In addition, the unaudited pro forma consolidated results do not purport to project the future results of operations of the combined company. The unaudited pro forma consolidated results reflect the direct operating expenses of the properties acquired, an adjustment for interest expense on borrowings to fund the Samson acquisition, as well as an adjustment to recognize incremental depreciation, depletion and amortization expense, using the unit-of-production method, resulting from the purchase of the properties.
2009 Acquisitions
Bayou Bend Acquisition. On May 29, 2009, DOR purchased substantially all of the U.S. oil and gas properties of Bayou Bend Petroleum Ltd. and its subsidiaries ("Bayou Bend") for $12.5 million. An additional payment of $1.1 million will be made on April 1, 2011, based upon the increase in proved oil and gas reserves attributable to the purchased interests as of December 31, 2010 above a specified threshold. The purchase price allocation did not reflect a liability for this contingent obligation. As a result, the amount was recorded to other expense during 2010.
The acquisition broadens the Partnership's leasehold footprint in the Gulf of Mexico and provides a new growth area for the Partnership in the shallow Louisiana state waters centered on the Marsh Island exploration project. Acquisition-related expenses of $0.3 million are included in general and administrative expense in the accompanying consolidated statements of operations.
Bandon Acquisition. On October 13, 2009, in a nonmonetary exchange with the prior owners of Bandon, DBH exchanged the loan receivable described in Note 4 for a 100% ownership interest in Bandon.
The acquisition substantially increased the Partnership's presence in the Gulf of Mexico. Acquisition-related expenses of $0.8 million are included in general and administrative expense in the accompanying consolidated statements of operations.
The acquisition was accounted for using the acquisition method and Bandon's results of operations were included in the Partnership's consolidated statement of operations effective October 13, 2009. During the measurement period, which ended October 12, 2010, DBH finalized the acquisition date
F-46
Dynamic Offshore Holding, LP
Notes to Consolidated Financial Statements (Continued)
Note 5—Acquisitions (Continued)
valuation of certain assets and liabilities related to the acquisition. As a result, the bargain purchase gain increased $0.5 million.
The acquisition date fair values of the assets acquired, liabilities assumed and the purchase price are shown below:
| |
Preliminary | Adjustments | Final | ||||||||
|---|---|---|---|---|---|---|---|---|---|---|---|
Assets acquired: |
|||||||||||
Cash |
$ | 40,524 | $ | 1,216 | $ | 41,740 | |||||
Hurricane insurance receivable |
30,008 | (133 | ) | 29,875 | |||||||
Other current assets |
41,329 | — | 41,329 | ||||||||
Property and equipment |
310,038 | 17,834 | 327,872 | ||||||||
Other noncurrent assets |
7,442 | 866 | 8,308 | ||||||||
|
429,341 | 19,783 | 449,124 | ||||||||
Purchase price plus liabilities assumed: |
|||||||||||
Purchase price |
(5,294 | ) | — | (5,294 | ) | ||||||
Asset retirement obligation, current portion |
(27,152 | ) | (17,834 | ) | (44,986 | ) | |||||
Other current liabilities |
(23,632 | ) | 363 | (23,269 | ) | ||||||
Long-term debt |
(151,224 | ) | — | (151,224 | ) | ||||||
Asset retirement obligations, noncurrent portion |
(55,726 | ) | — | (55,726 | ) | ||||||
Other noncurrent liabilities |
(5,436 | ) | (1,838 | ) | (7,274 | ) | |||||
|
(268,464 | ) | (19,309 | ) | (287,773 | ) | |||||
Bargain purchase gain |
$ | 160,877 | $ | 474 | $ | 161,351 | |||||
During the measurement period the Partnership recorded the following adjustments to the preliminary purchase price allocation:
- •
- a $1.2 million increase in cash to reflect a held check classified as outstanding in the initial purchase price
allocation;
- •
- a $0.1 million adjustment to hurricane insurance receivable to reflect payments received;
- •
- a $17.8 million increase to asset retirement obligations to reflect an adjustment to the original estimate of
abandonment costs, offset by a corresponding increase to property and equipment;
- •
- other noncurrent assets and liabilities were adjusted by $0.9 million and $1.6 million to adjust the initial estimate of natural gas imbalances; and
F-47
Dynamic Offshore Holding, LP
Notes to Consolidated Financial Statements (Continued)
Note 5—Acquisitions (Continued)
- •
- other current and noncurrent liabilities were adjusted by $0.4 million and $0.2 million to reflect adjustments to the original estimate of various accrued liabilities.
| |
Year Ended December 31, 2009 | ||||||||||||||
|---|---|---|---|---|---|---|---|---|---|---|---|---|---|---|---|
| |
Bandon(1) | Bayou Bend | Other | Total | |||||||||||
Consideration paid |
|||||||||||||||
Cash |
$ | — | $ | 12,500 | $ | 3,168 | $ | 15,668 | |||||||
Loan receivable |
5,294 | — | — | 5,294 | |||||||||||
|
$ | 5,294 | $ | 12,500 | $ | 3,168 | $ | 20,962 | |||||||
Assets acquired: |
|||||||||||||||
Cash |
$ | 41,740 | $ | — | $ | — | $ | 41,740 | |||||||
Hurricane insurance claims |
29,875 | — | — | 29,875 | |||||||||||
Other current assets |
41,329 | — | — | 41,329 | |||||||||||
Property and equipment |
327,872 | 13,645 | 3,168 | 344,685 | |||||||||||
Other noncurrent assets |
8,308 | — | — | 8,308 | |||||||||||
Total assets acquired |
449,124 | 13,645 | 3,168 | 465,937 | |||||||||||
Liabilities assumed: |
|||||||||||||||
AROs, current portion |
44,986 | 214 | — | 45,200 | |||||||||||
Other current liabilities |
23,269 | — | — | 23,269 | |||||||||||
Long-term debt |
151,224 | — | — | 151,224 | |||||||||||
AROs, noncurrent portion |
55,726 | 931 | — | 56,657 | |||||||||||
Other noncurrent liabilities |
7,274 | — | — | 7,274 | |||||||||||
Total liabilities assumed |
282,479 | 1,145 | — | 283,624 | |||||||||||
Net assets acquired |
$ |
166,645 |
$ |
12,500 |
$ |
3,168 |
$ |
182,313 |
|||||||
Bargain purchase gain |
$ |
161,351 |
$ |
— |
$ |
— |
$ |
161,351 |
|||||||
- (1)
- The Partnership's estimate of the net assets' fair value exceeded the fair value of the total consideration paid, which management believes resulted from Bandon's financial difficulties prior to the acquisition.
2008 Acquisitions
SPN Acquisition. On January 17, 2008 the Partnership entered into a purchase, contribution and redemption agreement with SESI, LLC ("SESI") and Moreno Group, LLC ("MOR"), an affiliate of the Partnership (see Note 13). In accordance with this agreement, MOR purchased 25% of the assets and liabilities of SPN Resources, LLC ("SPN"), a Louisiana limited liability company, then wholly owned by SESI, for $55 million. The Partnership purchased a 66.7% equity interest in SPN by way of a $110.0 million (subsequently, an additional $2.9 million paid as a post-closing adjustment) capital contribution to SPN, with SESI retaining a 33.3% equity interest. The closing date of the sale was March 14, 2008.
F-48
Dynamic Offshore Holding, LP
Notes to Consolidated Financial Statements (Continued)
Note 5—Acquisitions (Continued)
The Partnership's acquisition of shares in SPN was accounted for as a purchase and 66.7% of SPN's assets and liabilities were remeasured at fair value. Proportionate push-down accounting is appropriate when a collaborative group whose shares, when combined, result in an entity becoming substantially owned. SPN supported the inclusion of both DOH and SESI in satisfying the criteria of a collaborative group through transactions between SESI, DOH and MOR, the change in SPN's management team, drag-along rights obligating non-majority owners to sell their respective ownership, and provisions allowing for disproportionate board representation in relation to ownership, which support the combined efforts of the SPN owners. This resulted in proportionate push-down accounting for the acquisition of the 66.7% of the shares in SPN acquired by the Partnership, with the remaining 33.3% of SPN's assets and liabilities still owned by SESI recorded at historical book value. SPN's oil and gas property values were increased by $19.2 million and its net asset retirement obligation liability was decreased by $7.8 million. The purchase price allocation, which was preliminary as of December 31, 2008, did not change during 2009.
Northstar Acquisition. On July 7, 2008 the Partnership entered into an agreement with Northstar E&P, LP, a Texas limited partnership, to acquire all of the issued and outstanding common stock of their subsidiary, Northstar Exploration and Production, Inc. ("Northstar"), a Delaware corporation, for $235 million. The closing date of the acquisition was July 17, 2008. At closing, the Partnership paid an adjusted purchase price of $242.1 million, including acquisition-related expenses (subsequently, an additional $0.6 million paid as a post-closing adjustment). Concurrent with the acquisition, Northstar's name was changed to Dynamic Offshore Resources NS Parent, Inc.
Deferred income tax liabilities were recorded as a result of the tax effect of book to tax basis difference relating to the fair market value of the Northstar net assets acquired. Existing commodity derivative contracts on Northstar's books were assigned to the Partnership's primary lending institution on the same terms on July 17, 2008.
F-49
Dynamic Offshore Holding, LP
Notes to Consolidated Financial Statements (Continued)
Note 5—Acquisitions (Continued)
During 2009, adjustments to the preliminary purchase price allocation comprised: (i) a $2.0 million increase in deferred taxes, (ii) a $2.0 million decrease in working capital items, (iii) a $4.1 million increase in oil and gas properties, and (iv) a $0.1 million increase in the purchase price.
| |
Year Ended December 31, 2008 | |||||||||||
|---|---|---|---|---|---|---|---|---|---|---|---|---|
| |
Northstar | SPN | Total | |||||||||
Consideration paid |
||||||||||||
Cash |
$ | 241,434 | $ | 112,899 | $ | 354,333 | ||||||
|
$ | 241,434 | $ | 112,899 | $ | 354,333 | ||||||
Assets acquired: |
||||||||||||
Cash |
$ | 14,151 | $ | 18,391 | $ | 32,542 | ||||||
Other current assets |
61,083 | 59,125 | 120,208 | |||||||||
Property and equipment |
319,110 | 155,990 | 475,100 | |||||||||
Other noncurrent assets |
1,365 | 970 | 2,335 | |||||||||
Total assets acquired |
395,709 | 234,476 | 630,185 | |||||||||
Liabilities assumed: |
||||||||||||
AROs, current portion |
2,687 | 1,259 | 3,946 | |||||||||
Other current liabilities |
43,151 | 35,740 | 78,891 | |||||||||
AROs, noncurrent portion |
21,506 | 43,153 | 64,659 | |||||||||
Noncontrolling interest acquired |
— | 41,425 | 41,425 | |||||||||
Deferred tax liability |
79,262 | — | 79,262 | |||||||||
Other noncurrent liabilities |
7,669 | — | 7,669 | |||||||||
Total liabilities assumed |
154,275 | 121,577 | 275,852 | |||||||||
Net assets acquired |
$ |
241,434 |
$ |
112,899 |
$ |
354,333 |
||||||
Bargain purchase gain |
$ |
— |
$ |
— |
$ |
— |
||||||
Note 6—Property and Equipment
The components of property and equipment were as follows at the dates indicated:
| |
December 31, | ||||||
|---|---|---|---|---|---|---|---|
| |
2010 | 2009 | |||||
Proved oil and gas properties |
$ | 1,080,031 | $ | 845,835 | |||
Unproved oil and gas properties |
140,376 | 178,073 | |||||
Other property and equipment |
3,223 | 2,891 | |||||
|
1,223,630 | 1,026,799 | |||||
Accumulated depreciation, depletion and amortization |
(358,985 | ) | (165,595 | ) | |||
|
$ | 864,645 | $ | 861,204 | |||
F-50
Dynamic Offshore Holding, LP
Notes to Consolidated Financial Statements (Continued)
Note 6—Property and Equipment (Continued)
Substantially all of the Partnership's assets serve as collateral under the debt agreements, as discussed in Note 9. Additionally, substantially all of the oil and gas properties of SPN serve as collateral for oil and gas derivative instruments to which it is a party. The Partnership owns a 66.7% equity interest in SPN. See Note 18.
Asset Impairments. For the years ended December 31, 2010, 2009 and 2008, the Partnership determined that the carrying amount of certain of its oil and gas properties was not recoverable from estimated future net cash flows and, therefore, was impaired. The assets were written down to their estimated fair values, which were determined using discounted cash flow models. The discounted cash flow models used exchange-based forward commodity prices and a discount rate of 10%. Estimated future net cash flows from probable and possible reserves were risk-adjusted. The pre-tax impairment charges of $60.5 million ($52.5 million after-tax), $10.8 million ($7.0 million after-tax) and $7.0 million ($4.5 million after-tax) for 2010, 2009 and 2008 are included in the Partnership's consolidated statements of operations as incremental depreciation, depletion and amortization expense. See Note 11. For the year ended December 31, 2010, the entire pre-tax amount resulted from declines in natural gas prices and well performance issues. For the year ended December 31, 2009, the entire pre-tax amount resulted from changes in the estimated abandonment costs of properties acquired in the 2008 acquisition of DOR NS. For the year ended December 31, 2008, $4.8 million of the pre-tax amount was related to the loss of a platform due to Hurricane Ike. The remaining pre-tax $2.2 million charge resulted from an adverse change in commodity prices subsequent to the Northstar acquisition.
Note 7—Asset Retirement Obligations
The following table summarizes the activity for the Partnership's asset retirement obligations for the periods indicated:
| |
Year Ended December 31, | |||||||||
|---|---|---|---|---|---|---|---|---|---|---|
| |
2010 | 2009 | 2008 | |||||||
Beginning of period |
$ | 218,902 | $ | 111,804 | $ | — | ||||
Liabilities acquired |
62,837 | 101,858 | 110,347 | |||||||
Liabilities sold |
(1,287 | ) | (401 | ) | — | |||||
New liabilities |
— | — | 532 | |||||||
Liabilities settled |
(63,350 | ) | (18,604 | ) | (3,441 | ) | ||||
Accretion expense |
13,183 | 7,211 | 4,494 | |||||||
Revisions to previous estimates |
2,785 | 17,034 | (128 | ) | ||||||
End of period |
$ | 233,070 | $ | 218,902 | $ | 111,804 | ||||
Current portion |
$ | 71,225 | $ | 49,622 | $ | 8,663 | ||||
Long-term portion |
161,845 | 169,280 | 103,141 | |||||||
|
$ | 233,070 | $ | 218,902 | $ | 111,804 | ||||
Effective March 14, 2008 SPN entered into a turnkey platform abandonment contract with Superior whereby Superior will provide all well abandonment and platform decommissioning services for all properties owned and operated by SPN on that date at fixed prices upon abandonment of such properties. This contract covers only routine end-of-life well abandonment and pipeline and platform decommissioning for properties owned and operated by SPN at March 14, 2008 and has a remaining
F-51
Dynamic Offshore Holding, LP
Notes to Consolidated Financial Statements (Continued)
Note 7—Asset Retirement Obligations (Continued)
fixed price of approximately $134.8 million and $141.1 million as of December 31, 2010 and 2009. For any additional wells drilled and completed after March 15, 2008, the abandonment liability was estimated based on similar wells in the field. See Note 18.
Note 8—Notes Receivable
Notes receivable consist of contractual obligations of sellers of oil and gas properties to reimburse the Partnership a specified amount following the abandonment of acquired properties. The Partnership invoices the seller specified amounts following the performance of decommissioning operations (abandonment and structure removal) in accordance with the applicable agreements with the seller. These receivables are recorded at present value, and the related discounts are amortized to interest income, based on the expected timing of the decommissioning. For the years ended December 31, 2010, 2009 and 2008 the amortization was $1.1 million, $1.2 million and $1.1 million.
Note 9—Long-Term Debt
The Partnership had the following debt outstanding at the dates indicated:
| |
December 31, | |||||||
|---|---|---|---|---|---|---|---|---|
| |
2010 | 2009 | ||||||
Obligation of DOR(1) |
||||||||
Revolving Credit Agreement, variable rate, due July 2012 |
$ | 145,000 | $ | 138,000 | ||||
Obligations of Bandon(1) |
||||||||
Second Lien Term Loan, variable rate, due October 2014 |
58,205 | 105,000 | ||||||
Revolving Credit Agreement, variable rate, due October 2012 |
— | — | ||||||
|
$ | 203,205 | $ | 243,000 | ||||
Letters of credit issued |
$ | — | $ | — | ||||
- (1)
- The Partnership consolidates the debt of DOR and Bandon Oil and Gas, LP; however, the debt of DOR is secured by substantially all of the assets of DOR (other than its ownership in Bandon) and the debt of Bandon is secured by substantially all of the assets of Bandon. DOH does not provide guarantees of the indebtedness and none of DOH's directly owned assets are pledged as collateral for the indebtedness.
Description of Debt Obligations
Obligation of DOR
$350 Million Amended and Restated Credit Agreement. On July 17, 2008, DOR amended and restated its existing credit agreement to provide for a four year $350 million revolving credit facility ("the DOR Credit Facility") with a group of financial institutions ("the Lenders"). As of December 31, 2010 the borrowing base under the DOR Credit Facility was $195 million. In addition, the greater of $40 million or 30% of the borrowing base is available for the issuance of letters of credit.
F-52
Dynamic Offshore Holding, LP
Notes to Consolidated Financial Statements (Continued)
Note 9—Long-Term Debt (Continued)
The DOR Credit Facility is subject to semi-annual borrowing base redeterminations on April 1 and October 1 of each year. In addition to the scheduled semi-annual borrowing base redeterminations, the Lenders or the Partnership have the right to re-determine the borrowing base at any time, provided that no party can request more than one such redetermination between the regularly scheduled borrowing base redeterminations. The determination of the Partnership's borrowing base is subject to a number of factors, including the quantities of proved oil and gas reserves, the Lenders' price assumptions and other various factors, some of which may be out of the Partnership's control. The Lenders can re-determine the borrowing base to a lower level than the current borrowing base if they determine that the Partnership's oil and gas reserves, at the time of redetermination, are inadequate to support the borrowing base then in effect. In this case, the Partnership would be required to make three monthly payments each equal to one third of the amount by which the aggregate outstanding loans and letters of credit exceed the borrowing base.
Obligations under the DOR Credit Facility are secured by liens on substantially all of the Partnership's assets, excluding the Bandon assets. The DOR Credit Facility also contains other restrictive covenants, including, among other items, maintenance of leverage ratio, interest coverage ratio and current ratio (all as defined in the credit agreement), restrictions on cash dividends and restrictions on incurring additional indebtedness. The DOR Credit Facility also requires DOR to enter into commodity price hedging agreements for at least half of its estimated oil and gas production from proved developed producing reserves.
Under the DOR Credit Facility, outstanding balances bear interest at either the alternate base rate plus a margin (based on a sliding scale of 1.25% to 2.00% based upon borrowing base usage) or the London Interbank Offered Rate ("LIBOR") plus a margin (based on a sliding scale of 2.25% to 3.00% based upon borrowing base usage). The alternate base rate is equal to the higher of The Royal Bank of Scotland's prime rate or the federal funds rate plus 0.5% per annum, and the LIBOR is equal to the applicable British Bankers' Association LIBOR for deposits in U.S. dollars. The DOR Credit Facility also provides for commitment fees (based on a sliding scale of 0.25% to 0.375% based upon borrowing base usage) calculated on the difference between the borrowing base and the aggregate outstanding loans and letters of credit under the DOR Credit Facility.
Obligations of Bandon
Second Lien Amended and Restated Credit Agreement. On October 13, 2009, Bandon entered into a Second Lien Amended and Restated Credit Agreement (the "Second Lien Agreement"). Under the Second Lien Agreement, and in connection with the Bandon acquisition, amounts outstanding under Bandon's First Lien Credit Agreement were converted into $151.2 million in term loans under the Second Lien Agreement.
Amounts outstanding under the Second Lien Agreement bear interest at the greater of (i) LIBOR or (ii) 3.0%, plus 5.0%. Accrued interest is payable on the last business day of each calendar quarter, commencing on December 31, 2009 and ending on October 13, 2014 (the maturity date), as well as each time Bandon makes a repayment or prepayment under the Second Lien Agreement. Bandon is required to make prepayments with the proceeds from certain asset dispositions.
Obligations under the Second Lien Agreement are secured by second priority liens on substantially all of Bandon's assets. The Second Lien Agreement contains customary events of default and requires Bandon to satisfy various financial covenants, as defined in the Second Lien Agreement,
F-53
Dynamic Offshore Holding, LP
Notes to Consolidated Financial Statements (Continued)
Note 9—Long-Term Debt (Continued)
including: (i) maintain a Total Leverage Ratio of less than 4.0 to 1.0 and an Interest Coverage Ratio of at least 2.5 to 1.0, beginning with the fiscal quarter ending September 30, 2011; and (ii) maintain a current ratio as of the end of each calendar quarter of at least 1.0 to 1.0.
The Second Lien Agreement also limits Bandon's ability to pay dividends or make other distributions, make acquisitions, make changes in its capital structure, create liens, and incur additional indebtedness. The Second Lien Agreement also requires Bandon to enter into commodity price hedging agreements for at least half of its estimated oil and gas production from proved developed producing reserves.
Revolving Credit Agreement. On October 13, 2009, Bandon entered into a revolving credit facility to provide for a three-year $25.0 million revolving credit facility (the "Revolver"). At December 31, 2010, the borrowing base under the Revolver was $10.0 million with availability of $10.0 million. The full amount available under the Revolver is also available for the issuance of letters of credit.
The Revolver is subject to semiannual borrowing base redeterminations on April 1 and October 1 of each year. In addition to the scheduled semiannual borrowing base redetermination, the lenders or Bandon have the right to redetermine the borrowing base at any time, provided that no party can request more than one such redetermination between the regularly scheduled borrowing base redeterminations. The determination of Bandon's borrowing base is subject to a number of factors, including the quantities of proved oil and gas reserves, the lenders' price assumptions and other various factors, some of which may be out of Bandon's control. Bandon's lenders can redetermine the borrowing base to a lower level than the current borrowing base if they determine that the Partnership's oil and gas reserves, at the time of redetermination, are inadequate to support the borrowing base then in effect. In this case, Bandon would be required to make three monthly payments each equal to one third of the amount by which the aggregate outstanding loans and letters of credit exceed the borrowing base.
Obligations under the Revolver are secured by first priority liens on substantially all of Bandon's assets. The Revolver also contains other restrictive covenants, including, among other items, maintenance of a leverage ratio, an interest coverage ratio, a current ratio (all as defined in the Revolver), restrictions on cash dividends, and restrictions on incurring additional indebtedness.
Under the Revolver, outstanding balances bear interest at either the alternate base rate plus a margin (based upon a sliding scale of 1.50% to 2.25% based upon borrowing base usage) or LIBOR plus a margin (based upon a sliding scale of 2.50% to 3.25%, based upon borrowing base usage). The alternate base rate is equal to the higher of (i) the Royal Bank of Scotland's prime rate; (ii) the federal funds rate plus 0.50%; or (iii) LIBOR plus 1.00%. The Revolver also provides for commitment fees calculated as 0.50% multiplied by the difference between the borrowing base and the aggregate outstanding loans and letters of credit under the Revolver.
The Partnership's management believes the Partnership was in compliance with its debt covenants as of December 31, 2010.
F-54
Dynamic Offshore Holding, LP
Notes to Consolidated Financial Statements (Continued)
Note 9—Long-Term Debt (Continued)
The following table shows the range of interest rates paid and weighted average interest rate paid on our variable-rate debt obligations for the year ended December 31, 2010:
| |
Range of Interest Rates Paid |
Weighted Average Interest Rate Paid |
||||
|---|---|---|---|---|---|---|
Revolving Credit Agreement |
2.4% to 5.0% | 2.9 | % | |||
Second Lien Term Loan |
8.0% to 8.0% | 8.0 | % | |||
Subsequent Events. During June 2011, the following transactions occurred with regards to the debt obligations of DOR and Bandon:
- •
- DOR amended and restated its existing credit agreement to provide for a four-year $750 million
revolving credit facility (the "Amended DOR Credit Facility");
- •
- DOR received $175 million from the Amended DOR Credit Facility;
- •
- DOR repaid the outstanding balance of the Bandon Second Lien Agreement; and
- •
- DOR repaid the outstanding balance of the DOR Credit Facility.
Note 10—Risk Management Activities
The Partnership's principal market risks are its exposure to changes in commodity prices, particularly to the prices of oil and gas, nonperformance by the Partnership's counterparties, and changes in interest rates.
The Partnership's revenues are derived principally from the sale of oil and gas. The prices of oil and gas are subject to market fluctuations in response to changes in supply, demand, market uncertainty and a variety of additional factors beyond the Partnership's control. The Partnership monitors these risks and enters into commodity derivative transactions designed to mitigate the impact of commodity price fluctuations on the Partnership's business.
The primary purpose of the Partnership's commodity risk management activities is to hedge the Partnership's exposure to commodity price risk and reduce fluctuations in the Partnership's operating cash flow despite fluctuations in commodity prices. As of December 31, 2010, the Partnership has hedged the commodity price associated with a portion of its expected oil and gas sales volumes for the years 2011 through 2013 by entering into derivative financial instruments comprising swaps and collars. The percentages of the Partnership's expected oil and gas that are hedged decrease over time.
With swaps, the Partnership receives an agreed upon fixed price for a specified notional quantity of oil or gas and the Partnership pays the hedge counterparty a floating price for that same quantity based upon published index prices. Since the Partnership receives from its oil and gas marketing counterparties a price based on the same floating index price from the sale of the underlying physical commodity, these transactions are designed to effectively lock-in the agreed fixed price in advance for the volumes hedged. In order to avoid having a greater volume hedged than the Partnership's actual oil and gas sales volumes, the Partnership typically limits its use of swaps to hedge the prices of less than the Partnership's expected sales volumes.
In a typical collar transaction, if the floating price based on a market index is below the floor price in the derivative contract, the Partnership receives from the counterparty an amount equal to this
F-55
Dynamic Offshore Holding, LP
Notes to Consolidated Financial Statements (Continued)
Note 10—Risk Management Activities (Continued)
difference multiplied by the specified volume. If the floating price exceeds the floor price and is less than the ceiling price, no payment is required by either party. If the floating price exceeds the ceiling price, the Partnership must pay the counterparty an amount equal to the difference multiplied by the specified volume. If the Partnership has less production than the volumes specified under the collar transaction when the floating price exceeds the ceiling price, the Partnership must make payments against which there is no offsetting revenues from production.
The Partnership's commodity hedges may expose the Partnership to the risk of financial loss in certain circumstances. The Partnership's hedging arrangements provide the Partnership protection on the hedged volumes if market prices decline below the prices at which these hedges are set. If market prices rise above the prices at which the Partnership has hedged, the Partnership will receive less revenue on the hedged volumes than in the absence of hedges.
Interest Rate Risk. The Partnership is exposed to changes in interest rates, primarily as a result of variable rate borrowings under its debt agreements. To the extent that interest rates increase, interest expense for the Partnership's variable rate debt will also increase.
Credit Risk. The Partnership's credit exposure related to commodity derivative instruments is represented by the fair value of contracts with a net positive fair value to the Partnership at the reporting date. At such times, these outstanding instruments expose the Partnership to credit loss in the event of nonperformance by the counterparties to the agreements. Should the creditworthiness of one or more of the Partnership's counterparties decline, the Partnership's ability to mitigate nonperformance risk is limited to a counterparty agreeing to either a voluntary termination and subsequent cash settlement or a novation of the derivative contract to a third party. In the event of a counterparty default, the Partnership may sustain a loss and the Partnership's cash receipts could be negatively impacted.
As of December 31, 2010, an affiliate of RBS accounted for 100% of the Partnership's counterparty credit exposure related to commodity derivative instruments. RBS is a major financial institution possessing an investment grade credit rating, based upon minimum credit ratings assigned by Standard & Poor's Ratings Services, a division of the McGraw-Hill Companies, Inc.
F-56
Dynamic Offshore Holding, LP
Notes to Consolidated Financial Statements (Continued)
Note 10—Risk Management Activities (Continued)
The Partnership had commodity derivatives with the following terms outstanding as of December 31, 2010, none of which have been designated as cash-flow hedges:
| |
Year Ending December 31, | ||||||||||||
|---|---|---|---|---|---|---|---|---|---|---|---|---|---|
| |
2011 | 2012 | 2013 | ||||||||||
Crude Oil |
|||||||||||||
Swaps (barrels) |
1,644,000 | 1,202,000 | 150,000 | ||||||||||
Average price ($ per Bbl) |
85.60 | 87.59 | 81.90 | ||||||||||
Collars (barrels) |
360,000 | — | — | ||||||||||
Average price ($ per Bbl) |
|||||||||||||
Floor price (put) |
65.00 | — | — | ||||||||||
Ceiling price (call) |
87.90 | — | — | ||||||||||
Natural Gas |
|||||||||||||
Swaps (MMBtu) |
4,395,000 | 3,630,000 | — | ||||||||||
Average price ($ per MMBtu) |
5.98 | 6.16 | — | ||||||||||
Collars (MMBtu) |
5,740,000 | 2,115,000 | — | ||||||||||
Average price ($ per MMBtu) |
|||||||||||||
Floor price (put) |
5.21 | 5.00 | — | ||||||||||
Ceiling price (call) |
7.56 | 6.54 | — | ||||||||||
The following reflects the fair values of derivative instruments in the Partnership's consolidated balance sheets as of the dates indicated:
| |
Asset Derivatives | ||||||||
|---|---|---|---|---|---|---|---|---|---|
| |
|
Fair Value as of December 31, |
|||||||
| |
Balance Sheet Location | ||||||||
Derivatives not designated as hedging instruments under ASC 815 |
2010 | 2009 | |||||||
Commodity derivatives |
Current assets | $ | 11,990 | $ | 30,123 | ||||
Commodity derivatives |
Long-term assets | 4,919 | 3,704 | ||||||
| |
Liability Derivatives | ||||||||
|---|---|---|---|---|---|---|---|---|---|
| |
|
Fair Value as of December 31, |
|||||||
| |
Balance Sheet Location |
||||||||
Derivatives not designated as hedging instruments under ASC 815 |
2010 | 2009 | |||||||
Interest rate derivatives |
Current liabilities | $ | — | $ | 1,761 | ||||
Commodity derivatives |
Current liabilities | 17,176 | — | ||||||
Commodity derivatives |
Long-term liabilities | 9,254 | 5,406 | ||||||
See Note 11 for additional disclosures related to derivative instruments.
Note 11—Fair Value Measurements
Accounting standards pertaining to fair value measurements establish a three-tier fair value hierarchy, which prioritizes the inputs used in measuring fair value. These tiers include:
- •
- Level 1, defined as observable inputs such as quoted prices in active markets;
F-57
Dynamic Offshore Holding, LP
Notes to Consolidated Financial Statements (Continued)
Note 11—Fair Value Measurements (Continued)
- •
- Level 2, defined as inputs other than quoted prices in active markets that are either directly or indirectly
observable; and
- •
- Level 3, defined as unobservable inputs in which little or no market data exists, therefore requiring an entity to develop its own assumptions.
The Partnership's derivative contracts are reported in its consolidated financial statements at fair value. These contracts consist of over-the-counter swaps and collars, which are not traded on a public exchange.
The fair values of swap contracts are determined based on inputs that are readily available in public markets or can be derived from information available in publicly quoted markets. Therefore, the Partnership has categorized these swap contracts as Level 2.
For collars, the Partnership estimates the option value of the contract floors and ceilings using an option pricing model which takes into account market volatility, market prices and contract terms. Therefore, the Partnership has categorized its collars as Level 2.
The Partnership has consistently applied these valuation techniques and believes it has obtained the most accurate information available for the types of derivative contracts it holds.
The following table sets forth, by level within the fair value hierarchy, the Partnership's financial assets and liabilities measured at fair value on a recurring basis as of the dates indicated:
As of December 31, 2010
|
Total | Level 1 | Level 2 | Level 3 | |||||||||
|---|---|---|---|---|---|---|---|---|---|---|---|---|---|
Commodity derivative assets |
$ | 16,909 | $ | — | $ | 16,909 | $ | — | |||||
Commodity derivative liabilities |
$ | 26,430 | $ | — | $ | 26,430 | $ | — | |||||
As of December 31, 2009
|
Total | Level 1 | Level 2 | Level 3 | ||||||||||
|---|---|---|---|---|---|---|---|---|---|---|---|---|---|---|
Commodity derivative assets |
$ | 33,827 | $ | — | $ | 33,827 | $ | — | ||||||
Commodity derivative liabilities |
$ | 5,406 | $ | — | $ | 5,406 | $ | — | ||||||
Interest rate derivative liabilities |
1,761 | — | 1,761 | — | ||||||||||
Total liabilities |
$ | 7,167 | $ | — | $ | 7,167 | $ | — | ||||||
These financial assets and liabilities are classified in their entirety based on the lowest level of input that is significant to the fair value measurement. The Partnership's assessment of the significance of a particular input to the fair value measurement requires judgment, and may affect the valuation of the fair value assets and liabilities and their placement within the fair value hierarchy levels.
Certain nonfinancial assets and liabilities are measured at fair value on a nonrecurring basis and are subject to fair value adjustments under certain circumstances (e.g., when there is evidence of impairment).
F-58
Dynamic Offshore Holding, LP
Notes to Consolidated Financial Statements (Continued)
Note 11—Fair Value Measurements (Continued)
Asset Impairments. Information about impaired assets as of the dates of the assessment is as follows:
| |
Year Ended December 31, | |||||||||
|---|---|---|---|---|---|---|---|---|---|---|
| |
2010 | 2009 | 2008 | |||||||
Net Book Value(1) |
$ | 91,052 | $ | 12,044 | $ | 9,054 | ||||
Impairment Charge |
60,513 | 10,808 | 7,003 | |||||||
Level 3 |
30,539 | 1,236 | 2,051 | |||||||
- (1)
- Amount represents net book value at the date of impairment.
See Note 6 for a discussion of the methods and assumptions used to estimate the fair values of the impaired assets.
Note 12—Income Taxes
The components of the Partnership's provisions for federal income taxes were as follows for the periods indicated:
| |
Year Ended December 31, | |||||||||
|---|---|---|---|---|---|---|---|---|---|---|
| |
2010 | 2009(1) | 2008 | |||||||
Current benefit |
$ | — | $ | (2,188 | ) | $ | — | |||
Deferred (benefit) expense |
(14,814 | ) | (18,199 | ) | 14,738 | |||||
|
$ | (14,814 | ) | $ | (20,387 | ) | $ | 14,738 | ||
- (1)
- Net operating loss carryforwards reduced current expense by $3.6 million, but did not impact the overall provision.
Set forth below is a reconciliation between DOR NS' income tax benefit (expense) computed at the United States statutory rate on income (loss) before income taxes and the income tax benefit (expense) in the accompanying consolidated statements of operations:
| |
Year Ended December 31, | |||||||||
|---|---|---|---|---|---|---|---|---|---|---|
| |
2010 | 2009 | 2008 | |||||||
U.S. federal income tax provision at statutory rate |
$ | 15,507 | $ | 20,198 | $ | (14,738 | ) | |||
Non-deductible expenses |
(8 | ) | (22 | ) | — | |||||
Audit settlement |
(647 | ) | — | — | ||||||
Return to provision |
(507 | ) | — | — | ||||||
Other |
469 | 211 | — | |||||||
|
$ | 14,814 | $ | 20,387 | $ | (14,738 | ) | |||
No material uncertain tax positions were identified during 2010. The Partnership believes that DOR NS' income tax filing positions and deductions will more-likely-than-not be sustained on audit and does not anticipate any adjustments that will result in a material adverse effect on the Partnership's
F-59
Dynamic Offshore Holding, LP
Notes to Consolidated Financial Statements (Continued)
Note 12—Income Taxes (Continued)
financial condition, results of operations or cash flows. Therefore, no reserves for uncertain income tax positions have been recorded.
As of December 31, 2010, DOR NS had regular federal net operating loss carryforwards of $0.4 million, which begin to expire in 2027.
The components of DOR NS' deferred income tax assets and liabilities as of the dates indicated were as follows:
| |
December 31, | |||||||
|---|---|---|---|---|---|---|---|---|
| |
2010 | 2009 | ||||||
Deferred tax assets: |
||||||||
Asset retirement obligation |
$ | 11,913 | $ | 7,484 | ||||
Loss carryforwards |
144 | 8,305 | ||||||
Alternative minimum tax |
2,571 | 455 | ||||||
Allowance for bad debts |
577 | 537 | ||||||
Other |
— | 2 | ||||||
|
15,205 | 16,783 | ||||||
Deferred tax liabilities: |
||||||||
Derivative and financial instruments |
— | (3,062 | ) | |||||
Property and equipment |
(61,474 | ) | (76,920 | ) | ||||
|
(61,474 | ) | (79,982 | ) | ||||
Net deferred tax liabilities |
$ | (46,269 | ) | $ | (63,199 | ) | ||
Balance sheet classification of deferred tax assets and liabilities: |
||||||||
Current asset |
$ | 3,292 | $ | 993 | ||||
Long-term liability |
(49,561 | ) | (64,192 | ) | ||||
|
$ | (46,269 | ) | $ | (63,199 | ) | ||
Note 13—Related Party Transactions
Relationship with Superior. Affiliates of Superior own a noncontrolling interest in DBH and SPN, and are party to the turnkey platform abandonment contract described in Note 7. Superior provides various field-level services to the Partnership. These transactions were recorded in the consolidated financial statements as follows:
| |
December 31, | |||||||||
|---|---|---|---|---|---|---|---|---|---|---|
| |
2010 | 2009 | 2008 | |||||||
Insurance receivable |
$ | 4,436 | $ | 1,454 | $ | 382 | ||||
Additions to property and equipment |
4,429 | 3,815 | 8,620 | |||||||
Asset retirement obligations settled |
13,410 | 5,845 | 3,441 | |||||||
Lease operating expense |
2,311 | 1,665 | 789 | |||||||
Workover expense |
1,301 | 360 | 160 | |||||||
|
$ | 25,887 | $ | 13,139 | $ | 13,392 | ||||
F-60
Dynamic Offshore Holding, LP
Notes to Consolidated Financial Statements (Continued)
Note 13—Related Party Transactions (Continued)
See Note 18 for information on subsequent events related to our related party transactions.
Relationship with DOH GP. The Partnership has no employees. DOH GP charges all of its employee costs to the Partnership, at cost, as part of the administrative services agreement between DOH GP and DOR. DOR allocates employee costs charged by DOH GP and other general and administrative costs, at cost, among its consolidated subsidiaries and Moreno Offshore Resources, LLC ("MOR") based on an agreed sharing percentage. For the years ended December 31, 2010, 2009 and 2008, DOH GP charged DOR $15.4 million, $17.3 million and $6.0 million under the agreement, which is included in the accompanying consolidated statements of operations as general and administrative expense and lease operating expense.
Affiliate receivables and payables were as follows as of the dates indicated:
| |
December 31, | ||||||
|---|---|---|---|---|---|---|---|
| |
2010 | 2009 | |||||
Receivable from DOH GP |
$ | 6 | $ | 26 | |||
Payable to SESI and its affiliates |
$ | 50 | $ | 1,295 | |||
Payable to Riverstone Equity Partners, LP |
1,500 | 1,219 | |||||
Total amounts due to affiliates |
$ | 1,550 | $ | 2,514 | |||
Note 14—Owners' Equity
The limited partnership agreement (the "Agreement") of the Partnership, dated January 25, 2008, as amended, provides for Class A and Class B partners' ownership interest of the Partnership. As of December 31, 2010, there were 500 million Class A units and 2,000 Class B units authorized, with 224.9 million Class A units and 1,621 Class B units issued and outstanding. A substantial portion of the Class B units were granted prior to March 31, 2008.
Class B units: (i) represent a net profits interest in the Partnership; (ii) are subject to graded vesting provisions; (iii) are subject to customary forfeiture provisions; (iv) vest upon liquidity event or a change in control; (v) are non-transferable except in the event the employee is terminated, at which time the Partnership has the purchase right, in its sole discretion.
The grant-date fair value of a Class B unit is determined on the award date based on an assumed liquidation value of the Partnership. As such, new awards of Class B units have immaterial initial value.
In addition, 200 of the available, but unissued Class B units have been reserved for a bonus pool to be paid at the discretion of the Partnership's Chief Executive Officer and approved by DOH GP in connection with a liquidity event involving the Partnership. The bonus pool will be paid to certain members of the Partnership's management or other employees.
See also Note 18.
F-61
Dynamic Offshore Holding, LP
Notes to Consolidated Financial Statements (Continued)
Note 15—Hurricane Remediation and Insurance Claims
During 2008, Hurricanes Ike and Gustav caused property damage and disruptions to the Partnership's exploitation and production activities. The Partnership currently has insurance coverage for named windstorms but does not carry business interruption insurance. The Partnership recognizes insurance receivables with respect to capital, repair and plugging and abandonment costs as a result of hurricane damage when the Partnership deems collection of those receivables to be reasonably assured.
Except for the removal of a toppled platform that was supporting the Partnership's Ship Shoal Block 253 operations, activities related to the 2008 hurricanes are complete and the Partnership expects no further recognition of casualty gain or loss in its consolidated statements of operations with respect to those storms.
For the year ended December 31, 2010, the Partnership recognized a net $3.4 million casualty gain, primarily from the recognition of previously deferred amounts related to total loss facilities.
Note 16—Supplemental Cash Flow Information
The following table provides supplemental cash flow information for the periods indicated:
| |
Year Ended December 31, | |||||||||||
|---|---|---|---|---|---|---|---|---|---|---|---|---|
| |
2010 | 2009 | 2008 | |||||||||
Cash: |
||||||||||||
Interest paid |
$ | 11,589 | $ | 7,871 | $ | 3,525 | ||||||
Non-cash: |
||||||||||||
Contribution from noncontrolling interest |
— | 5,294 | — | |||||||||
Acquisition of Bandon |
— | 5,294 | — | |||||||||
Increase arising from purchase accounting: |
||||||||||||
Purchase of oil and gas properties |
44,189 | — | 2,899 | |||||||||
Purchase of noncontrolling interest in DBH (see Note 4) |
3,452 | 4,384 | — | |||||||||
F-62
Dynamic Offshore Holding, LP
Notes to Consolidated Financial Statements (Continued)
Note 17—Commitments and Contingencies
Operating Leases. The Partnership holds leases for office space in Houston, Texas. Noncancellable commitments under the leases are $2.4 million and $2.0 million for the years ending December 31, 2011 and 2012. During 2010, 2009 and 2008, the Partnership paid $2.3 million, $0.5 million and $0.7 million in rent under its operating leases.
Legal Proceedings. From time to time, the Partnership may be involved in litigation arising out of the normal course of its business. In management's opinion, the Partnership is not involved in any litigation, the outcome of which would have a material effect on its consolidated financial position, results of operations, or liquidity.
Note 18—Subsequent Events
SESI. On March 10, 2011, DOH acquired SESI's membership interests in SPN and DBH. As a result of this transaction and the acquisition of the remaining noncontrolling interests in DBH discussed in Note 4, the Partnership indirectly owns 100% of the membership interests in SPN and DBH.
Consideration for the acquisition was a 10% ownership interest in DOH and a modification of SPN's turnkey platform abandonment contract with Superior as described in Note 7. Under the modified contract, Superior will provide well abandonment and pipeline and platform decommissioning services with respect to the specified properties for the greater of its actual cost or the original turnkey amount. The Partnership is evaluating the modification, but does not expect it to have a material effect on its consolidated financial position, results of operations, or liquidity.
F-63
Supplemental Information on Oil and Gas Producing Activities (Unaudited)
Supplemental Oil and Gas Disclosures
(Unaudited)
Except as noted within the context of each disclosure, the dollar amounts presented in the tabular data herein are stated in thousands of dollars.
The supplemental data presented herein reflects information for the Partnership's crude oil and natural gas producing activities, all of which are in the United States of America.
Results of Operations for Oil and Gas Producing Activities
Our results of operations from oil and gas producing activities below exclude non-oil and gas revenues, general and administrative expenses, interest charges and interest income. Income tax expense was determined by applying the statutory rates to pretax operating results of our taxable subsidiary:
| |
Year Ended December 31, | |||||||||
|---|---|---|---|---|---|---|---|---|---|---|
| |
2010 | 2009 | 2008 | |||||||
Revenues from oil and gas producing activities |
$ | 345,812 | $ | 178,992 | $ | 209,219 | ||||
Production costs |
(89,399 | ) | (60,618 | ) | (36,725 | ) | ||||
Workover costs |
(15,827 | ) | (6,696 | ) | (1,134 | ) | ||||
Accretion expense |
(13,183 | ) | (7,211 | ) | (4,494 | ) | ||||
Loss on abandonments |
(2,601 | ) | (4,687 | ) | — | |||||
Exploration expenses |
(2,100 | ) | (8,999 | ) | (80 | ) | ||||
Depreciation, depletion and amortization expense(1) |
(194,358 | ) | (87,917 | ) | (49,270 | ) | ||||
Income tax (expense) benefit |
10,548 | 3,505 | (1,520 | ) | ||||||
Results of operations from producing activities (excluding general and administrative and interest costs) |
$ | 33,892 | $ | 6,369 | $ | 115,996 | ||||
- (1)
- This amount only reflects DD&A of capitalized costs of proved oil and gas properties and, therefore, does not agree with DD&A reflected in the statement of operations.
Oil and Gas Reserves
The Partnership's estimates of proved reserves as of December 31, 2010, 2009 and 2008 are based on estimates prepared by our internal engineers, in accordance with the rules and regulations regarding oil and natural gas reserve reporting. Users of this information should be aware that the process of estimating quantities of "proved" and "proved-developed" crude oil and natural gas reserves is very complex, requiring significant subjective decision making in the analysis and evaluation of all geological, engineering, and economic data for each reservoir. The data for a given reservoir may also change substantially over time as a result of numerous factors, including additional development activity, additional production data, evolving production history, and continual reassessment of the viability of production under different economic conditions. Consequently, material revisions to existing reserve estimates occur from time to time. Although every reasonable effort is made to ensure that the reported reserve estimates represent the most accurate assessments possible, the significance of the subjective decisions required and variances in available data for various reservoirs make these estimates generally less precise than other estimates presented in connection with financial statement disclosures. Proved oil and gas reserves are those quantities of oil and gas, which, by analysis of geoscience and
F-64
engineering data, can be estimated with reasonable certainty to be economically producible from a given date forward, from known reservoirs, and under existing economic conditions, operating methods, and government regulation before the time at which contracts providing the right to operate expire, unless evidence indicates that renewal is reasonably certain, regardless of whether the estimate is a deterministic estimate or probabilistic estimate. Proved developed oil and gas reserves are proved reserves that can be expected to be recovered: (i) through existing wells with existing equipment and operating methods or in which the cost of the required equipment is relatively minor compared with the cost of a new well, and (ii) through installed extraction equipment and infrastructure operational at the time of the reserves estimate if the extraction is by means not involving a well.
F-65
The following table sets forth the Partnership's net proved reserves, including changes therein:
| |
Crude oil (MBbl) |
Natural gas (MMcf) |
||||||
|---|---|---|---|---|---|---|---|---|
2008 |
||||||||
Proved Reserves |
||||||||
Beginning balance |
— | — | ||||||
Revision of previous estimates |
3,007 | 8,084 | ||||||
Extensions, discoveries and other additions |
— | — | ||||||
Purchase of reserves in-place |
11,492 | 60,244 | ||||||
Sale of reserves in-place |
— | — | ||||||
Production |
(1,363 | ) | (6,692 | ) | ||||
Ending balance |
13,136 | 61,636 | ||||||
Proved Developed Reserves, December 31, 2008 |
11,072 | 55,445 | ||||||
Proved Undeveloped Reserves, December 31, 2008 |
2,064 | 6,191 | ||||||
2009 |
||||||||
Proved Reserves |
||||||||
Beginning balance |
13,136 | 61,636 | ||||||
Revision of previous estimates |
1,570 | (935 | ) | |||||
Extensions, discoveries and other additions |
— | — | ||||||
Purchase of reserves in-place |
3,783 | 69,795 | ||||||
Sale of reserves in-place |
— | — | ||||||
Production |
(2,145 | ) | (10,555 | ) | ||||
Ending balance |
16,344 | 119,941 | ||||||
Proved Developed Reserves, December 31, 2009 |
14,031 | 101,771 | ||||||
Proved Undeveloped Reserves, December 31, 2009 |
2,313 | 18,170 | ||||||
2010 |
||||||||
Proved Reserves |
||||||||
Beginning balance |
16,344 | 119,941 | ||||||
Revision of previous estimates |
3,266 | 5,554 | ||||||
Extensions, discoveries and other additions |
196 | 2,696 | ||||||
Purchase of reserves in-place |
7,959 | 19,455 | ||||||
Sale of reserves in-place |
(132 | ) | (5,475 | ) | ||||
Production |
(3,289 | ) | (18,468 | ) | ||||
Ending balance |
24,344 | 123,703 | ||||||
Proved Developed Reserves, December 31, 2010 |
20,191 | 110,253 | ||||||
Proved Undeveloped Reserves, December 31, 2010 |
4,153 | 13,450 | ||||||
As of December 31, 2010, 2009 and 2008, proved reserves attributable to noncontrolling interests in consolidated subsidiaries were 17%, 23% and 16% of the total.
Costs Incurred in Oil and Gas Property Acquisition, Exploration, and Development Activities
Costs incurred, on an accrual basis, represent amounts capitalized or expensed during the three years ended December 31, 2010 for property acquisition, exploration, development and abandonment
F-66
activities. Costs incurred for property acquisitions, exploration, development and abandonment activities were as follows:
| |
Year Ended December 31, | ||||||||||
|---|---|---|---|---|---|---|---|---|---|---|---|
| |
2010 | 2009 | 2008 | ||||||||
Acquisition costs |
|||||||||||
Proved properties |
$ | 157,435 | $ | 251,976 | $ | 440,750 | |||||
Unproved properties |
541 | 94,459 | 91,780 | ||||||||
Exploration costs |
19,357 | 10,531 | 80 | ||||||||
Development costs |
39,600 | 41,182 | 66,793 | ||||||||
Asset retirement costs |
65,951 | 23,291 | 3,441 | ||||||||
Total costs incurred |
$ | 282,884 | $ | 421,439 | $ | 602,844 | |||||
Capitalized Costs
The following table presents the aggregate capitalized costs relating to our oil and gas acquisition, exploration and development activities, and the aggregate related accumulated DD&A:
| |
December 31, | |||||||||
|---|---|---|---|---|---|---|---|---|---|---|
| |
2010 | 2009 | 2008 | |||||||
Unproved oil and gas properties |
$ | 140,376 | $ | 178,073 | $ | 90,292 | ||||
Proved oil and gas properties |
1,080,031 | 845,835 | 530,979 | |||||||
Accumulated depreciation, depletion and amortization |
(356,695 | ) | (164,347 | ) | (76,117 | ) | ||||
Capitalized costs, net |
$ | 863,712 | $ | 859,561 | $ | 545,154 | ||||
The costs of unproved oil and gas properties are excluded from amortization until the properties are evaluated. Costs are transferred into the amortization base on an ongoing basis as the properties are evaluated and proved reserves are established or impairment is determined. Unproved properties are assessed periodically, at least annually, to determine whether impairment has occurred. We assess properties on an individual basis or as a group if properties are individually insignificant. The assessment considers the following factors, among others: intent to drill, remaining lease term, geological and geophysical evaluations, drilling results and activity, the assignment of proved reserves and the economic viability of development if proved reserves are assigned. During any period in which these factors indicate an impairment, the associated costs are transferred to proved properties and are then subject to amortization. The transfer of costs into proved properties involves a significant amount of judgment and may be subject to changes over time based on our drilling plans and results, geological and geophysical evaluations, the assignment of proved reserves, availability of capital, and other factors. Costs not subject to amortization consist primarily of the estimated fair value of acquired unproved reserves. Due to the nature of the reserves, the ultimate evaluation of the properties will occur over a period of several years.
Standardized Measure of Discounted Future Net Cash Flows Relating to Proved Oil and Natural Gas Reserves
The following tables set forth the computation of the standardized measure of discounted future net cash flows (the "Standardized Measure") relating to proved reserves and the changes in such cash flows of the Partnership's oil and gas properties in accordance with the FASB's authoritative guidance related to disclosures about oil and gas producing activities. The Standardized Measure is the estimated net future cash inflows from proved reserves less estimated future production and development costs, estimated plugging and abandonment costs, estimated future income taxes (if applicable) and a
F-67
discount factor. Production costs do not include depreciation, depletion and amortization of capitalized acquisitions, exploration and development costs. Future cash inflows represent expected revenues from production of period-end quantities of proved reserves based on the un-weighted arithmetic average first-day-of-the-month index prices for the preceding 12 months for proved reserves as of December 31, 2010 and 2009, and period-end index prices for reserves as of December 31, 2008. These prices were $79.40/Bbl for oil and $4.38/MMBtu for natural gas at December 31, 2010; $61.04/Bbl for oil and $3.86/MMBtu for natural gas at December 31, 2009; and $44.60/Bbl for oil and $5.62/MMBtu for natural gas at December 31, 2008. These prices were adjusted by lease for quality, transportation fees, historical geographical differentials, marketing bonuses or deductions and other factors affecting the price received at the wellhead. Price changes based on inflation, federal regulatory changes and supply and demand are not considered. Estimated future production costs related to period-end reserves are based on period-end costs. Such costs include, but are not limited to, production taxes and direct operating costs. Inflation and other anticipatory costs are not considered until the actual cost change takes effect. In accordance with the FASB's authoritative guidance, a discount rate of 10% is applied to the annual future net cash flows. Future income taxes were calculated by applying the statutory federal income tax rate to pre-tax future net cash flows of properties owned by our taxable subsidiary, net of the tax basis of the properties involved and utilization of available tax carryforwards related to oil and gas operations.
The Standardized Measure is not intended to be representative of the fair market value of the proved reserves. The calculations of revenues and costs do not necessarily represent the amounts to be received or expended. Accordingly, the estimates of future net cash flows from proved reserves and the present value thereof may not be materially correct when judged against actual subsequent results. Further, since prices and costs do not remain static, and no price or cost changes have been considered, and future production and development costs are estimates to be incurred in developing and producing the estimated proved oil and gas reserves, the results are not necessarily indicative of the fair market value of estimated proved reserves, and the results may not be comparable to estimates disclosed by other oil and gas producers.
The Standardized Measure of discounted future net cash flows relating to proved oil and natural gas reserves is as follows:
| |
December 31, | |||||||||
|---|---|---|---|---|---|---|---|---|---|---|
| |
2010 | 2009 | 2008 | |||||||
Future cash inflows |
$ | 2,528,761 | $ | 1,414,485 | $ | 911,737 | ||||
Future production costs |
(499,846 | ) | (373,641 | ) | (308,590 | ) | ||||
Future development and abandonment costs |
(511,596 | ) | (450,839 | ) | (293,978 | ) | ||||
Future income tax expense |
(30,106 | ) | (29,113 | ) | (35,204 | ) | ||||
Future net cash flows |
1,487,213 | 560,892 | 273,965 | |||||||
10% annual discount for estimated timing of cash flows |
(302,695 | ) | (85,254 | ) | (19,259 | ) | ||||
Standardized measure of discounted future net cash flows |
$ | 1,184,518 | $ | 475,638 | $ | 254,706 | ||||
As of December 31, 2010, 2009 and 2008, 14%, 22% and 15% of the Standardized Measure was attributable to noncontrolling interests in consolidated subsidiaries.
F-68
A summary of the changes in the Standardized Measure of discounted future net cash flows applicable to proved oil and natural gas reserves for the three years ended December 31, 2010 is as follows:
| |
Year Ended December 31, | |||||||||
|---|---|---|---|---|---|---|---|---|---|---|
| |
2010 | 2009 | 2008 | |||||||
Beginning of year |
$ | 475,638 | $ | 254,706 | $ | — | ||||
Sales and transfers of oil and natural gas produced, net of production costs |
(256,413 | ) | (118,374 | ) | (172,494 | ) | ||||
Net changes in prices and production costs |
383,400 | 48,305 | (867,816 | ) | ||||||
Net changes in estimated future development costs |
11,277 | (6,435 | ) | (8,526 | ) | |||||
Extensions and discoveries |
18,672 | — | — | |||||||
Revisions of quantity estimates |
157,489 | 29,079 | 28,944 | |||||||
Development costs incurred |
99,983 | 45,652 | 51,202 | |||||||
Purchase and sales of reserves in place |
231,933 | 191,268 | 1,020,317 | |||||||
Changes in production rates (timing) and other |
(3,144 | ) | (1,503 | ) | (26,279 | ) | ||||
Net change in income taxes |
1,224 | 3,326 | 152,672 | |||||||
Accretion of discount |
64,459 | 29,614 | 76,686 | |||||||
Net increase |
708,880 | 220,932 | 254,706 | |||||||
End of year |
$ | 1,184,518 | $ | 475,638 | $ | 254,706 | ||||
F-69
Report of Independent Registered Public Accounting Firm
To
the Board of Directors and Shareholder
of Dynamic Offshore Resources, Inc.
We have audited the accompanying balance sheet of Dynamic Offshore Resources, Inc. (the "Company") as of September 30, 2011. This financial statement is the responsibility of the Company's management. Our responsibility is to express an opinion on this financial statement based on our audit.
We conducted our audit in accordance with the standards of the Public Company Accounting Oversight Board (United States). Those standards require that we plan and perform the audit to obtain reasonable assurance about whether the financial statement is free of material misstatement. An audit includes examining, on a test basis, evidence supporting the amounts and disclosures in the financial statement. An audit also includes assessing the accounting principles used and significant estimates made by management, as well as evaluating the overall financial statement presentation. We believe that out audit provides a reasonable basis for our opinion.
In our opinion, the financial statement referred to above presents fairly, in all material respects, the financial position of Dynamic Offshore Resources, Inc. as of September 30, 2011, in conformity with accounting principles generally accepted in the United States of America.
| /s/ Hein & Associates LLP Houston, Texas January 6, 2012 |
F-70
DYNAMIC OFFSHORE RESOURCES, INC.
BALANCE SHEET
September 30, 2011
Assets |
||||||
Cash |
$ | 1,000 | ||||
Total assets |
$ | 1,000 | ||||
Shareholder's Equity |
||||||
Common stock, $0.01 par value, 1,000 shares authorized, issued and outstanding at September 30, 2011 |
$ | 10 | ||||
Paid-in capital |
990 | |||||
Total shareholder's equity |
$ | 1,000 | ||||
See notes to balance sheet
F-71
DYNAMIC OFFSHORE RESOURCES, INC.
Notes to Balance Sheet
Note 1—Nature of Operations
Dynamic Offshore Resources, Inc. (the "Company") was formed on August 18, 2011 pursuant to the laws of the State of Delaware to become the corporate parent of Dynamic Offshore Holding, LP.
Note 2—Summary of Significant Accounting Policies
Basis of Presentation. This balance sheet has been prepared in accordance with accounting principles generally accepted in the United States of America. Separate Statements of Operations, Cash Flows and Shareholder's Equity have not been presented because the Company has had no business transactions or activities to date.
F-72
Report of Independent Registered Public Accounting Firm
To
the Board of Partners of
Dynamic Offshore Holding, LP
We have audited the accompanying statements of revenues and direct operating expenses of the XTO Acquisition Properties for the years ended December 31, 2010 and 2009. These financial statements are the responsibility of the Partnership's management. Our responsibility is to express an opinion on these financial statements based on our audits.
We conducted our audits in accordance with the standards of the Public Company Accounting Oversight Board (United States). Those standards require that we plan and perform the audits to obtain reasonable assurance about whether the financial statements are free of material misstatement. An audit includes examining, on a test basis, evidence supporting the amounts and disclosures in the financial statements. An audit also includes assessing the accounting principles used and significant estimates made by management, as well as evaluating the overall financial statement presentation. We believe that our audits provide a reasonable basis for our opinion.
In our opinion, the financial statements referred to above present fairly, in all material respects, the revenues and direct operating expenses of the XTO Acquisition Properties described in Note 1 for the years ended December 31, 2010 and 2009, in conformity with accounting principles generally accepted in the United States of America.
The accompanying financial statements reflect the revenues and direct operating expenses of the XTO Acquisition Properties as described in Note 1 and are not intended to be a complete presentation of the financial position, results of operations, or cash flows of the XTO Acquisition Properties.
Hein &
Associates LLP
Houston, Texas
November 8, 2011
F-73
XTO ACQUISITION PROPERTIES
STATEMENTS OF REVENUES AND DIRECT OPERATING EXPENSES
(In thousands)
| |
Six Months Ended June 30, |
Year Ended December 31, |
|||||||||||
|---|---|---|---|---|---|---|---|---|---|---|---|---|---|
| |
2011 | 2010 | 2010 | 2009 | |||||||||
| |
(Unaudited) |
|
|
||||||||||
Oil and gas revenues |
$ | 67,793 | $ | 85,173 | $ | 154,367 | $ | 170,045 | |||||
Direct operating expenses |
17,006 | 19,419 | 37,530 | 37,862 | |||||||||
Excess of revenues over direct operating expenses |
$ | 50,787 | $ | 65,754 | $ | 116,837 | $ | 132,183 | |||||
See notes to statements of revenues and direct operating expenses
F-74
XTO ACQUISITION PROPERTIES
Notes to Statements of Revenues and Direct Operating Expenses
Except as noted within the context of each footnote disclosure, the dollar amounts presented in the tabular data within these footnote disclosures are stated in thousands of dollars.
Note 1—Properties and Basis of Presentation
The accompanying statements represent the interests in the revenues and direct operating expenses of the oil and natural gas producing properties acquired by Dynamic Offshore Holding, LP (the "Partnership") from XTO Offshore Inc., HHE Energy Company and XH, LLC, each an indirect subsidiary of Exxon Mobil Corporation, (collectively, "XTO") effective August 1, 2011. The Partnership paid $173.7 million for the properties. The properties are referred to herein as the "XTO Acquisition Properties" and are located in the Gulf of Mexico.
The statements of revenues and direct operating expenses have been derived from XTO's historical financial records and prepared on the accrual basis of accounting. Revenues and direct operating expenses relate to the historical net revenue interests and net working interests in the XTO Acquisition Properties. Oil, gas and condensate revenues are recognized on the sales method when production is sold to a purchaser at a fixed or determinable price, when delivery has occurred and title has transferred, and if collectability of the revenue is probable. Revenues are reported net of overriding and other royalties due to third parties. Direct operating expenses include lease operating expenses, production and ad valorem taxes, transportation and all other direct operating costs associated with the properties. Direct operating expenses include $0.3 million and $6.5 million of insurance costs allocated by XTO for the years ended December 31, 2010 and 2009. For each of the six months ended June 30, 2011 and 2010, direct operating expenses include $0.1 million of insurance costs allocated by XTO. Direct operating expenses do not include corporate overhead, interest expense and income taxes.
The statements of revenues and direct operating expenses are not indicative of the financial condition or results of operations of the XTO Acquisition Properties going forward due to the omission of various operating expenses. During the periods presented, the XTO Acquisition Properties were not accounted for by XTO as a separate business unit. As such, certain costs, such as depreciation, depletion and amortization, accretion of asset retirement obligations, general and administrative expenses and interest expense were not allocated to the XTO Acquisition Properties.
Note 2—Omitted Financial Information
Historical financial statements reflecting financial position, results of operations and cash flows required by accounting principles generally accepted in the United States of America are not presented as such information is not available on a property-by-property basis, nor is it practicable to obtain such information in these circumstances. Historically, no allocation of general and administrative, interest expense, corporate taxes, accretion of asset retirement obligations, and depreciation, depletion and amortization was made to the XTO Acquisition Properties. Accordingly, the statements of revenues and direct operating expenses are presented in lieu of the financial statements required under Rule 3-01 and Rule 3-02 of the Securities and Exchange Commission's Regulation S-X.
F-75
Supplemental Oil and Gas Reserve Information (Unaudited)
Except as noted within the context of each disclosure, the dollar amounts presented in the tabular data herein are stated in thousands of dollars.
Oil and Gas Reserve Information
The following tables summarize the net ownership interests in estimated quantities of proved and proved developed oil and natural gas reserves of the XTO Acquisition Properties for the periods indicated, estimated by the Partnership's petroleum engineers, and the related summary of changes in estimated quantities of net remaining proved reserves during the periods indicated.
| |
Crude oil (MBbl) |
Natural gas (MMcf) |
||||||
|---|---|---|---|---|---|---|---|---|
2009 |
||||||||
Proved Reserves |
||||||||
Beginning balance |
8,494 | 85,199 | ||||||
Production |
(1,594 | ) | (17,568 | ) | ||||
Ending balance |
6,900 | 67,631 | ||||||
Proved Developed Reserves, December 31, 2009 |
6,087 | 49,674 | ||||||
Proved Undeveloped Reserves, December 31, 2009 |
813 | 17,957 | ||||||
2010 |
||||||||
Proved Reserves |
||||||||
Beginning balance |
6,900 | 67,631 | ||||||
Production |
(1,145 | ) | (12,899 | ) | ||||
Ending balance |
5,755 | 54,732 | ||||||
Proved Developed Reserves, December 31, 2010 |
4,958 | 36,878 | ||||||
Proved Undeveloped Reserves, December 31, 2010 |
797 | 17,854 | ||||||
Proved reserves are estimated quantities of oil and natural gas which geological and engineering data demonstrate, with reasonable certainty, to be recoverable in future years from known reservoirs under existing economic and operating conditions (i.e., prices and costs) existing at the time the estimate is made. Proved developed reserves are proved reserves that can be expected to be recovered through existing wells and equipment in place and under operating methods being utilized at the time the estimates were made.
Standardized Measure of Discounted Future Net Cash Flows Relating to Proved Oil and Natural Gas Reserves.
The following tables set forth the computation of the standardized measure of discounted future net cash flows (the "Standardized Measure") relating to proved reserves and the changes in such cash flows of the XTO Acquisition Properties in accordance with the Financial Accounting Standards Board's ("FASB") authoritative guidance related to disclosures about oil and gas producing activities. The Standardized Measure is the estimated net future cash inflows from proved reserves less estimated future production and development costs, estimated plugging and abandonment costs, estimated future income taxes (if applicable) and a discount factor. Production costs do not include depreciation, depletion and amortization of capitalized acquisitions, exploration and development costs. Future cash inflows represent expected revenues from production of period-end quantities of proved reserves based on the unweighted average of first-day-of-the-month commodity prices for the period and any fixed and determinable future price changes provided by contractual arrangements in existence at period end.
F-76
Price changes based on inflation, federal regulatory changes and supply and demand are not considered. Estimated future production costs related to period-end reserves are based on period-end costs. Such costs include, but are not limited to, production taxes and direct operating costs. Inflation and other anticipatory costs are not considered until the actual cost change takes effect. In accordance with the FASB's authoritative guidance, a discount rate of 10% is applied to the annual future net cash flows.
In calculating the Standardized Measure, future net cash inflows were estimated by using the unweighted average of first-day-of-the-month oil and gas prices for the period with the estimated future production of period-end proved reserves and assume continuation of existing economic conditions. These prices were $79.40 per barrel of oil and $4.38 per MMBtu of natural gas at December 31, 2010 and $61.04 per barrel of oil and $3.86 per MMBtu of natural gas at December 31, 2009. The index prices have been adjusted for historical average location and quality differentials. Future cash inflows were reduced by estimated future development, abandonment and production costs based on period-end costs resulting in net cash flow before tax. Future income tax expense was not considered as the Partnership and the XTO Acquisition Properties are not tax-paying entities.
The Standardized Measure is not intended to be representative of the fair market value of the proved reserves. The calculations of revenues and costs do not necessarily represent the amounts to be received or expended. Accordingly, the estimates of future net cash flows from proved reserves and the present value thereof may not be materially correct when judged against actual subsequent results. Further, since prices and costs do not remain static, and no price or cost changes have been considered, and future production and development costs are estimates to be incurred in developing and producing the estimated proved oil and gas reserves, the results are not necessarily indicative of the fair market value of estimated proved reserves, and the results may not be comparable to estimates disclosed by other oil and gas producers.
| |
December 31, | ||||||
|---|---|---|---|---|---|---|---|
| |
2010 | 2009 | |||||
Future cash inflows |
$ | 768,243 | $ | 766,742 | |||
Future production costs |
(153,562 | ) | (185,230 | ) | |||
Future development and abandonment costs |
(178,912 | ) | (192,601 | ) | |||
Future income tax expense |
— | — | |||||
Future net cash flows |
435,769 | 388,911 | |||||
10% annual discount for estimated timing of cash flows |
(101,813 | ) | (89,734 | ) | |||
Standardized measure of discounted future net cash flows |
$ | 333,956 | $ | 299,177 | |||
Changes in the Standardized Measure are as follows:
| |
Year Ended December 31, | |||||||
|---|---|---|---|---|---|---|---|---|
| |
2010 | 2009 | ||||||
Beginning of year |
$ | 299,177 | $ | 404,634 | ||||
Sales of oil and natural gas, net of costs |
(116,837 | ) | (132,183 | ) | ||||
Net changes in prices and production costs |
90,295 | (25,787 | ) | |||||
Development costs incurred |
13,689 | 28,962 | ||||||
Accretion of discount |
25,678 | 33,988 | ||||||
Changes in timing and other |
21,954 | (10,437 | ) | |||||
Net increase (decrease) |
34,779 | (105,457 | ) | |||||
End of year |
$ | 333,956 | $ | 299,177 | ||||
F-77
Report of Independent Registered Public Accounting Firm
To
the Board of Partners of
Dynamic Offshore Holding, LP
We have audited the accompanying statement of revenues and direct operating expenses of the Samson Acquisition Properties for the period from January 1, 2010 to July 7, 2010. This financial statement is the responsibility of the Partnership's management. Our responsibility is to express an opinion on this financial statement based on our audit.
We conducted our audit in accordance with the standards of the Public Company Accounting Oversight Board (United States). Those standards require that we plan and perform the audit to obtain reasonable assurance about whether the financial statement is free of material misstatement. An audit includes examining, on a test basis, evidence supporting the amounts and disclosures in the financial statements. An audit also includes assessing the accounting principles used and significant estimates made by management, as well as evaluating the overall financial statement presentation. We believe that our audit provides a reasonable basis for our opinion.
In our opinion, the financial statement referred to above presents fairly, in all material respects, the revenues and direct operating expenses of the Samson Acquisition Properties described in Note 1 for the period from January 1, 2010 to July 7, 2010, in conformity with accounting principles generally accepted in the United States of America.
The accompanying financial statement reflects the revenues and direct operating expenses of the Samson Acquisition Properties as described in Note 1 and is not intended to be a complete presentation of the financial position, results of operations, or cash flows of the Samson Acquisition Properties.
Hein &
Associates LLP
Houston, Texas
August 17, 2011
F-78
SAMSON ACQUISITION PROPERTIES
STATEMENT OF REVENUES AND DIRECT OPERATING EXPENSES
For the Period from January 1, 2010 to July 7, 2010
(In thousands)
Oil and gas revenues |
$ | 36,328 | ||
Direct operating expenses |
5,106 | |||
Excess of revenues over direct operating expenses |
$ | 31,222 | ||
See notes to statement of revenues and direct operating expenses
F-79
Samson Acquisition Properties
Notes to Statement of Revenues and Direct Operating Expenses
Except as noted within the context of each footnote disclosure, the dollar amounts presented in the tabular data within these footnote disclosures are stated in thousands of dollars.
Note 1—Properties and Basis of Presentation
The accompanying statement represents the interest in the revenues and direct operating expenses of the oil and natural gas producing properties acquired by Dynamic Offshore Holding, LP (the "Partnership") from Samson Offshore Company and Samson Contour Energy E&P, LLC (collectively, "Samson") on July 8, 2010. The Partnership paid $97.7 million for the properties. The properties are referred to herein as the "Samson Acquisition Properties" and are located in the Gulf of Mexico.
The statement of revenues and direct operating expenses has been derived from Samson's historical financial records and prepared on the accrual basis of accounting. Revenues and direct operating expenses relate to the historical net revenue interest and net working interest in the Samson Acquisition Properties. Oil, gas and condensate revenues are recognized on the sales method when production is sold to a purchaser at a fixed or determinable price, when delivery has occurred and title has transferred, and if collectability of the revenue is probable. Revenues are reported net of overriding and other royalties due to third parties. Direct operating expenses include lease operating expenses, production and ad valorem taxes, transportation and all other direct operating costs associated with the properties. Direct operating expenses do not include corporate overhead, interest and income taxes.
The statement of revenues and direct operating expenses is not indicative of the financial condition or results of operations of the Samson Acquisition Properties going forward due to the omission of various operating expenses. During the period presented, the Samson Acquisition Properties were not accounted for by Samson as a separate business unit. As such, certain costs, such as depreciation, depletion and amortization, accretion of asset retirement obligations, general and administrative expenses and interest expense were not allocated to the Samson Acquisition Properties.
Note 2—Omitted Financial Information
Historical financial statements reflecting financial position, results of operations and cash flows required by accounting principles generally accepted in the United States of America are not presented as such information is not available on a property-by-property basis, nor is it practicable to obtain such information in these circumstances. Historically, no allocation of general and administrative, interest, corporate taxes, accretion of asset retirement obligations, and depreciation, depletion and amortization was made to the Samson Acquisition Properties. Accordingly, the statement of revenues and direct operating expenses is presented in lieu of the financial statements required under Rule 3-01 and Rule 3-02 of the Securities and Exchange Commission's Regulation S-X.
F-80
Supplemental Oil and Gas Reserve Information (Unaudited)
Except as noted within the context of each disclosure, the dollar amounts presented in the tabular data herein are stated in thousands of dollars.
Oil and Gas Reserve Information
The following tables summarize the net ownership interests in estimated quantities of proved and proved developed oil and natural gas reserves of the Samson Acquisition Properties at January 1, 2010 and July 7, 2010, estimated by the Partnership's petroleum engineers, and the related summary of changes in estimated quantities of net remaining proved reserves during the period from January 1, 2010 to July 7, 2010.
| |
Crude oil (MBbl) |
Natural gas (MMcf) |
||||||
|---|---|---|---|---|---|---|---|---|
January 1, 2010 |
2,714 | 17,254 | ||||||
Production |
(358 | ) | (2,036 | ) | ||||
July 7, 2010 |
2,356 | 15,218 | ||||||
Proved-developed reserves: |
||||||||
January 1, 2010 |
2,414 | 16,764 | ||||||
July 7, 2010 |
2,056 | 14,728 | ||||||
Proved reserves are estimated quantities of oil and natural gas which geological and engineering data demonstrate, with reasonable certainty, to be recoverable in future years from known reservoirs under existing economic and operating conditions (i.e., prices and costs) existing at the time the estimate is made. Proved developed reserves are proved reserves that can be expected to be recovered through existing wells and equipment in place and under operating methods being utilized at the time the estimates were made.
Standardized Measure of Discounted Future Net Cash Flows Relating to Proved Oil and Natural Gas Reserves.
The following tables set forth the computation of the standardized measure of discounted future net cash flows (the "Standardized Measure") relating to proved reserves and the changes in such cash flows of the Samson Acquisition Properties in accordance with the Financial Accounting Standards Board's ("FASB") authoritative guidance related to disclosures about oil and gas producing activities. The Standardized Measure is the estimated net future cash inflows from proved reserves less estimated future production and development costs, estimated plugging and abandonment costs, estimated future income taxes (if applicable) and a discount factor. Production costs do not include depreciation, depletion and amortization of capitalized acquisitions, exploration and development costs. Future cash inflows represent expected revenues from production of period-end quantities of proved reserves based on the unweighted average of first-day-of-the-month commodity prices for the period and any fixed and determinable future price changes provided by contractual arrangements in existence at period end. Price changes based on inflation, federal regulatory changes and supply and demand are not considered. Estimated future production costs related to period-end reserves are based on period-end costs. Such costs include, but are not limited to, production taxes and direct operating costs. Inflation and other anticipatory costs are not considered until the actual cost change takes effect. In accordance with the FASB's authoritative guidance, a discount rate of 10% is applied to the annual future net cash flows.
In calculating the Standardized Measure, future net cash inflows were estimated by using the unweighted average of first-day-of-the-month oil and gas prices for the period with the estimated future
F-81
production of period-end proved reserves and assume continuation of existing economic conditions. The index prices used for the July 7, 2010 Standardized Measure calculations were $72.25 per barrel of oil and $4.10 per MMBtu of natural gas. The index prices have been adjusted for historical average location and quality differentials. Future cash inflows were reduced by estimated future development, abandonment and production costs based on period-end costs resulting in net cash flow before tax. Future income tax expense was not considered as Samson and the Samson Acquisition Properties are not tax-paying entities.
The Standardized Measure is not intended to be representative of the fair market value of the proved reserves. The calculations of revenues and costs do not necessarily represent the amounts to be received or expended. Accordingly, the estimates of future net, cash flows from proved reserves and the present value thereof may not be materially correct when judged against actual subsequent results. Further, since prices and costs do not remain static, and no price or cost changes have been considered, and future production and development costs are estimates to be incurred in developing and producing the estimated proved oil and gas reserves, the results are not necessarily indicative of the fair market value of estimated proved reserves, and the results may not be comparable to estimates disclosed by other oil and gas producers.
| |
July 7, 2010 | ||||
|---|---|---|---|---|---|
Future cash inflows |
$ | 236,109 | |||
Future production costs |
(60,798 | ) | |||
Future development costs |
(33,572 | ) | |||
Future net cash flows |
141,739 | ||||
10% annual discount for estimating timing of cash flows |
(15,418 | ) | |||
Standardized Measure of discounted net cash flows |
$ | 126,321 | |||
Changes in the Standardized Measure are as follows:
January 1, 2010 |
$ | 117,012 | |||
Sales of oil and gas, net of costs |
(31,222 | ) | |||
Net changes in prices and production costs |
36,619 | ||||
Development costs incurred |
4,022 | ||||
Accretion of discount |
6,027 | ||||
Changes in timing and other |
(6,137 | ) | |||
July 7, 2010 |
$ | 126,321 | |||
F-82
Report of Independent Registered Public Accounting Firm
To
the General Partner of
Beryl Oil and Gas LP
We have audited the accompanying balance sheet of Beryl Oil and Gas LP (the "Partnership") as of October 12, 2009, and the related statements of operations, cash flows, partners' capital, comprehensive loss and changes in accumulated other comprehensive income for the period from January 1, 2009 through October 12, 2009. These financial statements are the responsibility of the Partnership's management. Our responsibility is to express an opinion on these financial statements based on our audit.
We conducted our audit in accordance with the standards of the Public Company Accounting Oversight Board (United States). Those standards require that we plan and perform the audit to obtain reasonable assurance about whether the financial statements are free of material misstatement. An audit includes examining, on a test basis, evidence supporting the amounts and disclosures in the financial statements. An audit also includes assessing the accounting principles used and significant estimates made by management, as well as evaluating the overall financial statement presentation. We believe that our audit provides a reasonable basis for our opinion.
In our opinion, the financial statements referred to above present fairly, in all material respects, the financial position of Beryl Oil and Gas LP as of October 12, 2009 and the results of their operations and their cash flows for the period from January 1, 2009 through October 12, 2009, in conformity with accounting principles generally accepted in the United States of America.
Certified Public Accountants
Hein
& Associates LLP
Houston, Texas
March 12, 2010
F-83
BERYL OIL AND GAS LP
BALANCE SHEET
October 12, 2009
(In thousands)
Assets |
||||||
Current assets: |
||||||
Cash and cash equivalents |
$ | 40,524 | ||||
Accounts receivable |
18,855 | |||||
Insurance receivable |
16,126 | |||||
Derivative assets |
11,977 | |||||
Other current assets |
10,766 | |||||
Total current assets |
98,248 | |||||
Property and equipment: |
||||||
Oil and gas properties, successful efforts method |
706,364 | |||||
Accumulated depreciation, depletion, and amortization |
(319,091 | ) | ||||
Property and equipment, net |
387,273 | |||||
Other assets |
14,075 | |||||
Total assets |
$ | 499,596 | ||||
Liabilities and Partners' Capital |
||||||
Current liabilities: |
||||||
Accounts payable—third parties |
$ | 30,099 | ||||
Accounts payable—affiliates |
20 | |||||
Derivative liabilities |
100 | |||||
Current maturities of long-term debt |
26,223 | |||||
Current portion of asset retirement obligations |
34,206 | |||||
Total current liabilities |
90,648 | |||||
Long-term debt, net of unamortized discount of $1,025 and current portion |
271,266 | |||||
Asset retirement obligations, net of current portion |
61,440 | |||||
Other long-term liabilities |
9,225 | |||||
Total liabilities |
432,579 | |||||
Commitments and contingencies (see Note 10) |
||||||
Partners' capital |
67,017 | |||||
Total liabilities and partners' capital |
$ | 499,596 | ||||
See notes to financial statements
F-84
BERYL OIL AND GAS LP
STATEMENT OF OPERATIONS
For the Period from January 1, 2009 to October 12, 2009
(In thousands)
Oil and gas revenues |
$ | 89,599 | ||||
Costs and expenses: |
||||||
Lease operating expense |
33,640 | |||||
Exploration expense |
330 | |||||
Depreciation, depletion and amortization |
89,046 | |||||
General and administrative expense |
17,523 | |||||
Other operating expense |
18,537 | |||||
Total operating costs and expenses |
159,076 | |||||
Loss from operations |
(69,477 | ) | ||||
Other income (expense): |
||||||
Interest expense, net |
(22,411 | ) | ||||
Gain on mark-to-market derivatives, net |
24,132 | |||||
Net loss |
$ | (67,756 | ) | |||
See notes to financial statements
F-85
BERYL OIL AND GAS LP
STATEMENT OF CASH FLOWS
For the Period from January 1, 2009 to October 12, 2009
(In thousands)
Cash flows from operating activities: |
||||||
Net loss |
$ | (67,756 | ) | |||
Adjustments to reconcile net loss to net cash provided by operating activities: |
||||||
Amortization in interest expense |
1,934 | |||||
Accretion of asset retirement obligations |
4,496 | |||||
Depreciation, depletion and amortization |
89,046 | |||||
Risk management activities |
15,471 | |||||
Gain on sale of assets |
(22 | ) | ||||
Loss on settlement of asset retirement obligations |
1,391 | |||||
Changes in operating assets and liabilities: |
||||||
Accounts receivable and other assets |
(27,507 | ) | ||||
Accounts payable and other liabilities |
8,819 | |||||
Net cash provided by operating activities |
25,872 | |||||
Cash flows from investing activities: |
||||||
Additions to property and equipment |
(65,197 | ) | ||||
Proceeds from sale of property and equipment |
300 | |||||
Other, net |
(1,032 | ) | ||||
Net cash used in investing activities |
(65,929 | ) | ||||
Cash flows from financing activities: |
||||||
Repayment of long-term debt |
(300 | ) | ||||
Net cash used in financing activities |
(300 | ) | ||||
Net decrease in cash and cash equivalents |
(40,357 | ) | ||||
Cash and cash equivalents, beginning of period |
80,881 | |||||
Cash and cash equivalents, end of period |
$ | 40,524 | ||||
Supplemental cash flow disclosures: |
||||||
Interest paid |
$ | 15,355 | ||||
Decrease in noncash property additions |
33,452 | |||||
See notes to financial statements
F-86
BERYL OIL AND GAS LP
STATEMENT OF PARTNERS' CAPITAL
(In thousands)
Balance, December 31, 2008 |
$ | 144,904 | ||
Comprehensive loss |
(77,887 | ) | ||
Balance, October 12, 2009 |
$ | 67,017 | ||
See notes to financial statements
F-87
BERYL OIL AND GAS LP
STATEMENT OF COMPREHENSIVE LOSS
For the Period from January 1, 2009 to October 12, 2009
(In thousands)
Net loss |
$ | (67,756 | ) | |
Other comprehensive loss |
(10,131 | ) | ||
Comprehensive loss |
$ | (77,887 | ) | |
See notes to financial statements
F-88
BERYL OIL AND GAS LP
STATEMENT OF CHANGES IN ACCUMULATED OTHER COMPREHENSIVE INCOME
For the Period from January 1, 2009 to October 12, 2009
(In thousands)
| |
Derivative Instruments | |
||||||||
|---|---|---|---|---|---|---|---|---|---|---|
| |
Commodity | Interest Rate | Total | |||||||
Beginning of period |
$ | 15,217 | $ | (1,487 | ) | $ | 13,730 | |||
Reclassification adjustments for settled periods |
(11,618 | ) | 1,487 | (10,131 | ) | |||||
End of period |
$ | 3,599 | $ | — | $ | 3,599 | ||||
See notes to financial statements
F-89
Beryl Oil and Gas LP
Notes to Financial Statements
Except as noted within the context of each footnote disclosure, the dollar amounts presented in the tabular data within these footnote disclosures are stated in thousands of dollars.
Note 1—Organization and Basis of Presentation
Beryl Oil and Gas LP (the "Partnership") is a Delaware limited partnership that was organized in May 2006 for the purpose of acquiring oil and gas properties offshore Texas and Louisiana in the Gulf of Mexico. The Partnership is a joint venture between Beryl Resources LP ("BR") and Superior Energy Services, Inc. ("SESI"). BR owns 60% of the Partnership and acts as the managing partner, and SESI owns 40%. The Partnership has no employees and all business activity was managed by BR or SESI personnel during the period covered by these financial statements.
The accompanying financial statements have been prepared on an accrual basis of accounting, in accordance with accounting principles generally accepted in the United States of America ("GAAP").
In preparing the accompanying financial statements, the Partnership has reviewed, as determined necessary by the Partnership's management, events that have occurred after October 12, 2009, up until the issuance of the financial statements, which occurred on March 12, 2010. See Note 11.
Note 2—Significant Accounting Policies and Related Matters
Asset retirement obligations ("AROs"). AROs are legal obligations associated with the retirement of tangible long-lived assets that result from the asset's acquisition, construction, development and/or normal operation. The Partnership's AROs are based on the estimated costs of dismantlement, removal, site reclamation and similar activities associated with its oil and gas properties. An ARO is initially measured at its estimated fair value. Upon initial recognition, the Partnership records an increase to the carrying amount of the related long-lived asset and an offsetting ARO liability. The cost of the long-lived asset (including the ARO-related increase) is depreciated using a systematic and rational allocation method over the period during which the long-lived asset is expected to provide benefits. After the initial period of ARO recognition, the ARO will change as a result of either the passage of time or revisions to the original estimates of either the amounts of estimated cash flows or their timing. Changes due to the passage of time increase the carrying amount of the liability because there are fewer periods remaining from the initial measurement date until the settlement date; therefore, the present values of the discounted future settlement amount increases. These changes are recorded as a period cost called accretion expense. Upon settlement, AROs will be extinguished by the Partnership at either the recorded amount or the Partnership will recognize a gain or loss on the difference between the recorded amount and the actual settlement cost.
Cash and Cash Equivalents. Cash and cash equivalents include all cash on hand, demand deposits, and investments with original maturities of three months or less. The Partnership considers cash equivalents to include short-term, highly liquid investments that are readily convertible to known amounts of cash and which are subject to an insignificant risk of changes in value.
Comprehensive Income. Comprehensive income includes net income and other comprehensive income, which includes unrealized gains and losses on derivative instruments that are designated as cash flow hedges.
Concentration of Credit Risk. Financial instruments which potentially subject the Partnership to concentrations of credit risk consist primarily of trade accounts receivable and commodity derivative instruments.
F-90
Beryl Oil and Gas LP
Notes to Financial Statements (Continued)
Note 2—Significant Accounting Policies and Related Matters (Continued)
The Partnership extends credit, primarily in the form of uncollateralized oil and gas sales and joint interest owners' receivables, to various companies in the oil and gas industry, which results in a concentration of credit risk. The concentration of credit risk may be affected by changes in economic or other conditions within the Partnership's industry and may accordingly impact its overall credit risk. The Partnership believes that the risk of these unsecured receivables is mitigated by the size, reputation and nature of the companies to which the Partnership extends credit.
During the period from January 1, 2009 through October 12, 2009, transactions with Shell Trading, Chevron Corporation, BG Energy Merchants, LLC and Louis Dreyfus represented 32%, 27%, 17% and 14% of the Partnership's oil and gas revenues.
Estimated losses on accounts receivable are provided through an allowance for doubtful accounts, based on the specific identification method. In evaluating the collectability of accounts receivable, the Partnership makes judgments regarding each party's ability to make required payments, economic events and other factors. As the financial condition of any party changes, circumstances develop or additional information becomes available, adjustments to an allowance for doubtful accounts may be required. The Partnership did not have an allowance for doubtful accounts as of October 12, 2009.
The Partnership uses crude oil and natural gas derivative instruments to mitigate the effects of commodity price fluctuations and these derivative instruments expose the Partnership to counterparty credit risk. The Partnership's counterparties are generally major banks or financial institutions. All derivative instruments are executed under master agreements which allow the Partnership, in the event of default, to elect early termination of all contracts with the defaulting counterparty. If the Partnership chooses to elect early termination, all asset and liability positions with the defaulting counterparty would be net settled at the time of election. The Partnership monitors the creditworthiness of its counterparties. However, the Partnership is not able to predict sudden changes in a counterparty's creditworthiness. Should a financial counterparty not perform, the Partnership may not realize the benefit of some of its derivative instruments under lower commodity prices as well as incur a loss.
As of October 12, 2009, BP Corporation North America Inc. ("BP") and an affiliate of Credit Suisse ("CS") accounted for 66% and 34% of the Partnership's counterparty credit exposure related to commodity derivative instruments. BP and CS possess investment grade credit ratings, based upon minimum credit ratings assigned by Standard & Poor's Ratings Services, a division of the McGraw-Hill Companies, Inc.
Contingencies. Certain conditions may exist as of the date the Partnership's financial statements are issued, which may result in a loss to the Partnership but which will only be resolved when one or more future events occur or fail to occur. The Partnership's management and its legal counsel assess such contingent liabilities, and such assessment inherently involves an exercise in judgment.
In assessing loss contingencies related to legal proceedings that are pending against the Partnership or unasserted claims that may result in proceedings, the Partnership's management and legal counsel evaluate the perceived merits of any legal proceedings or unasserted claims as well as the perceived merits of the amount of relief sought or expected to be sought therein. If the assessment of a contingency indicates that it is probable that a material loss has been incurred and the amount of liability can be estimated, then the estimated liability would be accrued in the Partnership's financial statements. If the assessment indicates that a potentially material loss contingency is not probable but is
F-91
Beryl Oil and Gas LP
Notes to Financial Statements (Continued)
Note 2—Significant Accounting Policies and Related Matters (Continued)
reasonably possible, or is probable but cannot be estimated, then the nature of the contingent liability, together with an estimate of the range of possible loss (if determinable and material), is disclosed.
Liabilities for environmental remediation costs arising from claims, assessments, litigation, fines, and penalties and other sources are charged to expense when it is probable that a liability has been incurred and the amount of the assessment and/or remediation can be reasonably estimated.
Loss contingencies considered remote are generally not disclosed unless they involve guarantees, in which case the guarantees would be disclosed.
Debt Issue Costs. Costs incurred in connection with the issuance of long-term debt are capitalized and charged to interest expense over the term of the related debt.
Income Taxes. The Partnership is not subject to income taxes. As a result, the Partnership's earnings or losses for income tax purposes are included in the tax returns of its partners.
Natural Gas Imbalances. Quantities of natural gas over-delivered or under-delivered related to operational balancing agreements are recorded monthly as receivables and payables using weighted average prices as of the time the imbalance was created. Monthly, imbalances receivable are valued at the lower of cost or market; imbalances payable are valued at replacement cost. Certain contracts require cash settlement of imbalances on a current basis. Under these contracts, imbalance cash-outs are recorded as a sale or purchase of natural gas, as appropriate.
Price Risk Management (Hedging). All derivative instruments not qualifying for the normal purchases and normal sales exception are recorded on the balance sheet at fair value. If a derivative does not qualify as a hedge or is not designated as a hedge, the gain or loss on the derivative is recognized currently in earnings. If a derivative qualifies for hedge accounting and is designated as a cash flow hedge, the effective portion of the unrealized gain or loss on the derivative is deferred in accumulated other comprehensive income ("AOCI"), a component of partners' capital, and reclassified to earnings when the forecasted transaction occurs. Cash flows from a derivative instrument designated as a hedge are classified in the same category as the cash flows from the item being hedged.
During 2008, the Partnership voluntarily discontinued cash flow hedge accounting on all existing derivative instruments. Gains and losses deferred in AOCI related to cash flow hedges for which hedge accounting has been discontinued remain deferred until the forecasted transaction occurs. If it is no longer probable that a hedged forecasted transaction will occur, deferred gains or losses on the hedging instrument are reclassified to earnings immediately.
Property and Equipment. The Partnership uses the successful efforts method to account for its crude oil and natural gas exploration and production activities. All costs for development wells, related plant and equipment, proved mineral interests in crude oil and natural gas properties, and related ARO assets are capitalized. Costs of exploratory wells are capitalized pending determination of whether the wells found proved reserves. Costs of wells that are assigned proved reserves remain capitalized. Costs also are capitalized for exploratory wells that have found crude oil and natural gas reserves even if the reserves cannot be classified as proved when the drilling is completed, provided the exploratory well has found a sufficient quantity of reserves to justify its completion as a producing well and the Partnership is making sufficient progress assessing the reserves and the economic and operating viability of the project. Unproved leasehold costs are capitalized and amortized on a composite basis if
F-92
Beryl Oil and Gas LP
Notes to Financial Statements (Continued)
Note 2—Significant Accounting Policies and Related Matters (Continued)
individually insignificant, based on past success, experience, and average lease-term lives. Individually significant leases are reclassified to proved properties if successful and expensed on a lease-by-lease basis if unsuccessful or the lease term has expired. All other exploratory wells and costs are expensed.
Long-lived assets to be held and used, including proved crude oil and natural gas properties, are assessed for possible impairment by comparing their carrying values with their associated undiscounted future net cash flows. Events that can trigger assessments for possible impairments include write-downs of proved reserves based on field performance, significant decreases in the market value of an asset, a significant change in the extent or manner of use of or a physical change in an asset, significant change in the relationship between an asset's capitalized cost and proved reserves, and a more-likely-than-not expectation that a long-lived asset will be sold or otherwise disposed of significantly sooner than the end of its previously estimated useful life. Impaired assets are written down to their estimated fair values, generally their discounted future net cash flows. For proved crude oil and natural gas properties, the Partnership performs the impairment review on an individual field basis. Impairment amounts are recorded as incremental depreciation, depletion and amortization ("DD&A") expense.
In determining the fair values of proved and unproved properties acquired in business combinations, the Partnership prepares estimates of crude oil and natural gas reserves. The Partnership estimates future prices to apply to the estimated reserve quantities acquired, and estimates future operating and development costs, to arrive at estimates of future net cash flows. For the fair value assigned to proved, probable and possible reserves, the future net cash flows are discounted using a market-based weighted average cost of capital rate deemed appropriate at the time of the business combination. To compensate for the inherent risk of estimating and valuing reserves, the discounted future net cash flows of proved, probable and possible reserves are reduced by additional risk-weighting factors.
Other property and equipment items are recorded at cost and are depreciated on the straight-line method based on expected lives of the individual assets or group of assets.
Revenue Recognition. The Partnership records revenues from the sales of crude oil, natural gas and natural gas liquids when product is delivered at a fixed or determinable price, title has transferred and collectability is reasonably assured.
When the Partnership has an interest with other producers in properties from which natural gas is produced, the Partnership uses the entitlement method to account for any imbalances. Imbalances occur when the Partnership sells more or less product than the Partnership is entitled to under its ownership percentage. Revenue is recognized only on the entitlement percentage of volumes sold. Any amount that the Partnership sells in excess of its entitlement is treated as a liability and is not recognized as revenue. Any amount of entitlement in excess of the amount the Partnership sells is recognized as revenue and a receivable is accrued.
Segment Information. The Partnership acquires, exploits, develops, explores for and produces crude oil and natural gas and all of the Partnership's operations are located in the United States. The Partnership's management team administers all properties as a whole rather than as discrete operating segments. The Partnership tracks basic operational data by area. However, the Partnership measures financial performance as a single enterprise and not on an area-by-area basis. The Partnership allocates capital resources on a project-by-project basis across its entire asset base to maximize profitability without regard to individual areas or segments.
F-93
Beryl Oil and Gas LP
Notes to Financial Statements (Continued)
Note 2—Significant Accounting Policies and Related Matters (Continued)
Use of Estimates. The preparation of financial statements in conformity with GAAP requires management to make estimates and assumptions that affect the reported amounts of assets and liabilities and disclosures of contingent assets and liabilities as of the date of the financial statements and the reported amounts of revenues and expenses during the period. Estimates and judgments are based on information available at the time such estimates and judgments are made. Adjustments made with respect to the use of these estimates and judgments often relate to information not previously available. Uncertainties with respect to such estimates and judgments are inherent in the preparation of financial statements. Estimates and judgments are used in, among other things, (1) estimating crude oil and natural gas reserves, (2) estimating uncollected revenues and operating and general and administrative costs, (3) developing fair value assumptions, including estimates of future cash flows and discount rates, (4) analyzing long-lived assets for possible impairment, (5) estimating the useful lives of assets and (6) determining amounts to accrue for contingencies, guarantees and indemnifications. Actual results could differ materially from estimated amounts.
Recent Accounting Pronouncements
In June 2009, the Financial Accounting Standards Board ("FASB") established the FASB Accounting Standards Codification ("Codification", or "ASC") as the source of authoritative GAAP for U.S. companies. The ASC reorganized GAAP into a topical format and significantly changes the way users research accounting issues. For SEC registrants, the rules and interpretive releases of the SEC under federal securities laws are also sources of authoritative GAAP. References to specific GAAP in the Partnership's financial statements now refer exclusively to the ASC. The Partnership adopted the codification on October 12, 2009.
Fair Value Measurements. In February 2008, FASB issued authoritative guidance deferring the effective date of the fair value guidance for all nonfinancial assets and nonfinancial liabilities to fiscal years beginning after November 15, 2008. The implementation of the fair value guidance for nonfinancial assets and nonfinancial liabilities, effective January 1, 2009, did not have a material impact on the Partnership's financial position and results of operations. See Note 8 for additional fair value information and disclosure for financial and nonfinancial assets and liabilities.
In September 2009, FASB issued additional guidance on measuring the fair value of liabilities effective for the first reporting period beginning after issuance. Implementation is not expected to have a material impact on the Partnership's financial position and results of operations.
Other. In May 2009, FASB issued new guidance on subsequent events, particularly with respect to management's assessment of subsequent events. The guidance is effective prospectively for interim and annual periods ending after June 15, 2009. The implementation of this standard did not have a material impact on the Partnership's financial position and results of operations. See Note 1.
F-94
Beryl Oil and Gas LP
Notes to Financial Statements (Continued)
Note 3—Financial Statement Information
Additional balance sheet information as of October 12, 2009 is as follows:
Accounts receivable |
||||
Oil and gas revenues |
$ | 16,885 | ||
Other |
1,970 | |||
|
$ | 18,855 | ||
Other current assets |
||||
Prepaid insurance |
$ | 8,358 | ||
Prepaid royalties |
1,335 | |||
Advances to operators |
617 | |||
Other |
456 | |||
|
$ | 10,766 | ||
Other assets |
||||
Natural gas imbalance receivable (1,629 MMcf) |
$ | 10,647 | ||
Debt issue costs |
2,691 | |||
Long-term derivative assets |
737 | |||
|
$ | 14,075 | ||
Other long-term liabilities |
||||
Natural gas imbalance payable (1,228 MMcf) |
$ | 9,225 | ||
Additional statement of operations information is as follows:
Other operating expenses |
||||
Insurance expense |
$ | 8,652 | ||
Workover expense |
2,663 | |||
Accretion expense |
4,496 | |||
Other, net |
2,726 | |||
|
$ | 18,537 | ||
Note 4—Property and Equipment
The components of property and equipment as of October 12, 2009 are as follows:
Proved oil and gas properties |
$ | 690,037 | ||
Unproved oil and gas properties |
13,533 | |||
Other property and equipment |
2,794 | |||
|
706,364 | |||
Accumulated depreciation, depletion and amortization |
(319,091 | ) | ||
|
$ | 387,273 | ||
F-95
Beryl Oil and Gas LP
Notes to Financial Statements (Continued)
Note 4—Property and Equipment (Continued)
Asset Impairments. During the period from January 1, 2009 through October 12, 2009, the Partnership determined that the carrying amount of certain of its oil and gas properties was not recoverable from estimated future net cash flows and, therefore, was impaired. The assets were written down to their estimated fair values, which were determined using discounted cash flow models. The discounted cash flow models used exchange-based forward commodity prices and a discount rate of 10%. Estimated future net cash flows from probable and possible reserves were risk-adjusted. The impairments resulted from changes in the estimated abandonment costs of properties and well performance issues. The impairment charges of $9.1 million are included in the Partnership's statement of operations as incremental depreciation, depletion and amortization expense. See Note 8.
Note 5—Asset Retirement Obligations
The following table summarizes the activity for the Partnership's asset retirement obligations for the period from January 1, 2009 through October 12, 2009:
Beginning of period |
$ | 90,084 | ||
Liabilities settled |
(641 | ) | ||
Accretion expense |
4,496 | |||
Revisions to previous estimates |
1,707 | |||
End of period |
$ | 95,646 | ||
Note 6—Long-Term Debt
The Partnership had the following debt outstanding as of October 12, 2009:
First Lien Term loan, variable rate, due July 2011 |
$ | 179,057 | |||
Second Lien Term Loan, variable rate, due January 2012 |
119,457 | ||||
|
298,514 | ||||
Less unamortized loan discounts |
(1,025 | ) | |||
Total debt |
297,489 | ||||
Less current maturities of long-term debt |
(26,223 | ) | |||
Total long-term debt |
$ | 271,266 | |||
Second Lien Amended and Restated Credit Agreement. On July 14, 2006, the Partnership entered into a First Lien Agreement and a Second Lien Agreement (collectively, "the lien agreements") with Credit Suisse Securities, LLC and Banc of America Securities, LLC. The First Lien Agreement of $311 million bears interest at LIBOR plus 4% margin and matures on July 14, 2011. The Second Lien Agreement bears interest at LIBOR plus 6% margin and matures on January 13, 2012. Both lien agreements require interest payments in March, June, September and December. The lien agreements contain customary events of default and requires that the Partnership satisfy various financial
F-96
Beryl Oil and Gas LP
Notes to Financial Statements (Continued)
Note 6—Long-Term Debt (Continued)
covenants, which require the Partnership to: (i) maintain a minimum asset coverage ratio, as defined in the lien agreements, (ii) maintain a minimum earnings before interest, taxes, depreciation, abandonment, and exploration and other noncash charges ("EBITDAX") to interest ratio, as defined in the lien agreements. The lien agreements also limit the Partnership's capital expenditures, its ability to pay dividends or make other distributions, make acquisitions, make changes to the Partnership's capital structure, create liens, and incur additional indebtedness. The lien agreements also require the Partnership to enter into interest rate protection agreements and commodity price hedging programs for its debt and sales of natural gas and oil.
The First and Second Lien Agreements with Credit Suisse provide for a Mandatory Prepayment, as defined, which is equal to the Required Percentage of Excess Cash Flow for the period provided that a Liquidity Reserve of $25 million is maintained at all times. Excess Cash Flow is defined as EBITDAX less working capital changes, capital expenditures, and exploration expenses. As of October 12, 2009, the Mandatory Prepayment was $0. The Second Lien Agreement with Credit Suisse also allows for an Optional Prepayment, equal to no less than $5.0 million and which must be in multiples of $1.0 million. The Optional Prepayment on the Second Lien is subject to a 1% prepayment premium through July 14, 2009. During the period from January 1, 2009 through October 12, 2009, the Partnership made a required $0.3 million prepayment in connection with an asset sale of the same amount.
As of December 31, 2008, the Partnership violated the covenant to maintain a leverage ratio of 1.25 to 1.0, or greater, on the First Lien Agreement, and 1.5 to 1.0, or greater, on the Second Lien Agreement. As a result, the Partnership was in default on both lien agreements. At the point of default, the full amount of both lien agreements became callable; however, the amounts due were not reclassified to current maturities of long-term debt because the Partnership was recapitalized and the debt was restructured to long-term on October 13, 2009 as discussed in Note 11. The restructuring included replacing the first Lien Agreement with an amended agreement and the forgiveness of $27.9 million of amounts due. The Second Lien Term Loan was exchanged for an equity interest in the Partnership. The current maturities of long-term debt of $26.2 million as of October 12, 2009 represent a mandatory prepayment under the restructured lien agreements due and paid on October 13, 2009.
Note 7—Price Risk Management Activities
The Partnership's principal market risks are its exposure to changes in commodity prices, particularly to the prices of crude oil and natural gas, changes in interest rates, as well as nonperformance by the Partnership's counterparties.
Commodity Price Risk. The Partnership's revenues are derived principally from the sale of crude oil and natural gas. The prices of crude oil and natural gas are subject to market fluctuations in response to changes in supply, demand, market uncertainty and a variety of additional factors beyond the Partnership's control. The Partnership monitors these risks and enters into commodity derivative transactions designed to mitigate the impact of commodity price fluctuations on the Partnership's business.
F-97
Beryl Oil and Gas LP
Notes to Financial Statements (Continued)
Note 7—Price Risk Management Activities (Continued)
The primary purpose of the Partnership's commodity risk management activities is to hedge the Partnership's exposure to commodity price risk and reduce fluctuations in the Partnership's operating cash flow despite fluctuations in commodity prices. With swaps, the Partnership typically receives an agreed upon fixed price for a specified notional quantity of crude oil or natural gas and the Partnership pays the hedge counterparty a floating price for that same quantity based upon published index prices. Since the Partnership receives from its crude oil and natural gas marketing counterparties a price based on the same floating index price from the sale of the underlying physical commodity, these transactions are designed to effectively lock-in the agreed fixed price in advance for the volumes hedged. In order to avoid having a greater volume hedged than the Partnership's actual equity volumes, the Partnership typically limits its use of swaps to hedge the prices of less than the Partnership's expected crude oil and natural gas sales volumes. The Partnership may utilize purchased puts (or floors) to hedge additional expected commodity volumes without creating volumetric risk. The Partnership's commodity hedges may expose the Partnership to the risk of financial loss in certain circumstances. The Partnership's hedging arrangements provide the Partnership protection on the hedged volumes if market prices decline below the prices at which these hedges are set. If market prices rise above the prices at which the Partnership has hedged, the Partnership will receive less revenue on the hedged volumes than in the absence of hedges.
Interest Rate Risk. The Partnership is exposed to changes in interest rates, primarily as a result of variable rate borrowings under its debt agreements. To the extent that interest rates increase, interest expense for the Partnership's variable rate debt will also increase. As of October 12, 2009, the Partnership had borrowings of $298.5 million outstanding under its variable rate debt agreements. In an effort to reduce the variability of its cash flows, the Partnership may enter into interest rate derivative agreements to mitigate the effect of rising interest rates.
Credit Risk. The Partnership's credit exposure related to commodity derivative instruments is represented by the fair value of contracts with a net positive fair value to the Partnership at the reporting date. At such times, these outstanding instruments expose the Partnership to credit loss in the event of nonperformance by the counterparties to the agreements. Should the creditworthiness of one or more of the Partnership's counterparties decline, the Partnership's ability to mitigate nonperformance risk is limited to a counterparty agreeing to either a voluntary termination and subsequent cash settlement or a novation of the derivative contract to a third party. In the event of a counterparty default, the Partnership may sustain a loss and the Partnership's cash receipts could be negatively impacted.
As of October 12, 2009, BP Corporation North America Inc. ("BP") and an affiliate of Credit Suisse ("CS") accounted for 66% and 34% of the Partnership's counterparty credit exposure related to commodity derivative instruments. BP and CS possess investment grade credit ratings, based upon minimum credit ratings assigned by Standard & Poor's Ratings Services, a division of the McGraw-Hill Companies, Inc.
F-98
Beryl Oil and Gas LP
Notes to Financial Statements (Continued)
Note 7—Price Risk Management Activities (Continued)
The Partnership had the following commodity derivatives outstanding as of October 12, 2009, none of which are currently designated as cash flow hedges:
Crude Oil
| |
|
|
Barrels | |||||||||
|---|---|---|---|---|---|---|---|---|---|---|---|---|
| |
|
Avg. Price $/Bbl |
||||||||||
Instrument Type
|
Index | 2009 | 2010 | |||||||||
Swap |
CL-NYM | $ | 79.87 | 42,737 | — | |||||||
Swap |
CL-NYM | 81.47 | — | 180,362 | ||||||||
|
42,737 | 180,362 | ||||||||||
Natural Gas
| |
|
|
MMBtu | |||||||||
|---|---|---|---|---|---|---|---|---|---|---|---|---|
| |
|
Avg. Price $/MMBtu |
||||||||||
Instrument Type
|
Index | 2009 | 2010 | |||||||||
Swap |
NG-NYM | $ | 8.49 | 608,287 | — | |||||||
Swap |
NG-NYM | 8.43 | — | 2,681,144 | ||||||||
|
608,287 | 2,681,144 | ||||||||||
Floor |
NG-NYM | 8.25 | 1,600,000 | — | ||||||||
|
2,208,287 | 2,681,144 | ||||||||||
The following reflects the fair values of derivative instruments in the Partnership's balance sheet as of October 12, 2009:
| |
Asset Derivatives | Liability Derivatives | |||||||||
|---|---|---|---|---|---|---|---|---|---|---|---|
Derivatives not designated as hedging instruments under ASC 815 |
Balance Sheet Location | Fair Value | Balance Sheet Location |
Fair Value | |||||||
Commodity derivatives |
Current assets | $ | 11,977 | Current liabilities | $ | 100 | |||||
|
Long-term assets | 737 | Long-term liabilities | — | |||||||
The following reflects the effective portion of amounts reclassified from AOCI to revenue and expense for the period from January 1, 2009 through October 12, 2009:
Location of Gain (Loss) Reclassified from AOCI into Income |
|
|||
|---|---|---|---|---|
Oil and gas revenues |
$ | 11,618 | ||
Interest expense, net |
(1,487 | ) | ||
|
$ | 10,131 | ||
See Note 8 for additional disclosures related to derivative instruments.
F-99
Beryl Oil and Gas LP
Notes to Financial Statements (Continued)
Note 8—Fair Value Measurements
Accounting standards pertaining to fair value measurements establish a three-tier fair value hierarchy, which prioritizes the inputs used in measuring fair value. These tiers include:
- •
- Level 1, defined as observable inputs such as quoted prices in active markets;
- •
- Level 2, defined as inputs other than quoted prices in active markets that are either directly or indirectly
observable; and
- •
- Level 3, defined as unobservable inputs in which little or no market data exists, therefore requiring an entity to develop its own assumptions.
The Partnership's commodity derivative contracts are reported in its financial statements at fair value. These contracts consist of over-the-counter (OTC) swap and floor contracts, which are not traded on a public exchange.
The fair values of these contracts are determined based on inputs that are readily available in public markets or can be derived from information available in publicly quoted markets. Therefore, the Partnership has categorized these contracts as Level 2.
The Partnership's interest rate derivatives, which expired in September 2009, have been classified as Level 3, because their fair value was determined from unobservable inputs.
The Partnership has consistently applied these valuation techniques and believes it has obtained the most accurate information available for the types of derivative contracts it holds.
The following table sets forth, by level within the fair value hierarchy, the Partnership's financial assets and liabilities measured at fair value on a recurring basis as of October 12, 2009. These financial assets and liabilities are classified in their entirety based on the lowest level of input that is significant to the fair value measurement. The Partnership's assessment of the significance of a particular input to the fair value measurement requires judgment, and may affect the valuation of the fair value assets and liabilities and their placement within the fair value hierarchy levels.
| |
Total | Level 1 | Level 2 | Level 3 | |||||||||
|---|---|---|---|---|---|---|---|---|---|---|---|---|---|
Assets from commodity derivative contracts |
$ | 12,714 | $ | — | $ | 12,714 | $ | — | |||||
Liabilities from commodity derivative contracts |
$ | 100 | $ | — | $ | 100 | $ | — | |||||
The following table sets forth a reconciliation of the changes in the fair value of the Partnership's financial instruments classified as Level 3 in the fair value hierarchy, for the period from January 1, 2009 through October 12, 2009:
| |
|
|||
|---|---|---|---|---|
Balance, beginning of period |
$ | (1,940 | ) | |
Change in fair value of interest rate derivative instruments |
451 | |||
Settlements |
1,489 | |||
Balance, end of period |
$ | — | ||
F-100
Beryl Oil and Gas LP
Notes to Financial Statements (Continued)
Note 8—Fair Value Measurements (Continued)
Asset Impairments. Information about impaired assets as of the date of the assessments is as follows:
| |
Level 3 | Net Book Value(1) | Impairment Charge | |||||||
|---|---|---|---|---|---|---|---|---|---|---|
Oil and gas properties |
$ | 32,258 | $ | 41,403 | $ | 9,145 | ||||
- (1)
- Amount represents net book value as of the impairment date.
Note 9—Related Party Transactions
The Partnership has an operating services agreement with BR and SESI. Under the agreement, BR and SESI are reimbursed for all direct and indirect costs incurred with respect to operational and accounting services provided to the Partnership. During the period from January 1, 2009 through October 12, 2009, BR charged the Partnership $7.0 million for general and administrative expenses and SESI provided $10.3 million in field-level services.
Note 10—Commitments and Contingencies
From time to time, the Partnership may be involved in litigation arising out of the normal course of its business. In management's opinion, the Partnership is not involved in any litigation, the outcome of which would have a material effect on its financial position, results of operations, or liquidity.
The Partnership holds a lease for office space in Houston, Texas. The annual rental commitment is $0.4 million and escalates each year. During the period from January 1, 2009 through October 12, 2009, the Partnership incurred rent expense of $0.3 million.
Noncancellable commitments under the lease are $0.1 million for the period from October 13, 2009 through December 31, 2009; $0.4 million for each of the years ending December 31, 2010 and 2011; and $0.3 million for the year ending December 31, 2012.
Note 11—Subsequent Events
On October 13, 2009, in a series of transactions, the membership interests of the Partnership were transferred to DBH, LLC ("DBH"), a subsidiary of Dynamic Offshore Holding, LP. In the transactions, the Second Lien Term Loans were contributed to DBH in exchange for a 15% ownership interest in DBH. After the contribution of the Second Lien Term Loans to DBH, the Partnership entered into a Second Lien Amended and Restated Credit Agreement (the "Amended Agreement") to replace the First Lien Term Loan.
The Amended Agreement provides that the original remaining balance of the First Lien Term Loans of $179.1 million, together with accrued but unpaid interest was converted into a new Second Lien Term Loan in the aggregate principal amount of $151.2 million. Immediately thereafter, the Partnership made a mandatory prepayment under the Amended Agreement of $26.2 million.
F-101
Supplemental Oil and Gas Disclosures (Unaudited)
Except as noted within the context of each disclosure, the dollar amounts presented in the tabular data herein are stated in thousands of dollars.
The supplemental data presented herein reflects information for the Partnership's crude oil and natural gas producing activities, all of which are in the United States of America.
Oil and Gas Reserves
The Partnership's estimates of proved reserves as of October 12, 2009 are based on reserve reports prepared by independent petroleum engineers. Users of this information should be aware that the process of estimating quantities of "proved" and "proved-developed" crude oil and natural gas reserves is very complex, requiring significant subjective decision making in the analysis and evaluation of all geological, engineering, and economic data for each reservoir. The data for a given reservoir may also change substantially over time as a result of numerous factors, including additional development activity, additional production data, evolving production history, and continual reassessment of the viability of production under different economic conditions. Consequently, material revisions to existing reserve estimates occur from time to time. Although every reasonable effort is made to ensure that the reported reserve estimates represent the most accurate assessments possible, the significance of the subjective decisions required and variances in available data for various reservoirs make these estimates generally less precise than other estimates presented in connection with financial statement disclosures. Proved oil and gas reserves are those quantities of oil and gas, which, by analysis of geoscience and engineering data, can be estimated with reasonable certainty to be economically producible from a given date forward, from known reservoirs, and under existing economic conditions, operating methods, and government regulation before the time at which contracts providing the right to operate expire, unless evidence indicates that renewal is reasonably certain, regardless of whether the estimate is a deterministic estimate or probabilistic estimate. Proved developed oil and gas reserves are proved reserves that can be expected to be recovered: (i) through existing wells with existing equipment and operating methods or in which the cost of the required equipment is relatively minor compared with the cost of a new well, and (ii) through installed extraction equipment and infrastructure operational at the time of the reserves estimate if the extraction is by means not involving a well.
The following table sets forth the Partnership's net proved reserves, including changes therein, and proved developed reserves:
| |
Crude oil (MBbl) |
Natural gas (MMcf) |
||||||
|---|---|---|---|---|---|---|---|---|
December 31, 2008 |
3,920 | 76,803 | ||||||
Extensions and discoveries |
39 | 540 | ||||||
Revisions of prior estimates |
363 | (3,193 | ) | |||||
Production |
(694 | ) | (10,145 | ) | ||||
October 12, 2009 |
3,628 | 64,005 | ||||||
Proved-developed reserves: |
||||||||
December 31, 2008 |
3,385 | 66,752 | ||||||
October 12, 2009 |
3,112 | 54,392 | ||||||
Costs Incurred in Oil and Gas Property Acquisition, Exploration, and Development Activities
Costs incurred, on an accrual basis, represent amounts capitalized or expensed during the period from January 1, 2009 through October 12, 2009 for property acquisition, exploration, and development
F-102
activities. Costs incurred for property acquisitions, exploration, and development activities were as follows:
| |
|
||||
|---|---|---|---|---|---|
Acquisition of properties—proved |
$ | — | |||
Acquisition of properties—unproved |
— | ||||
Total acquisition costs incurred |
$ | — | |||
Exploration costs |
2,489 | ||||
Development costs |
31,745 | ||||
Total costs incurred |
$ | 34,234 | |||
Standardized Measure of Discounted Future Net Cash Flows Relating to Proved Oil and Natural Gas Reserves
The following tables set forth the computation of the standardized measure of discounted future net cash flows (the "Standardized Measure") relating to proved reserves and the changes in such cash flows of the Partnership's oil and gas properties in accordance with the FASB's authoritative guidance related to disclosures about oil and gas producing activities. The Standardized Measure is the estimated net future cash inflows from proved reserves less estimated future production and development costs, estimated plugging and abandonment costs, estimated future income taxes (if applicable) and a discount factor. Production costs do not include depreciation, depletion and amortization of capitalized acquisitions, exploration and development costs. Future cash inflows represent expected revenues from production of period-end quantities of proved reserves based on period-end prices and any fixed and determinable future price changes provided by contractual arrangements in existence at the period-end date. Price changes based on inflation, federal regulatory changes and supply and demand are not considered. Estimated future production costs related to period-end reserves are based on period-end costs. Such costs include, but are not limited to, production taxes and direct operating costs. Inflation and other anticipatory costs are not considered until the actual cost change takes effect. In accordance with the FASB's authoritative guidance, a discount rate of 10% is applied to the annual future net cash flows.
In calculating the Standardized Measure, future net cash inflows were estimated using period-end oil and natural gas prices (index price adjusted for location and quality adjustments) with the estimated future production of period-end proved reserves and assume continuation of existing economic conditions. The index prices used for the October 12, 2009 Standardized Measure calculations were $73.24 per barrel of oil and $3.96 per MMBtu of natural gas. Future cash inflows were reduced by estimated future development, abandonment and production costs based on period-end costs resulting in net cash flow before tax. Future income tax expense was not considered as the Partnership is not a tax-paying entity.
The Standardized Measure is not intended to be representative of the fair market value of the proved reserves. The calculations of revenues and costs do not necessarily represent the amounts to be received or expended. Accordingly, the estimates of future net cash flows from proved reserves and the present value thereof may not be materially correct when judged against actual subsequent results. Further, since prices and costs do not remain static, and no price or cost changes have been considered, and future production and development costs are estimates to be incurred in developing and producing the estimated proved oil and gas reserves, the results are not necessarily indicative of the fair market value of estimated proved reserves, and the results may not be comparable to estimates disclosed by other oil and gas producers.
F-103
The Standardized Measure of discounted future net cash flows relating to proved oil and natural gas reserves is as follows as of October 12, 2009:
| |
|
|||
|---|---|---|---|---|
Future cash inflows |
$ | 538,958 | ||
Future production costs |
(131,736 | ) | ||
Future development and abandonment costs |
(179,481 | ) | ||
Future net cash flows |
227,741 | |||
10% annual discount for estimated timing of cash flows |
(47,615 | ) | ||
Standardized measure of discounted future net cash flows |
$ | 180,126 | ||
A summary of the changes in the Standardized Measure of discounted future net cash flows applicable to proved oil and natural gas reserves for the period from January 1, 2009 through October 12, 2009 is as follows:
| |
|
||||
|---|---|---|---|---|---|
Beginning of period |
$ | 198,321 | |||
Sales and transfers of oil and natural gas produced, net of |
(44,341 | ) | |||
Net changes in prices and production costs |
(27,187 | ) | |||
Net changes in estimated future development costs |
(10,659 | ) | |||
Extensions and discoveries |
3,309 | ||||
Revisions of quantity estimates |
(4,339 | ) | |||
Development and abandonment costs incurred |
33,777 | ||||
Changes in production rates (timing) and other |
17,283 | ||||
Accretion of discount |
13,962 | ||||
Net decrease |
(18,195 | ) | |||
End of period |
$ | 180,126 | |||
F-104
Report of Independent Registered Public Accounting Firm
The
Management Committee
Beryl Oil and Gas LP:
We have audited the accompanying balance sheet of Beryl Oil and Gas LP (the Partnership) as of December 31, 2008, and the related statements of operations, partners' capital, and cash flows for the year then ended. These financial statements are the responsibility of the Partnership's management. Our responsibility is to express an opinion on these financial statements based on our audit.
We conducted our audit in accordance with auditing standards generally accepted in the United States of America. Those standards require that we plan and perform the audit to obtain reasonable assurance about whether the financial statements are free of material misstatement. An audit includes consideration of internal control over financial reporting as a basis for designing audit procedures that are appropriate in the circumstances, but not for the purpose of expressing an opinion on the effectiveness of the Partnership's internal control over financial reporting. Accordingly, we express no such opinion. An audit also includes examining, on a test basis, evidence supporting the amounts and disclosures in the financial statements, assessing the accounting principles used and significant estimates made by management, as well as evaluating the overall financial statement presentation. We believe that our audit provides a reasonable basis for our opinion.
In our opinion, the financial statements referred to above present fairly, in all material respects, the financial position of Beryl Oil and Gas LP as of December 31, 2008 and the results of its operations and its cash flows for the year then ended, in conformity with U.S. generally accepted accounting principles.
| /s/ KPMG LLP |
Houston,
Texas
November 3, 2009
F-105
BERYL OIL AND GAS LP
BALANCE SHEET
December 31, 2008
(In thousands)
Assets |
||||||
Current assets: |
||||||
Cash and cash equivalents |
$ | 80,881 | ||||
Accounts receivable, net of allowance of $500 |
24,026 | |||||
Prepaid expenses and other |
4,664 | |||||
Fair value of derivative instruments |
33,648 | |||||
Total current assets |
143,219 | |||||
Property and equipment: |
||||||
Oil and gas properties, at cost (successful efforts method) |
679,270 | |||||
Other equipment |
2,794 | |||||
Less accumulated depreciation, depletion, and amortization |
(239,189 | ) | ||||
Property and equipment, net |
442,875 | |||||
Fair value of derivative instruments |
6,508 | |||||
Deferred financing costs, net of accumulated amortization of $6,161 |
4,189 | |||||
Total assets |
$ | 596,791 | ||||
Liabilities and Partners' Capital |
||||||
Current liabilities: |
||||||
Accounts payable and accrued liabilities |
$ | 59,622 | ||||
Accounts payable to affiliates |
1,852 | |||||
Accrued interest |
959 | |||||
Fair value of derivative instruments |
1,940 | |||||
Asset retirement obligations |
14,785 | |||||
Current maturities of long-term debt |
26,223 | |||||
Total current liabilities |
105,381 | |||||
Fair value of derivative instruments |
— | |||||
Asset retirement obligations |
75,299 | |||||
Long-term debt, net of unamortized loan discount of $1,385 |
271,207 | |||||
Partners' capital |
131,174 | |||||
Accumulated other comprehensive income |
13,730 | |||||
Total partners' capital |
144,904 | |||||
Commitments and contingencies (note 12) |
||||||
Total liabilities and partners' capital |
$ | 596,791 | ||||
See accompanying notes to financial statements.
F-106
BERYL OIL AND GAS LP
STATEMENT OF OPERATIONS
Year ended December 31, 2008
(In thousands)
Operating revenues: |
||||||
Oil revenue |
$ | 79,367 | ||||
Gas revenue |
106,476 | |||||
Total operating revenues |
185,843 | |||||
Operating expenses: |
||||||
Lease operating expenses |
47,789 | |||||
Insurance expense |
9,517 | |||||
Transportation expense |
1,445 | |||||
Exploration expense |
2,802 | |||||
Depreciation, depletion, and amortization |
76,924 | |||||
Impairment and dry hole expense |
34,878 | |||||
Accretion expense |
5,035 | |||||
Loss on plugging and abandonment |
2,491 | |||||
General and administrative expenses |
12,296 | |||||
Total operating expenses |
193,177 | |||||
Other income (expenses): |
||||||
Interest expense |
(31,158 | ) | ||||
Interest income |
2,032 | |||||
Derivative instruments |
17,430 | |||||
Total other expenses |
(11,696 | ) | ||||
Net loss |
$ | (19,030 | ) | |||
See accompanying notes to financial statements.
F-107
BERYL OIL AND GAS LP
STATEMENT OF CASH FLOWS
Year ended December 31, 2008
(In thousands)
Cash flows from operating activities: |
|||||||
Net loss |
$ | (19,030 | ) | ||||
Adjustments to reconcile net loss to net cash provided by operating activities: |
|||||||
Depreciation, depletion, and amortization |
76,924 | ||||||
Impairment and dry hole expense |
34,878 | ||||||
Accretion expense |
5,035 | ||||||
Unrealized gain on derivative instruments |
(15,663 | ) | |||||
Amortization of deferred financing costs and discount |
3,727 | ||||||
Loss on plugging and abandonment |
2,491 | ||||||
Changes in assets and liabilities: |
|||||||
Accounts receivable |
19,295 | ||||||
Prepaid expenses and other |
(6,138 | ) | |||||
Accounts payable and accrued liabilities |
(1,064 | ) | |||||
Accounts payable to affiliates |
(986 | ) | |||||
Accrued interest |
(634 | ) | |||||
Settlements of asset retirement obligation |
(1,656 | ) | |||||
Net cash provided by operating activities |
97,179 | ||||||
Cash flows from investing activities: |
|||||||
Acquisitions of oil and gas properties |
(1,653 | ) | |||||
Additions to oil and gas properties |
(62,596 | ) | |||||
Additions to equipment |
(167 | ) | |||||
Net cash used in investing activities |
(64,416 | ) | |||||
Cash flows from financing activity: |
|||||||
Repayment of long-term debt |
(24,246 | ) | |||||
Net cash used in financing activity |
(24,246 | ) | |||||
Net change in cash and cash equivalents |
8,517 | ||||||
Cash and cash equivalents, beginning of year |
72,364 | ||||||
Cash and cash equivalents, end of year |
$ | 80,881 | |||||
Supplemental cash flow disclosure: |
|||||||
Cash paid for interest |
$ | 25,538 | |||||
See accompanying notes to financial statements.
F-108
BERYL OIL AND GAS LP
STATEMENT OF PARTNERS' CAPITAL
Year ended December 31, 2008
(In thousands)
| |
Superior Energy Services, Inc |
Beryl Resources LP |
Total | |||||||||
|---|---|---|---|---|---|---|---|---|---|---|---|---|
Balance at December 31, 2007 |
$ | 55,943 | 83,915 | 139,858 | ||||||||
Comprehensive (loss) income: |
||||||||||||
Net loss |
(7,612 | ) | (11,418 | ) | (19,030 | ) | ||||||
Unrealized gain on derivative instruments |
9,631 | 14,445 | 24,076 | |||||||||
Total comprehensive income |
2,019 | 3,027 | 5,046 | |||||||||
Balance at December 31, 2008 |
$ | 57,962 | 86,942 | 144,904 | ||||||||
See accompanying notes to financial statements.
F-109
BERYL OIL AND GAS LP
Notes to Financial Statements
December 31, 2008
(1) Organization and Summary of Significant Accounting Policies
- (a)
- Organization and Nature of Business
Beryl Oil and Gas LP (the Partnership), which changed its name from Coldren Resources LP in May 2007, is a Delaware limited partnership that was organized in May 2006 for the purpose of acquiring offshore oil and gas properties. The Partnership is a joint venture between Beryl Resources LP (BR), formerly named Coldren Oil and Gas Company LP, and Superior Energy Services, Inc. (SESI). BR owns 60% of the Partnership and acts as the managing partner, while SESI owns 40%. The Partnership has no employees and all business activity was managed by BR or SESI personnel during 2008.
- (b)
- Basis of Presentation
The accompanying financial statements have been prepared on an accrual basis of accounting, in accordance with accounting principles generally accepted in the United States of America.
- (c)
- Cash Equivalents
The Partnership considers all highly liquid investments with an original maturity of three months or less when purchased to be cash equivalents. Cash equivalents are stated at cost, which approximates market value.
- (d)
- Accounts Receivable and Allowances
Trade accounts receivables are recorded at the invoiced amount and do not bear interest. The Partnership determines the allowances based on historical write-off experience and specific identification. As of December 31, 2008, the Partnership had $0.5 million of allowances for doubtful accounts.
- (e)
- Property and Equipment
Proved Oil and Properties
The Partnership accounts for oil and gas properties under the successful efforts method. Under this method, all leasehold and development cost of proved properties are capitalized and amortized on a unit-of-production basis over the remaining life of proved reserves and proved developed reserves, respectively.
The Partnership evaluates the impairment of its proved oil and gas properties on a depletable unit basis whenever events or changes in circumstances indicate an asset's carrying amount may not be recoverable. The carrying amount of proved oil and gas properties is reduced to fair value when the expected undiscounted future cash flows are less than the assets net book value. Cash flows are determined based upon reserves using prices, costs, and discount factors consistent with those used for internal decision making. Costs of retired, sold, or abandoned properties that constitute a part of an amortization base are charged or credited, net of proceeds, to accumulated depreciation, depletion, and amortization unless doing so significantly affects the unit-of-production amortization rate, in which case a gain or loss is recognized currently. Gains or losses from the disposal of other properties are recognized currently. Expenditures for maintenance and repairs necessary to maintain properties in operating condition are expensed as incurred as part of lease operating expenses. Estimated dismantlement and abandonment costs for oil and gas properties are capitalized at their estimated net
F-110
BERYL OIL AND GAS LP
Notes to Financial Statements (Continued)
December 31, 2008
(1) Organization and Summary of Significant Accounting Policies (Continued)
present value and amortized on a unit-of-production basis over the remaining life of the related proved developed reserves.
Unproved Oil and Gas Properties
Unproved properties consist of costs incurred to acquire unproved leasehold as well as costs to acquire unproved resources. Unproved leasehold costs are capitalized and amortized on a composite basis if individually insignificant, based on past success, experience, and average lease-term lives. Individually significant leases are reclassified to proved properties if successful and expensed on a lease-by-lease basis if unsuccessful or the lease term has expired. Unamortized leasehold costs related to successful exploratory drilling are reclassified to proved properties and depleted on a unit-of-production basis. The carrying value of the Partnership's unproved resources, acquired in connection with business acquisitions, was determined using the market-based weighted average cost of capital rate, subjected to additional project-specific risk factors. Because these reserves do not meet the definition of proved reserves, the related costs are not classified as proved properties. As the unproved resources are developed and proved, the associated costs are reclassified to proved properties and depleted on a unit-of-production basis. The Partnership assesses unproved resources for impairment annually on the basis of the experience of the Partnership in similar situations and other information about such factors as the primary lease terms of those properties, the average holding period of unproved properties, and the relative proportion of such properties on which proved reserves have been found in the past.
Impairment
Based on the analysis described above, the Partnership recorded an impairment of oil and gas properties of approximately $34.9 million for the year ended December 31, 2008, which is included in impairment and dry hole expense on the statement of operations.
Exploration Costs
Geological and geophysical costs, delay rentals, amortization of unproved leasehold costs, and costs to drill exploratory wells that do not find proved reserves are expensed as oil and gas exploration costs. The costs of any exploratory wells are carried as an asset if the well finds a sufficient quantity of reserves to justify its capitalization as a producing well and as long as the Partnership is making sufficient progress towards assessing the reserves and the economic and operating viability of the project.
Other Property and Equipment
Other property and equipment, consisting primarily of office furniture, equipment, leasehold improvements, computers, and computer software, are stated at cost. Depreciation on property and equipment is calculated on the straight-line method over the estimated useful lives of the assets, which range from three to seven years.
F-111
BERYL OIL AND GAS LP
Notes to Financial Statements (Continued)
December 31, 2008
(1) Organization and Summary of Significant Accounting Policies (Continued)
- (f)
- Asset Retirement Obligations
The Partnership accounts for its asset retirement obligations in accordance with Statement of Financial Accounting Standards (SFAS) No. 143, Accounting for Asset Retirement Obligations. SFAS No. 143 requires the Partnership to record the fair value of obligations associated with the retirement of tangible long-lived assets in the period in which it is incurred. The liability is capitalized as part of the related long-lived asset's carrying amount. Over time, accretion of the liability is recognized as an operating expense and the capitalized cost is depleted over the expected useful life of the related asset. The Partnership's asset retirement obligations relate primarily to the plugging, dismantlement, removal, site reclamation, and similar activities of its oil and gas properties.
- (g)
- Financial Instruments
The fair value of the Partnership's financial instruments of cash, accounts receivable, and current maturities of long-term debt approximates their carrying amount. The carrying value of the Partnership's debt is approximately $298.8 million at December 31, 2008. The fair value of the Partnership's cash and cash equivalents is approximately $80.9 million at December 31, 2008.
- (h)
- Revenue Recognition
The Partnership records revenues from the sale of its oil and gas production when the product is delivered at a determinable price, title has transferred, and collectibility is reasonably assured. When the Partnership has an interest with other producers in properties from which natural gas is produced, the Partnership uses the entitlement method for recording gas sales revenue. Under this method of accounting, revenue is recorded based on the Partnership's net revenue interest in field production. Deliveries of gas in excess of the Partnership's revenue interest are recorded as liabilities and underdeliveries are recorded as receivables. The Partnership also had gas imbalance receivables of $11.1 million and producer gas payables of $8.6 million at December 31, 2008.
- (i)
- Derivative Instruments and Hedging Activities
The Partnership accounts for derivative instruments and hedging activities in accordance with SFAS No. 133, Accounting for Derivative Instruments and Hedging Activities, as amended (SFAS No. 133). SFAS No. 133 established accounting and reporting standards requiring every derivative instrument (including certain derivative instruments embedded in other contracts) to be recorded on the balance sheet as either an asset or liability measured at fair value. SFAS No. 133 requires that changes in the derivative's fair value be recognized currently in earnings unless specific hedge accounting criteria are met. Under cash flow hedge accounting, gains and losses are reflected in partners' capital as accumulated other comprehensive income or loss (AOCI) until the forecasted transaction occurs. The derivative's gains or losses are then offset against related results on the hedged transaction on the statement of operations. SFAS No. 133 also requires that a company formally document, designate, and assess the effectiveness of transactions that receive hedge accounting. Only derivative instruments that are expected to be highly effective in offsetting anticipated gains or losses on the hedged cash flows and that are subsequently documented to have been highly effective can qualify for hedge accounting. Effectiveness must be assessed both at inception of the hedge and on an ongoing basis. Any ineffectiveness in hedging instruments whereby gains or losses do not exactly offset anticipated gains or losses of hedged cash flows is measured and recognized in earnings in the period in which it occurs.
F-112
BERYL OIL AND GAS LP
Notes to Financial Statements (Continued)
December 31, 2008
(1) Organization and Summary of Significant Accounting Policies (Continued)
The Partnership assesses hedge effectiveness on an ongoing basis based on total changes in the derivative's fair value and using regression analysis. A hedge is considered effective if certain statistical tests are met. For derivatives not qualifying for hedge accounting, the changes in fair value are recorded as other income (expense) on the consolidated statements of operations.
Through October 31, 2008, the Partnership elected to designate the majority of its crude oil and natural gas derivative instruments as cash flow hedges. On November 1, 2008, the Partnership discontinued cash flow hedge accounting on all existing commodity derivative instruments. The Partnership voluntarily made this change to provide greater flexibility in its use of derivative instruments. From November 1, 2008 forward, the Partnership recognized all realized and unrealized gains and losses on such instruments in earnings in the period in which they occur. Net derivative losses that were deferred in AOCI as of October 31, 2008, will be reclassified to earnings in future periods as the original hedged transactions affect earnings. During 2008, the Partnership reclassified $1.9 million of derivative gains from other comprehensive income to net loss as it was probable that the original forecasted transaction would not occur by the end of the original period or an additional two-month time period. The discontinuance of cash flow hedge accounting for commodity derivative instruments did not affect the Partnership's net assets or cash flows at December 31, 2008 and does not require adjustments to previously reported financial statements.
- (j)
- Income Taxes
The Partnership does not pay income taxes as profits or losses are reported directly to the taxing authorities by the individual partners. Accordingly, no provision for income taxes has been included in the accompanying financial statements.
- (k)
- Deferred Financing Costs
Costs incurred to obtain debt financing are deferred and are amortized as additional interest expense over the maturity period of the related debt.
- (l)
- Allocation of Income and Distributions to Partners
The partnership agreement allows for revenues and expenditures to be allocated between the general partner and limited partner in accordance with their respective sharing ratios.
- (m)
- Use of Estimates
The preparation of the financial statements in conformity with accounting principles generally accepted in the United States of America requires management to make estimates and assumptions that affect the reported amounts of assets and liabilities and the reported amounts of revenues and expenses during the reporting period. The Partnership's most significant financial estimates are based on remaining proved oil and natural gas reserve volumes. Estimates of remaining proved reserve volumes are a key component in determining the Partnership's depletion rate for oil and gas properties. Estimation of the values of the Partnership's remaining proved reserves is a key component in determining the need for impairment of the oil and natural gas asset base. These estimates require assumptions regarding future commodity prices and future costs and expenses, as well as future production rates. Actual results could differ from these estimates.
F-113
BERYL OIL AND GAS LP
Notes to Financial Statements (Continued)
December 31, 2008
(1) Organization and Summary of Significant Accounting Policies (Continued)
- (n)
- Recently Issued Accounting Standards
In February 2007, the Financial Accounting Standards Board (FASB) issued SFAS No. 159, The Fair Value Option for Financial Assets and Financial Liabilities—Including an amendment of FASB Statement No. 115. SFAS No. 159 gives the Partnership the irrevocable option to carry most financial assets and liabilities at fair value that are not currently required to be measured at fair value. If the fair value option is elected, changes in fair value would be recorded in earnings at each subsequent reporting date. SFAS No. 159 is effective for the Partnership's 2008 fiscal year. The adoption of this statement did not have a material impact on the Partnership's financial condition, results of operations, and cash flows.
In September 2006, the FASB issued SFAS No. 157, Fair Value Measurements. SFAS No. 157 defines fair value, establishes a framework for the measurement of fair value, and enhances disclosures about fair value measurements. The statement does not require any new fair value measures. The statement is effective for fair value measures already required or permitted by other standards for fiscal years beginning after November 15, 2007. The Partnership was required to adopt SFAS No. 157 beginning on January 1, 2008. SFAS No. 157 is required to be applied prospectively, except for certain financial instruments. Any transition adjustment will be recognized as an adjustment to opening retained earnings in the year of adoption. In November 2007, the FASB proposed a one-year deferral of SFAS No. 157's fair value measurement requirements for nonfinancial assets and liabilities that are not required or permitted to be measured at fair value on a recurring basis. The Partnership adopted SFAS No. 157 and the impact on its results of operations and financial position is approximately $0.4 million during 2008.
In December 2007, the FASB issued SFAS No. 141(R), Business Combinations, and SFAS No. 160, Noncontrolling Interests in Consolidated Financial Statements—an amendment to ARB No. 51. SFAS Nos. 141(R) and 160 require most identifiable assets, liabilities, noncontrolling interests, and goodwill acquired in a business combination to be recorded at "full fair value" and require noncontrolling interests (previously referred to as minority interests) to be reported as a component of equity, which changes the accounting for transactions with noncontrolling interest holders. Both statements are effective for periods beginning on or after December 15, 2008, and earlier adoption is prohibited. SFAS No. 141(R) will be applied to business combinations occurring after the effective date. SFAS No. 160 will be applied prospectively to all noncontrolling interests, including any that arose before the effective date. The Partnership is currently evaluating the impact of adopting SFAS Nos. 141(R) and 160 on its results of operations and financial position.
F-114
BERYL OIL AND GAS LP
Notes to Financial Statements (Continued)
December 31, 2008
(2) Significant Concentrations
For the year ended December 31, 2008, the Partnership's oil and gas revenue (excluding the effects of hedging activities) was attributable to the following significant customers, as a percentage of total revenues:
Louis Dreyfus |
19 | % | |||
W&T Offshore |
24 | ||||
Chevron |
20 | ||||
Shell Oil Company |
24 | ||||
Total |
87 | % | |||
(3) Related-Party Transactions
The Partnership has an operating services agreement that covers services provided by BR and SESI. BR and SESI provide operational and accounting functions under the operating services agreement that provides for reimbursement of all direct and indirect costs incurred as part of the agreement. These management fees were paid to SESI and recorded by the Partnership as general and administrative expenses totaling $0.5 million for the year ended December 31, 2008. BR charged the Partnership approximately $0.4 million in general and administrative expenses for the year ended December 31, 2008. During 2008, the Partnership paid approximately $3.6 million in services to SESI.
Accounts payable to affiliates is as follows (in thousands) at December 31, 2008:
Payable to SPN Resources |
$ | 36 | |||
Payable to Beryl Resources |
1,138 | ||||
Payable to Superior Energy Services, Inc. |
678 | ||||
Total accounts payable to affiliates |
$ | 1,852 | |||
(4) Property Acquisitions and Divestitures
During 2008, the Partnership purchased unproved leases for $1.7 million. The Partnership also purchased additional interest in one of its fields. It paid no cash, but received approximately $1.0 million for the Asset Retirement Obligation (ARO) liability that was assumed.
(5) Property and Equipment
A summary of property and equipment is as follows (in thousands):
Proved oil and gas properties |
$ | 665,459 | |||
Unproved oil and gas properties |
13,811 | ||||
Other |
2,794 | ||||
|
682,064 | ||||
Less accumulated depreciation, depletion, and amortization |
(239,189 | ) | |||
Property and equipment, net |
$ | 442,875 | |||
F-115
BERYL OIL AND GAS LP
Notes to Financial Statements (Continued)
December 31, 2008
(5) Property and Equipment (Continued)
The Partnership recognized $34.9 million of impairment and dry hole expense during 2008. The impairments comprised proved properties, probable reserves, and unproved leases during 2008.
Unproved properties comprise a lease bonus that is being amortized over the term of the lease and probable reserve values, which are reviewed annually for impairment. During 2008, the Partnership recorded amortization of its unproved properties of $2.2 million, which is included in depreciation, depletion, and amortization expense.
Substantially all of the Partnership's oil and natural gas properties serve as collateral for the Partnership's long-term debt.
(6) Asset Retirement Obligations
The following table summarizes the activity for the Partnership's asset retirement obligations for the year ended December 31, 2008 (in thousands):
Asset retirement obligations at beginning of year |
$ | 79,614 | |||
Liabilities acquired and incurred |
2,940 | ||||
Liabilities settled |
(165 | ) | |||
Accretion expense |
5,035 | ||||
Revision in estimated liabilities |
2,660 | ||||
Asset retirement obligations at end of year |
90,084 | ||||
Current portion of asset retirement obligations |
14,785 | ||||
Long-term portion of asset retirement obligations |
$ | 75,299 | |||
(7) Long-Term Debt
The carrying amount of the Partnership's long-term borrowings that were outstanding subject to interest rate risk consists of the following (in thousands) at December 31, 2008:
First Lien Term Loan, interest rate based on LIBOR borrowing rates plus a margin of 4.00% payable July 14, 2011, with a rate on December 31, 2008 of 6.00% |
$ | 179,358 | |||
Second Lien Term Loan, interest rate based on LIBOR borrowing rates plus a margin of 6.00% payable January 13, 2012, with a rate on December 31, 2008 of 8.00% |
119,457 | ||||
|
298,815 | ||||
Less current maturities of long-term debt |
26,223 | ||||
Long-term debt |
272,592 | ||||
Less unamortized loan discounts |
(1,385 | ) | |||
Total long-term debt |
$ | 271,207 | |||
F-116
BERYL OIL AND GAS LP
Notes to Financial Statements (Continued)
December 31, 2008
(7) Long-Term Debt (Continued)
On July 14, 2006, the Partnership entered into a First Lien Agreement and Second Lien Agreement with Credit Suisse Securities, LLC and Banc of America Securities, LLC to fund its acquisition of oil and gas properties from Noble Energy, Inc. The First Lien Agreement of $311.0 million bears interest at LIBOR plus 4% margin and the Second Lien Agreement of $124 million bears interest at LIBOR plus 6% margin. The First Lien Agreement matures on July 14, 2011 and the Second Lien Agreement matures on January 13, 2012. Both agreements require interest payments in March, June, September, and December. The lien agreements contain customary events of default and requires that the Partnership satisfy various financial covenants, which require the Partnership to: (i) maintain a minimum asset coverage ratio, as defined in the lien agreements, (ii) maintain a minimum earnings before interest, taxes, depreciation, abandonment, and exploration and other noncash charges (EBITDAX) to interest ratio, as defined in the lien agreements, and (iii) maintain a leverage ratio, as defined in the lien agreements. The lien agreements also limit the Partnership's capital expenditures, its ability to pay dividends or make other distributions, make acquisitions, make changes to the Partnership's capital structure, create liens, and incur additional indebtedness. The agreements also require the Partnership to enter into interest rate protection agreements and commodity price hedging programs for its debt and sales of natural gas and oil.
The First and Second Lien Agreements with Credit Suisse provide for a Mandatory Prepayment, as defined, which is equal to the Required Percentage of Excess Cash Flow for the period provided that a Liquidity Reserve of $25 million is maintained at all times. Excess Cash Flow is defined as EBITDAX less working capital changes, capital expenditures, and exploration expenses. As of December 31, 2008, the Mandatory Prepayment is $0. The First and Second Lien Agreements with Credit Suisse also allows for an Optional Prepayment, equal to no less than $5.0 million and which must be in multiples of $1.0 million. The Optional Prepayment on the First Lien was subject to a prepayment premium of 1% of the Optional Prepayment amount if prepaid within the first year of the loan. The Optional Prepayment on the Second Lien is subject to a prepayment premium of 3%, 2%, and 1%, of the Optional Prepayment amount if prepaid within the first year, second year, and third year, respectively, of the loan. During 2008, the Partnership repaid $24.2 million, of its outstanding long-term debt.
As of December 31, 2008, the Partnership violated the covenant to maintain a leverage ratio of 1.25 to 1.00, or greater, on the First Lien and 1.50 to 1.00, or greater, on the Second Lien. As a result, the Partnership was in default on both the First and Second Lien Agreements. At the point of default, the full amount of both the First and the Second Lien became callable; however, the amounts due were not reclassified to current maturities of long-term debt because the Partnership was recapitalized and the debt was restructured to long-term on October 13, 2009 as discussed in note 13. The restructuring included replacing the First Lien Agreement with an amended agreement and the forgiveness of $27.9 million of amounts due. The Second Lien Term Loan was exchanged for an equity interest in the Partnership. The current maturities of long-term debt of $26.2 million as of December 31, 2008, represent a mandatory prepayment under the restructured Lien Agreements due and paid on October 13, 2009.
F-117
BERYL OIL AND GAS LP
Notes to Financial Statements (Continued)
December 31, 2008
(8) Interest Rate Hedging Agreements
During 2006, the Partnership entered into a collar agreement with a notional cap amount of $50 million and a floor of $25 million of the floating rate term loans, which expired in 2008. Also during 2006, the Partnership entered into a collar agreement with a notional cap amount of $150 million and a floor of $75 million of floating rate term loans as follows:
| Interest rate derivative positions | |||||||||
|---|---|---|---|---|---|---|---|---|---|
Contract team
|
Instrument type |
Strike interest rate |
Notional amounts |
Loan rate | |||||
09/06 - 09/09 |
Collars | 5.4190 | % | $150 million and $75 million | LIBOR+% | ||||
On October 31, 2008, the Partnership dedesignated its interest rate hedges as cash flow hedges. For the period from November 1, 2008 to December 31, 2008, the Partnership accounted for the change in valuation of the hedges as mark-to-market resulting in an unrealized loss of $0.1 million, recorded in other income.
At December 31, 2008, the fair value of the interest rate derivatives' had a short-term liability of $1.9 million, long-term liability of $0, and an unrealized loss of $1.9 million, which is reflected in accumulated other comprehensive income. These values were based on quoted market prices for contracts with similar terms and maturity dates. During 2008, the Partnership (paid) received interest rate settlements from its counterparties of ($1.9 million), which are included in interest expense.
(9) Oil and Gas Commodity Hedging Agreements
The Partnership had the following oil and gas commodity hedging contracts as of December 31, 2008:
| Commodity derivatives | |||||||||||
|---|---|---|---|---|---|---|---|---|---|---|---|
| Crude oil swaps | |||||||||||
Coverage period |
Instrument type |
Strike price (per Bbl) |
Reference or floating price |
Total (Bbls)1 | |||||||
2009 |
Swap | $ | 78.32 | NYMEX WTI | 321,358 | ||||||
2010 |
Swap | 81.47 | NYMEX WTI | 180,362 | |||||||
| Natural gas swaps | |||||||||||
|---|---|---|---|---|---|---|---|---|---|---|---|
Coverage period |
Instrument type |
Strike price (per MMBtu) |
Reference or floating price |
Total (MMBtu)2 | |||||||
2009 |
Swap | $ | 8.46 | NYMEX | 4,390,004 | ||||||
2010 |
Swap | 8.43 | NYMEX | 2,681,144 | |||||||
| Natural gas floors3 | |||||||||||
|---|---|---|---|---|---|---|---|---|---|---|---|
Coverage period |
Instrument type |
Strike price (per MMBtu) |
Reference or floating price |
Total (MMBtu)2 | |||||||
2009 |
Floor | $ | 8.25 | NYMEX | 7,300,000 | ||||||
- (1)
- Bbls
equals Barrel of oil
- (2)
- MMBtu
equals Million British Thermal Units
- (3)
- The Partnership paid $2.5 million to purchase these puts in 2008
F-118
BERYL OIL AND GAS LP
Notes to Financial Statements (Continued)
December 31, 2008
(9) Oil and Gas Commodity Hedging Agreements (Continued)
On October 31, 2008, the Partnership dedesignated its commodity hedges as cash flow hedges. For the period from November 1, 2008 to December 31, 2008, the Partnership accounted for the change in valuation of the hedges as mark-to-market resulting in an unrealized gain of $15.8 million.
For the year ended December 31, 2008, settlements of hedging contracts decreased oil and gas revenues by $20.2 million. Settlements expected to be received in the next 12 months related to these commodity hedges of $33.6 million are recorded as an asset in the current portion of the fair value of derivative instruments. Settlements expected to be received after the next 12 months related to these commodity hedges of $6.5 million are recorded as an asset in the long-term portion of the fair value of the derivative instruments. As of December 31, 2008, $15.7 million, is reflected as an unrealized gain (loss) in accumulated other comprehensive income (loss). As of December 31, 2008, $1.6 million of ineffectiveness was recorded in other income (expense).
For the years ended December 31, 2008, settlements of derivatives that did not qualify for hedge accounting resulted in gains of $1.8 million, are included in other income. During 2008, the gain on the fair value of commodity derivatives that are mark-to-market is $17.5 million, and is included in other income (expense).
(10) Fair Value Measurements
The Partnership adopted SFAS No. 157 on January 1, 2008 for the fair value measurements of financials assets and liabilities. SFAS No. 157 establishes a fair value hierarchy that prioritizes the inputs to the valuation techniques used to measure fair value. The hierarchy gives the highest priority to unadjusted quoted prices in active markets for identical assets or liabilities (Level 1 measurements) and the lowest priority to measurements involving significant unobservable inputs (Level 3 measurements). The three levels of the fair value hierarchy are as follows:
- •
- Level 1 inputs are quoted prices (unadjusted) in active markets for identical assets or liabilities that the
Partnership has the ability to access at the measurement date.
- •
- Level 2 inputs are other than quoted prices included with Level 1 that are observable for the asset or
liability, either directly or indirectly.
- •
- Level 3 inputs are unobservable inputs for the asset or liability.
The level in the fair value hierarchy with a fair value measurement in its entirety falls is based on the lowest level of input that is significant to the fair value measurement in its entirety. The fair value of derivative instruments is determined utilizing pricing models for significantly similar instruments. The models use a variety of techniques to arrive at fair value, including quotes and pricing analysis. Inputs to the pricing models include publicly available prices and forward curves generated from a compilation of data gathered from third parties. The credit risk adjustments are based on credit ratings. In certain circumstances, the credit rating represented a significant unobservable input utilized in the valuation.
F-119
BERYL OIL AND GAS LP
Notes to Financial Statements (Continued)
December 31, 2008
(10) Fair Value Measurements (Continued)
The following table presents assets and liabilities that are measured at fair value on a recurring basis (including items that are required to be measured at fair value and items for which the fair value option has been elected) at December 31, 2008 (in thousands):
| |
Quoted prices in active markets for identical assets (Level 1) |
Significant other observable inputs (Level 2)(1) |
Significant unobservable inputs (Level 3) | ||||||||
|---|---|---|---|---|---|---|---|---|---|---|---|
Assets: |
|||||||||||
Commodity derivative instruments |
$ | — | 40,156 | — | |||||||
|
$ | — | 40,156 | — | |||||||
Liabilities: |
|||||||||||
Interest rate derivative instruments |
$ | — | — | 1,940 | |||||||
|
$ | — | — | 1,940 | |||||||
- (1)
- Amounts
shown are netted under derivative netting agreements.
The following table presents the Partnership's activity for derivatives measured at fair value on a recurring basis using significant unobservable inputs (Level 3) as defined by SFAS No. 157 for the year ended December 31, 2008 (in thousands):
| |
Liabilities | ||||
|---|---|---|---|---|---|
| |
Interest rate derivatives |
||||
Balance at December 31, 2007 |
$ | (2,214 | ) | ||
Total realized and unrealized gains (losses)—included in other comprehensive income |
2,542 | ||||
Settlements, net |
(1,918 | ) | |||
Reclassification out of accumulated other comprehensive income |
(350 | ) | |||
Transfers in and/or out of Level 3 |
— | ||||
Balance at December 31, 2008 |
$ | (1,940 | ) | ||
F-120
BERYL OIL AND GAS LP
Notes to Financial Statements (Continued)
December 31, 2008