Attached files
| file | filename |
|---|---|
| 8-K - FORM 8-K - American Water Works Company, Inc. | d284065d8k.htm |
| EX-99.1 - PRESS RELEASE - American Water Works Company, Inc. | d284065dex991.htm |
 2012
Earnings Guidance January 18, 2012
Exhibit 99.2 |
 January 2012
2
Certain statements in this presentation are forward-looking statements within the
meaning of the safe harbor provisions of the Private Securities Litigation
Reform Act of 1995. These forward-looking statements are predictions based on our current
expectations and assumptions regarding future events and may relate to, among
other things, our future financial performance, including return on
equity performance, our growth and portfolio optimization strategies, our projected capital
expenditures and related funding requirements, our ability to repay debt, our ability
to finance current operations and growth initiatives,
the
impact
of
legal
proceedings
and
potential
fines
and
penalties,
business
process
and
technology
improvement
i
nitiatives, trends in our industry, regulatory or legal developments or rate
adjustments. Actual results could differ materially because of factors such as
decisions of governmental and regulatory bodies, including decisions to raise or lower rates; the
timeliness
of
regulatory
commissions’
actions
concerning
rates;
changes
in
laws,
governmental
regulations
and
policies,
including
environmental,
health
and
water
quality
and
public
utility
regulations
and
policies;
weather
conditions,
patterns
or
events, including drought or abnormally high rainfall; changes in customer demand
for, and patterns of use of, water, such as may
result
from
conservation
efforts;
significant
changes
to
our
business
processes
and
corresponding
technology;
our
ability to appropriately maintain current infrastructure; our ability to obtain
permits and other approvals for projects; changes in our capital requirements;
our ability to control operating expenses and to achieve efficiencies in our operations; our ability
to obtain adequate and cost-effective supplies of chemicals, electricity, fuel,
water and other raw materials that are needed for our operations; our ability
to successfully acquire and integrate water and wastewater systems that are complementary to our
operations and the growth of our business or dispose of assets or lines of business
that are not complementary to our operations and the growth of our business;
cost overruns relating to improvements or the expansion of our operations;
changes in general economic, business and financial market conditions; access to
sufficient capital on satisfactory terms; fluctuations in interest rates;
restrictive covenants in or changes to the credit ratings on our current or future debt that could
increase our financing costs or affect our ability to borrow, make payments on debt
or pay dividends; fluctuations in the value of benefit plan assets and
liabilities that could increase our cost and funding requirements; our ability to utilize our U.S. and
state net operating loss carryforwards; migration of customers into or out of our
service territories; difficulty in obtaining insurance at acceptable rates and
on acceptable terms and conditions; the incurrence of impairment charges ability to retain
and attract qualified employees; and civil disturbance, or terrorist threats or acts
or public apprehension about future disturbances or terrorist threats or
acts. Any forward-looking statements we make, speak only as of the date of
this presentation. Except as required by law, we specifically disclaim any
undertaking or intention to publicly update or revise any forward-looking statements, whether as a
result
of
new
information,
future
events,
changed
circumstances
or
otherwise.
Cautionary Statement Concerning Forward-Looking
Statements |
 2011
- What happened
3
January 2012
•Portfolio Optimization
•Divested TX, AWM
•Acquired MO
•Executed Agreements AZ, NM, OH and NY
•Net Utility Plant
•
Invested approximately $900 Million
•Market-Based Operations
•Homeowner Service Contracts reach 880,000
•Improving ROE
•2010 ended at 6.4%
•2011 estimate: 7.2% -
7.4%
•Total Shareholder Returns
•30% at 12/31/2011
•Cash Dividends Increased 5%
•Yield 2.89% at 12/31/11
•Rate Cases Effective in 8 states in 2011
•$158.3 Million
•
Infrastructure Charges awarded of $10.7 Million
•Rate Cases Filed in 10 states
•Decisions Pending in 8 states
•Address Regulatory Lag
•
Declining Usage
•Infrastructure Charges (New Jersey, Illinois)
•O&M Efficiency Ratio improvement
•
Expense Management
•Rate Case Effectiveness
•Business Transformation
•On schedule for 2014 completion
Operating
Efficiency
Regulatory
Environment
Growth
Shareholder
Value |
 January 2012
4
2012 Range: Solid Growth Powers Earnings Range
from Ongoing Operations of $1.90 -
$2.00
Key Drivers
•
Annual infrastructure
investment of approximately
$900 million
•
Continued improvement in
operating efficiency ratio
toward 5-year goal of 40%
•
Completion of current portfolio
optimization transactions
•
Continued low interest rate
environment
•
Completion of outstanding
rate cases
•
Continued dividend focus
•
No equity offering
2012 Range
$1.90 -
$2.00
•
2011 Range excludes the impact from discontinued operations and the
one-time contribution of appreciated land to a county authority in
Lexington, Kentucky |
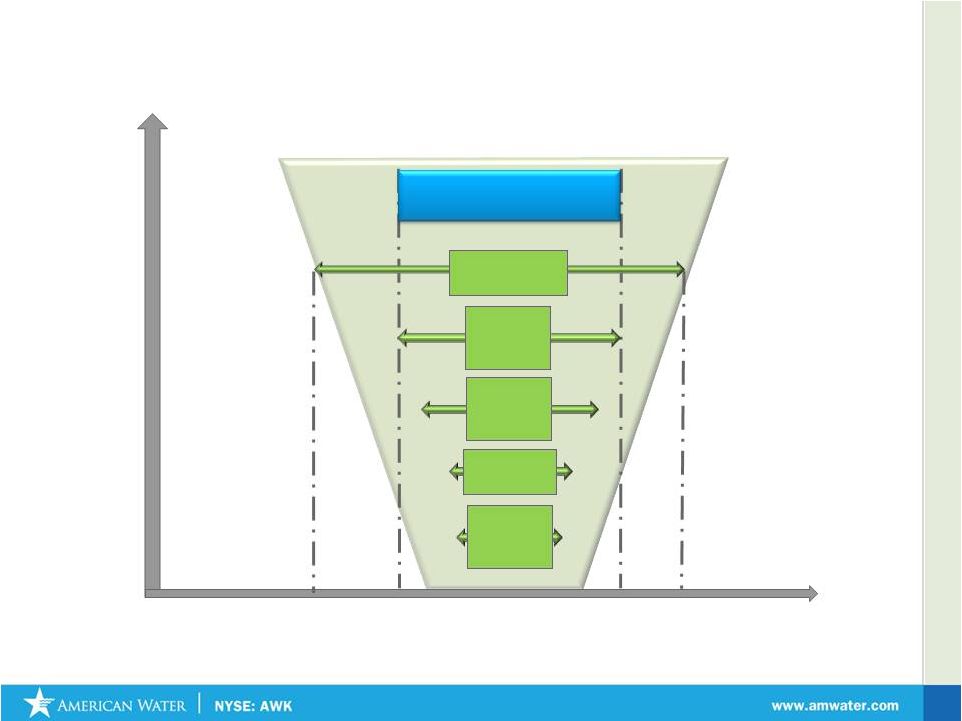 5
* Not to scale
2012 Earnings Per Share Range: Key Factors
Influencing Earnings Range
Interest
Rates
(+/-
1%)
2012 EPS Range
$1.90 -
$2.00
Consumption
(+/-1%)
Fuel &
Power
(+/-
10%)
Chemicals
(+/-
10%)
O&M
Expense
(+/-
1%)
$2.03
$1.87
$1.90
$2.00
January 2012 |
 January 2012
6
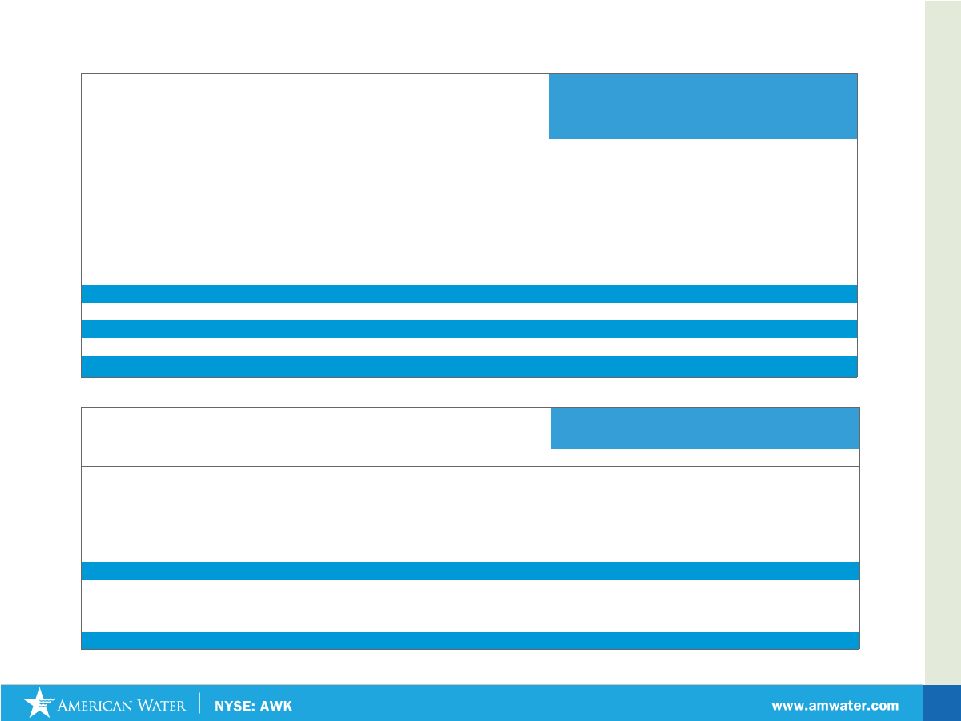
AWK 2011 Accomplishments
2012 Expectations
Continue Portfolio Optimization Initiative
Finalize transactions in NM, AZ, NY and Ohio
Identify additional valued-added opportunities
Actively Address Regulatory Lag that Impacts
Returns on Investments
Expect to file 4 general rate cases in 2012
Infrastructure Surcharges filings in 4-6 states
Address usage trends via rate case or other filings
Continue Operating Efficiency Improvement
Five-year goal below 40%
Efficient use of our Capital
Invest approximately $900 million to upgrade
infrastructure
Enhance DSIC like mechanisms
Optimize Supply Chain
Increase Earned Regulated Return
Expand
Market
Based
businesses
-
focusing
on
Homeowner Services & Military Contract
Operations
Optimize Municipal Contract Operations Business
Model
Execution of Portfolio Optimization Initiative
Closed MO acquisition, TX sale and sale of
Applied Water Management (AWM)
Filed for regulatory approvals for transactions
in NM, AZ, NY and Ohio
Resolved Rate Cases worth $296.5 MM of
filed Annualized Revenues
Rate cases effective in 8 states generating
approximately $158.3 million in annualized
revenue increases and $10.7 million in
infrastructure surcharges, assuming normal
usage patterns.
Filed 10 rate proceedings in 2011 requesting
$282.9 million in annualized revenue
Initiated state specific efforts to address
declining usage in all rate cases filed in 2011
Continued Operating Efficiency improvement
Continued improvement in Return on Equity
What We Accomplished in 2011
In 2012 You Can Expect Us To |
 January 2012
American Water: Providing Value to Investors
•
The Adjusted 2011 EPS Range, a non-GAAP measure, does not recognize an
approximate 9 cent benefit to earnings per share from the cessation of
depreciation for discontinued operations in Arizona, New Mexico,
Texas and Ohio.
•
CAGR percentages calculated to midpoint of 2012 estimates
•
2008 and 2009 EPS and ROE exclude impairment charges
Earnings Per Share
7
Mid-
range
Return of Equity
8.00%
6.00%
4.00%
2.00%
0.00%
4.12%
4.99%
6.49%
7.2%
7.4%
7.5%
7.9%
2008
2009
2010
2011
Landing
Zone
2012E |
 8
January 2012 |
 January 2012
Return on Equity Excluding Impairment Charge (A Non-GAAP Unaudited Number)
Historical
($ in thousands )
2008
2009
2010
Net income (Loss) from Continuing Operations
($562,421)
($233,083)
$267,827
Adjustments
Impairment charges
738,475
443,024
0
Adjusted net income excluding impairment charge
$176,054
$209,941
$267,827
Year end stockholders’
equity
$4,102,001
$4,000,859
$4,127,725
Add impairment charge, net of tax
738,475
443,024
0
Adjusted stockholders’
equity excluding impairment charge, net of tax
$4278,055
$4,210,800
$4,127,725
ROE Percentage
4.12%
4.99%
6.49%
9
Net Income (Loss) –
Earnings per Share Excluding Impairment Charge
(A Non-GAAP Unaudited Number)
Historical
($ in thousands, except per share data)
2008
2009
2010
Net income, (Loss)
($562,421)
($233,083)
$267,827
Add: Impairment
750,000
450,000
0
Net income excluding impairment charge before associated tax benefit
187,579
216,917
267,827
Less: Income tax benefit relating to impairment charge
11,525
6,976
0
Adjusted net income excluding impairment charge
$176,054
$209,941
$267,827
Basic earnings per common share excluding impairment charge:
Adjusted net income excluding impairment charge
$1.10
$1.25
$1.53
Diluted earnings per common share excluding impairment charge:
Adjusted net income excluding impairment charge
$1.10
$1.25
$1.53
Reconciliation Tables |