Attached files
| file | filename |
|---|---|
| 8-K - FORM 8-K - UDR, Inc. | c26704e8vk.htm |
Exhibit 99.1
| 95 Wall New York, NY 10 Hanover Square New York, NY 21 Chelsea New York, NY View 14 Washington, D.C. Rivergate New York, NY UBS Roadshow - January 2012 |
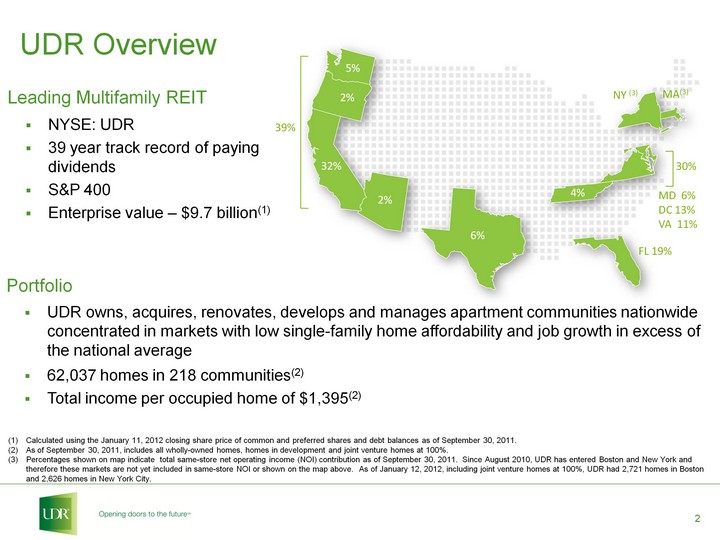
| Portfolio UDR owns, acquires, renovates, develops and manages apartment communities nationwide concentrated in markets with low single-family home affordability and job growth in excess of the national average 62,037 homes in 218 communities(2) Total income per occupied home of $1,395(2) Leading Multifamily REIT NYSE: UDR 39 year track record of paying dividends S&P 400 Enterprise value - $9.7 billion(1) UDR Overview MD 6% DC 13% VA 11% MA(3) FL 19% 6% 5% 2% 32% 2% 4% NY (3) 39% 30% Calculated using the January 11, 2012 closing share price of common and preferred shares and debt balances as of September 30, 2011. As of September 30, 2011, includes all wholly-owned homes, homes in development and joint venture homes at 100%. Percentages shown on map indicate total same-store net operating income (NOI) contribution as of September 30, 2011. Since August 2010, UDR has entered Boston and New York and therefore these markets are not yet included in same-store NOI or shown on the map above. As of January 12, 2012, including joint venture homes at 100%, UDR had 2,721 homes in Boston and 2,626 homes in New York City. |
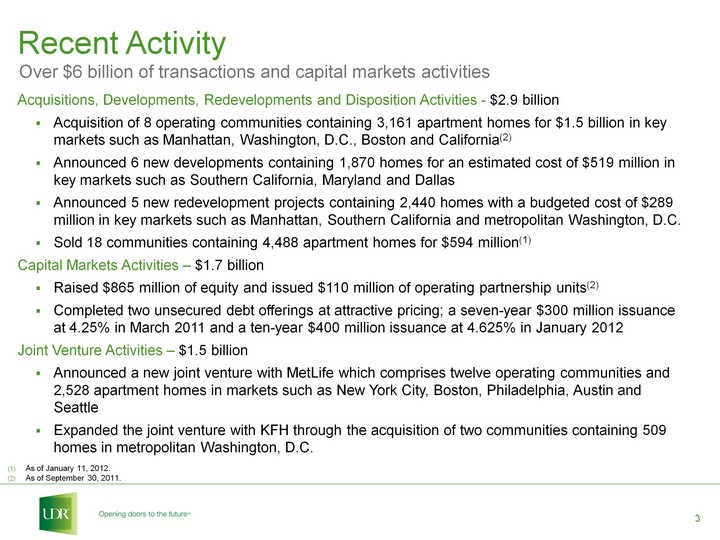
| Recent Activity Acquisitions, Developments, Redevelopments and Disposition Activities - $2.9 billion Acquisition of 8 operating communities containing 3,161 apartment homes for $1.5 billion in key markets such as Manhattan, Washington, D.C., Boston and California(2) Announced 6 new developments containing 1,870 homes for an estimated cost of $519 million in key markets such as Southern California, Maryland and Dallas Announced 5 new redevelopment projects containing 2,440 homes with a budgeted cost of $289 million in key markets such as Manhattan, Southern California and metropolitan Washington, D.C. Sold 18 communities containing 4,488 apartment homes for $594 million(1) Capital Markets Activities - $1.7 billion Raised $865 million of equity and issued $110 million of operating partnership units(2) Completed two unsecured debt offerings at attractive pricing; a seven-year $300 million issuance at 4.25% in March 2011 and a ten-year $400 million issuance at 4.625% in January 2012 Joint Venture Activities - $1.5 billion Announced a new joint venture with MetLife which comprises twelve operating communities and 2,528 apartment homes in markets such as New York City, Boston, Philadelphia, Austin and Seattle Expanded the joint venture with KFH through the acquisition of two communities containing 509 homes in metropolitan Washington, D.C. Over $6 billion of transactions and capital markets activities As of January 11, 2012. As of September 30, 2011. |
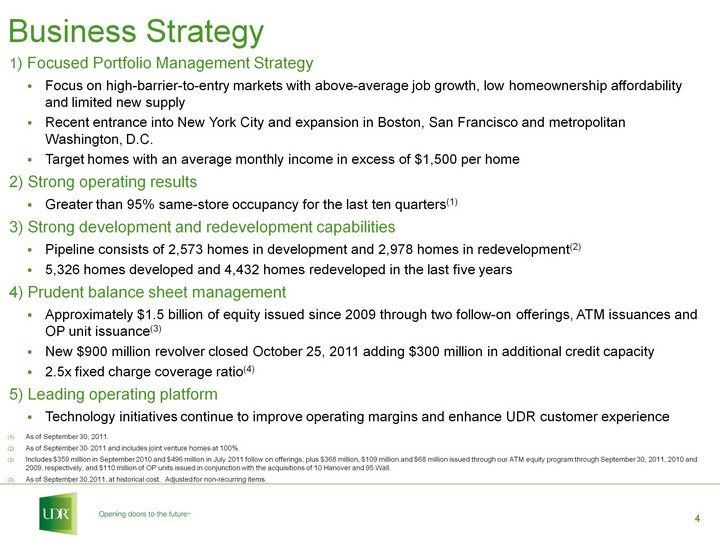
| Business Strategy As of September 30, 2011. As of September 30, 2011 and includes joint venture homes at 100%. Includes $359 million in September 2010 and $496 million in July 2011 follow on offerings; plus $368 million, $109 million and $68 million issued through our ATM equity program through September 30, 2011, 2010 and 2009, respectively, and $110 million of OP units issued in conjunction with the acquisitions of 10 Hanover and 95 Wall. As of September 30,2011, at historical cost. Adjusted for non-recurring items. 1) Focused Portfolio Management Strategy Focus on high-barrier-to-entry markets with above-average job growth, low homeownership affordability and limited new supply Recent entrance into New York City and expansion in Boston, San Francisco and metropolitan Washington, D.C. Target homes with an average monthly income in excess of $1,500 per home 2) Strong operating results Greater than 95% same-store occupancy for the last ten quarters(1) 3) Strong development and redevelopment capabilities Pipeline consists of 2,573 homes in development and 2,978 homes in redevelopment(2) 5,326 homes developed and 4,432 homes redeveloped in the last five years 4) Prudent balance sheet management Approximately $1.5 billion of equity issued since 2009 through two follow-on offerings, ATM issuances and OP unit issuance(3) New $900 million revolver closed October 25, 2011 adding $300 million in additional credit capacity 2.5x fixed charge coverage ratio(4) 5) Leading operating platform Technology initiatives continue to improve operating margins and enhance UDR customer experience |
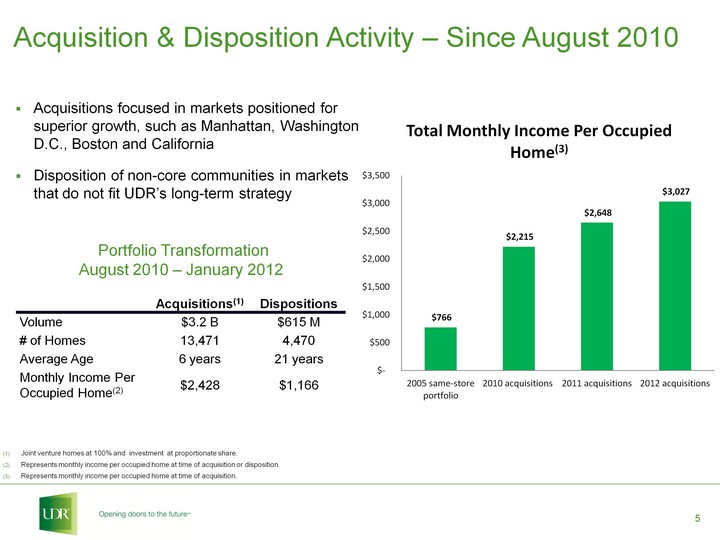
| Acquisitions focused in markets positioned for superior growth, such as Manhattan, Washington D.C., Boston and California Disposition of non-core communities in markets that do not fit UDR's long-term strategy Joint venture homes at 100% and investment at proportionate share. Represents monthly income per occupied home at time of acquisition or disposition. Represents monthly income per occupied home at time of acquisition. Portfolio Transformation August 2010 - January 2012 Acquisitions(1) Dispositions Volume $3.2 B $615 M # of Homes 13,471 4,470 Average Age 6 years 21 years Monthly Income Per Occupied Home(2) $2,428 $1,166 Acquisition & Disposition Activity - Since August 2010 (CHART) |
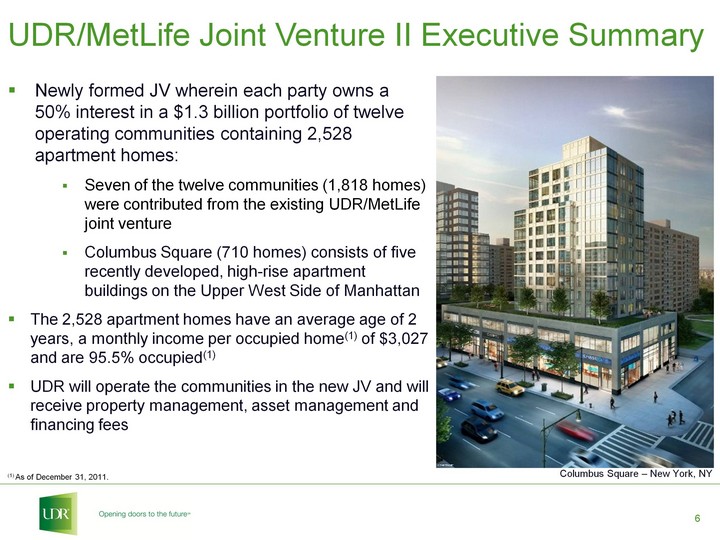
| UDR/MetLife Joint Venture II Executive Summary Newly formed JV wherein each party owns a 50% interest in a $1.3 billion portfolio of twelve operating communities containing 2,528 apartment homes: Seven of the twelve communities (1,818 homes) were contributed from the existing UDR/MetLife joint venture Columbus Square (710 homes) consists of five recently developed, high-rise apartment buildings on the Upper West Side of Manhattan The 2,528 apartment homes have an average age of 2 years, a monthly income per occupied home(1) of $3,027 and are 95.5% occupied(1) UDR will operate the communities in the new JV and will receive property management, asset management and financing fees (1) As of December 31, 2011. Columbus Square - New York, NY |
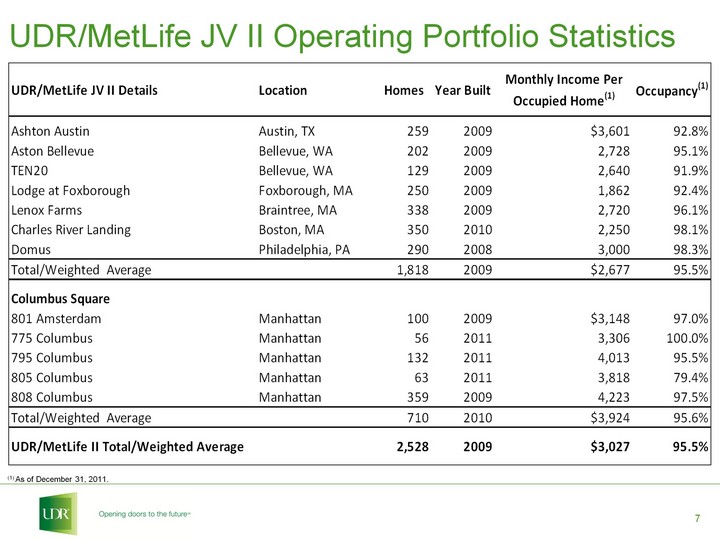
| UDR/MetLife JV II Operating Portfolio Statistics (1) As of December 31, 2011. |
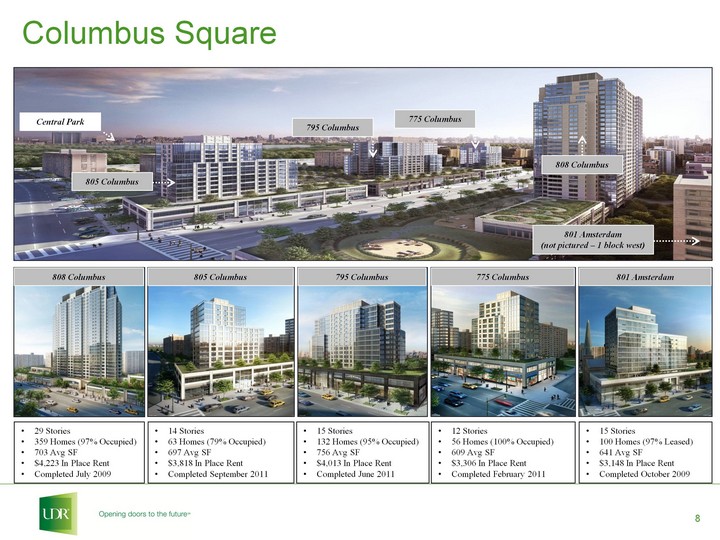
| 808 Columbus 805 Columbus 795 Columbus 775 Columbus 801 Amsterdam (not pictured - 1 block west) 805 Columbus 808 Columbus 795 Columbus 775 Columbus 801 Amsterdam Central Park 14 Stories 63 Homes (79% Occupied) 697 Avg SF $3,818 In Place Rent Completed September 2011 29 Stories 359 Homes (97% Occupied) 703 Avg SF $4,223 In Place Rent Completed July 2009 15 Stories 132 Homes (95% Occupied) 756 Avg SF $4,013 In Place Rent Completed June 2011 12 Stories 56 Homes (100% Occupied) 609 Avg SF $3,306 In Place Rent Completed February 2011 15 Stories 100 Homes (97% Leased) 641 Avg SF $3,148 In Place Rent Completed October 2009 Columbus Square |
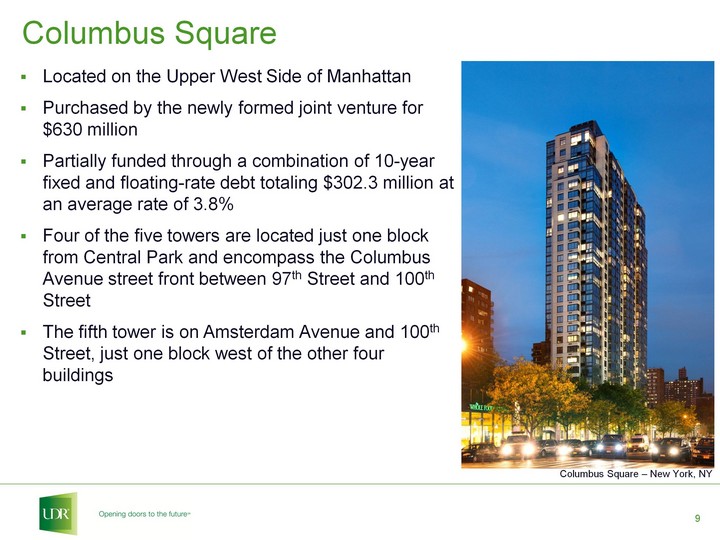
| Located on the Upper West Side of Manhattan Purchased by the newly formed joint venture for $630 million Partially funded through a combination of 10-year fixed and floating-rate debt totaling $302.3 million at an average rate of 3.8% Four of the five towers are located just one block from Central Park and encompass the Columbus Avenue street front between 97th Street and 100th Street The fifth tower is on Amsterdam Avenue and 100th Street, just one block west of the other four buildings Columbus Square - New York, NY Columbus Square |
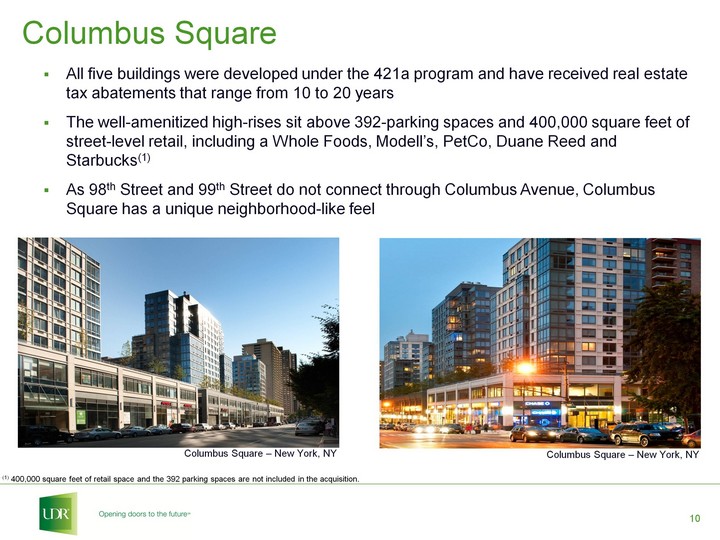
| Columbus Square All five buildings were developed under the 421a program and have received real estate tax abatements that range from 10 to 20 years The well-amenitized high-rises sit above 392-parking spaces and 400,000 square feet of street-level retail, including a Whole Foods, Modell's, PetCo, Duane Reed and Starbucks(1) As 98th Street and 99th Street do not connect through Columbus Avenue, Columbus Square has a unique neighborhood-like feel Columbus Square - New York, NY Columbus Square - New York, NY (1) 400,000 square feet of retail space and the 392 parking spaces are not included in the acquisition. |
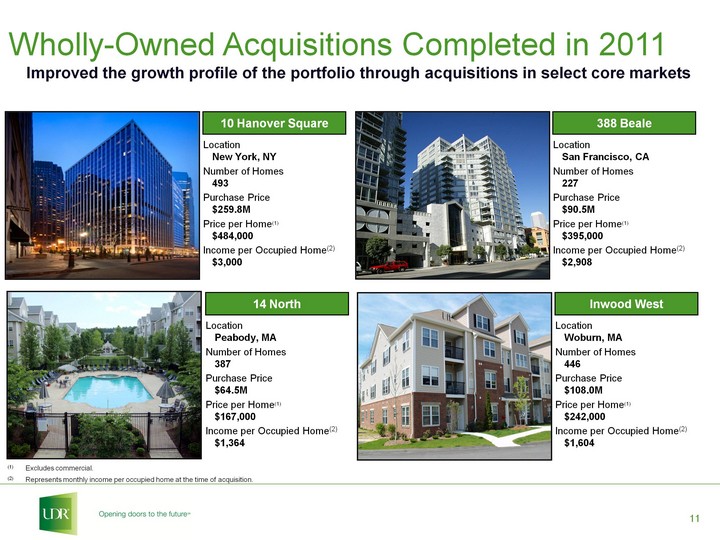
| Wholly-Owned Acquisitions Completed in 2011 Improved the growth profile of the portfolio through acquisitions in select core markets (1) Excludes commercial. (2) Represents monthly income per occupied home at the time of acquisition. 10 Hanover Square Location New York, NY Number of Homes 493 Purchase Price $259.8M Price per Home(1) $484,000 Income per Occupied Home(2) $3,000 388 Beale Location San Francisco, CA Number of Homes 227 Purchase Price $90.5M Price per Home(1) $395,000 Income per Occupied Home(2) $2,908 Inwood West Location Woburn, MA Number of Homes 446 Purchase Price $108.0M Price per Home(1) $242,000 Income per Occupied Home(2) $1,604 14 North Location Peabody, MA Number of Homes 387 Purchase Price $64.5M Price per Home(1) $167,000 Income per Occupied Home(2) $1,364 |
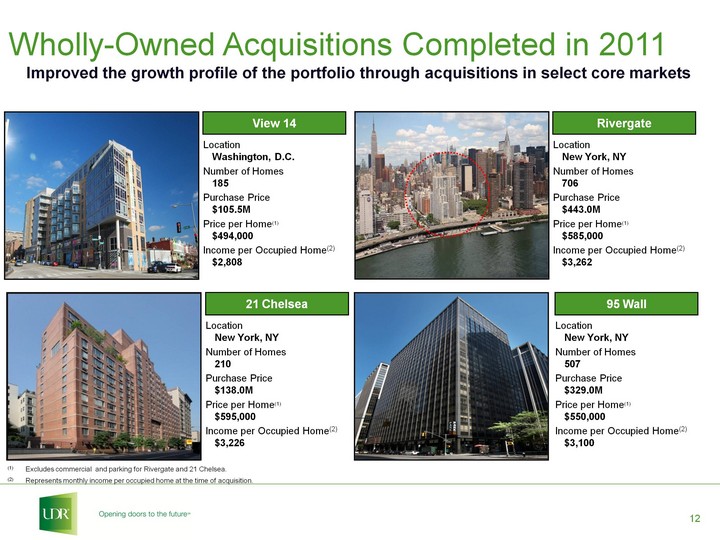
| View 14 Location Washington, D.C. Number of Homes 185 Purchase Price $105.5M Price per Home(1) $494,000 Income per Occupied Home(2) $2,808 Rivergate Location New York, NY Number of Homes 706 Purchase Price $443.0M Price per Home(1) $585,000 Income per Occupied Home(2) $3,262 95 Wall Location New York, NY Number of Homes 507 Purchase Price $329.0M Price per Home(1) $550,000 Income per Occupied Home(2) $3,100 21 Chelsea Location New York, NY Number of Homes 210 Purchase Price $138.0M Price per Home(1) $595,000 Income per Occupied Home(2) $3,226 (1) Excludes commercial and parking for Rivergate and 21 Chelsea. (2) Represents monthly income per occupied home at the time of acquisition. Wholly-Owned Acquisitions Completed in 2011 Improved the growth profile of the portfolio through acquisitions in select core markets |
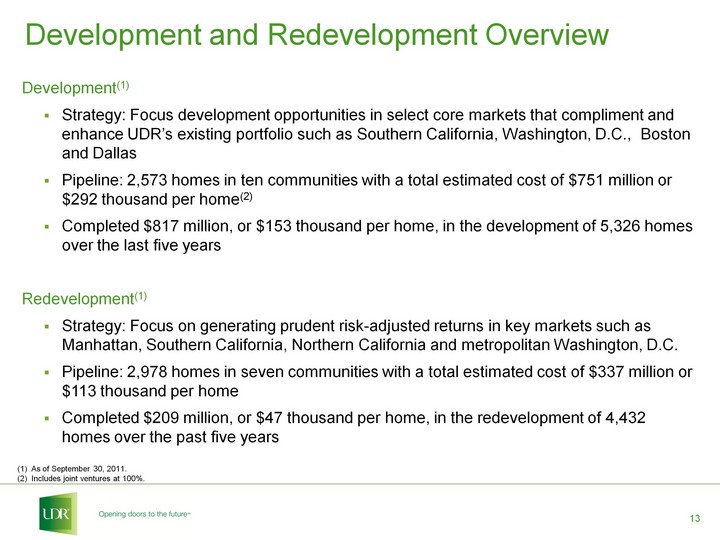
| Development(1) Strategy: Focus development opportunities in select core markets that compliment and enhance UDR's existing portfolio such as Southern California, Washington, D.C., Boston and Dallas Pipeline: 2,573 homes in ten communities with a total estimated cost of $751 million or $292 thousand per home(2) Completed $817 million, or $153 thousand per home, in the development of 5,326 homes over the last five years Redevelopment(1) Strategy: Focus on generating prudent risk-adjusted returns in key markets such as Manhattan, Southern California, Northern California and metropolitan Washington, D.C. Pipeline: 2,978 homes in seven communities with a total estimated cost of $337 million or $113 thousand per home Completed $209 million, or $47 thousand per home, in the redevelopment of 4,432 homes over the past five years As of September 30, 2011. Includes joint ventures at 100%. Development and Redevelopment Overview |
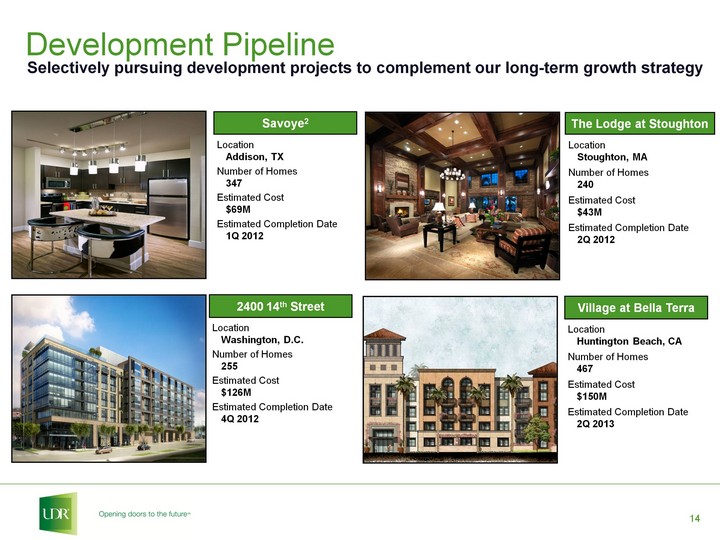
| Development Pipeline Selectively pursuing development projects to complement our long-term growth strategy Savoye2 Location Addison, TX Number of Homes 347 Estimated Cost $69M Estimated Completion Date 1Q 2012 The Lodge at Stoughton Location Stoughton, MA Number of Homes 240 Estimated Cost $43M Estimated Completion Date 2Q 2012 2400 14th Street Location Washington, D.C. Number of Homes 255 Estimated Cost $126M Estimated Completion Date 4Q 2012 Village at Bella Terra Location Huntington Beach, CA Number of Homes 467 Estimated Cost $150M Estimated Completion Date 2Q 2013 |
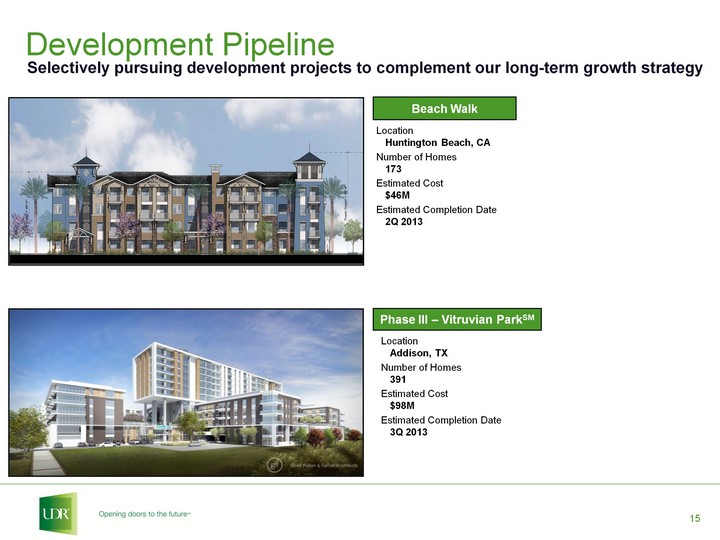
| Development Pipeline Selectively pursuing development projects to complement our long-term growth strategy Phase III - Vitruvian ParkSM Location Addison, TX Number of Homes 391 Estimated Cost $98M Estimated Completion Date 3Q 2013 Beach Walk Location Huntington Beach, CA Number of Homes 173 Estimated Cost $46M Estimated Completion Date 2Q 2013 |
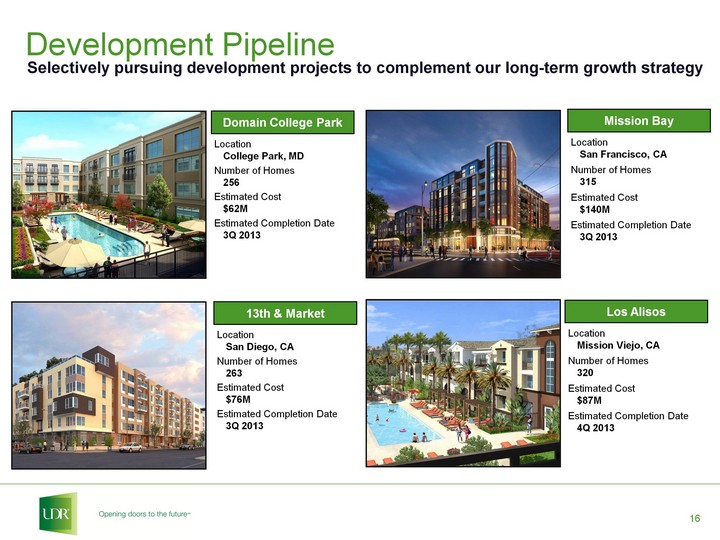
| Development Pipeline Selectively pursuing development projects to complement our long-term growth strategy Mission Bay Location San Francisco, CA Number of Homes 315 Estimated Cost $140M Estimated Completion Date 3Q 2013 Domain College Park Location College Park, MD Number of Homes 256 Estimated Cost $62M Estimated Completion Date 3Q 2013 13th & Market Location San Diego, CA Number of Homes 263 Estimated Cost $76M Estimated Completion Date 3Q 2013 Los Alisos Location Mission Viejo, CA Number of Homes 320 Estimated Cost $87M Estimated Completion Date 4Q 2013 |
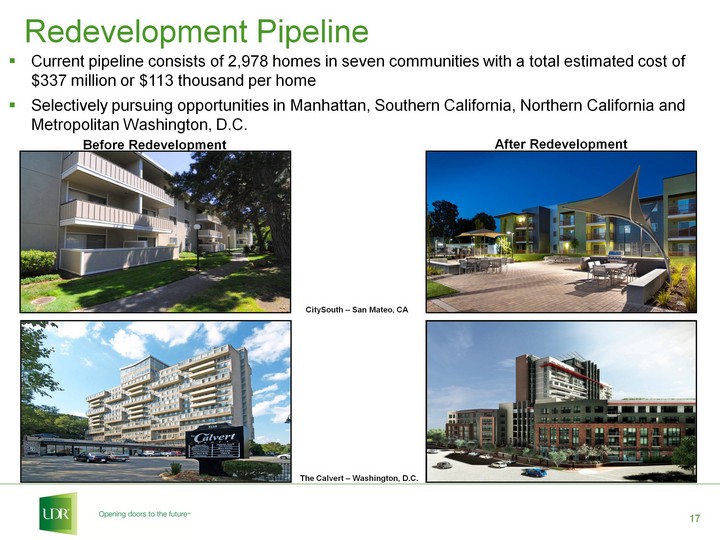
| Redevelopment Pipeline Current pipeline consists of 2,978 homes in seven communities with a total estimated cost of $337 million or $113 thousand per home Selectively pursuing opportunities in Manhattan, Southern California, Northern California and Metropolitan Washington, D.C. Before Redevelopment After Redevelopment CitySouth - San Mateo, CA The Calvert - Washington, D.C. |
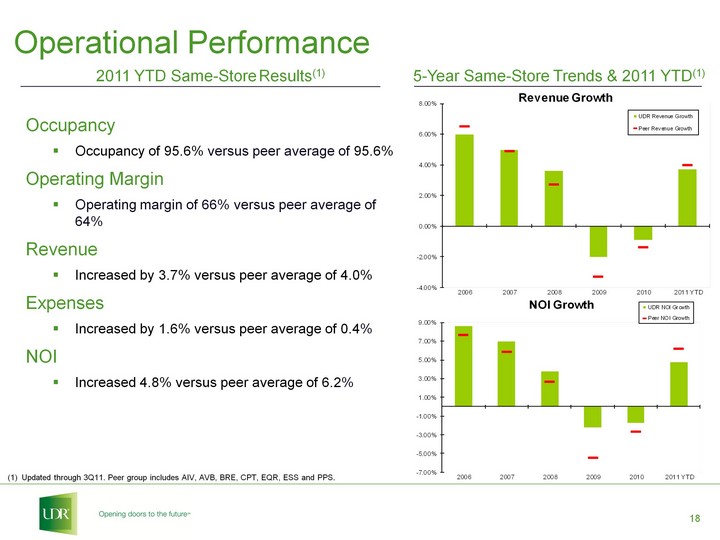
| Operational Performance Occupancy Occupancy of 95.6% versus peer average of 95.6% Operating Margin Operating margin of 66% versus peer average of 64% Revenue Increased by 3.7% versus peer average of 4.0% Expenses Increased by 1.6% versus peer average of 0.4% NOI Increased 4.8% versus peer average of 6.2% 2011 YTD Same-Store Results(1) Updated through 3Q11. Peer group includes AIV, AVB, BRE, CPT, EQR, ESS and PPS. 5-Year Same-Store Trends & 2011 YTD(1) |
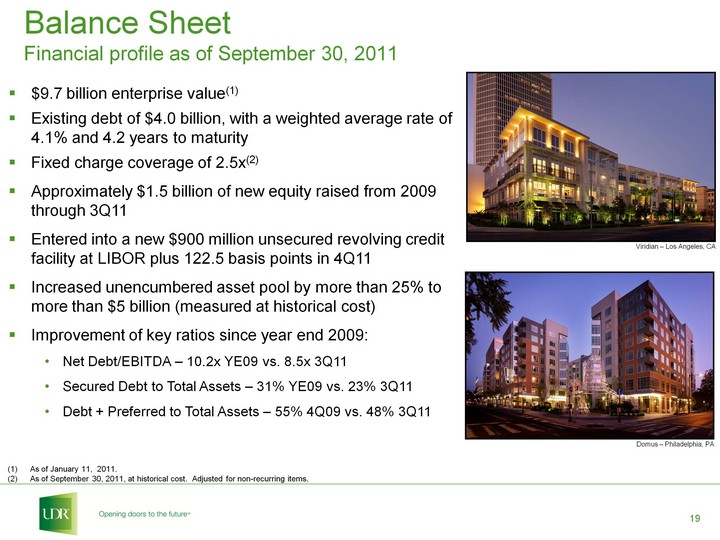
| Balance Sheet Financial profile as of September 30, 2011 Viridian - Los Angeles, CA $9.7 billion enterprise value(1) Existing debt of $4.0 billion, with a weighted average rate of 4.1% and 4.2 years to maturity Fixed charge coverage of 2.5x(2) Approximately $1.5 billion of new equity raised from 2009 through 3Q11 Entered into a new $900 million unsecured revolving credit facility at LIBOR plus 122.5 basis points in 4Q11 Increased unencumbered asset pool by more than 25% to more than $5 billion (measured at historical cost) Improvement of key ratios since year end 2009: Net Debt/EBITDA - 10.2x YE09 vs. 8.5x 3Q11 Secured Debt to Total Assets - 31% YE09 vs. 23% 3Q11 Debt + Preferred to Total Assets - 55% 4Q09 vs. 48% 3Q11 As of January 11, 2011. As of September 30, 2011, at historical cost. Adjusted for non-recurring items. Domus - Philadelphia, PA |
| Forward-Looking Statement Certain statements made in this presentation may constitute "forward-looking statements." Words such as "expects," "intends," "believes," "anticipates," "plans," "likely," "will," "seeks," "estimates" and variations of such words and similar expressions are intended to identify such forward-looking statements. Forward-looking statements, by their nature, involve estimates, projections, goals, forecasts and assumptions and are subject to risks and uncertainties that could cause actual results or outcomes to differ materially from those expressed in a forward-looking statement, due to a number of factors, which include, but are not limited to, unfavorable changes in the apartment market, changing economic conditions, the impact of inflation/deflation on rental rates and property operating expenses, expectations concerning availability of capital and the stabilization of the capital markets, the impact of competition and competitive pricing, acquisitions, developments and redevelopments not achieving anticipated results, delays in completing developments, redevelopments and lease-ups on schedule, expectations on job growth, home affordability and demand/supply ratio for multifamily housing, expectations concerning development and redevelopment activities, expectations on occupancy levels, expectations concerning the Vitruvian ParkSM development, expectations concerning the joint ventures with MetLife, expectations that automation will help grow net operating income, expectations on annualized net operating income and other risk factors discussed in documents filed by the Company with the Securities and Exchange Commission from time to time, including the Company's Annual Report on Form 10-K and the Company's Quarterly Reports on Form 10-Q. Actual results may differ materially from those described in the forward-looking statements. These forward-looking statements and such risks, uncertainties and other factors speak only as of the date of this presentation, and the Company expressly disclaims any obligation or undertaking to update or revise any forward-looking statement contained herein, to reflect any change in the Company's expectations with regard thereto, or any other change in events, conditions or circumstances on which any such statement is based, except to the extent otherwise required under U.S. securities laws. This presentation and these forward-looking statements include UDR's analysis and conclusions based in part on third party data and reflect UDR's judgment as of the date of these materials. UDR assumes no obligation to revise or update to reflect future events or circumstances. |

| ___________________________________________________________________ ___________________________________________________________________ ___________________________________________________________________ ___________________________________________________________________ ___________________________________________________________________ ___________________________________________________________________ ___________________________________________________________________ ___________________________________________________________________ ___________________________________________________________________ ___________________________________________________________________ Notes |

| ___________________________________________________________________ ___________________________________________________________________ ___________________________________________________________________ ___________________________________________________________________ ___________________________________________________________________ ___________________________________________________________________ ___________________________________________________________________ ___________________________________________________________________ ___________________________________________________________________ ___________________________________________________________________ Notes |

| ___________________________________________________________________ ___________________________________________________________________ ___________________________________________________________________ ___________________________________________________________________ ___________________________________________________________________ ___________________________________________________________________ ___________________________________________________________________ ___________________________________________________________________ ___________________________________________________________________ ___________________________________________________________________ Notes |
| Investor Relations Contact: Chris Van Ens cvanens@udr.com 720.348.7762 |