Attached files
| file | filename |
|---|---|
| EX-23.1 - EX-23.1 - Cinco Resources, Inc. | a2206833zex-23_1.htm |
| EX-99.3 - EX-99.3 - Cinco Resources, Inc. | a2206833zex-99_3.htm |
| EX-99.1 - EX-99.1 - Cinco Resources, Inc. | a2206833zex-99_1.htm |
| EX-23.2 - EX-23.2 - Cinco Resources, Inc. | a2206833zex-23_2.htm |
| EX-99.2 - EX-99.2 - Cinco Resources, Inc. | a2206833zex-99_2.htm |
As filed with the Securities and Exchange Commission on January 12, 2012
Registration No. 333-
UNITED STATES
SECURITIES AND EXCHANGE COMMISSION
Washington, D.C. 20549
Form S-1
REGISTRATION STATEMENT
UNDER
THE SECURITIES ACT OF 1933
Cinco Resources, Inc.
(Exact name of registrant as specified in its charter)
| Delaware (State or other jurisdiction of incorporation or organization) |
1311 (Primary Standard Industrial Classification Code Number) |
90-0522580 (I.R.S. Employer Identification No.) |
2626 Howell Street, Suite 800
Dallas, Texas 75204
(214) 520-7727
(Address, including zip code, and telephone number, including area code, of registrant's principal executive offices)
Jon L. Glass
President and Chief Executive Officer
Cinco Resources, Inc.
2626 Howell Street, Suite 800
Dallas, Texas 75204
(214) 520-7727
(Name, address, including zip code, and telephone number, including area code, of agent for service)
| Copies to: | ||
Joe Dannenmaier Thompson & Knight LLP 1722 Routh Street, Suite 1500 Dallas, Texas 75201 (214) 969-1700 |
Christine A. Hathaway Alan P. Baden Vinson & Elkins L.L.P. 2001 Ross Avenue, 37th Floor Dallas, Texas 75201 (214) 220-7700 |
|
Approximate date of commencement of proposed sale to the public: As soon as practicable after the effective date of this registration statement.
If any of the securities being registered on this Form are to be offered on a delayed or continuous basis pursuant to Rule 415 under the Securities Act of 1933 check the following box: o
If this Form is filed to register additional securities for an offering pursuant to Rule 462(b) under the Securities Act, please check the following box and list the Securities Act registration statement number of the earlier effective registration statement for the same offering. o
If this Form is a post-effective amendment filed pursuant to Rule 462(c) under the Securities Act, check the following box and list the Securities Act registration statement number of the earlier effective registration statement for the same offering. o
If this Form is a post-effective amendment filed pursuant to Rule 462(d) under the Securities Act, check the following box and list the Securities Act registration statement number of the earlier effective registration statement for the same offering. o
Indicate by check mark whether the registrant is a large accelerated filer, an accelerated filer, a non-accelerated filer, or a smaller reporting company. See the definitions of "large accelerated filer," "accelerated filer" and "smaller reporting company" in Rule 12b-2 of the Exchange Act. (Check one):
| Large accelerated filer o | Accelerated filer o | Non-accelerated filer ý (Do not check if a smaller reporting company) |
Smaller reporting company o |
CALCULATION OF REGISTRATION FEE
|
||||
| Title of Each Class of Securities to be Registered |
Proposed Maximum Aggregate Offering Price(1)(2) |
Amount of Registration Fee |
||
|---|---|---|---|---|
Common stock, par value $0.10 per share |
$172,500,000 | $19,768.50 | ||
|
||||
- (1)
- Estimated
solely for the purpose of calculating the registration fee pursuant to Rule 457(o) under the Securities Act of 1933, as amended.
- (2)
- Includes amounts attributable to shares of common stock which may be issued upon exercise of a 30-day option granted to the underwriters to cover over-allotments.
The registrant hereby amends this registration statement on such date or dates as may be necessary to delay its effective date until the registrant shall file a further amendment which specifically states that this registration statement shall thereafter become effective in accordance with Section 8(a) of the Securities Act of 1933 or until the registration statement shall become effective on such date as the Commission acting pursuant to said Section 8(a), may determine.
The information in this preliminary prospectus is not complete and may be changed. We may not sell these securities until the registration statement filed with the Securities and Exchange Commission is effective. This preliminary prospectus is not an offer to sell these securities and it is not soliciting an offer to buy these securities in any jurisdiction where the offer or sale is not permitted.
SUBJECT TO COMPLETION, DATED JANUARY 12, 2012
PRELIMINARY PROSPECTUS

Shares
Cinco Resources, Inc.
Common Stock
$ per share
This is the initial public offering of our common stock. We are selling shares of our common stock. We currently expect the initial public offering price to be between $ and $ per share of common stock.
We have granted the underwriters an option to purchase up to additional shares of common stock to cover over-allotments.
We have applied to have the common stock listed on the NASDAQ National Market under the symbol "CINC."
Investing in our common stock involves risks. See "Risk Factors" beginning on page 15.
Neither the Securities and Exchange Commission nor any state securities commission has approved or disapproved of these securities or determined if this prospectus is truthful or complete. Any representation to the contrary is a criminal offense.
| |
Per Share | Total | ||
|---|---|---|---|---|
| Public Offering Price | $ | $ | ||
| Underwriting Discount | $ | $ | ||
| Proceeds to Cinco Resources, Inc. (before expenses) | $ | $ |
The underwriters expect to deliver the shares to purchasers on or about , 2012 through the book-entry facilities of The Depository Trust Company.
Joint Book-Running Managers
| Citigroup | Wells Fargo Securities |
, 2012
We are responsible for the information contained in this prospectus and in any free-writing prospectus we prepare or authorize. We have not authorized anyone to provide you with different information, and we take no responsibility for any other information others may give you. We are not, and the underwriters are not, making an offer to sell these securities in any jurisdiction where the offer or sale is not permitted. You should not assume that the information contained in this prospectus is accurate as of any date other than its date.
TABLE OF CONTENTS
INDUSTRY AND MARKET DATA
The market data and certain other statistical information used throughout this prospectus are based on independent industry publications, government publications or other published independent sources. Although we believe these third-party sources are reliable and that the information is accurate and complete, we have not independently verified the information. Some data is also based on our good faith estimates.
i
This summary provides a brief overview of information contained elsewhere in this prospectus. Because it is abbreviated, this summary does not contain all of the information that you should consider before investing in our common stock. You should read this entire prospectus carefully before making an investment decision, including the information presented under the headings "Risk Factors," "Cautionary Note Regarding Forward-Looking Statements" and "Management's Discussion and Analysis of Financial Condition and Results of Operations" and the historical consolidated financial statements and related notes thereto included elsewhere in this prospectus. We have provided definitions for certain oil and natural gas terms used in this prospectus in the "Glossary of Industry Terms" beginning on page A-1 of this prospectus.
In this prospectus, unless the context otherwise requires, the terms "Cinco," "we," "us," "our" and the "company" refer to Cinco Resources, Inc. and its subsidiaries and the term "Yorktown" collectively refers to Yorktown Partners LLC and/or certain investment funds sponsored and managed by Yorktown Partners LLC.
Overview
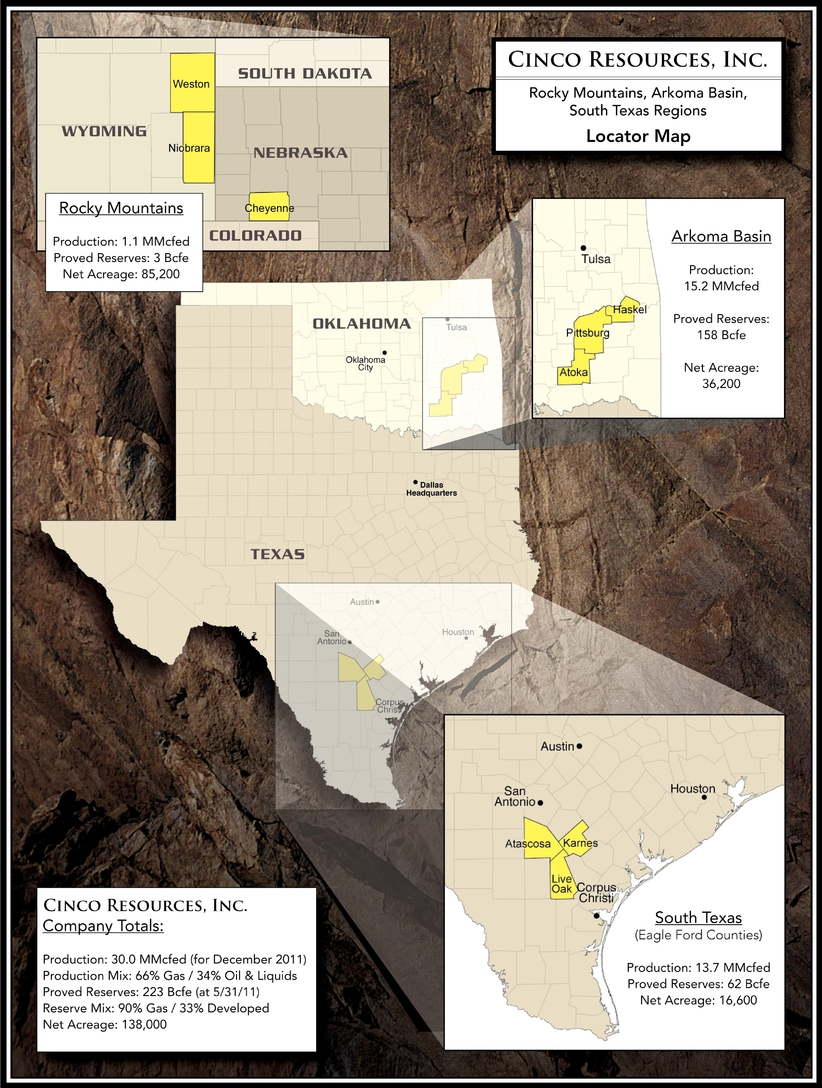
We are an independent exploration and production company focused on the acquisition and development of unconventional oil and natural gas resources. Our assets are located primarily in three core areas: the Eagle Ford Shale in South Texas, the Powder River Basin of Wyoming and the Woodford Shale in the Arkoma Basin of eastern Oklahoma. Our management and senior technical team have significant operational experience in these basins, as well as in the geological zones we target for development. We have accumulated a balanced portfolio of assets comprised of more mature, gas-prone Woodford Shale assets and less-developed, oil-prone properties in the Eagle Ford Shale and Powder River Basin. The majority of our Woodford Shale assets are held by production. We intend to focus most of our near-term activities on the development of our Eagle Ford Shale assets, as well as further evaluation of our Powder River Basin properties.
We have accumulated approximately 138,000 net acres across our operational footprint, approximately 66% of which are undeveloped. Our property base consists of 935 gross (368.5 net) identified drilling locations. Given the early stage in our evaluation of the play, so far, we have identified 24 gross (23.9 net) drilling locations on our Powder River Basin acreage. Netherland, Sewell & Associates, Inc., our independent reserve engineers, estimated our proved reserves as of May 31, 2011 to be 222.5 Bcfe, of which approximately 90% were natural gas and 33% were classified as proved developed reserves. For December 2011, our average net daily production was 30.0 MMcfed, approximately 66% of which was natural gas. We exercise a high degree of operational control over our assets. We operated approximately 89% of our estimated proved reserves on a volume basis as of May 31, 2011 and approximately 90% of our average daily net production for December 2011.
The majority of our Eagle Ford Shale acreage was acquired from March 2007 to June 2010 and is located in southeastern Atascosa, Karnes, Live Oak and Zavala counties in South Texas. We have over 12,900 net acres in what we believe to be a largely oil-prone portion of the play. The Eagle Ford Shale is one of the most active resource plays in the United States, with a rig count of over 200 in November 2011. We drilled and completed 12 gross (10.8 net) wells on our Eagle Ford Shale acreage through December 2011, and we plan to devote a significant portion of our drilling capital to this play in the near term. For the month of December 2011, net production from our Eagle Ford Shale wells averaged 10.5 MMcfed, consisting of 81% oil, 8% natural gas liquids and 11% natural gas.
Since acquiring our first acreage in the Powder River Basin in April 2011, we have established a position of over 64,000 net acres in Niobrara and Weston counties in Wyoming. The Powder River Basin is one of the key oil and natural gas-producing basins located in the Rocky Mountain states of
1
Wyoming and Montana. Much of the recent industry focus in this area has been centered around the oil-prone Niobrara Shale. We believe our acreage offers multiple stacked horizons prospective for oil that include the Niobrara Shale as well as the Turner Sandstone, Mowry Shale and Muddy Sandstone. We believe the basin's geological characteristics and historical vertical well data support the development of our acreage as an economic oil resource play. Throughout the Powder River Basin, and specifically to the north and west of our acreage, significant drilling activity is currently being conducted by industry participants like Chesapeake Energy, EOG Resources and El Paso Corp. We are currently evaluating our Powder River Basin acreage position and developing a drilling plan.
We acquired our initial Woodford Shale assets in March 2009 and have over 26,600 net acres in Atoka, Pittsburg and Haskell counties in Oklahoma. The Woodford Shale is one of the more mature and prolific shale gas plays in the United States, with over 1,000 horizontal wells drilled in the Arkoma Basin Woodford Shale since the first horizontal well was drilled in this play in 2005. A substantial portion of our acreage is positioned within one of the more actively drilled parts of the play, allowing us to utilize significant data from nearby analogous wells as well as our own development expertise to better determine well potential. We believe our acreage represents a high-quality natural gas component for our portfolio due to its low-risk development profile, scale and largely held-by-production status.
The following table provides our summary operating data:
| |
|
Identified Drilling Locations(1)(2) |
Producing Wells(1) |
Estimated Proved Reserves as of May 31, 2011 |
December 2011 Average Daily Net Production |
|||||||||||||||||||||||||||||
|---|---|---|---|---|---|---|---|---|---|---|---|---|---|---|---|---|---|---|---|---|---|---|---|---|---|---|---|---|---|---|---|---|---|---|
| |
Net Acreage(1) |
|||||||||||||||||||||||||||||||||
| |
Gross | Net | PUDs(3) | Gross | Net | Bcfe | %Gas | %Developed | MMcfed | %Gas | ||||||||||||||||||||||||
South Texas: |
||||||||||||||||||||||||||||||||||
Eagle Ford Shale |
12,983 | 94 | 83.3 | 8 | 12 | 10.8 | 16 | 34 | % | 35 | % | 10.5 | 11 | % | ||||||||||||||||||||
Other |
3,607 | 37 | 21.8 | 19 | 44 | 16.5 | 46 | 74 | 38 | 3.2 | 81 | |||||||||||||||||||||||
Area |
16,590 | 131 | 105.1 | 27 | 56 | 27.3 | 62 | 64 | 37 | 13.7 | 27 | |||||||||||||||||||||||
Rocky Mountains: |
||||||||||||||||||||||||||||||||||
Powder River Basin(4) |
64,043 | 24 | 23.9 | — | 6 | 5.9 | — | — | — | 0.2 | 54 | |||||||||||||||||||||||
DJ Basin |
21,201 | — | — | — | 78 | 70.3 | 3 | 100 | 100 | 0.9 | 100 | |||||||||||||||||||||||
Area |
85,244 | 24 | 23.9 | — | 84 | 76.2 | 3 | 100 | 100 | 1.1 | 89 | |||||||||||||||||||||||
Arkoma Basin: |
||||||||||||||||||||||||||||||||||
Woodford Shale(5)(6) |
26,611 | 780 | 239.5 | 51 | 216 | 40.1 | 151 | 100 | 29 | 15.2 | 100 | |||||||||||||||||||||||
Other |
9,549 | — | — | — | 3 | 0.0 | 7 | 100 | 55 | — | — | |||||||||||||||||||||||
Area |
36,160 | 780 | 239.5 | 51 | 219 | 40.1 | 158 | 100 | 30 | 15.2 | 100 | |||||||||||||||||||||||
Total |
137,994 | 935 | 368.5 | 78 | 359 | 143.6 | 223 | 90 | % | 33 | % | 30.0 | 66 | % | ||||||||||||||||||||
- (1)
- As
of December 31, 2011.
- (2)
- See
"Business—Overview" for more information regarding the processes and criteria through which these drilling locations were identified.
- (3)
- Represents
the number of gross identified potential drilling locations to which proved undeveloped reserves were attributable, based on our May 31,
2011 reserve report.
- (4)
- Given
the early stage in our evaluation of the play, so far, we have identified 24 gross (23.9 net) drilling locations on our Powder River Basin acreage.
- (5)
- Gross and net identified drilling locations in the Woodford Shale are primarily based on 80-acre spacing.
2
- (6)
- Includes Woodford Shale wells, all up-hole zones in Woodford Shale wells and Hunton wells with Woodford Shale offset locations.
Our capital expenditure budget is primarily focused on developing our Eagle Ford Shale acreage through the use of horizontal drilling and multi-stage fracture stimulation techniques, as well as further evaluating our Powder River Basin acreage. We will also continue to seek acreage in our three core areas. Through September 30, 2011, we had spent or committed to spend approximately $99.6 million of our 2011 capital expenditure budget of $155.0 million. The following table details our anticipated capital expenditure budget by region for the year ending December 31, 2012:
| |
Number of Wells | |
||||||||
|---|---|---|---|---|---|---|---|---|---|---|
| |
Capital Expenditures |
|||||||||
| |
Gross | Net | ||||||||
| |
|
|
($ in millions) |
|||||||
Drilling |
||||||||||
Eagle Ford Shale |
11 | 11.0 | $ | 108.6 | ||||||
Powder River Basin |
3 | 3.0 | 21.6 | |||||||
Woodford Shale |
20 | 3.9 | 20.4 | |||||||
Other Areas(1) |
— | — | 2.8 | |||||||
Sub-total |
34 | 17.9 | 153.4 | |||||||
Leasehold, Seismic and Other(2) |
— | — | 18.6 | |||||||
Total |
34 | 17.9 | $ | 172.0 | ||||||
- (1)
- Includes
workovers on South Texas non-Eagle Ford Shale properties.
- (2)
- Includes a $13.5 million payment due in 2012 with respect to our acquisition of Powder River Basin acreage in November 2011.
The actual amount of capital we spend in 2012 may fluctuate materially based on market conditions and the success of our drilling results as the year progresses. Please see "Management's Discussion and Analysis of Financial Condition and Results of Operations—Liquidity and Capital Resources."
Our History
We were founded in 2002 by Jon L. Glass, our President and Chief Executive Officer, and Yorktown, a New York-based private investment firm founded in 1991 and focused on making investments in energy and energy-related companies. Originally, our strategy was to grow through acreage acquisitions, with a geographical focus in South Texas, initially developing our drilling prospects and then selling an operated interest to industry participants to fund further expansion. Over time, our strategy evolved to focus primarily on having operational control of our key assets, with our core focus areas expanding to other basins and geological zones where we have particular expertise. We have grown through both leasing efforts and acquisitions. The following are some of the key acquisitions that we have completed to assemble our current asset base:
- •
- In November 2011, we acquired approximately 20,000 net acres in the Powder River Basin from a private oil company. This
acreage is located in close proximity to our existing Powder River Basin acreage, giving us a total of approximately 64,000 net acres.
- •
- In November 2011, we acquired Cima Resources, Inc. ("Cima"), an Eagle Ford Shale-focused company that was managed by our executive officers and primarily owned and controlled by Yorktown. This acquisition provided the majority of our current Eagle Ford Shale asset base and a majority of our Powder River Basin properties. Most of Cima's acreage was acquired through
3
- •
- In 2009, we acquired a private Arkoma Basin company that was primarily owned and controlled by Yorktown, providing the
majority of our current Arkoma Basin asset base.
- •
- In 2007, we acquired a South Texas producer primarily owned and controlled by Yorktown and whose primary asset was the Hostetter Field in southeastern McMullen County, Texas.
the leasing or purchase of undeveloped acreage with the strategy to grow production and reserves organically.
Our Strategies
Our primary objective is to increase stockholder value by growing estimated proved reserves, production and cash flow at attractive rates of return on invested capital. We intend to achieve this objective by pursuing the following strategies:
Continue Development of Our Eagle Ford Shale Assets; Accelerate Evaluation of Powder River Basin Properties
We intend to allocate over 84% of our 2012 drilling capital expenditure budget to drilling on our Eagle Ford Shale and Powder River Basin assets. We are actively developing our Eagle Ford Shale acreage and plan to drill 11 gross (11.0 net) wells in 2012. We intend to accelerate the evaluation of our Powder River Basin properties in 2012. This evaluation includes completing vertical wellbores, drilling and completing horizontal wells, analysis of core data, existing 3-D seismic data, production data and well data and continued review of industry activity in the area.
Balance Commodity Mix Through Growth in Oil Production
We believe our development efforts in the Eagle Ford Shale and Powder River Basin will better balance our commodity mix. While our current estimated proved reserves and production are predominantly natural gas from the Woodford Shale, the majority of our project inventory that we plan to develop through 2012 is oil-prone. As we develop this portion of our asset base, we believe our production profile will reflect a more oil-oriented commodity mix that capitalizes on the current commodity price environment. With over 64% of our Woodford Shale acreage held by production, we have the option to expand our natural gas development efforts as the commodity price environment supports such activity.
Enhance Returns Through Operational Efficiencies
Our management team is focused on continually improving efficiencies in developing and operating our asset base. We seek to manage drilling and completion costs to decrease the amount of initial capital invested in our wells, and we are building centralized infrastructure that can be repeatedly used for future development. Specifically, we have invested time and capital in planning and installing production infrastructure, such as central gas treating, oil and water storage and gas compression facilities that can service our future development needs with minimal additional capital investment. We also believe the concentration of our acreage position, the significant percentage of acreage that is already held by production and our high degree of operational control will allow us to realize cost efficiencies with future development.
Pursue Strategic Acquisitions within Our Core Areas
In the near term, we intend to continue to identify, evaluate and acquire additional acreage in our core areas. We intend to focus on acquiring undeveloped acreage with minimal existing production or producing acreage with significant undeveloped potential. While we do not currently have any plans to
4
expand beyond our core areas, we may evaluate other basins that we believe have the potential for attractive returns.
Maintain Financial Discipline and Actively Manage Commodity Price Risk
We seek a capital structure with sufficient liquidity to execute our growth plans while maintaining conservative leverage, providing financial and operational flexibility. We manage commodity price risk through the use of derivatives that we continually evaluate. We intend to use a portion of the net proceeds from this offering to repay all of our outstanding indebtedness under our credit facilities.
Our Strengths
The following are our key competitive strengths that we believe will allow us to effectively execute our business strategies.
Substantial Acreage Positions in Key Unconventional Plays
We currently have a total of approximately 138,000 net acres in our three core operating areas. The majority of this acreage is in or near areas of considerable activity by both major and independent operators. We believe that a substantial portion of our acreage in the Eagle Ford Shale and Powder River Basin is oil-prone. We believe our Woodford Shale acreage represents a highly predictable and well-defined asset with significant value which we have continued to enhance through cost reduction and reserve and production enhancement initiatives. We hold the majority of our Woodford Shale acreage by production. We believe our lease terms in our other core areas will allow us to hold our other acreage within term based on our current drilling plans.
Powder River Basin Resource Potential
We currently have approximately 64,000 net acres in the Powder River Basin. We believe this acreage offers significant oil resource potential in a series of stacked horizons including the Niobrara Shale, Turner Sandstone, Mowry Shale and Muddy Sandstone. We believe the basin's geological characteristics and historic vertical well production data may support development as an economic oil resource play. We are continuing our geological analysis. Our operational program for 2012 contemplates fracture stimulating two existing vertical wells, re-entering and re-completing two existing short, horizontal wells and drilling three new additional horizontal wells.
Substantial Drilling Inventory
We have an inventory of 935 gross (368.5 net) identified drilling locations. In 2012 we plan to drill 34 gross (17.9 net) wells, leaving us a substantial drilling inventory for future years. Of our oil-prone assets, we have approximately 94 gross (83.3 net) identified drilling locations in the Eagle Ford Shale and 24 gross (23.9 net) locations currently identified in our Powder River Basin acreage. We expect to identify additional Powder River Basin drilling locations as we further evaluate this acreage. We also have a substantial natural gas drilling location inventory with approximately 780 gross (239.5 net) identified drilling locations in the Woodford Shale, as well as approximately 37 gross (21.8 net) identified locations on our other properties in South Texas.
High Degree of Operational Control
We operate over 92% of our net acreage and 86% of our identified drilling locations. Additionally, we operated approximately 89% of our estimated proved reserves on a volume basis as of May 31, 2011 and approximately 90% of our average daily net production for December 2011. We believe that our high level of operational control will enable us to develop our resource base in an efficient and
5
cost-effective manner. Additionally, our operated positions enable us to better manage the pace of development and align our capital spending with our capital resources.
Proximity to Significant Industry Infrastructure and Access to Multiple Product Markets
Our core areas have substantial existing hydrocarbon transportation, processing and refining capacity, as well as access to multiple product sales points. We believe that our access to this infrastructure will allow us to get production on line more rapidly and achieve competitive product pricing when compared to other more remote producing basins.
Experienced, Incentivized Management and Employee Base
Our senior management team has significant experience in the oil and gas industry and has spent a substantial amount of their careers focused on our core areas. Our senior technical team is comprised of geoscience, engineering and operational professionals who average 28 years of industry experience and have worked extensively in multiple North American resource plays. Additionally, our management and employees will have a significant common stock ownership interest following the completion of this offering, which we believe will better align the interest of management, employees and stockholders.
Recent Developments
Eagle Ford Shale Drilling Activity. As of December 31, 2011, we had drilled, completed and placed on production 12 gross (10.8 net) Eagle Ford Shale wells. For the month of December 2011, net production from these wells averaged 10.5 MMcfed, consisting of approximately 81% oil, 8% natural gas liquids and 11% natural gas. As of December 31, 2011, we also had completed drilling our 13th and 14th wells in the Eagle Ford Shale. These wells are located on our Simmons project area in south central Atascosa County, Texas and we expect to complete them in February 2012. We have a 100% working interest in these wells.
Acquisition of Cima. In November 2011, we acquired Cima. Prior to the acquisition, Cima was managed by our executive officers and was primarily owned and controlled by Yorktown. As consideration for the Cima common stock we acquired, we issued 1,323,960 shares of our common stock to the former stockholders of Cima and 122,586 restricted shares of our common stock to our employees who held Cima restricted shares under Cima's stock incentive plan. As a result of this transaction, Cima became one of our wholly-owned subsidiaries. Our Eagle Ford Shale properties and the majority of our Powder River Basin properties were acquired as a result of the Cima acquisition.
Cinco Preferred Stock Conversion. In November 2011, Yorktown converted 525,000 shares of our Series A Convertible Preferred Stock into 875,000 shares of our common stock. This conversion took place immediately prior to our acquisition of Cima.
Yorktown Investment. In November 2011, Yorktown purchased an additional 250,000 shares of our common stock for $30.0 million. We used this additional capital to fund the initial $13.5 million purchase price payment on our November 2011 acquisition of Powder River Basin acreage and to support our ongoing drilling program.
Acquisition of Additional Powder River Basin Acreage. In November 2011, we purchased additional Powder River Basin assets, consisting of approximately 20,000 net acres in close proximity to our existing acreage, six gross (5.9 net) vertical wells with gross production of approximately 30 Bopd and 200 Mcfd, a 15-mile long two to eight-inch diameter gas pipeline and 16 square miles of proprietary 3-D seismic data. The purchase price of approximately $27.0 million was structured as two payments, with the first installment of approximately $13.5 million paid at closing and the second payment of approximately $13.5 million to be paid in November 2012.
6
Amendments to Credit Facilities. In December 2011, we amended our senior secured revolving credit facility and our second lien term loan facility. As amended, our $300.0 million senior secured revolving credit facility has an initial borrowing base of $85.0 million, a maturity date of January 4, 2016, and financial covenants substantially similar to our previous credit facility. We intend to use a portion of the proceeds from this offering to repay all amounts under our senior secured revolving credit facility and to repay all amounts under and retire our second lien term loan facility.
Risk Factors
Investing in our common stock involves a high degree of risk. You should consider and read carefully all of the risks and uncertainties described in "Risk Factors" beginning on page 15, together with all of the other information contained in this prospectus, including our consolidated financial statements and related notes thereto included elsewhere in this prospectus before deciding to invest in our common stock.
Ownership Structure
The following diagram depicts our ownership structure after giving effect to this offering. For more information on the ownership of our common stock by our principal stockholders, see "Principal Stockholders."
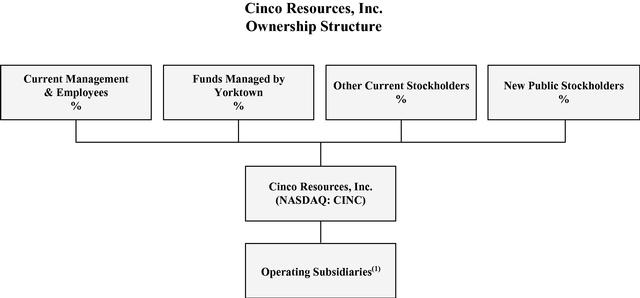
- (1)
- All subsidiaries are wholly-owned.
Corporate Information
Our principal executive offices are located at 2626 Howell Street, Suite 800, Dallas, Texas 75204, and our telephone number at that address is (214) 520-7727.
7
| Common stock offered by Cinco Resources, Inc. | shares | |
Common stock to be outstanding after this offering |
shares |
|
Over-allotment option |
We have granted the underwriters an option, exercisable upon notice to us, to purchase up to additional shares of common stock at the offering price to cover over-allotments, if any, for a period of 30 days from the date of this prospectus. |
|
Use of proceeds |
We will receive approximately $ million of net proceeds from the sale of the common stock by us in this offering, based upon the assumed initial public offering price of $ per share and after deducting underwriting discounts and estimated offering expenses. We intend to use a portion of the net proceeds from this offering to repay all outstanding indebtedness under our senior secured revolving credit facility, approximately $60.0 million of which was outstanding on December 31, 2011, and to repay all $30.0 million of outstanding indebtedness under and retire our second lien term loan facility. All of this indebtedness may be pre-paid without penalty. The remaining net proceeds of approximately $ million will be used to fund our drilling program and for general corporate purposes. |
|
Dividend policy |
We do not anticipate declaring or paying any cash dividends on our common stock. In addition, our senior secured revolving credit facility prohibits us from paying cash dividends on our common stock. See "Dividend Policy." |
|
Risk factors |
You should carefully read and consider the information beginning on page 15 of this prospectus set forth under the heading "Risk Factors" and all other information set forth in this prospectus before deciding to invest in our common stock. |
|
Conflicts of Interest |
Affiliates of each of Citigroup Global Markets Inc. and Wells Fargo Securities, LLC, two of the underwriters in this offering, will receive in excess of 5% of the net proceeds of this offering in connection with our repayment of amounts outstanding under our senior secured revolving credit facility and second lien term loan facility. See "Use of Proceeds." Accordingly, this offering is being made in compliance with Financial Industry Regulatory Authority ("FINRA") Rule 5121. FINRA Rule 5121 requires that a "qualified independent underwriter" participate in the preparation of this prospectus and the registration statement of which this prospectus is a part and exercise the usual standards of due diligence with respect thereto. has assumed the responsibilities of acting as the qualified independent underwriter in this offering. For more information, see "Underwriting—Conflicts of Interest." |
8
| Proposed NASDAQ National Market Symbol | CINC | |
Other information about this prospectus |
Unless specifically stated otherwise, the information in this prospectus: |
| • | assumes the underwriters' over-allotment option is not exercised; and | |||
• |
assumes an initial public offering price of $ per share, which is the mid-point of the range set forth on the cover page of this prospectus. |
9
Summary Historical Consolidated Financial Data
You should read the following summary financial data in conjunction with "Selected Historical Consolidated Financial Data," "Management's Discussion and Analysis of Financial Condition and Results of Operations," "Business" and our historical consolidated financial statements and related notes thereto included elsewhere in this prospectus. The financial information included in this prospectus may not be indicative of our future results of operations, financial position and cash flows.
Set forth below is our summary historical consolidated financial data for the periods indicated. The historical consolidated financial data for the periods ended December 31, 2008, 2009 and 2010 and the balance sheet data as of December 31, 2009 and 2010 have been derived from our audited consolidated financial statements included elsewhere in this prospectus. The historical consolidated balance sheet data as of December 31, 2008 has been derived from our audited financial statements not included in this prospectus. The historical consolidated financial data as of September 30, 2010 and 2011 and the balance sheet data for the nine months ended September 30, 2010 and 2011 have been derived from our unaudited consolidated financial statements included elsewhere in this prospectus. The historical consolidated financial data presented below includes the results of Cima from the date of its formation on March 31, 2010, as it and Cinco are entities under common control, and the results of Dernick Resources, Inc. ("DRI") since the date of its acquisition on March 9, 2009.
| |
Year Ended December 31, | Nine Months Ended September 30, | ||||||||||||||
|---|---|---|---|---|---|---|---|---|---|---|---|---|---|---|---|---|
| |
2008 | 2009 | 2010 | 2010 | 2011 | |||||||||||
| |
(in thousands) |
|||||||||||||||
Statement of Operations Data: |
||||||||||||||||
Revenues: |
||||||||||||||||
Natural gas sales |
$ | 13,978 | $ | 12,079 | $ | 23,453 | $ | 17,144 | $ | 21,679 | ||||||
Oil sales |
5,477 | 2,539 | 3,723 | 1,949 | 14,191 | |||||||||||
Natural gas liquids sales |
1,290 | 834 | 964 | 703 | 603 | |||||||||||
Total revenues |
20,745 | 15,452 | 28,140 | 19,796 | 36,473 | |||||||||||
Operating expenses: |
||||||||||||||||
Lease operating |
4,326 | 4,947 | 6,687 | 4,849 | 6,812 | |||||||||||
Workovers |
3,434 | 764 | 1,993 | 2,085 | 511 | |||||||||||
Severance and ad valorem taxes |
1,287 | 1,265 | 1,803 | 1,260 | 2,399 | |||||||||||
Exploration |
6,839 | 1,547 | 3,579 | 3,363 | 4,154 | |||||||||||
Depletion, depreciation and amortization |
7,130 | 13,208 | 17,288 | 11,138 | 23,981 | |||||||||||
Impairment of natural gas and oil properties |
4,536 | 7,963 | 20,788 | 6,077 | 24,545 | |||||||||||
General and administrative |
9,083 | 25,700 | 16,711 | 12,294 | 17,899 | |||||||||||
Total operating expenses |
36,635 | 55,394 | 68,849 | 41,066 | 80,301 | |||||||||||
Operating loss |
(15,890 | ) | (39,942 | ) | (40,709 | ) | (21,270 | ) | (43,828 | ) | ||||||
Other income (expense): |
||||||||||||||||
Gain on property sales |
168 | 46 | 802 | 809 | 282 | |||||||||||
Gain on derivative instruments |
— | 63 | 7,865 | 8,222 | 5,137 | |||||||||||
Interest expense |
(425 | ) | (4,582 | ) | (6,787 | ) | (5,049 | ) | (5,154 | ) | ||||||
Other income (expense) |
746 | 160 | (566 | ) | (577 | ) | (41 | ) | ||||||||
Total other income (expense) |
489 | (4,313 | ) | 1,314 | 3,405 | 224 | ||||||||||
Loss from continuing operations before taxes |
(15,401 | ) | (44,255 | ) | (39,395 | ) | (17,865 | ) | (43,604 | ) | ||||||
Income tax expense |
(16 | ) | (33 | ) | (13 | ) | — | — | ||||||||
Loss from continuing operations |
(15,417 | ) | (44,288 | ) | (39,408 | ) | (17,865 | ) | (43,604 | ) | ||||||
Income from discontinued operations |
— | 2,150 | 5,912 | 5,232 | 9,987 | |||||||||||
Net loss |
(15,417 | ) | (42,138 | ) | (33,496 | ) | (12,633 | ) | (33,617 | ) | ||||||
Less: net loss attributable to non-controlling interests |
— | 1,365 | — | — | — | |||||||||||
Net loss attributable to Cinco Resources, Inc. stockholders |
$ | (15,417 | ) | $ | (40,773 | ) | $ | (33,496 | ) | $ | (12,633 | ) | $ | (33,617 | ) | |
10
| |
|
|
|
As of September 30, 2011 | |||||||||||||||
|---|---|---|---|---|---|---|---|---|---|---|---|---|---|---|---|---|---|---|---|
| |
As of December 31, | ||||||||||||||||||
| |
|
As Adjusted(1) |
As Further Adjusted(2) |
||||||||||||||||
| |
2008 | 2009 | 2010 | Actual | |||||||||||||||
| |
(in thousands) |
||||||||||||||||||
Balance Sheet Data: |
|||||||||||||||||||
Cash and cash equivalents |
$ | 18,841 | $ | 9,647 | $ | 37,982 | $ | 27,489 | $ | 36,260 | $ | ||||||||
Net property and equipment |
93,157 | 156,361 | 227,452 | 274,739 | 301,739 | ||||||||||||||
Total assets |
119,966 | 204,761 | 308,116 | 319,796 | 355,567 | ||||||||||||||
Long-term debt, net of current maturities |
12,000 | 70,700 | 86,000 | 87,164 | 87,164 | ||||||||||||||
Total stockholders' equity |
85,698 | 102,524 | 161,187 | 186,485 | 208,756 | ||||||||||||||
| |
Year Ended December 31, | Nine Months Ended September 30, | ||||||||||||||
|---|---|---|---|---|---|---|---|---|---|---|---|---|---|---|---|---|
| |
2008 | 2009 | 2010 | 2010 | 2011 | |||||||||||
| |
(in thousands) |
|||||||||||||||
Other Financial Data: |
||||||||||||||||
Net cash provided by (used in) operating activities |
$ | 7,312 | $ | (40,027 | ) | $ | 14,734 | $ | 8,076 | $ | 14,438 | |||||
Net cash used in investing activities |
(32,244 | ) | (25,153 | ) | (84,619 | ) | (59,177 | ) | (72,719 | ) | ||||||
Net cash provided by financing activities |
36,165 | 55,986 | 98,220 | 56,331 | 47,788 | |||||||||||
Adjusted EBITDAX(3) |
4,440 | (11,970 | ) | 14,215 | 8,487 | 22,188 | ||||||||||
- (1)
- Gives
effect to the following transactions, all of which occurred or will occur subsequent to September 30, 2011: (i) the issuance of 250,000
shares of our common stock to Yorktown for $30.0 million; (ii) the conversion of our Series A Convertible Preferred Stock into 875,000 shares of our common stock; (iii) the
acquisition of additional Powder River Basin acreage for $13.5 million in cash and a $13.5 million note payable; (iv) the extinguishment of $9.9 million of stockholder
notes receivable and related accrued interest in exchange for the return of 82,448 shares of our common stock; (v) the issuance of 61,444 restricted shares of common stock that will occur prior
to the closing of this offering; and (vi) the repurchase of 64,409 shares of Cima common stock and fractional shares resulting from Cima's 500 for one reverse common stock split for
approximately $7.7 million.
- (2)
- Gives
effect to (i) a for one stock split of our common stock to be effected in the form of a stock dividend concurrently with the
closing of this offering, (ii) the issuance of 53,420 restricted shares of common stock that will occur concurrently with the closing of this offering and (iii) this offering and the
application of the net proceeds as described in "Use of Proceeds."
- (3)
- Adjusted EBITDAX is a non-GAAP financial measure. For a definition of Adjusted EBITDAX and a reconciliation of Adjusted EBITDAX to our loss from continuing operations, see "—Non-GAAP Financial Measure" below.
Non-GAAP Financial Measure
Adjusted EBITDAX is a supplemental non-GAAP financial measure that is used by management and external users of our consolidated financial statements, such as industry analysts, investors, lenders and rating agencies.
We define Adjusted EBITDAX as income or loss from continuing operations before interest expense, income tax expenses or benefits, realized gains or losses on interest rate derivatives, depletion, depreciation and amortization, property impairments, exploration expenses, unrealized derivative gains or losses, interest and other income or expense, gains or losses on property sales and share-based compensation expense. Adjusted EBITDAX is not a measure of net income or loss as determined by U.S. generally accepted accounting principles, or GAAP. Our management believes Adjusted EBITDAX is useful because it allows us to more effectively evaluate our operating performance and compare the results of our operations from period to period without regard to our financing methods or capital structure. We exclude the items listed above from income or loss from continuing operations in arriving
11
at Adjusted EBITDAX because these amounts can vary substantially from company to company within our industry depending upon accounting methods and book values of assets, capital structures and the method by which the assets were acquired. Adjusted EBITDAX should not be considered as an alternative to, or more meaningful than, income or loss from continuing operations as determined in accordance with GAAP or as an indicator of our operating performance. Certain items excluded from Adjusted EBITDAX are significant components in understanding and assessing a company's financial performance, such as a company's cost of capital and tax structure, as well as the historic costs of depreciable assets, none of which are components of Adjusted EBITDAX. Our computations of Adjusted EBITDAX may not be comparable to other similarly titled measures of other companies. We believe that Adjusted EBITDAX is a widely followed measure of operating performance and may also be used by investors to measure our ability to meet debt service requirements.
The following table presents a reconciliation of the non-GAAP financial measure of Adjusted EBITDAX to the GAAP financial measure of loss from continuing operations.
| |
Year Ended December 31, | Nine Months Ended September 30, | ||||||||||||||
|---|---|---|---|---|---|---|---|---|---|---|---|---|---|---|---|---|
| |
2008 | 2009 | 2010 | 2010 | 2011 | |||||||||||
| |
(in thousands) |
|||||||||||||||
Adjusted EBITDAX reconciliation to loss from continuing operations: |
||||||||||||||||
Loss from continuing operations |
$ | (15,417 | ) | $ | (44,288 | ) | $ | (39,408 | ) | $ | (17,865 | ) | $ | (43,604 | ) | |
Exploration |
6,839 |
1,547 |
3,579 |
3,363 |
4,154 |
|||||||||||
Depletion, depreciation and amortization |
7,130 | 13,208 | 17,288 | 11,138 | 23,981 | |||||||||||
Impairment of natural gas and oil properties |
4,536 | 7,963 | 20,788 | 6,077 | 24,545 | |||||||||||
Share-based compensation expense |
1,825 | 5,287 | 8,723 | 6,290 | 8,127 | |||||||||||
Gains on property sales |
(168 | ) | (46 | ) | (802 | ) | (809 | ) | (282 | ) | ||||||
Realized loss on interest rate derivatives |
— | 340 | 978 | 723 | 752 | |||||||||||
Unrealized derivative gains |
— | (436 | ) | (4,297 | ) | (6,056 | ) | (680 | ) | |||||||
Interest expense |
425 | 4,582 | 6,787 | 5,049 | 5,154 | |||||||||||
Other (income) expense |
(746 | ) | (160 | ) | 566 | 577 | 41 | |||||||||
Income tax expense |
16 | 33 | 13 | — | — | |||||||||||
Adjusted EBITDAX |
$ | 4,440 | $ | (11,970 | ) | $ | 14,215 | $ | 8,487 | $ | 22,188 | |||||
12
Summary Historical Operating and Reserve Data
The following table presents summary data with respect to our estimated proved oil and natural gas reserves as of the dates indicated. The reserve estimates at December 31, 2009 and 2010 and May 31, 2011 presented in the table below are based on reports prepared by Netherland, Sewell & Associates, Inc., our independent reserve engineers, and were prepared consistent with the rules promulgated by the Securities and Exchange Commission, or the SEC, regarding oil and natural gas reserves. For additional information regarding our reserves, see "Business."
| |
At December 31, | |
||||||||
|---|---|---|---|---|---|---|---|---|---|---|
| |
At May 31, 2011 |
|||||||||
| |
2009 | 2010 | ||||||||
Estimated Proved Reserves(1): |
||||||||||
Natural Gas (Bcf) |
138.5 | 229.5 | 200.0 | |||||||
Oil (MMBbls) |
1.5 | 2.2 | 2.9 | |||||||
Natural gas liquids (MMBbls) |
0.8 | 0.8 | 0.8 | |||||||
Total (Bcfe) |
151.9 | 247.5 | 222.5 | |||||||
Estimated proved developed (Bcfe) |
64.0 | 84.7 | 73.2 | |||||||
Percent developed |
42.1 | % | 34.2 | % | 32.9 | % | ||||
Estimated proved undeveloped (Bcfe) |
88.0 | 162.8 | 149.3 | |||||||
PV-10 (in millions)(2) |
$ | 62.1 | $ | 130.7 | $ | 122.3 | ||||
Standardized Measure (in millions)(3) |
$ | 61.6 | $ | 129.8 | $ | |||||
- (1)
- Our
estimated proved reserves and related future net revenues, PV-10 and Standardized Measure were determined using index prices for oil and
natural gas, without giving effect to derivative transactions, and were held constant throughout the life of the properties. Our estimated proved reserves were determined using the unweighted averages
of the historical first-day-of-the-month prices for the prior 12 months of $57.65 per Bbl for oil and $3.87 per MMBtu for natural gas at
December 31, 2009; $75.96 per Bbl for oil and $4.38 per MMBtu for natural gas at December 31, 2010; and $84.29 per Bbl for oil and $4.18 per MMBtu for natural gas at
May 31, 2011. These prices were adjusted by lease for quality, transportation fees, geographical differentials, marketing bonuses or deductions and other factors affecting the price received at
the wellhead.
- (2)
- PV-10 is a non-GAAP financial measure and generally differs from Standardized Measure, the most directly comparable GAAP financial measure, because it does not include the effects of income taxes on future net revenues. PV-10 is not an estimate of the fair market value of our oil and natural gas properties. We and others in the industry use PV-10 as a measure to compare the relative size and value of estimated proved reserves held by companies without regard to the specific tax characteristics of such entities. The following table provides a reconciliation of our Standardized Measure to PV-10 for the periods presented:
| |
At December 31, | |
||||||||
|---|---|---|---|---|---|---|---|---|---|---|
| |
At May 31, 2011 |
|||||||||
| |
2009 | 2010 | ||||||||
| |
(in millions) |
|||||||||
Standardized Measure of discounted net cash flows |
$ | 61.6 | $ | 129.8 | $ | |||||
Present value of future income tax discounted at 10%(4) |
0.5 | 0.9 | ||||||||
PV-10 |
$ | 62.1 | $ | 130.7 | $ | 122.3 | ||||
- (3)
- Standardized
Measure represents the present value of estimated future net cash inflows from proved oil and natural gas reserves, less estimated future
development, production, plugging and abandonment costs and income tax expenses (if applicable), discounted at 10% per annum to reflect the timing of future cash flows. Standardized Measure is not an
estimate of the fair market value of our oil and natural gas properties.
- (4)
- Based on our net operating losses, we do not anticipate paying any future federal income taxes for the periods indicated. Taxes shown are state taxes.
13
The following table sets forth summary data with respect to our revenues, realized commodity derivative activities, production results, average sales prices and production costs on a historical basis for the periods presented. We determine natural gas equivalents by using the ratio of six Mcf of natural gas to one barrel of oil or one barrel of natural gas liquids.
| |
Year Ended December 31, | Nine Months Ended September 30, | ||||||||||||||
|---|---|---|---|---|---|---|---|---|---|---|---|---|---|---|---|---|
| |
2008 | 2009 | 2010 | 2010 | 2011 | |||||||||||
Revenues (in thousands): |
||||||||||||||||
Natural gas |
$ | 13,978 | $ | 12,079 | $ | 23,453 | $ | 17,144 | $ | 21,679 | ||||||
Oil |
5,477 | 2,539 | 3,723 | 1,949 | 14,191 | |||||||||||
Natural gas liquids |
1,290 | 834 | 964 | 703 | 603 | |||||||||||
Total revenues |
20,745 | 15,452 | 28,140 | 19,796 | 36,473 | |||||||||||
Realized gain (loss) on commodity derivatives |
— | (33 | ) | 4,546 | 2,889 | 5,209 | ||||||||||
Revenues including derivative impact |
$ | 20,745 | $ | 15,419 | $ | 32,686 | $ | 22,685 | $ | 41,682 | ||||||
Production data: |
||||||||||||||||
Natural gas (MMcf) |
1,638.1 | 3,601.3 | 6,627.0 | 4,634.7 | 6,240.7 | |||||||||||
Oil (MBbls) |
55.1 | 43.5 | 48.2 | 26.0 | 151.7 | |||||||||||
Natural gas liquids (MBbls) |
24.8 | 25.9 | 24.1 | 17.8 | 11.8 | |||||||||||
Natural gas equivalents (MMcfe) |
2,117.5 | 4,017.7 | 7,060.8 | 4,897.5 | 7,221.7 | |||||||||||
Average daily equivalent production (MMcfed) |
5.8 | 11.0 | 19.3 | 17.9 | 26.5 | |||||||||||
Average sales prices: |
||||||||||||||||
Natural gas ($ per Mcf) |
$ | 8.53 | $ | 3.35 | $ | 3.54 | $ | 3.70 | $ | 3.47 | ||||||
Oil ($ per Bbl) |
99.40 | 58.37 | 77.24 | 74.96 | 93.55 | |||||||||||
Natural gas liquids ($ per Bbl) |
52.02 | 32.20 | 40.00 | 39.49 | 51.10 | |||||||||||
Natural gas equivalents ($ per Mcfe) |
9.80 |
3.85 |
3.99 |
4.04 |
5.05 |
|||||||||||
Realized gain (loss) on commodity derivatives ($ per Mcfe) |
— | (0.01 | ) | 0.64 | 0.59 | 0.72 | ||||||||||
Natural gas equivalents including realized gain (loss) on commodity derivatives ($ per Mcfe)(1) |
$ | 9.80 | $ | 3.84 | $ | 4.63 | $ | 4.63 | $ | 5.77 | ||||||
Costs and expenses (per Mcfe of production): |
||||||||||||||||
Lease operating |
$ | 2.04 | $ | 1.23 | $ | 0.95 | $ | 0.99 | $ | 0.94 | ||||||
Workovers |
1.62 | 0.19 | 0.28 | 0.43 | 0.07 | |||||||||||
Severance and ad valorem taxes |
0.61 | 0.31 | 0.26 | 0.26 | 0.33 | |||||||||||
Depletion, depreciation and amortization |
3.37 | 3.29 | 2.45 | 2.27 | 3.32 | |||||||||||
General and administrative |
4.29 | 6.40 | 2.37 | 2.51 | 2.48 | |||||||||||
- (1)
- These prices include realized gains or losses on cash settlements for our commodity derivatives. None of our commodity derivatives are designated as cash flow or fair value hedges.
14
You should carefully consider the risks described below before making an investment decision. Our business, financial condition or results of operations could be materially adversely affected by any of these risks. The trading price of our common stock could decline due to any of these risks, and you may lose all or part of your investment.
Risks Related to the Oil and Natural Gas Industry and Our Business
A substantial or extended decline in natural gas, oil and natural gas liquids prices may adversely affect our business, financial condition or results of operations and our ability to meet our capital expenditure obligations and financial commitments.
The price we receive for our natural gas, oil and natural gas liquids heavily influences our revenues, profitability, access to capital and future rate of growth. Natural gas, oil and natural gas liquids are commodities and, therefore, their prices are subject to wide fluctuations in response to relatively minor changes in supply and demand. Historically, the markets for natural gas, oil and natural gas liquids have been volatile. These markets will likely continue to be volatile in the future. The prices we receive for our production, and the levels of our production, depend on numerous factors beyond our control. These factors include the following:
- •
- domestic and worldwide economic conditions impacting the supply and demand for natural gas, oil and natural gas liquids;
- •
- the actions of the Organization of Petroleum Exporting Countries, or OPEC;
- •
- the price and quantity of imports of foreign oil and natural gas;
- •
- political conditions in or affecting other oil-producing and natural gas-producing countries,
including the current conflicts in the Middle East and conditions in South America and Russia;
- •
- the level of global oil and natural gas exploration and production;
- •
- the level of global oil and natural gas inventories;
- •
- localized supply and demand fundamentals and transportation availability;
- •
- weather conditions and natural disasters;
- •
- domestic and foreign governmental regulations;
- •
- speculation as to the future price of oil and the speculative trading of oil and natural gas futures contracts;
- •
- price and availability of competitors' supplies of oil and natural gas;
- •
- technological advances affecting energy consumption; and
- •
- the price and availability of alternative fuels.
Substantially all of our production that is not subject to derivative contracts is sold to purchasers under short-term (less than 12-month) contracts at market-based prices. Lower natural gas, oil or natural gas liquids prices will reduce our cash flows, borrowing ability and the present value of our reserves. See also "—Our exploration, development and exploitation projects require substantial capital expenditures. We may be unable to obtain needed capital or financing on satisfactory terms, which could lead to expiration of our leases or a decline in our oil and natural gas reserves." Lower natural gas, oil and natural gas liquids prices may also reduce the amount of natural gas, oil and natural gas liquids that we can produce economically and may affect our estimated proved reserves. See also "—The present value
15
of future net revenues from our estimated proved reserves will not necessarily be the same as the current market value of our estimated oil and natural gas reserves."
Drilling for and producing oil and natural gas are high-risk activities with many uncertainties that could adversely affect our business, financial condition or results of operations.
Our future financial condition and results of operations will depend on the success of our exploitation, exploration, development and production activities. Our oil and natural gas exploitation, exploration, development and production activities are subject to numerous risks beyond our control, including the risk that drilling will not result in commercially viable oil or natural gas production. Our decisions to purchase, explore, develop or otherwise exploit drilling locations or properties will depend in part on the evaluation of data obtained through geophysical and geological analyses, production data and engineering studies, the results of which are often inconclusive or subject to varying interpretations. For a discussion of the uncertainty involved in these processes, see "—Our estimated proved reserves are based on many assumptions that may turn out to be inaccurate. Any significant inaccuracies in these reserve estimates or underlying assumptions will materially affect the quantities and present value of our reserves." Our cost of drilling, completing and operating wells is often uncertain before drilling commences. Overruns in budgeted expenditures are common risks that can make a particular project uneconomical. Further, many factors may curtail, delay or cancel our scheduled drilling projects, including the following:
- •
- shortages of or delays in obtaining equipment and qualified personnel;
- •
- facility or equipment malfunctions;
- •
- unexpected operational events;
- •
- pressure or irregularities in geological formations;
- •
- adverse weather conditions, such as ice storms, hurricanes and flooding;
- •
- declines in oil and natural gas prices;
- •
- delays imposed by or resulting from compliance with regulatory requirements;
- •
- proximity to and capacity of transportation and processing facilities;
- •
- title problems; and
- •
- limitations in the market for natural gas, oil and natural gas liquids.
Our estimated proved reserves are based on many assumptions that may turn out to be inaccurate. Any significant inaccuracies in these reserve estimates or underlying assumptions will materially affect the quantities and present value of our reserves.
The process of estimating oil and natural gas reserves is complex. It requires interpretations of available technical data and many assumptions, including assumptions relating to current and future economic conditions and commodity prices. Any significant inaccuracies in these interpretations or assumptions could materially affect the estimated quantities and present value of reserves shown in this prospectus. See "Business—Estimated Proved Reserves" for information about our estimated natural gas, oil and natural gas liquids reserves and the PV-10 and Standardized Measure of discounted future net revenues as of December 31, 2010 and May 31, 2011. In order to prepare our estimates, we must project production rates and the timing of development expenditures. We must also analyze available geological, geophysical, production and engineering data. The extent, quality and reliability of this data can vary. The process also requires economic assumptions about matters such as oil and natural gas prices, drilling and operating expenses, capital expenditures, taxes and availability of funds. Although the reserve information contained herein is reviewed by independent reserve engineers, estimates of oil
16
and natural gas reserves are inherently imprecise. Actual future production, oil and natural gas prices, revenues, taxes, development expenditures, operating expenses and quantities of recoverable oil and natural gas reserves will vary from our estimates. Any significant variance could materially affect the estimated quantities and present value of reserves shown in this prospectus. In addition, we may adjust estimates of proved reserves to reflect production history, results of exploration and development, prevailing oil and natural gas prices and other factors, many of which are beyond our control. Due to the limited production history of our undeveloped acreage in the Eagle Ford Shale, the estimates of future production associated with these properties may be subject to greater variance from actual production than would be the case with properties having a longer production history.
The present value of future net revenues from our estimated proved reserves will not necessarily be the same as the current market value of our estimated oil and natural gas reserves.
You should not assume that the present value of future net revenues from our estimated proved reserves is the current market value of our estimated natural gas, oil and natural gas liquids reserves. We have based the estimated discounted future net revenues from our estimated proved reserves on the 12-month unweighted arithmetic average of the first-day-of-the month price for the preceding twelve months without giving effect to derivative transactions. Actual future net revenues from our natural gas, oil and natural gas liquids properties will be affected by factors such as:
- •
- actual prices we receive for natural gas, oil and natural gas liquids;
- •
- actual cost of development and production expenditures;
- •
- the amount and timing of actual production; and
- •
- changes in governmental regulations or taxation.
The timing of both our production and our incurrence of expenses in connection with the development and production of oil and natural gas properties will affect the timing and amount of actual future net revenues from estimated proved reserves, and thus their actual present value. In addition, the 10% discount factor we use when calculating discounted future net revenues may not be the most appropriate discount factor based on interest rates in effect from time to time and risks associated with us or the oil and natural gas industry in general. Actual future prices and costs may differ materially from those used in the present value estimates included in this prospectus. If oil and natural gas liquids prices decline by $1.00 per Bbl, then our PV-10 as of December 31, 2010 would decrease approximately $1.2 million. If natural gas prices decline by $0.10 per Mcf, then our PV-10 as of December 31, 2010 would decrease approximately $8.1 million.
Part of our strategy involves drilling in existing or emerging shale plays using some of the latest available horizontal drilling and completion techniques. The results of our planned exploratory drilling in these plays are subject to drilling and completion technique risks, and drilling results may not meet our expectations for reserves or production. As a result, we may incur material write-downs and the value of our undeveloped acreage could decline if drilling results are unsuccessful.
Operations in the Woodford Shale, the Eagle Ford Shale and the Mowry Shale/Muddy Sandstone formations involve utilizing the latest drilling and completion techniques that we and our service providers have developed in order to attempt to maximize cumulative recoveries and therefore generate the highest possible returns. Risks that we face while drilling include, but are not limited to, failures of any of the following: landing our well bore in the desired part of the geologic formation; staying in the desired part of the geologic formation while drilling horizontally through the formation; running our casing the entire length of the well bore; and being able to run tools and other equipment consistently through the horizontal well bore. Risks that we face while completing our wells include, but are not limited to, failures of any of the following: being able to fracture stimulate the planned number of
17
stages; being able to run tools the entire length of the well bore during completion operations; and successfully cleaning out the well bore after completion of the final fracture stimulation stage.
Our experience with horizontal drilling utilizing the latest drilling and completion techniques specifically in the Woodford Shale formation, and particularly in the Eagle Ford Shale formation, is limited. We have not drilled any horizontal wells in the Powder River Basin. Ultimately, the success of these drilling and completion techniques can only be evaluated over time as more wells are drilled and production profiles are established over a sufficiently long time period. If our drilling results are less than anticipated or we are unable to execute our drilling program because of capital constraints, lease expirations, access to gathering systems, limited takeaway capacity, limited processing capacity or otherwise, and/or natural gas, oil and natural gas liquids prices decline, the return on our investment in these areas may not be as attractive as we anticipate, we could incur material write-downs of unevaluated properties and the value of our undeveloped acreage could decline in the future.
Our exploration, development and exploitation projects require substantial capital expenditures. We may be unable to obtain needed capital or financing on satisfactory terms, which could lead to expiration of our leases or a decline in our oil and natural gas reserves.
Our exploration, development and exploitation activities are capital intensive. We make and expect to continue to make substantial capital expenditures in our business for the development, exploitation, production and acquisition of natural gas, oil and natural gas liquids reserves. Our cash flows used in investing activities related to capital and exploration expenditures were $92.9 million for the year ended December 31, 2010. Through September 30, 2011, we had spent or committed to spend approximately $99.6 million of our 2011 capital expenditure budget of $155.0 million. Our capital expenditure budget for 2012 is approximately $172.0 million, with approximately $153.4 million allocated to drilling and completion operations. To date, our capital expenditures have been financed with capital contributions from Yorktown and other private investors, borrowings under our credit facilities and net cash provided by operating activities. We project that we will incur capital costs in excess of $118.9 million through 2013 to develop the proved undeveloped reserves covered by the December 31, 2010 reserve report prepared by Netherland, Sewell & Associates, Inc., our independent reserve engineers. Because these costs cover less than five percent of our total potential drilling locations, we will be required to generate or raise additional capital to develop all of our potential drilling locations should we elect to do so. The actual amount and timing of our future capital expenditures may differ materially from our estimates as a result of, among other things, commodity prices, actual drilling results, the availability of drilling rigs and other services and equipment and regulatory, technological and competitive developments. A significant improvement in product prices could result in an increase in our capital expenditures. We intend to finance our future capital expenditures primarily through cash flows provided by operating activities, borrowings under our senior secured revolving credit facility and the net proceeds from this offering; however, our financing needs may require us to alter or increase our capitalization substantially through the issuance of debt or additional equity and equity linked securities or the sale of non-strategic assets. The issuance of additional debt may require that a portion of our cash flows provided by operating activities be used for the payment of principal and interest on our debt, thereby reducing our ability to use cash flows to fund working capital, capital expenditures and acquisitions. The issuance of additional equity and equity-linked securities could have a dilutive effect on the value of your common stock. In addition, upon the issuance of certain debt securities (other than on a borrowing base redetermination date), our borrowing base under our senior secured revolving credit facility will be reduced by an amount that is not determinable at this time. Our cash flows provided by operating activities and access to capital are subject to a number of variables, including:
- •
- our estimated proved reserves;
- •
- the level of natural gas, oil and natural gas liquids we are able to produce from existing wells;
18
- •
- the prices at which our production is sold;
- •
- the costs of developing our properties and producing from them over time;
- •
- our ability to acquire, locate and develop new reserves;
- •
- the ability and willingness of our banks to lend us additional funds;
- •
- the overall conditions of capital markets; and
- •
- our ability to access the equity and debt capital markets.
If the borrowing base under our senior secured revolving credit facility or our revenues decreases as a result of lower natural gas, oil and natural gas liquids prices, operating difficulties, declines in reserves or for any other reason, we may have limited ability to obtain the capital necessary to sustain our operations at current levels. If additional capital is needed, we may not be able to obtain debt or equity financing on terms favorable to us, or at all. If cash generated by operations or cash available under our senior secured revolving credit facility is not sufficient to meet our capital requirements, the failure to obtain additional financing could result in a curtailment of our operations relating to development of our drilling locations, which in turn could lead to possible expiration of certain of our leases and a decline in our natural gas, oil and natural gas liquids reserves, and could adversely affect our business, financial condition and results of operations.
If oil and natural gas prices decrease, we may be required to take write-downs of the carrying values of our oil and natural gas properties.
We review our proved oil and natural gas properties for impairment whenever events and circumstances indicate that a decline in the recoverability of their carrying value may have occurred. Based on specific market factors and circumstances at the time of prospective impairment reviews, and the continuing evaluation of development plans, production data, economics and other factors, we may be required to write down the carrying value of our oil and natural gas properties, which may result in a decrease in the amount available under our senior secured revolving credit facility. A write-down constitutes a non-cash charge to earnings. We may incur impairment charges in the future, which could have a material adverse effect on our ability to borrow under our senior secured revolving credit facility and our results of operations for the periods in which such charges are taken.
We have limited control over the timing of exploration or development efforts, associated costs or the rate of production on properties we do not operate.
We operate more than 92% of our net acreage. For the balance of our net acreage, our business activities are conducted through joint operating agreements under which we own partial interests in oil and natural gas properties. Additionally, as we carry out our drilling programs, we may enter into arrangements with respect to existing or future drilling locations that result in a greater proportion of our locations being operated by others. As a result, we may have limited ability to exercise influence over the operations of the drilling locations operated by others. Dependence on the operator could prevent us from realizing our target returns for those locations. The success and timing of exploration and development activities operated by others will depend on a number of factors that will be largely outside of our control, including:
- •
- the timing and amount of capital expenditures;
- •
- the operator's expertise and financial resources;
- •
- approval of other participants in drilling wells;
- •
- selection of technology; and
19
- •
- the rate of production of reserves, if any.
This limited ability to exercise control over the operations of some of our drilling locations may cause a material adverse effect on our results of operations and financial condition.
Substantially all of our producing properties and operations are located in our core areas of the Arkoma Basin and South Texas, making us vulnerable to risks associated with operational concentrations in two geographic areas.
As of May 31, 2011, substantially all of our estimated proved reserves were located in our core areas of the Arkoma Basin and South Texas. As a result, we may be disproportionately exposed to the impact of delays or interruptions of production from these wells caused by transportation or processing capacity constraints, curtailment of production, availability of equipment, facilities, personnel or services, significant governmental regulation, natural disasters, adverse weather conditions, plant closures for scheduled maintenance or interruption of transportation of natural gas, oil and natural gas liquids produced from the wells in these areas. In addition, the effect of fluctuations on supply and demand may become more pronounced within specific geographic oil and gas producing areas which may cause these conditions to occur with greater frequency or magnify the effect of these conditions. Due to the concentrated nature of our portfolio of properties, a number of our properties could experience any of the same conditions at the same time, resulting in a relatively greater impact on our results of operations than they might have on other companies that have a more diversified portfolio of properties. Such delays or interruptions could have a material adverse effect on our financial condition and results of operations.
Market conditions or operational impediments may hinder our access to oil and natural gas markets or delay our production.
Market conditions or the unavailability of satisfactory natural gas, oil and natural gas liquids transportation and processing arrangements may hinder our access to product markets or delay our production. The availability of a ready market for our production depends on a number of factors, including the demand for and supply of natural gas, oil and natural gas liquids and the proximity of reserves to pipelines, processing facilities and terminal facilities. Our ability to market our production depends, in substantial part, on the availability, proximity and capacity of gathering systems, pipeline systems and treating and processing facilities owned and operated by third-parties. The unavailability of, or lack of, available capacity on these systems and facilities could result in the shut-in of producing wells or the delay, or discontinuance of, development plans for properties. We generally do not purchase firm transportation on third party facilities and, therefore, the transportation of our production can be interrupted by those having firm arrangements. If our production becomes shut-in for any of these or other reasons, we would be unable to realize revenues from those wells until other arrangements were made to deliver the products to market.
The disruption of third-party facilities due to maintenance and/or weather could also negatively impact our ability to market and deliver our products. We have no control over when or if such facilities are restored or what prices will be charged. A total shut-in of production could materially affect us due to a lack of cash flow, and if a substantial portion of the production is hedged at lower than market prices, those financial hedges would have to be paid from borrowings absent sufficient cash flow.
Federal and state regulation of oil and natural gas production and transportation, tax and energy policies, changes in supply and demand, pipeline pressures, damage to or destruction of pipelines and general economic conditions could also adversely affect our ability to produce, gather and transport our oil and natural gas.
20
Unless we replace our oil and natural gas reserves, our reserves and production will decline, which would adversely affect our business, financial condition and results of operations.
Unless we conduct successful development, exploitation and exploration activities or acquire properties containing estimated proved reserves, our estimated proved reserves will decline as those reserves are produced. Producing oil and natural gas reservoirs generally are characterized by declining production rates that vary depending upon reservoir characteristics and other factors. Our future natural gas, oil and natural gas liquids reserves and production, and therefore our cash flows and income, are highly dependent on our success in efficiently developing and exploiting our current reserves and economically finding or acquiring additional recoverable reserves. We may not be able to develop, exploit, find or acquire additional reserves to replace our current and future production at acceptable costs. If we are unable to replace our current and future production, the value of our reserves will decrease, and our business, financial condition and results of operations would be adversely affected.
The unavailability or high cost of additional drilling rigs, completion equipment, other equipment, supplies, personnel and oilfield services could adversely affect our ability to execute our exploration and development plans within our budget and on a timely basis.
Shortages or the high cost of drilling rigs, completion and other equipment, supplies, personnel or oilfield services could delay or adversely affect our development and exploration operations or cause us to incur significant expenditures that are not provided for in our capital budget, which could have a material adverse effect on our business, financial condition or results of operations.
We may incur substantial losses and be subject to substantial liability claims as a result of our oil and natural gas operations. Additionally, we may not be insured for, or our insurance may be inadequate to protect us against, these risks.
We are not insured against all risks. Losses and liabilities arising from uninsured and underinsured events could materially and adversely affect our business, financial condition or results of operations. Our oil and natural gas exploration and production activities are subject to all of the operating risks associated with drilling for and producing oil and natural gas, including the possibility of:
- •
- environmental hazards, such as uncontrollable flows of oil, natural gas, brine, well fluids, toxic gas or other pollution
into the environment, including groundwater and shoreline contamination;
- •
- abnormally pressured formations;
- •
- mechanical difficulties, such as stuck oilfield drilling and service tools and casing collapse;
- •
- personal injuries and death; and
- •
- natural disasters.
Any of these risks could adversely affect our ability to conduct operations or result in substantial losses to us as a result of:
- •
- injury or loss of life;
- •
- damage to and destruction of property, natural resources and equipment;
- •
- pollution and other environmental damage;
- •
- regulatory investigations and penalties;
- •
- suspension of our operations; and
- •
- repair and remediation costs.
21
We may elect not to obtain insurance if we believe that the cost of available insurance is excessive relative to the risks presented. In addition, pollution and environmental risks generally are not fully insurable. The occurrence of an event that is not fully covered by insurance could have a material adverse effect on our business, financial condition and results of operations.
Drilling locations that we decide to drill may not yield natural gas, oil or natural gas liquids in commercially viable quantities.
Our drilling locations are in various stages of evaluation, ranging from a location which is ready to drill to a location that will require substantial additional interpretation. There is no way to predict in advance of drilling and testing whether any particular location will yield natural gas, oil or natural gas liquids in sufficient quantities to recover drilling or completion costs or to be economically viable. The use of technologies and the study of producing fields in the same area will not enable us to know conclusively prior to drilling whether natural gas, oil or natural gas liquids will be present or, if present, whether they will be present in sufficient quantities to be economically viable. Even if sufficient amounts of natural gas, oil or natural gas liquids exist, we may damage the potentially productive hydrocarbon bearing formation or experience mechanical difficulties while drilling or completing the well, resulting in a reduction in production from the well or abandonment of the well. If we drill additional wells that we identify as dry holes in our current and future drilling locations, our drilling success rate may decline and materially harm our business. We cannot assure you that the analogies we draw from available data from other wells, more fully explored locations or producing fields will be applicable to our drilling locations. Further, initial production rates reported by us or other operators in our core areas may not be indicative of future or long-term production rates. In sum, the cost of drilling, completing and operating any well is often uncertain, and new wells may not be productive.
We have incurred losses from operations during certain periods since our inception and may continue to do so in the future.
We incurred net losses of $12.6 million and $33.6 million for the nine months ended September 30, 2010 and 2011, respectively, and $15.4 million, $40.8 million and $33.5 million for the years ended December 31, 2008, 2009 and 2010, respectively. Our development of and participation in an increasingly larger number of drilling locations has required and will continue to require substantial capital expenditures. The uncertainty and risks described in this prospectus may impede our ability to economically find, develop, exploit and acquire oil and natural gas reserves. As a result, we may not be able to achieve or sustain profitability or positive cash flows provided by operating activities in the future.
Our identified potential drilling location inventories are scheduled over several years, making them susceptible to uncertainties that could materially alter the occurrence or timing of their drilling. In addition, we may not be able to raise the substantial amount of capital that would be necessary to drill a substantial portion of our identified potential drilling locations.
Our management has identified and scheduled drilling locations as an estimation of our future multi-year drilling activities on our existing acreage. As of December 31, 2011, only 78 of our 935 specifically identified potential future gross drilling locations were attributed to proved undeveloped reserves included in our May 31, 2011 reserve report. These potential drilling locations, including those without proved undeveloped reserves, represent a significant part of our growth strategy. Our ability to drill and develop these locations is subject to a number of uncertainties, including the availability of capital, regulatory approvals, the prices of natural gas, oil and natural gas liquids, costs and drilling results. Because of these uncertainties, we do not know if the numerous potential drilling locations we have identified will ever be drilled or if we will be able to produce natural gas, oil or natural gas liquids from these or any other potential drilling locations. Pursuant to the current SEC rules and guidance,
22
subject to limited exceptions, proved undeveloped reserves may only be booked if they relate to wells scheduled to be drilled within five years of the date of booking. These rules and guidance may limit our potential to book additional proved undeveloped reserves as we pursue our drilling program. Our actual drilling activities may be materially different from our current expectations based on potential drilling locations, which could adversely affect our financial condition, results of operations and cash flows.
Our acreage must be drilled before lease expiration, generally within three to five years, in order to hold the acreage by production. In the highly competitive market for acreage, failure to drill sufficient wells in order to hold acreage will result in a substantial lease renewal cost, or if renewal is not feasible, loss of our lease and prospective drilling opportunities.
Unless production is established within the spacing units covering the undeveloped acres on which some of the locations are identified, the leases for such acreage will expire. As of December 31, 2011, we had leases representing 812 net acres expiring in 2011; 8,664 net acres expiring in 2012; and 16,539 net acres expiring in 2013. The cost to renew such leases may increase significantly, and we may not be able to renew such leases on commercially reasonable terms or at all. In addition, on certain portions of our acreage, third party leases become immediately effective if our leases expire. As such, our actual drilling activities may materially differ from our current expectations, which could adversely affect our business.
Our operations are subject to environmental and operational safety laws and regulations that may expose us to significant costs and liabilities.
Our oil and natural gas exploration and production operations are subject to stringent and complex federal, state and local laws and regulations governing health and safety aspects of our operations, the discharge of materials into the environment, or other aspects of our business relating to environmental protection. These laws and regulations may impose numerous obligations that are applicable to our operations including the acquisition of a permit before conducting drilling or underground injection activities; the restriction of types, quantities and concentration of materials that can be released into the environment; the limitation or prohibition of drilling activities on certain lands lying within wilderness, wetlands and other protected areas; the application of specific health and safety criteria addressing worker protection; and the imposition of substantial liabilities for pollution resulting from operations. Numerous governmental authorities, such as the U.S. Environmental Protection Agency, or the EPA, and analogous state agencies have the power to enforce compliance with these laws and regulations and the permits issued under them, oftentimes requiring difficult and costly actions. Failure to comply with these laws and regulations may result in the assessment of administrative, civil or criminal penalties; the imposition of investigatory or remedial obligations; and the issuance of injunctions limiting or preventing some or all of our operations.
There is inherent risk of incurring significant environmental costs and liabilities in the performance of our operations due to our handling of petroleum hydrocarbons and wastes, because of air emissions, generation of waste and water discharges related to our operations, and as a result of historical industry operations and waste disposal practices. Under certain environmental laws and regulations, we could be subject to joint and several, strict liability for the removal or remediation of previously released materials or property contamination regardless of whether we were responsible for the release or contamination or whether the operations were in compliance with all applicable laws at the time those actions were taken. Private parties, including the owners of properties upon which our wells are drilled and facilities where our petroleum hydrocarbons or wastes are taken for reclamation or disposal, may also have the right to pursue legal actions to enforce compliance as well as to seek damages for non-compliance with environmental laws and regulations or for personal injury or property damage. In addition, the risk of accidental spills or releases could expose us to significant liabilities that could have
23
a material adverse effect on our financial condition or results of operations. Changes in environmental laws and regulations occur frequently, and any changes that result in more stringent or costly waste handling, storage, transport, disposal or cleanup requirements could require us to make significant expenditures to attain and maintain compliance and may otherwise have a material adverse effect on our own results of operations, competitive position or financial condition. We may not be able to recover some or any of these costs from insurance.
The potential adoption of federal and state legislative and regulatory initiatives related to hydraulic fracturing could result in operating restrictions or delays in the completion of oil and gas wells.
Hydraulic fracturing is an essential and common practice in the oil and gas industry used to stimulate production of natural gas and/or oil from dense subsurface rock formations. Hydraulic fracturing involves using water, sand and certain chemicals to fracture the hydrocarbon-bearing rock formation to allow flow of hydrocarbons into the wellbore. We routinely apply hydraulic-fracturing techniques in many of our onshore oil and natural-gas drilling and completion programs. The process is typically regulated by state oil and natural-gas commissions; however, the EPA has asserted federal regulatory authority over certain hydraulic-fracturing activities involving diesel under the Safe Drinking Water Act and has begun the process of drafting guidance documents related to this newly asserted regulatory authority.
In addition, legislation called the Fracturing Responsibility and Awareness of Chemicals Act, or the FRAC Act, was introduced in, but not passed by, the 111th Congress and reintroduced in the 112th Congress, to provide for federal regulation of hydraulic fracturing and to require disclosure of the chemicals used in the hydraulic-fracturing process. The proposed legislation would require the reporting and public disclosure of chemicals used in the fracturing process, which could make it easier for third parties opposing the hydraulic fracturing process to initiate legal proceedings based on allegations that specific chemicals used in the fracturing process could adversely affect groundwater. These bills, if adopted, could establish an additional level of regulation at the federal level that could lead to operational delays or increased operating costs and could result in additional regulatory burdens that could make it more difficult to perform hydraulic fracturing and increase our costs of compliance and doing business.
Certain states in which we operate, including Texas and Wyoming, have adopted, and other states are considering adopting, regulations that could impose more stringent permitting, public disclosure and well construction requirements on hydraulic-fracturing operations or otherwise seek to ban fracturing activities altogether. For example, Texas adopted a law in June 2011 requiring disclosure to the Railroad Commission of Texas, or the RCT, and the public disclosure of certain information regarding the components used in the hydraulic-fracturing process. In addition to state laws, local land use restrictions, such as city ordinances, may restrict or prohibit the performance of well drilling in general and/or hydraulic fracturing in particular. In the event state, local, or municipal legal restrictions are adopted in areas where we are currently conducting, or in the future plan to conduct, operations, we may incur additional costs to comply with such requirements that may be significant in nature, experience delays or curtailment in the pursuit of exploration, development, or production activities, and perhaps even be precluded from the drilling of wells.
There are also certain governmental reviews either underway or being proposed that focus on environmental aspects of hydraulic-fracturing practices. The White House Council on Environmental Quality is coordinating an administration-wide review of hydraulic-fracturing practices, and a committee of the United States House of Representatives has conducted an investigation of hydraulic-fracturing practices. Furthermore, a number of federal agencies are analyzing, or have been requested to review, a variety of environmental issues associated with hydraulic fracturing. The EPA has commenced a study of the potential environmental effects of hydraulic fracturing on drinking water and groundwater, with initial results expected to be available by late 2012 and final results by 2014. In addition, the U.S.
24
Department of Energy is conducting an investigation into practices the agency could recommend to better protect the environment from drilling using hydraulic-fracturing completion methods. Also, the U.S. Department of the Interior is considering disclosure requirements or other mandates for hydraulic fracturing on federal lands.
Additionally, certain members of the Congress have called upon the U.S. Government Accountability Office to investigate how hydraulic fracturing might adversely affect water resources, the SEC to investigate the natural-gas industry and any possible misleading of investors or the public regarding the economic feasibility of pursuing natural-gas deposits in shales by means of hydraulic fracturing, and the U.S. Energy Information Administration to provide a better understanding of that agency's estimates regarding natural-gas reserves, including reserves from shale formations, as well as uncertainties associated with those estimates. These on-going or proposed studies, depending on their degree of pursuit and any meaningful results obtained, could spur initiatives to further regulate hydraulic fracturing under the Safe Drinking Water Act or other regulatory mechanism.
Further, on July 28, 2011, the EPA issued proposed rules that would subject all oil and gas operations (production, processing, transmission, storage and distribution) to regulation under the New Source Performance Standards, or NSPS, and National Emission Standards for Hazardous Air Pollutants, or NESHAPS, programs. The EPA proposed rules also include NSPS standards for completions of hydraulically fractured gas wells. These standards include the reduced emission completion, or REC, techniques developed in EPA's Natural Gas STAR program along with pit flaring of gas not sent to the gathering line. The standards would be applicable to newly drilled and fractured wells as well as existing wells that are refractured. Further, the proposed regulations under NESHAPS include maximum achievable control technology, or MACT, standards for those glycol dehydrators and storage vessels at major sources of hazardous air pollutants not currently subject to MACT standards. We are currently researching the effect these proposed rules could have on our business. Final action on the proposed rules is expected no later than February 28, 2012.
Increased regulation and attention given to the hydraulic fracturing process could lead to greater opposition, including litigation, to oil and gas production activities using hydraulic fracturing techniques. Additional legislation or regulation could also lead to operational delays or increased operating costs in the production of oil and natural gas, including from the developing shale plays, or could make it more difficult to perform hydraulic fracturing. The adoption of any federal, state or local laws or the implementation of regulations regarding hydraulic fracturing could potentially cause a decrease in the completion of new oil and gas wells and increased compliance costs and time, which could adversely affect our financial position, results of operations and cash flows.
Climate change legislation or regulations restricting emissions of "greenhouse gases" could result in increased operating costs and reduced demand for the crude oil and natural gas that we produce.
In December 2009, the EPA determined that emissions of carbon dioxide, methane and other "greenhouse gases," or GHGs, present an endangerment to public health and the environment because emissions of such gases are, according to the EPA, contributing to warming of the earth's atmosphere and other climatic changes. Based on these findings, the EPA has begun adopting and implementing regulations to restrict emissions of GHGs under existing provisions of the federal Clean Air Act. The EPA recently adopted two sets of rules regulating GHG emissions under the Clean Air Act, one of which requires a reduction in emissions of GHGs from motor vehicles and the other of which regulates emissions of GHGs from certain large stationary sources, effective January 2, 2011. The EPA has also adopted rules requiring the reporting of GHG emissions from specified large GHG emission sources in the United States, including petroleum refineries, on an annual basis, beginning in 2011 for emissions occurring after January 1, 2010, as well as certain onshore oil and natural gas production facilities, on an annual basis, beginning in 2012 for emissions occurring in 2011.
25
In addition, the United States Congress has from time to time considered adopting legislation to reduce emissions of GHGs and almost one-half of the states have already taken legal measures to reduce emissions of GHGs primarily through the planned development of GHG emission inventories and/or regional GHG cap and trade programs. Most of these cap and trade programs work by requiring major sources of emissions, such as electric power plants, or major producers of fuels, such as refineries and gas processing plants, to acquire and surrender emission allowances. The number of allowances available for purchase is reduced each year in an effort to achieve the overall GHG emission reduction goal.
The adoption of legislation or regulatory programs to reduce emissions of GHGs could require us to incur increased operating costs, such as costs to purchase and operate emissions control systems, to acquire emissions allowances or comply with new regulatory or reporting requirements. Any such legislation or regulatory programs could also increase the cost of consuming, and thereby reduce demand for, the oil and natural gas we produce. Consequently, legislation and regulatory programs to reduce emissions of GHGs could have an adverse effect on our business, financial condition and results of operations. Finally, it should be noted that some scientists have concluded that increasing concentrations of GHGs in the earth's atmosphere may produce climate changes that have significant physical effects, such as increased frequency and severity of storms, droughts and floods and other climatic events. If any such effects were to occur, they could have an adverse effect on our financial condition and results of operations.
Certain federal income tax deductions currently available with respect to oil and gas exploration and production may be eliminated as a result of future legislation.
President Obama's budget proposal for fiscal year 2012, or the Budget Proposal, contains a proposal to eliminate certain key U.S. federal income tax preferences currently available to coal, oil and gas exploration and production companies. These changes include, but are not limited to (i) the repeal of the percentage depletion allowance for oil and gas properties, (ii) the elimination of current deductions for intangible drilling and development costs, (iii) the elimination of the deduction for U.S. production activities and (iv) the increase in the amortization period from two years to seven years for geophysical costs paid or incurred in connection with the exploration for, or development of, oil or gas within the United States. It is unclear whether any such changes will actually be enacted or, if enacted, how soon any such changes could become effective. The passage of any legislation as a result of the Budget Proposal or any other similar change in U.S. federal income tax law could affect certain tax deductions that are currently available with respect to oil and gas exploration and production and could negatively impact the value of an investment in our common stock.
Competition in the oil and natural gas industry is intense, making it more difficult for us to acquire properties, market oil and natural gas and secure trained personnel.
Our ability to acquire additional drilling locations and to find and develop reserves in the future will depend on our ability to evaluate and select suitable properties and to consummate transactions in a highly competitive environment for acquiring properties, marketing oil and natural gas and securing equipment and trained personnel. Also, there is substantial competition for capital available for investment in the oil and natural gas industry. Many of our competitors possess and employ financial, technical and personnel resources substantially greater than ours. Those companies may be able to pay more for productive oil and natural gas properties and exploratory drilling locations or to identify, evaluate, bid for and purchase a greater number of properties and locations than our financial or personnel resources permit. Furthermore, these companies may also be better able to withstand the financial pressures of unsuccessful drilling attempts, sustained periods of volatility in financial markets and generally adverse global and industry-wide economic conditions, and may be better able to absorb the burdens resulting from changes in relevant laws and regulations, which would adversely affect our
26
competitive position. In addition, companies may be able to offer better compensation packages to attract and retain qualified personnel than we are able to offer. The cost to attract and retain qualified personnel has increased over the past few years due to competition and may increase substantially in the future. We may not be able to compete successfully in the future in acquiring prospective reserves, developing reserves, marketing hydrocarbons, attracting and retaining quality personnel and raising additional capital, which could have a material adverse effect on our business.
The loss of senior management or technical personnel could adversely affect our operations.
To a large extent, we depend on the services of our senior management and technical personnel. The loss of the services of our senior management or technical personnel, including Jon L. Glass, our Chairman, President and Chief Executive Officer; Edward P. Travis, our Senior Vice President and Chief Operating Officer; or Wayne B. Stoltenberg, our Senior Vice President and Chief Financial Officer, could have a material adverse effect on our operations. We do not maintain, nor do we plan to obtain, any insurance against the loss of any of these individuals.
Our derivative activities could result in financial losses or could reduce our income.
To achieve more predictable cash flows and to reduce our exposure to adverse fluctuations in the prices of oil and natural gas, we currently, and may in the future, enter into derivative arrangements for a portion of our oil and natural gas production, including collars and fixed-price swaps. We have not designated any of our derivative instruments as hedges for accounting purposes and record all derivative instruments on our balance sheet at fair value. Changes in the fair value of our derivative instruments are recognized in earnings. Accordingly, our earnings may fluctuate significantly as a result of changes in the fair value of our derivative instruments.
Derivative arrangements also expose us to the risk of financial loss in some circumstances, including when:
- •
- production is less than the volume covered by the derivative instruments;
- •
- the counterparty to the derivative instrument defaults on its contract obligations; or
- •
- there is an increase in the differential between the underlying price in the derivative instrument and actual prices received.
In addition, these types of derivative arrangements limit the benefit we would receive from increases in the prices for oil and natural gas and may expose us to cash margin requirements.
The adoption of financial reform legislation by the United States Congress in 2010 could have an adverse effect on our ability to hedge risks associated with our business.
We enter into derivatives contracts in order to hedge a portion of our natural gas and oil production. The United States Congress adopted comprehensive financial reform legislation in 2010 that establishes federal oversight and regulation of the over-the-counter derivatives market and entities, such as ours, that participate in that market. The legislation, known as the Dodd-Frank Wall Street Reform and Consumer Protection Act, or the Dodd-Frank Act, was signed into law by the President on July 21, 2010, and its provisions generally are effective 360 days from the date of enactment, on July 16, 2011. Provisions that require rulemaking by the Commodities Futures Trading Commission, or the CFTC, and/or the SEC will not take effect until at least 60 days after publication of the related final rule. The CFTC and the SEC have not completed all of the rulemaking the Dodd-Frank Act directs them to carry out. The regulators have granted temporary relief from the general effective date for various requirements of the Dodd-Frank Act, and also have indicated they may phase in implementation of various requirements of the new rules. In its rulemaking under the Dodd-Frank Act, the CFTC has proposed regulations to set position limits for certain futures and option contracts in the
27
major energy markets and for swaps that are their economic equivalents. Certain bona fide hedging transactions or positions would be exempt from these position limits. The CFTC adopted these proposed regulations with modifications on October 18, 2011, but it is not possible at this time to predict when these regulations will take effect. The financial reform legislation may also require us to comply with margin requirements and with certain clearing and trade-execution requirements in connection with our derivatives activities, although the application of those provisions to us is uncertain at this time. The Dodd-Frank Act may also require the counterparties to our derivative instruments to spin off some of their derivatives activities to a separate entity, which may not be as creditworthy as the current counterparty. The Dodd-Frank Act and any new regulations could significantly increase the cost of derivatives contracts (including through requirements to post collateral which could adversely affect our available liquidity), materially alter the terms of derivatives contracts, reduce the availability of derivatives to protect against risks we encounter, reduce our ability to monetize or restructure our existing derivatives contracts, and increase our exposure to less creditworthy counterparties. If we reduce our use of derivatives as a result of the legislation and regulations, our results of operations may become more volatile and our cash flows may be less predictable, which could adversely affect our ability to plan for and fund capital expenditures. Finally, the legislation was intended, in part, to reduce the volatility of oil and natural gas prices, which some legislators attributed to speculative trading in derivatives and commodity instruments related to oil and natural gas. Our revenues could therefore be adversely affected if a consequence of the legislation and regulations is to lower commodity prices. Any of these consequences could have a material adverse effect on our business, financial condition or results of operations.
Increased costs of capital could adversely affect our business.
Our business and operating results can be harmed by factors such as the availability, terms and cost of capital, increases in interest rates or a reduction in credit rating. Changes in any one or more of these factors could cause our cost of doing business to increase, limit our access to capital, limit our ability to pursue acquisition opportunities, reduce our cash flows available for drilling and place us at a competitive disadvantage. Recent and continuing disruptions and volatility in the global financial markets may lead to an increase in interest rates or a contraction in credit availability impacting our ability to finance our operations. We require continued access to capital. A significant reduction in the availability of credit could materially and adversely affect our ability to achieve our planned growth and operating results.
Our senior secured revolving credit facility contains certain covenants that may inhibit our ability to make certain investments, incur additional indebtedness and engage in certain other transactions, which could adversely affect our ability to meet our future goals.
Our senior secured revolving credit facility includes certain covenants that, among other things, restrict:
- •
- our investments, loans and advances and the payment of dividends and other restricted payments;
- •
- our incurrence of additional indebtedness;
- •
- the granting of liens, other than liens created pursuant to our senior secured revolving credit facility and certain
permitted liens;
- •
- mergers, consolidations and sales of all or a substantial part of our business or properties;
- •
- the hedging, forward sale or swap of our production of crude oil or natural gas or other commodities;
- •
- the sale of assets (other than production sold in the ordinary course of business); and
28
- •
- our capital expenditures.
Our senior secured revolving credit facility requires us to maintain certain financial ratios, such as leverage ratios. All of these restrictive covenants may restrict our ability to expand or pursue our business strategies. Our ability to comply with these and other provisions of our senior secured revolving credit facility may be impacted by changes in economic or business conditions, results of operations or events beyond our control. The breach of any of these covenants could result in a default under our senior secured revolving credit facility, in which case, depending on the actions taken by the lenders thereunder or their successors or assignees, such lenders could elect to declare all amounts borrowed under our senior secured revolving credit facility, together with accrued interest, to be due and payable. If we were unable to repay such borrowings or interest, our lenders could proceed against their collateral. If the indebtedness under our senior secured revolving credit facility were to be accelerated, our assets may not be sufficient to repay in full such indebtedness.
Our level of indebtedness may increase and reduce our financial flexibility.
Upon the completion of this offering, we expect to have no indebtedness outstanding and will have a borrowing capacity of approximately $85.0 million under our senior secured revolving credit facility. In the future, we may incur significant indebtedness in order to make future acquisitions or to develop our properties.
Our level of indebtedness could affect our operations in several ways, including the following:
- •
- a significant portion of our cash flows could be used to service our indebtedness;
- •
- a high level of debt would increase our vulnerability to general adverse economic and industry conditions;
- •
- the covenants contained in the agreements governing our outstanding indebtedness will limit our ability to borrow
additional funds, dispose of assets, pay dividends and make certain investments;
- •
- a high level of debt may place us at a competitive disadvantage compared to our competitors that are less leveraged and
who, therefore, may be able to take advantage of opportunities that our indebtedness would prevent us from pursuing;
- •
- our debt covenants may affect our flexibility in planning for, and reacting to, changes in the economy and in our
industry;
- •
- a high level of debt may make it more likely that a reduction in our borrowing base following a periodic redetermination
could require us to repay a portion of our then-outstanding bank borrowings; and
- •
- a high level of debt may impair our ability to obtain additional financing in the future for working capital, capital expenditures, acquisitions, general corporate or other purposes.
A high level of indebtedness increases the risk that we may default on our debt obligations. Our ability to meet our debt obligations and to reduce our level of indebtedness depends on our future performance. General economic conditions, oil and natural gas prices and financial, business and other factors affect our operations and our future performance. Many of these factors are beyond our control. We may not be able to generate sufficient cash flows to pay the interest on our debt and future working capital, borrowings or equity financing may not be available to pay or refinance such debt. Factors that will affect our ability to raise cash through an offering of our capital stock or a refinancing of our debt include financial market conditions, the value of our assets and our performance at the time we need capital.
In addition, our borrowing base under our senior secured revolving credit facility is subject to periodic redeterminations. We could be forced to repay a portion of our bank borrowings due to
29
redeterminations of our borrowing base. If we do not have sufficient funds and are otherwise unable to negotiate renewals of our borrowings or arrange new financing, we may have to sell significant assets. Any such sale could have a material adverse effect on our business, financial condition and results of operations.
The inability of one or more of our customers to meet their obligations to us may adversely affect our financial results.
Our principal exposures to credit risk are through receivables resulting from the sale of our natural gas, oil and natural gas liquids production to energy marketing companies, pipelines and other midstream companies and affiliates ($3.4 million in receivables at September 30, 2011) and joint interest receivables ($4.7 million at September 30, 2011).
We are subject to credit risk due to the concentration of our natural gas, oil and natural gas liquids receivables with several significant customers. This concentration of customers may impact our overall credit risk since these entities may be similarly affected by changes in economic and other conditions. For the year ended December 31, 2009, sales to two customers accounted for approximately 40% of our total revenues. For the year ended December 31, 2010, sales to four customers accounted for approximately 60% of our total revenues. We do not require our customers to post collateral. The inability or failure of our significant customers to meet their obligations to us or their insolvency or liquidation may adversely affect our financial results.
Joint interest receivables arise from billing entities who own a partial interest in the wells we operate. These entities participate in our wells primarily based on their ownership in leases on which we wish to drill. We have limited ability to control participation in our wells.
We may be subject to risks in connection with acquisitions and the integration of significant acquisitions may be difficult.
We periodically evaluate acquisitions of reserves, properties, prospects and leaseholds and other strategic transactions that appear to fit within our overall business strategy. The successful acquisition of producing properties requires an assessment of several factors, including:
- •
- recoverable reserves;
- •
- future oil and natural gas prices and their appropriate differentials;
- •
- development and operating costs; and
- •
- potential environmental and other liabilities.
The accuracy of these assessments is inherently uncertain. In connection with these assessments, we perform a review of the subject properties that we believe to be generally consistent with industry practices. Our review will not reveal all existing or potential problems nor will it permit us to become sufficiently familiar with the properties to fully assess their deficiencies and potential recoverable reserves. Inspections may not always be performed on every well, and environmental problems are not necessarily observable even when an inspection is undertaken. Even when problems are identified, the seller may be unwilling or unable to provide effective contractual protection against all or part of the problems. We often are not entitled to contractual indemnification for environmental liabilities and acquire properties on an "as is" basis. Significant acquisitions and other strategic transactions may involve other risks, including:
- •
- existing or potential problems or liabilities;
- •
- diversion of our management's attention to evaluating, negotiating and integrating significant acquisitions and strategic transactions;
30
- •
- challenge and cost of integrating acquired operations, information management and other technology systems and business
cultures with those of ours while carrying on our ongoing business;
- •
- difficulty associated with coordinating geographically separate organizations; and
- •
- challenge of attracting and retaining personnel associated with acquired operations.
The process of integrating operations could cause an interruption of, or loss of momentum in, the activities of our business. Members of our senior management may be required to devote considerable amounts of time to this integration process, which will decrease the time they will have to manage our business. If our senior management is not able to effectively manage the integration process, or if any significant business activities are interrupted as a result of the integration process, our business, financial condition and results of operations may be adversely affected.
If we fail to realize the anticipated benefits of a significant acquisition, our results of operations may be lower than we expect.
The success of a significant acquisition will depend, in part, on our ability to realize anticipated growth opportunities from combining the acquired assets or operations with those of ours. Even if a combination is successful, it may not be possible to realize the full benefits we may expect in estimated proved reserves, production volume, cost savings from operating synergies or other benefits anticipated from an acquisition or to realize these benefits within the expected time frame. Anticipated benefits of an acquisition may be offset by operating losses relating to changes in commodity prices, or in oil and natural gas industry conditions, or by risks and uncertainties relating to the exploratory prospects of the combined assets or operations, or an increase in operating or other costs or other difficulties. If we fail to realize the benefits we anticipate from an acquisition, our results of operations may be adversely affected.
We are, and from time to time may be, subject to legal proceedings and claims that could adversely affect our business, financial condition and results of operations.
We are, and from time to time in the future may be, subject to legal proceedings and claims brought by business partners, third party contractors, working interest owners, vendors and others relating to matters incidental to our business. As with all legal proceedings, no assurance can be provided as to the outcome of these matters. In general, legal proceedings could result in substantial costs and a diversion of our management's attention and resources. We may not be successful in the defense of these legal proceedings, which could result in settlements or damages that could adversely affect our business, financial condition and results of operations. See "Business—Legal Proceedings."
We may incur losses as a result of title defects in the properties in which we invest.
In many instances, we acquire oil and gas leases or interests without incurring the expense of retaining lawyers to examine the title to the mineral interest. Rather, we rely upon the judgment of oil and gas lease brokers or landmen who perform the fieldwork in examining records in the appropriate governmental office before attempting to acquire a lease in a specific mineral interest.
Prior to the drilling of an oil or gas well, however, it is the normal practice in our industry for the person or company acting as the operator of the well to obtain a preliminary title review to ensure there are no obvious defects in title to the well. Frequently, as a result of such examinations, certain curative work must be done to correct defects in the marketability of the title, and such curative work entails expense. Our failure to cure any title defects may adversely impact our ability in the future to increase production and reserves. There is no assurance that we will not suffer a monetary loss from title defects or title failure. Additionally, undeveloped acreage has greater risk of title defects than
31
developed acreage. If there are any title defects or defects in assignment of leasehold rights in properties in which we hold an interest, we will suffer a financial loss.
Risks Relating to this Offering and Our Common Stock
The initial public offering price of our common stock may not be indicative of the market price of our common stock after this offering. In addition, an active liquid trading market for our common stock may not develop and our stock price may be volatile.
Prior to this offering, our common stock was not traded on any market. An active and liquid trading market for our common stock may not develop or be maintained after this offering. Liquid and active trading markets usually result in less price volatility and more efficiency in carrying out investors' purchase and sale orders. The market price of our common stock could vary significantly as a result of a number of factors, some of which are beyond our control. In the event of a drop in the market price of our common stock, you could lose a substantial part or all of your investment in our common stock. The initial public offering price was determined by negotiations between us and the representatives of the underwriters, based on numerous factors which we discuss in the "Underwriting" section of this prospectus, and may not be indicative of the market price of our common stock after this offering. Consequently, you may not be able to sell shares of our common stock at prices equal to or greater than the price you paid in this offering.
The following factors could affect the market price of our common stock:
- •
- our operating and financial performance, our number of drilling locations and our reserve estimates;
- •
- quarterly variations in the rate of growth of our financial indicators, such as net income per share, net income and
revenues;
- •
- changes in revenues or earnings estimates or publication of reports by equity research analysts;
- •
- speculation in the press or investment community;
- •
- sales of our common stock by us or our stockholders, or the perception that such sales may occur;
- •
- general market conditions, including fluctuations in commodity prices; and
- •
- domestic and international economic, legal and regulatory factors unrelated to our performance.
The stock markets in general have experienced extreme volatility that has often been unrelated to the operating performance of particular companies. These broad market fluctuations may adversely affect the market price of our common stock.
Purchasers of common stock in this offering will experience immediate and substantial dilution.
Purchasers of our common stock in this offering will experience an immediate and substantial dilution of $ per share in the pro forma as adjusted net tangible book value per share of common stock from the assumed initial public offering price of $ per share. Our pro forma as adjusted net tangible book value as of September 30, 2011 after giving effect to this offering would be $ per share. See "Dilution" for a complete description of the calculation of the net tangible book value of our common stock.
32
Because we are a relatively small company, the requirements of being a public company, including compliance with the reporting requirements of the Exchange Act and the requirements of the Sarbanes-Oxley Act of 2002 and the Dodd-Frank Act, may strain our resources, increase our costs and distract management; and we may be unable to comply with these requirements in a timely or cost-effective manner.
As a public company with listed equity securities, we will need to comply with laws, regulations and requirements, certain corporate governance provisions of the Sarbanes-Oxley Act of 2002, or the Sarbanes-Oxley Act, related regulations of the SEC, the Dodd-Frank Act and the requirements of the NASDAQ National Market, or NASDAQ, with which we are not required to comply as a private company. Complying with these statutes, regulations and requirements will occupy a significant amount of time of our board of directors and management and will significantly increase our costs and expenses. We will need to:
- •
- institute a more comprehensive compliance function;
- •
- design, establish, evaluate and maintain a system of internal controls over financial reporting in compliance with the
requirements of Section 404 of the Sarbanes-Oxley Act and the related rules and regulations of the SEC and the Public Company Accounting Oversight Board;
- •
- comply with rules promulgated by NASDAQ;
- •
- prepare and distribute periodic public reports in compliance with our obligations under the federal securities laws;
- •
- establish new internal policies, such as those relating to disclosure controls and procedures and insider trading;
- •
- involve and retain to a greater degree outside counsel and accountants in the above activities; and
- •
- establish an investor relations function.
In addition, we also expect that being a public company subject to these rules and regulations will require us to accept less director and officer liability insurance coverage than we desire or to incur substantial costs to obtain coverage. These factors could also make it more difficult for us to attract and retain qualified members of our board of directors, particularly to serve on our audit committee, and qualified executive officers.
If we fail to maintain effective internal control over financial reporting, our ability to accurately report our financial results and become compliant with the Sarbanes-Oxley Act could be adversely affected.
We are not currently required to comply with the SEC's rules implementing Section 404 of the Sarbanes-Oxley Act, and are therefore not required to make a formal assessment of the effectiveness of our internal control over financial reporting for that purpose. Upon becoming a public company, we will be required to comply with the SEC's rules implementing Section 302 of the Sarbanes-Oxley Act, which will require our management to certify financial and other information in our quarterly and annual reports and provide an annual management report on the effectiveness of our internal control over financial reporting. We will not be required to make our first assessment of our internal control over financial reporting until the year following our first annual report required to be filed with the SEC. To comply with the requirements of being a public company, we may need to upgrade our systems, including information technology, implement additional financial and management controls, reporting systems and procedures and hire additional accounting, finance and legal staff.
Our efforts to further develop and maintain our internal controls may not be successful, and we may be unable to maintain effective controls over our financial processes and reporting in the future and comply with the certification and reporting obligations under Sections 302 and 404 of the
33
Sarbanes-Oxley Act. Any failure to develop or maintain effective controls, or any difficulties encountered in our implementation or improvement of our internal controls over financial reporting could result in material misstatements that are not prevented or detected on a timely basis, which could potentially subject us to sanctions or investigations by the SEC, NASDAQ or other regulatory authorities. Ineffective internal controls could also cause investors to lose confidence in our reported financial information.
We do not intend to declare, and we are currently prohibited from paying, dividends on our common stock and, consequently, your only opportunity to achieve a return on your investment is if the price of our stock appreciates.
We do not intend to declare dividends on shares of our common stock in the foreseeable future. Additionally, we are currently prohibited from paying any cash dividends on our common stock pursuant to the terms of our senior secured revolving credit facility. Consequently, your only opportunity to achieve a return on your investment in us will be if the market price of our common stock appreciates, which may not occur, and you sell your shares at a profit. There is no guarantee that the price of our common stock that will prevail in the market after this offering will ever exceed the price that you pay.
Future sales of our common stock in the public market could lower our stock price, and subsequent issuances of our common stock or convertible securities may dilute your ownership in us.
After the completion of this offering, we will have outstanding shares of common stock (assuming the underwriters exercise their over-allotment option in full). We may issue additional shares of common stock or securities convertible into common stock. Following the completion of this offering, Yorktown will own shares, or approximately % of our outstanding shares, and certain of our other affiliates will own shares, or approximately % of our outstanding shares, all of which are restricted from immediate resale under the federal securities laws and are subject to the lock-up agreements between such parties and the underwriters described in "Underwriting," but may be sold into the market in the future. The holders of the remaining shares, or approximately % of our outstanding shares, are not subject to lock-up agreements and, subject to compliance with Rule 144 under the Securities Act, such holders may sell their shares into the public market.
As soon as practicable after this offering, we intend to file a registration statement with the SEC on Form S-8 providing for the registration of shares of our common stock issued or reserved for issuance under our 2011 Long Term Incentive Plan and our 2012 Long Term Incentive Plan. Subject to the satisfaction of vesting conditions and the expiration of lock-up agreements, shares registered under this registration statement on Form S-8 will be available for resale immediately in the public market without restriction.
We cannot predict the size of future issuances of our common stock or the effect, if any, that future issuances and sales of shares of our common stock will have on the market price of our common stock. Future issuances or sales of substantial amounts of our common stock (including shares issued in connection with an acquisition), or the perception that such issuances or sales could occur, may adversely affect prevailing market prices of our common stock and may dilute your percentage ownership in us.
34
Our amended and restated certificate of incorporation and amended and restated bylaws, as well as Delaware law, contain provisions that could discourage acquisition bids or merger proposals, which may adversely affect the market price of our common stock.
Our amended and restated certificate of incorporation will authorize our board of directors to issue preferred stock without stockholder approval. If our board of directors elects to issue preferred stock, it could be more difficult for a third party to acquire us. In addition, some provisions of our amended and restated certificate of incorporation and amended and restated bylaws could make it more difficult for a third party to acquire control of us, even if the change of control would be beneficial to our stockholders, including:
- •
- a classified board of directors, so that only approximately one-third of our directors are elected each year;
- •
- limitations on the removal of directors;
- •
- limitations on the ability of our stockholders to call special meetings; and
- •
- advance notice provisions for stockholder proposals and nominations for elections to the board of directors to be acted upon at meetings of stockholders.
Delaware law prohibits us from engaging in any business combination with any "interested stockholder," meaning generally that a stockholder who beneficially owns more than 15% of our stock cannot acquire us for a period of three years from the date this person became an interested stockholder, unless various conditions are met, such as approval of the transaction by our board of directors. See "Description of Capital Stock—Anti-Takeover Effects of Provisions of Our Amended and Restated Certificate of Incorporation, Our Amended and Restated Bylaws and Delaware Law."
The concentration of our capital stock ownership among our largest stockholders and their affiliates will limit your ability to influence corporate matters.
Upon completion of this offering, Yorktown will own approximately % of our outstanding common stock (based on an assumed initial public offering price of $ per share). Consequently, Yorktown will continue to have significant influence over all matters that require approval by our stockholders, including the election of directors and approval of significant corporate transactions. This concentration of ownership will limit your ability to influence corporate matters, and as a result, actions may be taken that you may not view as beneficial.
Furthermore, conflicts of interest could arise in the future between us, on the one hand, and Yorktown or any other of its portfolio companies, on the other hand, concerning among other things, potential competitive business activities or business opportunities. Yorktown is a New York-based private investment firm focused on making investments in energy and energy-related companies. As a result, Yorktown's existing and future portfolio companies which it controls may compete with us for investment or business opportunities. These conflicts of interest may not be resolved in our favor.
Our amended and restated certificate of incorporation contains a provision renouncing our interest and expectancy in certain corporate opportunities, which could adversely affect our business or prospects.
Our amended and restated certificate of incorporation will provide that, to the fullest extent permitted by applicable law, we renounce any interest or expectancy in, or in being offered an opportunity to participate in, any business opportunity that may be from time to time presented to any of our non-employee directors, Yorktown or any other investment fund sponsored or managed by Yorktown, including any fund still to be formed, any affiliate or subsidiary of Yorktown, any other investment fund sponsored or managed by Yorktown or any director, officer or employee of the company who is also concurrently a director, officer or employee of an affiliate, subsidiary or designee
35
of Yorktown or any other investment fund sponsored or managed by Yorktown, including any fund still to be formed or business opportunities that such parties participate in or desire to participate in, even if the opportunity is one that we might reasonably have pursued or had the ability or desire to pursue if granted the opportunity to do so, and no such person shall be liable to us for breach of any fiduciary or other duty, as a director or officer or controlling stockholder or otherwise, by reason of the fact that such person pursues or acquires any such business opportunity, directs any such business opportunity to another person or fails to present any such business opportunity, or information regarding any such business opportunity, to us unless, in the case of any such person who is our director or officer, any such business opportunity is expressly offered to such director or officer solely in his or her capacity as our director or officer.
As a result, one of our non-employee directors, Yorktown, other investment funds sponsored or managed by Yorktown, including any fund still to be formed, or their respective affiliates may become aware, from time to time, of certain business opportunities, such as acquisition opportunities, and may direct such opportunities to other businesses in which they have invested, in which case we may not become aware of or otherwise have the ability to pursue such opportunity. Further, such businesses may choose to compete with us for these opportunities. As a result, by renouncing our interest and expectancy in any business opportunity that may be from time to time presented to our non-employee directors, Yorktown, other investment funds sponsored or managed by Yorktown, including any fund still to be formed, or their respective affiliates, our business or prospects could be adversely affected if attractive business opportunities are procured by such parties for their own benefit rather than for ours. See "Certain Relationships and Related Party Transactions—Corporate Opportunities Renunciation."
We expect to be a "controlled company" within the meaning of NASDAQ rules and, if applicable, would qualify for and will rely on exemptions from certain corporate governance requirements.
Because Yorktown will own a majority of our outstanding common stock following the completion of this offering, we expect to be a "controlled company" as that term is set forth in NASDAQ Rule 5616(c)(2). Under the NASDAQ rules, a company of which more than 50% of the voting power is held by another person or group of persons acting together is a "controlled company" and may elect not to comply with certain NASDAQ corporate governance requirements, including:
- •
- the requirement that a majority of our board of directors consist of independent directors;
- •
- the requirement that our nominating and corporate governance committee be composed entirely of independent directors with
a written charter addressing the committee's purpose and responsibilities; and
- •
- the requirement that our compensation committee be composed entirely of independent directors with a written charter addressing the committee's purpose and responsibilities.
These requirements will not apply to us as long as we remain a "controlled company." Following this offering, we may utilize some or all of these exemptions. Accordingly, you may not have the same protections afforded to stockholders of companies that are subject to all of the corporate governance requirements of NASDAQ. Yorktown's significant ownership interest could adversely affect investors' perceptions of our corporate governance.
36
CAUTIONARY NOTE REGARDING FORWARD-LOOKING STATEMENTS
This prospectus contains forward-looking statements that are subject to a number of risks and uncertainties, many of which are beyond our control. All statements, other than statements of historical fact included in this prospectus, regarding our strategy, future operations, financial position, estimated revenues and losses, projected costs, prospects, plans and objectives of management are forward-looking statements. When used in this prospectus, the words "could," "believe," "anticipate," "intend," "estimate," "expect," "may," "continue," "predict," "potential," "project" and similar expressions are intended to identify forward-looking statements, although not all forward-looking statements contain such identifying words.
Forward-looking statements may include statements about our:
- •
- business strategy;
- •
- reserves;
- •
- technology;
- •
- cash flows and liquidity;
- •
- financial strategy, budget, projections and operating results;
- •
- oil and natural gas realized prices;
- •
- timing and amount of future production of oil and natural gas;
- •
- availability of drilling, completion and production equipment;
- •
- availability of oilfield labor;
- •
- the amount, nature and timing of capital expenditures, including future development costs;
- •
- availability and terms of capital;
- •
- drilling of wells;
- •
- competition and government regulations;
- •
- marketing of oil and natural gas;
- •
- exploitation or property acquisitions;
- •
- costs of exploiting and developing our properties and conducting other operations;
- •
- general economic conditions;
- •
- competition in the oil and natural gas industry;
- •
- effectiveness of our risk management activities;
- •
- environmental liabilities;
- •
- counterparty credit risk;
- •
- governmental regulation and taxation of the oil and natural gas industry;
- •
- developments in oil-producing and natural gas-producing countries;
- •
- uncertainty regarding our future operating results;
- •
- estimated future net reserves and present value thereof; and
- •
- plans, objectives, expectations and intentions contained in this prospectus that are not historical.
37
All forward-looking statements speak only as of the date of this prospectus. You should not place undue reliance on these forward-looking statements. Although we believe that our plans, intentions and expectations reflected in or suggested by the forward-looking statements we make in this prospectus are reasonable, we can give no assurance that these plans, intentions or expectations will be achieved. We disclose important factors that could cause our actual results to differ materially from our expectations under "Risk Factors" and "Management's Discussion and Analysis of Financial Condition and Results of Operations" and elsewhere in this prospectus. These cautionary statements qualify all forward-looking statements attributable to us or persons acting on our behalf.
38
We will receive net proceeds of approximately $ million from the sale of the common stock by us in this offering, assuming an initial public offering price of $ per share and after deducting estimated expenses and underwriting discounts and commissions of approximately $ million. If the underwriters' over-allotment is exercised in full, we estimate that our net proceeds will be approximately $ million.
We intend to use the net proceeds from this offering to (i) repay all outstanding indebtedness under our senior secured revolving credit facility, approximately $60.0 million of which was outstanding on December 31, 2011, (ii) repay the $30.0 million of outstanding debt under and retire our second lien term loan facility and (iii) fund our drilling program and for general corporate purposes. We have the ability to re-borrow amounts repaid under our senior secured revolving credit facility for working capital or other purposes. We intend to use the following amounts for the above uses:
Use of Proceeds
|
Amount | |||
|---|---|---|---|---|
| |
(in millions) |
|||
Repayment of senior secured revolving credit facility |
$ | |||
Repayment of second lien term loan facility |
||||
Drilling program and general corporate purposes |
||||
Total |
$ | |||
Our senior secured revolving credit facility matures in January 2016, and our borrowings bear interest at a variable rate, which was approximately 2.80% per annum as of December 31, 2011. Our outstanding borrowings under our senior secured revolving credit facility were incurred to fund exploration, development and other capital expenditures. Affiliates of certain of the underwriters are lenders under our senior secured revolving credit facility and second lien term loan facility and, accordingly, will receive a portion of the proceeds from this offering. See "Underwriting." We will pay all expenses related to this offering.
An increase or decrease in the initial public offering price of $1.00 per share of common stock would cause the net proceeds that we will receive from this offering, after deducting estimated expenses and underwriting discounts and commissions, to increase or decrease, as applicable, by approximately $ million.
39
We do not anticipate declaring or paying any cash dividends to holders of our common stock in the foreseeable future. We currently intend to retain future earnings, if any, to finance the expansion of our business. Our future dividend policy is within the discretion of our board of directors and will depend upon various factors, including our results of operations, financial condition, capital requirements and investment opportunities. In addition, our senior secured revolving credit facility prohibits us from paying cash dividends on our common stock, and we may enter into debt agreements in the future that also prohibit our ability to declare or pay cash dividends on our common stock.
40
The following table sets forth our cash and cash equivalents and our capitalization as of September 30, 2011:
- •
- on an actual basis;
- •
- on an as adjusted basis to give effect to the following transactions, all of which occurred or will occur subsequent to
September 30, 2011: (i) the issuance of 250,000 shares of our common stock to Yorktown for $30.0 million; (ii) the conversion of our Series A Convertible Preferred
Stock into 875,000 shares of our common stock; (iii) the acquisition of additional Powder River Basin acreage for $13.5 million in cash and a $13.5 million note payable;
(iv) the extinguishment of $9.9 million of stockholder notes receivable and related accrued interest in exchange for the return of 82,448 shares of our common stock; (v) the
issuance of 61,444 restricted shares of common stock that will occur prior to the closing of this offering; and (vi) the repurchase of 64,409 shares of Cima common stock and fractional shares
resulting from Cima's 500 for one reverse common stock split for approximately $7.7 million; and
- •
- on an as further adjusted basis to give effect to (i) our for one common stock split to be effected in the form of a stock dividend concurrently with the closing of this offering, (ii) the issuance of 53,420 restricted shares of common stock that will occur concurrently with the closing of this offering and (iii) this offering and the application of the net proceeds as described in "Use of Proceeds."
You should read the following table in conjunction with "Use of Proceeds," "Selected Historical Consolidated Financial Data," "Management's Discussion and Analysis of Financial Condition and Results of Operations" and our historical consolidated financial statements and related notes thereto appearing elsewhere in this prospectus.
| |
As of September 30, 2011 | |||||||||
|---|---|---|---|---|---|---|---|---|---|---|
| |
Actual | As Adjusted | As Further Adjusted |
|||||||
| |
($ in thousands, except per-share amounts) |
|||||||||
Cash and cash equivalents |
$ | 27,489 | $ | 36,260 | $ | |||||
Long-term debt, including current maturities: |
||||||||||
Senior secured revolving credit facility |
$ | 53,000 | $ | 53,000 | $ | |||||
Second lien term loan facility |
30,000 | 30,000 | ||||||||
Acquisition notes payable, net of discount of $329 |
6,348 | 19,848 | ||||||||
Total long-term debt |
89,348 | 102,848 | ||||||||
Stockholders' Equity: |
||||||||||
Series A Convertible Preferred Stock—$0.10 par value per share, 625,000 shares authorized (actual), shares authorized (as adjusted and as further adjusted); 525,000 shares issued and outstanding (actual), no shares issued and outstanding (as adjusted and as further adjusted) |
53 | — | ||||||||
Common stock—$0.10 par value per share, 4,075,000 shares authorized (actual), shares authorized (as adjusted and as further adjusted); 3,448,622 shares issued and outstanding (actual), 4,488,209 shares issued and outstanding (as adjusted) and shares issued and outstanding (as further adjusted) |
345 | 449 | ||||||||
Additional paid-in capital |
405,795 | 467,494 | ||||||||
Notes receivable from stockholders |
(37,310 | ) | (27,416 | ) | ||||||
Accumulated deficit |
(182,398 | ) | (231,771 | ) | ||||||
Total stockholders' equity |
186,485 | 208,756 | ||||||||
Total capitalization |
$ | 275,833 | $ | 311,604 | $ | |||||
41
Purchasers of the common stock in this offering will experience immediate and substantial dilution in the net tangible book value per share of the common stock for accounting purposes. Our net tangible book value as of September 30, 2011 was approximately $ million, or $ per share of common stock. Pro forma net tangible book value per share is determined by dividing our pro forma tangible net worth (tangible assets less total liabilities) by the total number of outstanding shares of common stock that will be outstanding immediately prior to the closing of this offering, including giving effect to the following transactions, all of which occurred or will occur subsequent to September 30, 2011: (i) the issuance of 250,000 shares of our common stock to Yorktown for $30.0 million; (ii) the conversion of our Series A Convertible Preferred Stock into 875,000 shares of our common stock; (iii) the acquisition of additional Powder River Basin acreage for $13.5 million in cash and a $13.5 million note payable; (iv) the extinguishment of $9.9 million of stockholder notes receivable and related accrued interest in exchange for the return of 82,448 shares of our common stock; (v) the issuance of 61,444 restricted shares of common stock that will occur prior to the closing of this offering; and (vi) the repurchase of 64,409 shares of Cima common stock and fractional shares resulting from Cima's 500 for one reverse common stock split for approximately $7.7 million. After giving effect to (i) our for one common stock split to be effected in the form of a stock dividend concurrently with the closing of this offering, (ii) the issuance of 53,420 restricted shares of common stock that will occur concurrently with the closing of this offering and (iii) the sale of the shares of common stock in this offering and further assuming the receipt of the estimated net proceeds (after deducting estimated discounts and expenses of this offering), our adjusted pro forma net tangible book value as of September 30, 2011 would have been approximately $ million, or $ per share. This represents an immediate increase in the net tangible book value of $ per share to our existing stockholders and an immediate dilution (i.e., the difference between the offering price and the adjusted pro forma net tangible book value after this offering) to new investors purchasing shares in this offering of $ per share. All per share amounts in this section have been adjusted for our for one common stock split to be effected in the form of a stock dividend concurrently with the closing of this offering. The following table illustrates the per share dilution to new investors purchasing shares in this offering:
Assumed initial public offering price per share |
$ | |||
Pro forma net tangible book value per share as of September 30, 2011 |
||||
Increase per share attributable to new investors in this offering |
||||
As adjusted pro forma net tangible book value per share after giving effect to this offering |
||||
Dilution in pro forma net tangible book value per share to new investors in this offering |
$ |
|||
The following table summarizes, on an as adjusted pro forma basis as of September 30, 2011, the total number of shares of common stock owned by existing stockholders and to be owned by new investors, the total consideration paid and the average price per share paid by our existing stockholders and to be paid by new investors in this offering, calculated before deduction of estimated underwriting discounts and commissions:
| |
Shares Acquired | Total Consideration | |
|||||||||||||
|---|---|---|---|---|---|---|---|---|---|---|---|---|---|---|---|---|
| |
Average Price Per Share |
|||||||||||||||
| |
Number | Percent | Amount | Percent | ||||||||||||
Existing stockholders(1)(2) |
$ | $ | ||||||||||||||
New investors |
||||||||||||||||
Total |
$ | $ | ||||||||||||||
- (1)
- The total consideration and average price per share represents the consideration paid in connection with our acquisition of Cima. See "Management's Discussion and Analysis of Financial
42
Condition and Results of Operations—Recent Developments—Acquisition of Cima Resources, Inc."
- (2)
- The number of shares of common stock presented above for the existing stockholders includes 114,864 restricted shares of common stock to be issued concurrently with the closing of this offering. See "Executive Compensation and Other Information—Compensation Discussion and Analysis—Elements of Compensation—Equity-Based Incentive Awards."
43
SELECTED HISTORICAL CONSOLIDATED FINANCIAL DATA
Set forth below is our selected historical consolidated financial data for the periods indicated. The historical consolidated financial data for the periods ended December 31, 2008, 2009 and 2010 and the balance sheet data as of December 31, 2009 and 2010 have been derived from our audited consolidated financial statements included elsewhere in this prospectus. The historical consolidated balance sheet data as of December 31, 2008 has been derived from our audited financial statements not included in the prospectus. The historical consolidated financial data as of and for the periods ended December 31, 2006 and 2007 has been derived from our accounting records. The historical consolidated financial data for the nine months ended September 30, 2010 and 2011 and the balance sheet data as of September 30, 2010 and 2011 have been derived from our unaudited consolidated financial statements included elsewhere in this prospectus which, in our opinion, have been prepared on a basis consistent with our audited consolidated financial statements and include all adjustments, consisting of normal recurring adjustments, necessary for a fair presentation of our financial position and results of operations for the interim periods presented.
You should read the following selected historical consolidated financial data in conjunction with "Management's Discussion and Analysis of Financial Condition and Results of Operations" and our historical consolidated financial statements and related notes thereto included elsewhere in this prospectus. The financial information included in this prospectus may not be indicative of our future results of operations, financial position and cash flows.
44
| |
Year Ended December 31, | Nine Months Ended September 30, |
||||||||||||||||||||
|---|---|---|---|---|---|---|---|---|---|---|---|---|---|---|---|---|---|---|---|---|---|---|
| |
2006 | 2007 | 2008 | 2009 | 2010 | 2010 | 2011 | |||||||||||||||
| |
(in thousands) |
|||||||||||||||||||||
Statement of Operations Data: |
||||||||||||||||||||||
Revenues: |
||||||||||||||||||||||
Natural gas sales |
$ | 23,675 | $ | 16,663 | $ | 13,978 | $ | 12,079 | $ | 23,453 | $ | 17,144 | $ | 21,679 | ||||||||
Oil sales |
8,408 | 6,108 | 5,477 | 2,539 | 3,723 | 1,949 | 14,191 | |||||||||||||||
Natural gas liquids sales |
1,473 | 926 | 1,290 | 834 | 964 | 703 | 603 | |||||||||||||||
Total revenues |
33,556 | 23,697 | 20,745 | 15,452 | 28,140 | 19,796 | 36,473 | |||||||||||||||
Operating expenses: |
||||||||||||||||||||||
Lease operating |
4,779 | 4,752 | 4,326 | 4,947 | 6,687 | 4,849 | 6,812 | |||||||||||||||
Workovers |
2,320 | 1,330 | 3,434 | 764 | 1,993 | 2,085 | 511 | |||||||||||||||
Severance and ad valorem taxes |
1,590 | 1,313 | 1,287 | 1,265 | 1,803 | 1,260 | 2,399 | |||||||||||||||
Exploration |
12,679 | 24,967 | 6,839 | 1,547 | 3,579 | 3,363 | 4,154 | |||||||||||||||
Depletion, depreciation and amortization |
18,735 | 11,805 | 7,130 | 13,208 | 17,288 | 11,138 | 23,981 | |||||||||||||||
Impairment of natural gas and oil properties |
5,573 | 7,335 | 4,536 | 7,963 | 20,788 | 6,077 | 24,545 | |||||||||||||||
General and administrative |
6,870 | 9,303 | 9,083 | 25,700 | 16,711 | 12,294 | 17,899 | |||||||||||||||
Total operating expenses |
52,546 | 60,805 | 36,635 | 55,394 | 68,849 | 41,066 | 80,301 | |||||||||||||||
Operating loss |
(18,990 |
) |
(37,108 |
) |
(15,890 |
) |
(39,942 |
) |
(40,709 |
) |
(21,270 |
) |
(43,828 |
) |
||||||||
Other income (expense): |
||||||||||||||||||||||
Gain on property sales |
2,058 | 2,375 | 168 | 46 | 802 | 809 | 282 | |||||||||||||||
Gain on derivative instruments |
— | — | — | 63 | 7,865 | 8,222 | 5,137 | |||||||||||||||
Interest expense |
(211 | ) | (681 | ) | (425 | ) | (4,582 | ) | (6,787 | ) | (5,049 | ) | (5,154 | ) | ||||||||
Other income (expense) |
1,205 | 711 | 746 | 160 | (566 | ) | (577 | ) | (41 | ) | ||||||||||||
Total other income (expense) |
3,052 | 2,405 | 489 | (4,313 | ) | 1,314 | 3,405 | 224 | ||||||||||||||
Loss from continuing operations before taxes |
(15,938 |
) |
(34,703 |
) |
(15,401 |
) |
(44,255 |
) |
(39,395 |
) |
(17,865 |
) |
(43,604 |
) |
||||||||
Income tax (expense) benefit |
273 | 3,639 | (16 | ) | (33 | ) | (13 | ) | — | — | ||||||||||||
Loss from continuing operations |
(15,665 |
) |
(31,064 |
) |
(15,417 |
) |
(44,288 |
) |
(39,408 |
) |
(17,865 |
) |
(43,604 |
) |
||||||||
Income from discontinued operations |
— |
— |
— |
2,150 |
5,912 |
5,232 |
9,987 |
|||||||||||||||
Net loss |
(15,665 |
) |
(31,064 |
) |
(15,417 |
) |
(42,138 |
) |
(33,496 |
) |
(12,633 |
) |
(33,617 |
) |
||||||||
Less: net loss attributable to non-controlling interests |
— |
— |
— |
1,365 |
— |
— |
— |
|||||||||||||||
Net loss attributable to Cinco Resources, Inc. stockholders |
$ |
(15,665 |
) |
$ |
(31,064 |
) |
$ |
(15,417 |
) |
$ |
(40,773 |
) |
$ |
(33,496 |
) |
$ |
(12,633 |
) |
$ |
(33,617 |
) |
|
| |
|
|
|
|
|
As of September 30, 2011 | |||||||||||||||||||
|---|---|---|---|---|---|---|---|---|---|---|---|---|---|---|---|---|---|---|---|---|---|---|---|---|---|
| |
As of December 31, | ||||||||||||||||||||||||
| |
|
|
As Further Adjusted(2) |
||||||||||||||||||||||
| |
2006 | 2007 | 2008 | 2009 | 2010 | Actual | As Adjusted(1) | ||||||||||||||||||
| |
(in thousands) |
||||||||||||||||||||||||
Balance Sheet Data: |
|||||||||||||||||||||||||
Cash and cash equivalents |
$ | 20,773 | $ | 7,608 | $ | 18,841 | $ | 9,647 | $ | 37,982 | $ | 27,489 | $ | 36,260 | $ | ||||||||||
Net property and equipment |
97,001 | 76,652 | 93,157 | 156,361 | 227,452 | 274,739 | 301,739 | ||||||||||||||||||
Total assets |
139,660 | 93,693 | 119,966 | 204,761 | 308,116 | 319,796 | 355,567 | ||||||||||||||||||
Long-term debt, net of current maturities |
— | 5,000 | — | 70,700 | 86,000 | 87,164 | 87,164 | ||||||||||||||||||
Total stockholders' equity |
94,300 | 69,262 | 85,698 | 102,524 | 161,187 | 186,485 | 208,756 | ||||||||||||||||||
45
| |
Year Ended December 31, | Nine Months Ended September 30, |
||||||||||||||||||||
|---|---|---|---|---|---|---|---|---|---|---|---|---|---|---|---|---|---|---|---|---|---|---|
| |
2006 | 2007 | 2008 | 2009 | 2010 | 2010 | 2011 | |||||||||||||||
| |
(in thousands) |
|||||||||||||||||||||
Other Financial Data: |
||||||||||||||||||||||
Net cash provided by (used in) operating activities |
$ | 12,612 | $ | 699 | $ | 7,312 | $ | (40,027 | ) | $ | 14,734 | $ | 8,076 | $ | 14,438 | |||||||
Net cash used in investing activities |
(62,058 | ) | (21,397 | ) | (32,244 | ) | (25,153 | ) | (84,619 | ) | (59,177 | ) | (72,719 | ) | ||||||||
Net cash provided by financing activities |
35,190 | 7,533 | 36,165 | 55,986 | 98,220 | 56,331 | 47,788 | |||||||||||||||
Adjusted EBITDAX(3) |
18,025 | 8,030 | 4,440 | (11,970 | ) | 14,215 | 8,487 | 22,188 | ||||||||||||||
- (1)
- Gives
effect to the following transactions, all of which occurred or will occur subsequent to September 30, 2011: (i) the issuance of 250,000
shares of our common stock to Yorktown for $30.0 million; (ii) the conversion of our Series A Convertible Preferred Stock into 875,000 shares of our common stock; (iii) the
acquisition of additional Powder River Basin acreage for $13.5 million in cash and a $13.5 million note payable; (iv) the extinguishment of $9.9 million of stockholder
notes receivable and related accrued interest in exchange for the return of 82,448 shares of our common stock; (v) the issuance of 61,444 restricted shares of common stock that will occur prior
to the closing of this offering; and (vi) the repurchase of 64,409 shares of Cima common stock and fractional shares resulting from Cima's 500 for one reverse common stock split for
approximately $7.7 million.
- (2)
- Gives
effect to (i) a for one stock split of our common stock to be effected in the form of a stock dividend concurrently with the
closing of this offering, (ii) the issuance of 53,420 restricted shares of common stock that will occur concurrently with the closing of this offering and (iii) this offering and the
application of the net proceeds as described in "Use of Proceeds."
- (3)
- Adjusted
EBITDAX is a supplemental non-GAAP financial measure that is used by management and external users of our consolidated financial
statements, such as industry analysts, investors, lenders and rating agencies. We define Adjusted EBITDAX as income or loss from continuing operations before interest expense, income tax expenses or
benefits, realized gains or losses on interest rate derivatives, depletion, depreciation, and amortization, property impairments, exploration expenses, unrealized derivative gains or losses, interest
and other income or expense, gains or losses on property sales and share-based compensation expense. Adjusted EBITDAX is not a measure of net income or loss as determined by GAAP. Our management
believes Adjusted EBITDAX is useful because it allows us to more effectively evaluate our operating performance and compare the results of our operations from period to period without regard to our
financing methods or capital structure. We exclude the items listed above from income or loss from continuing operations in arriving at Adjusted EBITDAX because these amounts can vary substantially
from company to company within our industry depending upon accounting methods and book values of assets, capital structures and the method by which the assets were acquired. Adjusted EBITDAX should
not be considered as an alternative to, or more meaningful than, income or loss from continuing operations as determined in accordance with GAAP or as an indicator of our operating performance.
Certain items excluded from Adjusted EBITDAX are significant components in understanding and assessing a company's financial performance, such as a company's cost of capital and tax structure, as well
as the historic costs of depreciable assets, none of which are components of Adjusted EBITDAX. Our computations of Adjusted EBITDAX may not be comparable to other similarly titled measures of other
companies. We believe that Adjusted EBITDAX is a widely followed measure of operating performance and may also be used by investors to measure our ability to meet debt service requirements.
The following table presents a reconciliation of the non-GAAP financial measure of Adjusted EBITDAX to the GAAP financial measure of loss from continuing operations.
| |
Year Ended December 31, | Nine Months Ended September 30, |
||||||||||||||||||||
|---|---|---|---|---|---|---|---|---|---|---|---|---|---|---|---|---|---|---|---|---|---|---|
| |
2006 | 2007 | 2008 | 2009 | 2010 | 2010 | 2011 | |||||||||||||||
| |
(in thousands) |
|||||||||||||||||||||
Adjusted EBITDAX reconciliation to loss from continuing operations: |
||||||||||||||||||||||
Loss from continuing operations |
$ | (15,665 | ) | $ | (31,064 | ) | $ | (15,417 | ) | $ | (44,288 | ) | $ | (39,408 | ) | $ | (17,865 | ) | $ | (43,604 | ) | |
Exploration |
12,679 |
24,967 |
6,839 |
1,547 |
3,579 |
3,363 |
4,154 |
|||||||||||||||
Depletion, depreciation and amortization |
18,735 | 11,805 | 7,130 | 13,208 | 17,288 | 11,138 | 23,981 | |||||||||||||||
Impairment of natural gas and oil properties |
5,573 | 7,335 | 4,536 | 7,963 | 20,788 | 6,077 | 24,545 | |||||||||||||||
Share-based compensation expense |
28 | 1,031 | 1,825 | 5,287 | 8,723 | 6,290 | 8,127 | |||||||||||||||
Gains on property sales |
(2,058 | ) | (2,375 | ) | (168 | ) | (46 | ) | (802 | ) | (809 | ) | (282 | ) | ||||||||
Realized loss on interest rate derivatives |
— | — | — | 340 | 978 | 723 | 752 | |||||||||||||||
Unrealized derivative gains |
— | — | — | (436 | ) | (4,297 | ) | (6,056 | ) | (680 | ) | |||||||||||
Interest expense |
211 | 681 | 425 | 4,582 | 6,787 | 5,049 | 5,154 | |||||||||||||||
Other (income) expense |
(1,205 | ) | (711 | ) | (746 | ) | (160 | ) | 566 | 577 | 41 | |||||||||||
Income tax expense (benefit) |
(273 | ) | (3,639 | ) | 16 | 33 | 13 | — | — | |||||||||||||
Adjusted EBITDAX |
$ | 18,025 | $ | 8,030 | $ | 4,440 | $ | (11,970 | ) | $ | 14,215 | $ | 8,487 | $ | 22,188 | |||||||
46
MANAGEMENT'S DISCUSSION AND ANALYSIS OF FINANCIAL CONDITION
AND RESULTS OF OPERATIONS
The following discussion and analysis of our financial condition and results of operations should be read in conjunction with our consolidated financial statements and related notes included elsewhere in this prospectus. The following discussion contains "forward-looking statements" that reflect our future plans, estimates, beliefs and expected performance. We caution that assumptions, expectations, projections, intentions or beliefs about future events may, and often do, vary from actual results and the differences can be material. Some of the key factors which could cause actual results to vary from our expectations include changes in oil and natural gas prices, the timing of planned capital expenditures, availability of acquisitions, uncertainties in estimating proved reserves and forecasting production results, operational factors affecting the commencement or maintenance of producing wells, the condition of the capital markets generally, as well as our ability to access them, the proximity to and capacity of transportation facilities, and uncertainties regarding environmental regulations or litigation and other legal or regulatory developments affecting our business, as well as those factors discussed below and elsewhere in this prospectus, all of which are difficult to predict. In light of these risks, uncertainties and assumptions, the forward-looking events discussed may not occur. See "Cautionary Note Regarding Forward-Looking Statements."
Overview
We are an independent exploration and production company focused on the acquisition, development and production of unconventional oil and natural gas resources. Our assets are located primarily in three core areas: the Eagle Ford Shale in South Texas, the Powder River Basin of Wyoming and the Woodford Shale in the Arkoma Basin of eastern Oklahoma. Our management and senior technical team has significant operational experience in these basins as well as in the geological zones we target for development. We have accumulated a balanced portfolio of properties between our more mature, gas-prone Woodford Shale properties and our oil-prone, less-developed properties in the Eagle Ford Shale and Powder River Basin. The majority of our Woodford Shale properties are held by production. We intend to focus our near-term activities on the development of our Eagle Ford Shale assets as well as further evaluation of our Powder River Basin properties.
From our inception in 2002 through 2008, we focused on the acquisition and development of conventional reserves in our historical core area of South Texas. In 2009, we acquired a private Arkoma Basin company that was primarily owned and controlled by Yorktown. This acquisition provided the majority of our current Arkoma Basin property base and included a significant acreage position in the Woodford Shale, which is an unconventional resource play. Unconventional resource plays typically involve a geologic formation that is productive over a larger area than a conventional reservoir but require more advanced techniques such as horizontal drilling and hydraulic fracturing to produce hydrocarbons in economic quantities. Subsequent to our entry into the Woodford Shale, we began to evaluate other unconventional opportunities that were potentially oil-prone, unlike the Woodford Shale, which is gas prone in our area. Based on these efforts, we have established positions in the Eagle Ford Shale of South Texas and the Powder River Basin of Wyoming, both active areas for the development of unconventional oil resources.
Since 2009, we have drilled and completed 35 gross Woodford Shale wells and 12 gross Eagle Ford Shale wells. Netherland, Sewell & Associates, Inc., our independent reserve engineers, estimated our proved reserves as of May 31, 2011 to be 222.5 Bcfe, of which 90% were natural gas and 33% were classified as proved developed reserves. For December 2011, our average net daily production was 30.0 MMcfed, of which 66% was natural gas. We exercise a high degree of operational control over our assets. We operated approximately 89% of our estimated proved reserves on a volume basis as of May 31, 2011 and approximately 90% of our average daily net production for December 2011.
47
Recent Developments
Acquisition of Cima. In November 2011, we acquired Cima. Prior to the acquisition, Cima was managed by our executive officers and was primarily owned and controlled by Yorktown. As consideration for the shares of Cima common stock we acquired, we issued 1,323,960 shares of our common stock to the former stockholders of Cima and 122,586 restricted shares of our common stock to our employees who held Cima restricted shares under Cima's stock incentive plan. As a result of this transaction, Cima became one of our wholly-owned subsidiaries. Our Eagle Ford Shale properties and the majority of our Powder River Basin properties were acquired as a result of the Cima acquisition.
Cinco Preferred Stock Conversion. In November 2011, Yorktown converted 525,000 shares of our Series A Convertible Preferred Stock into 875,000 shares of our common stock. This conversion took place immediately prior to our acquisition of Cima.
Yorktown Investment. In November 2011, Yorktown purchased an additional 250,000 shares of our common stock for $30.0 million. We used this additional capital to fund the initial $13.5 million purchase price payment on our November 2011 acquisition of Powder River Basin acreage and to support our ongoing drilling program.
Amendments to Credit Facilities. In December 2011, we amended our senior secured revolving credit facility and our second lien term loan facility. As amended, our $300.0 million senior secured revolving credit facility has an initial borrowing base of $85.0 million, a maturity date of January 4, 2016, and financial covenants substantially similar to our previous credit facility. We intend to use a portion of the proceeds from this offering to repay all amounts under our senior secured revolving credit facility and to repay all amounts under and retire our second lien term loan facility.
Known Trends and Uncertainties
The performance of our business is dependent on many factors that are difficult to predict and beyond our control including economic, political and regulatory developments.
Commodity prices. Natural gas and oil prices have historically been volatile. Since 2009 through November 2011, natural gas and oil prices, as quoted on the NYMEX, have ranged from a high of $6.14 per MMBtu of natural gas and $108.15 per Bbl of oil to a low of $2.84 per MMBtu of natural gas and $33.87 per Bbl of oil. While we utilize derivative instruments tied to natural gas and oil prices in an effort to mitigate some of this volatility, changes in natural gas and oil prices will continue to impact our revenues.
Availability of third party services. Like many other industry participants, we contract with third party service providers to drill and complete our wells. Some of the biggest challenges that we face are equipment shortages, increasing costs and lack of qualified personnel to operate drilling and completion equipment. Due to increasing levels of industry activity in the Eagle Ford Shale, drilling rigs, fracture stimulation services and associated materials have become harder to obtain and more expensive. Moreover, we have seen overall service costs increase in the Arkoma Basin despite the fact that industry activity has generally decreased over the last twelve months as a result of the lower natural gas price environment.
Regulatory environment. Exploration and production is a highly regulated business at the federal, state and local levels. The amount of regulatory scrutiny, as evidenced in the time and expense required to obtain required permitting, has generally been increasing. In the Powder River Basin, we operate largely on public lands managed by the Federal Bureau of Land Management. The amount of lead time and regulatory process required to permit wells and other surface facilities on public lands is typically longer and more complicated than it is on private lands. The majority of our properties in Oklahoma and Texas are on private land. Moreover, increased regulation and attention given to the
48
hydraulic fracturing process could lead to greater opposition, including litigation, to oil and gas production activities using hydraulic fracturing techniques. Additional legislation or regulation could also lead to operational delays or increased operating costs in the production of oil and natural gas, including from the developing shale plays, or could make it more difficult to perform hydraulic fracturing. The current regulatory environment, and changes to it, could impact our ability to execute our development plans within budget and on the schedule we have forecast, materially impacting our financial condition, results of operations and cash flow.
Financial reporting and compliance. We believe that our general and administrative expenses will increase in connection with the completion of this offering as a result of our becoming a public company. This increase will consist primarily of legal and accounting fees and additional expenses associated with compliance with the Sarbanes-Oxley Act and other regulations. Increases in our staff compensation and other ongoing general and administrative expenses will be necessary to maintain and grow a publicly traded exploration and production company. A large part of these increases will be due to the cost of accounting support services, filing annual, quarterly and periodic reports with the SEC, investor relations activities, directors' fees, incremental directors' and officers' liability insurance costs and transfer agent fees.
Liquidity and Capital Resources
Our primary sources of liquidity have been capital contributions from Yorktown, cash flows from operations, borrowings under our credit facilities and asset sales. Our primary use of capital has been for the acquisition, exploration, development and production of oil and gas properties. As we pursue reserve and production growth, we continually monitor which capital resources, including equity and debt financings, are available to meet our future financial obligations, planned capital expenditure activities and liquidity requirements. Our future ability to grow proved reserves and production will be highly dependent on the capital resources available to us.
At December 31, 2011, we had a combined total of $110.2 million of debt outstanding, consisting of $60.0 million drawn on our senior secured revolving credit facility, $30.0 million drawn on our second lien term loan facility and $20.2 million in notes payable related to property acquisitions. At December 31, 2011, the borrowing base of our senior secured revolving credit facility was $85.0 million, resulting in $25.0 million of undrawn capacity. In November 2011, Yorktown purchased an additional 250,000 shares of our common stock for $30.0 million. This additional capital was used to fund the initial $13.5 million payment on our November 2011 acquisition of Powder River Basin acreage and to support our ongoing drilling program. Additionally, immediately prior to our acquisition of Cima in November 2011, we used approximately $7.7 million of cash to (i) fund the repurchase of 54,954 shares of Cima common stock and (ii) fund the purchase of fractional shares resulting from Cima's 500 for one reverse common stock split.
After giving effect to this offering, assuming an initial public offering price of $ and the application of a portion of the net proceeds to pay down all amounts outstanding under our senior secured revolving credit facility and all amounts outstanding under our second lien term loan facility, we expect to have approximately $85.0 million available for borrowings under our senior secured revolving credit facility. We believe this liquidity, as well as cash flows from operations, will provide us with the ability to implement our planned exploration and development activities through 2013.
Credit Facilities
We have a senior secured revolving credit facility and a second lien term loan facility. In December 2011, we amended each of our credit facilities. See "—Recent Developments—Amendments to Credit Facilities." We intend to use a portion of the net proceeds from this offering to repay all amounts outstanding under our senior secured revolving credit facility and to repay all amounts
49
outstanding under and retire our second lien term loan facility. There are no pre-payment penalties under either facility.
Senior secured revolving credit facility. We have a senior secured revolving credit facility with a four-year term that matures in January 2016. The amount of borrowings under our senior secured credit facility is limited to the lesser of $300.0 million or the amount of the borrowing base which is determined semi-annually on June 1 and December 1 by the lenders primarily based on estimates of the value of our proved reserves. As of December 31, 2011, our borrowing base was $85.0 million. Borrowings under our credit facilities are secured by mortgages on substantially all of our producing oil and gas properties and by equity interests in all of our subsidiaries.
Borrowings under our senior secured revolving credit facility bear interest at our election at either (i) a London Inter Bank Offer Rate, or LIBOR, based rate or (ii) the issuing bank's base rate plus an applicable margin tied to the amount drawn on the credit facility. Historically, we have elected LIBOR-based pricing where our applicable margin ranges from 2.00% to 3.00%. Upon the completion of this offering, our applicable margin range will decrease to 1.75% to 2.75%. Should we elect base rate pricing, our applicable margin would be 1.00% to 2.00%. Upon the completion of this offering, our applicable margin range should we elect base rate pricing will decrease to 0.75% to 1.75%.We can elect to have LIBOR-based borrowings based on one, two, three or six month LIBOR rates and have historically selected one or three-month based pricing. As of December 31, 2011, the interest rate payable on borrowings under our senior secured revolving credit facility was approximately 2.80%, which does not include the impact of our interest rate derivative transactions. There is also an annual commitment fee, payable quarterly, ranging between 0.375% and 0.500% on the undrawn portion of our borrowing base.
Key financial covenants under our senior secured revolving credit facility require us:
- •
- to maintain a minimum current ratio, which is defined as consolidated total current assets plus the unused availability
under the credit agreement less current derivative assets divided by consolidated total current liabilities less current derivative liabilities, of 1.00 or greater;
- •
- to maintain a debt to EBITDAX (as defined in our senior secured revolving credit facility) ratio, which is defined as
total debt outstanding divided by an annualized or rolling four quarter EBITDAX calculation, of 4.00 to 1.00 or less; and
- •
- to maintain an EBITDAX to consolidated interest expense ratio, with both EBITDAX and consolidated interest expense calculated on an annualized or rolling quarter basis, of 2.75 to 1.00 or greater.
The calculation of EBITDAX for purposes of our senior secured revolving credit facility differs from the calculation of Adjusted EBITDAX as presented in this prospectus and further described under "Summary—Summary Historical Consolidated Financial Data—Non-GAAP Financial Measure." In general, the EBITDAX calculation under our senior secured revolving credit facility permits us to also add back to earnings expensed workover costs and other one-time litigation settlement expenses.
Our senior secured revolving credit facility contains various covenants that limit our ability to take certain actions including, but not limited to, the following:
- •
- incur liens,
- •
- sell assets,
- •
- merge or consolidate,
- •
- make loans and investments,
- •
- incur debt,
50
- •
- engage in transactions with affiliates, and
- •
- make restricted payments such as dividends or distributions of property.
As of December 31, 2011, we were in compliance with all of the terms of our senior secured revolving credit facility.
If an event of default exists under our senior secured revolving credit facility, the lenders will be able to accelerate the maturity of our senior secured revolving credit facility and exercise other rights and remedies. Events of default include, but are not limited to, the following events:
- •
- failure to pay any principal, interest, letters of credit or other fees when due,
- •
- material breach of representations or warranties,
- •
- failure to perform or observe any term, covenant, obligation or agreement in our senior secured revolving credit facility,
- •
- a bankruptcy or insolvency event involving us or our subsidiaries, and
- •
- a change of control as defined in our senior secured revolving credit facility.
As of December 31, 2011, we had outstanding borrowings of $60.0 million under our senior secured revolving credit facility and a borrowing base of $85.0 million, resulting in $25.0 million available for additional borrowings. We had outstanding borrowings under our senior secured revolving credit facility of $56.0 million at December 31, 2010 and of $40.7 million at December 31, 2009. At December 31, 2011, the interest rate on our senior secured revolving credit facility was approximately 2.80%.
Second lien term loan facility. We have a second lien term loan facility that matures in July 2016. As of December 31, 2011, we had outstanding borrowings of $30.0 million under our second lien term loan facility, and we were in compliance with all of the terms of our second lien term loan facility. We intend to use a portion of the net proceeds from this offering to repay all amounts outstanding under our second lien term loan facility and retire this facility.
Capital Expenditures Budget
Expenditures for acquisitions, exploration and development of oil and gas properties are the primary uses of our capital resources. We anticipate having capital expenditures of $172.0 million in 2012. Through September 30, 2011, we had spent or committed to spend approximately $99.6 million of
51
our 2011 capital expenditures budget of $155.0 million. The table below details our anticipated capital expenditures by region for the year ending December 31, 2012.
| |
Number of Wells | |
||||||||
|---|---|---|---|---|---|---|---|---|---|---|
| |
Capital Expenditures |
|||||||||
| |
Gross | Net | ||||||||
| |
|
|
($ in millions) |
|||||||
Drilling |
||||||||||
Eagle Ford Shale |
11 | 11.0 | $ | 108.6 | ||||||
Powder River Basin |
3 | 3.0 | 21.6 | |||||||
Woodford Shale |
20 | 3.9 | 20.4 | |||||||
Other Areas(1) |
— | — | 2.8 | |||||||
Sub-total |
34 | 17.9 | 153.4 | |||||||
Leasehold, Seismic and Other(2) |
— | — | 18.6 | |||||||
Total |
34 | 17.9 | $ | 172.0 | ||||||
- (1)
- Includes
workovers on South Texas non-Eagle Ford Shale properties.
- (2)
- Includes a $13.5 million payment due in 2012 with respect to our acquisition of Powder River Basin acreage in November 2011.
The amount, timing and allocation of capital expenditures are largely discretionary and within management's control. If oil and natural gas prices decline below what we consider acceptable levels, or costs increase to levels we consider unacceptable, we may choose to defer a portion of our budgeted capital expenditures until later periods in order to achieve the desired balance between sources and uses of liquidity and prioritize capital projects that we believe have the highest expected returns and potential to generate near-term cash flow. We may also increase our capital expenditures significantly to take advantage of opportunities we consider to be attractive. We consistently monitor and adjust our projected capital expenditures in response to success or lack of success in drilling activities, changes in prices, availability of financing, drilling and acquisition costs, industry conditions, the timing of regulatory approvals, the availability of rigs, contractual obligations, internally generated cash flows and other factors both within and outside our control.
Cash Flows
The following table summarizes our cash flows for the periods indicated.
| |
Year Ended December 31, | Nine Months Ended September 30, |
||||||||||||||
|---|---|---|---|---|---|---|---|---|---|---|---|---|---|---|---|---|
| |
2008 | 2009 | 2010 | 2010 | 2011 | |||||||||||
| |
(in thousands) |
|||||||||||||||
Net cash provided by (used in) operating activities |
$ | 7,312 | $ | (40,027 | ) | $ | 14,734 | $ | 8,076 | $ | 14,438 | |||||
Net cash used in investing activities |
(32,244 | ) | (25,153 | ) | (84,619 | ) | (59,177 | ) | (72,719 | ) | ||||||
Net cash provided by financing activities |
36,165 | 55,986 | 98,220 | 56,331 | 47,788 | |||||||||||
Net increase (decrease) in cash |
$ | 11,233 | $ | (9,194 | ) | $ | 28,335 | $ | 5,230 | $ | (10,493 | ) | ||||
Cash flows provided by (used in) operating activities. Net cash provided by operating activities was approximately $14.4 million for the nine months ended September 30, 2011 and $8.1 million for the nine months ended September 30, 2010. The increase of $6.4 million was primarily due to an increase in revenues from our Eagle Ford Shale drilling program in the first nine months of 2011.
52
Net cash provided by (used in) operating activities was approximately $14.7 million for the year ended December 31, 2010 and approximately $(40.0) million for the year ended December 31, 2009. The increase of $54.8 million was primarily due to an increase in revenues from our successful Woodford Shale drilling program in 2010, as well as a substantial use of $34.8 million of cash in 2009 mostly related to bringing current overdue trade payables related to the acquisition of a private Arkoma Basin company.
Net cash provided by (used in) operating activities was approximately $(40.0) million for the year ended December 31, 2009 and approximately $7.3 million for the year ended December 31, 2008. The decrease in cash provided by operating activities of $47.3 million primarily related to a substantial use of $34.8 million of cash in 2009 mostly related to bringing current overdue trade payables related to the acquisition of a private Arkoma Basin company.
Cash flows provided by (used in) investing activities. The following table summarizes our cash flows provided by (used in) investing activities for the periods indicated.
| |
Year Ended December 31, | Nine Months Ended September 30, |
||||||||||||||
|---|---|---|---|---|---|---|---|---|---|---|---|---|---|---|---|---|
| |
2008 | 2009 | 2010 | 2010 | 2011 | |||||||||||
| |
(in thousands) |
|||||||||||||||
Exploration and development of natural gas and oil properties |
$ | (26,651 | ) | $ | (25,032 | ) | $ | (92,640 | ) | $ | (64,963 | ) | $ | (84,820 | ) | |
Proceeds from property sales |
3,326 | 3,455 | 8,409 | 5,900 | 24,279 | |||||||||||
Acquisition of natural gas and oil properties |
(8,671 | ) | (3,384 | ) | (299 | ) | (40 | ) | (12,044 | ) | ||||||
Cash acquired upon acquisition of private Arkoma Basin company |
— | 67 | — | — | — | |||||||||||
Other property and equipment additions |
(248 | ) | (259 | ) | (89 | ) | (74 | ) | (134 | ) | ||||||
Net cash used in investing activities |
$ | (32,244 | ) | $ | (25,153 | ) | $ | (84,619 | ) | $ | (59,177 | ) | $ | (72,719 | ) | |
The increase in the cash we used in investing activities during the nine months ended September 30, 2011 as compared to the nine months ended September 30, 2010 is primarily related to increased spending on our Eagle Ford Shale drilling activities and on our acreage purchased in the Powder River Basin of Wyoming, which was partially offset by the sale of non-strategic Arkoma Basin oil and gas properties.
The increase in the cash we used in investing activities during 2010 versus 2009 amounted to approximately $59.5 million and was primarily related to acreage acquisition and drilling costs on our Eagle Ford Shale properties and drilling costs on our Woodford Shale properties. The decrease of $7.1 million of cash used in investing activities during 2009 as compared to 2008 relates to lower property acquisitions in 2009 and increases in Woodford Shale drilling activity in 2009 being more than offset by lower drilling activity on our conventional South Texas properties in 2009.
Cash flows provided by (used in) financing activities. Cash flows provided by financing activities were $47.8 million and $56.3 million for the nine months ended September 30, 2011 and 2010, respectively. During the nine months ended September 30, 2011, we received additional capital contributions, primarily from Yorktown, of $52.5 million, and we repaid $3.0 million in borrowings under our senior secured revolving credit facility. During the nine months ended September 30, 2010, we received $42.0 million in capital contributions from Yorktown and had net borrowings of $15.3 million under our senior secured revolving credit facility.
During the three years ended December 31, 2010, 2009 and 2008, cash flows provided by financing activities were $98.2 million, $56.0 million and $36.2 million, respectively. Net cash provided by financing activities in 2010 resulted primarily from $84.0 million in equity capital from Yorktown and borrowings, net of repayments, of $15.3 million under our senior secured revolving credit facility. Net cash provided by financing activities in 2009 resulted primarily from $105.0 million in preferred equity capital from Yorktown and repayments of $46.0 million on our senior secured revolving credit facility. Net cash provided by financing activities in 2008 resulted primarily from $25.0 million in equity capital from Yorktown and borrowings of $11.1 million under our senior secured revolving credit facility.
53
Contractual Obligations
We had the following material commitments and contractual obligations at September 30, 2011, unless otherwise stated.
| |
Payments due by period | |||||||||||||||
|---|---|---|---|---|---|---|---|---|---|---|---|---|---|---|---|---|
| |
Total | Less than 1 Year |
1 - 3 Years | 3 - 5 Years | More than 5 Years |
|||||||||||
| |
(in thousands) |
|||||||||||||||
Senior secured revolving credit facility(1) |
$ | 60,000 | $ | — | $ | — | $ | 60,000 | $ | — | ||||||
Second lien term loan facility(1) |
30,000 | — | — | 30,000 | — | |||||||||||
Office lease and equipment |
7,720 | 2,323 | 3,940 | 1,457 | — | |||||||||||
Non-operating drilling commitments(2) |
3,800 | 3,800 | — | — | — | |||||||||||
Drilling rig commitments(3) |
8,395 | 4,543 | 3,852 | — | — | |||||||||||
Executive employment obligations(4) |
||||||||||||||||
Asset retirement obligations(5) |
6,951 | — | — | — | 6,951 | |||||||||||
Product transportation obligations(6) |
7,216 | 2,371 | 4,845 | — | — | |||||||||||
Deferred payments for acreage acquisition(7) |
20,177 | 15,726 | 4,451 | — | — | |||||||||||
Total |
$ | $ | $ | $ | $ | |||||||||||
- (1)
- At
December 31, 2011, we had $60.0 million in borrowings outstanding under our senior secured revolving credit facility and
$30.0 million outstanding under our second lien term loan facility. Our senior secured revolving credit facility matures on January 4, 2016, and our second lien term loan facility
matures on July 4, 2016. These amounts do not include estimated interest on these borrowings, because our revolving borrowings have short-term interest periods, and we are unable to
determine what our borrowing costs may be in future periods. Additionally, these amounts do not include commitment fees and other expenses as they depend on factors that change, such as the amounts
borrowed, and are therefore not determinable.
- (2)
- At
September 30, 2011, we had outstanding commitments of $3.8 million to participate in the drilling and completion of 8 gross
non-operated Woodford Shale wells.
- (3)
- At
September 30, 2011, we had one drilling rig under a long-term contract. Any other rig performing work for us is doing so on a
two-well basis and, therefore, can be released without penalty at the conclusion of drilling one well in addition to the current well. As a result, drilling obligations on these rigs have
not been included in the table above. The value in the table represents the gross amount that we are committed to pay. However, we will record our proportionate share based on our working interest in
our audited consolidated financial statements as incurred. At September 30, 2011, our drilling rig commitments totaled approximately $8.4 million.
- (4)
- Immediately
prior to this offering, we expect to enter into employment arrangements with members of our executive management team. Our maximum commitment
under these employment arrangements, which would apply if the employees covered by these arrangements were all terminated without cause, was approximately
$ . See "Executive Compensation
and Other Information—Potential Payments Upon Termination or Change of Control" and "Executive Compensation and Other Information—Employment Agreements."
- (5)
- Amounts represent our estimate of future asset retirement obligations. Because these costs typically extend many years into the future, estimating these future costs requires management to make estimates and judgments that are subject to future revisions based upon numerous factors, including the rate of inflation, changing technology and the political and regulatory environment.
54
- (6)
- Includes
minimum transportation charges due to pipeline companies that we are obligated to make based on minimum volume commitments.
- (7)
- In April 2011, we purchased acreage in the Powder River Basin of Wyoming for $18.7 million. We made a $12.0 million payment at closing and will pay the remaining $6.7 million in three equal installments in April 2012, 2013 and 2014. Additionally, in November 2011, we purchased approximately 20,000 additional net acres in the Powder River Basin for a purchase price of approximately $27.0 million. We paid $13.5 million of this amount at closing and will pay the additional $13.5 million in November 2012. This additional $13.5 million is included in amounts due within one year.
Sources of Our Revenues
We derive our revenues from the sale of natural gas, oil and natural gas liquids in the continental United States. Our revenues do not include the effects of commodity derivatives. For the nine months ended September 30, 2011, natural gas sales amounted to 59% and oil and natural gas liquids sales amounted to 39% and 2% of our revenues, respectively. In the first nine months of 2011, the percentage of our revenues that was derived from oil sales increased to 39%, from 13% in the comparable 2010 period, primarily as a result of our drilling program in the Eagle Ford Shale. Our revenues can vary significantly from period to period based on the level of our production and commodity pricing, which pricing historically has been volatile.
Derivative Instruments
Commodity Derivatives
We periodically enter into derivative financial instruments to mitigate the risk of volatility in commodity prices with respect to a portion of our gas and oil production. These instruments are used to manage the inherent uncertainty of future revenues due to gas and oil price volatility and to mitigate some of the potential negative impact on our cash flow. Our derivative financial instruments include fixed-price swaps, closed out swaps, basis swaps, costless price collars, call options and put spreads. We have not designated these derivatives as either cash-flow or fair value hedges, and, therefore, the unrealized gains and losses on open positions are reflected in gain (loss) on derivative instruments. At each period end, we recognize cash settled derivatives as a realized gain or loss, and we estimate the fair value of our commodity derivatives that will cash settle in future periods and recognize an unrealized gain or loss.
Interest Rate Swaps
We periodically enter into interest rate swaps to manage our exposure to interest rate volatility. Our interest rate swaps include contracts in which we pay a fixed rate and receive a variable rate on a total notional principal amount.
Principal Components of Our Cost Structure
We use the successful efforts method of accounting for our oil and natural gas producing activities. See "—Critical Accounting Policies and Estimates—Method of accounting for oil and natural gas properties."
Lease operating. These are daily costs incurred to bring oil and gas out of the ground and to the market, together with the daily costs incurred to maintain our producing properties. Such costs also include maintenance and repairs related to our oil and gas properties.
55
Workovers. These are costs incurred in remedial operations to maintain optimal production rates or to restore production from a previously producing zone. Costs related to attempting to secure production from a zone that has not previously produced are capitalized.
Severance and ad valorem taxes. Severance taxes are paid on produced natural gas, oil and natural gas liquids based on a percentage of revenues from products sold at market prices or at fixed rates established by federal, state or local taxing authorities. In general, the severance taxes we pay correlate to the changes in oil and gas revenues. Ad valorem taxes are property taxes.
Exploration. These are costs incurred in identifying areas that may warrant examination, and in further examining specific areas, for oil and gas reserves that are not capitalized as part of a specific property. They would include such costs as geological and geophysical evaluation costs, seismic acquisition costs, accretion of asset retirement obligations, maintenance of land and title records, delay rentals and exploratory dry hole costs resulting from the unsuccessful drilling of an exploratory well to find and produce oil and gas in an unproved area.
Depletion, depreciation and amortization. Capitalized amounts attributed to estimated proved natural gas and oil properties are depleted by the unit-of-production method. Depletion, depreciation and amortization are computed based on quantities produced in relation to estimated proved reserves. Depreciation of other property and equipment is based on the estimated useful life of the asset which ranges from five to seven years. Depletion, depreciation and amortization also includes the accretion of the estimated discounted amount of our asset retirement obligations for our oil and gas properties.
Impairment of natural gas and oil properties. Unproved properties are periodically assessed for impairment of value, and a loss is recognized at the time of the impairment by providing an impairment allowance. Capitalized costs of proved properties are evaluated for impairment based on an analysis of undiscounted future cash flows. If the future undiscounted cash flows are insufficient to recover the net capitalized cost related to proved properties, then we recognize an impairment charge in income from operations equal to the difference between the net capitalized cost related to proved properties and their estimated fair values.
General and administrative expense. These expenses consist primarily of personnel, legal, consulting, office rent and non-cash stock compensation expense. These expenses are reduced by overhead reimbursements received from other working interest owners where we are the operator of the property.
Gain (loss) on property sales. This represents the gain or loss recognized on oil and gas properties or other equipment sold. Sales proceeds in excess of cost basis result in a gain while sales proceeds less than cost basis result in a loss.
Gain (loss) on derivative instruments. We utilize commodity derivative financial instruments to reduce our exposure to fluctuations in the price of crude oil and natural gas. Additionally, we utilize interest rate derivatives, such as swaps and caps, to reduce our exposure to fluctuations in interest rates on our outstanding debt. These amounts represent (i) the recognition of unrealized gains and losses associated with our open derivative contracts as commodity prices or interest rates change and commodity derivative and interest rate contracts expire or new ones are entered into, and (ii) our realized gains and losses on the settlement of these commodity or interest rate derivative instruments. We classify these gains and losses as operating activities in our consolidated statements of cash flows.
Interest expense. We finance a portion of our working capital requirements, capital expenditures and acquisitions with borrowings under our senior secured revolving credit facility and our second lien term loan facility. As a result, we incur interest expense that is affected by both fluctuations in interest rates and our financing decisions. We have entered into various interest rate derivative contracts to mitigate the effects of interest rate changes. We do not designate these derivative contracts as hedges
56
and, therefore, hedge accounting treatment is not applicable. Realized and unrealized gains or losses on these interest rate contracts are included in non-operating income (expense) as discussed above. We reflect interest paid to the lenders as interest expense. In addition, we include the amortization of deferred financing costs (including origination and amendment fees) and commitment fees in interest expense.
Income (loss) from discontinued operations. During the year ended December 31, 2010 and the nine months ended September 30, 2011, we sold portions of our Arkoma Basin properties that were either located in non-core areas of our operations in the Arkoma Basin or represented small, non-operated interests in such properties. We include all of the historic operating results of the properties sold, along with the related gains on sale, in discontinued operations on our statement of operations.
Results of Operations
The following is a discussion of our consolidated results of operations. You should read this discussion in conjunction with our consolidated financial statements and the notes thereto included elsewhere in this prospectus. Comparative results of operations for the periods indicated are discussed below.
Revenues
Nine months ended September 30, 2011 as compared to nine months ended September 30, 2010
The following table sets forth summary information regarding natural gas, oil and natural gas liquids revenues, production volumes, average product prices and realized gains or losses on commodity
57
derivatives for the periods indicated. We determine natural gas equivalents by using the ratio of six Mcf of natural gas to one barrel of oil or one barrel of natural gas liquids.
| |
Nine Months Ended September 30, |
|
|
||||||||||
|---|---|---|---|---|---|---|---|---|---|---|---|---|---|
| |
Total Unit Change |
Total % Change |
|||||||||||
| |
2010 | 2011 | |||||||||||
| |
(in thousands, except as otherwise noted) |
||||||||||||
Revenues: |
|||||||||||||
Natural gas sales |
$ | 17,144 | $ | 21,679 | $ | 4,535 | 26 | % | |||||
Oil sales |
1,949 | 14,191 | 12,242 | 628 | |||||||||
Natural gas liquids sales |
703 | 603 | (100 | ) | (14 | ) | |||||||
Total revenues |
19,796 | 36,473 | 16,677 | 84 | |||||||||
Realized gain on commodity derivatives |
2,889 |
5,209 |
2,320 |
80 |
|||||||||
Total revenues including derivative impact |
$ | 22,685 | $ | 41,682 | $ | 18,997 | 84 | ||||||
Production: |
|||||||||||||
Natural gas (MMcf) |
4,634.7 | 6,240.7 | 1,606.0 | 35 | |||||||||
Oil (MBbls) |
26.0 | 151.7 | 125.7 | 483 | |||||||||
Natural gas liquids (MBbls) |
17.8 | 11.8 | (6.0 | ) | (34 | ) | |||||||
Equivalents (MMcfe) |
4,897.5 | 7,221.7 | 2,324.2 | 47 | |||||||||
Average daily equivalent production (MMcfed) |
17.9 | 26.5 | 8.6 | 48 | |||||||||
Average Prices: |
|||||||||||||
Natural gas ($ per Mcf) |
$ | 3.70 | $ | 3.47 | $ | (0.23 | ) | (6 | ) | ||||
Oil ($ per Bbl) |
74.96 | 93.55 | 18.59 | 25 | |||||||||
Natural gas liquids ($ per Bbl) |
39.49 | 51.10 | 11.61 | 29 | |||||||||
Equivalents ($ per Mcfe) |
4.04 |
5.05 |
1.01 |
25 |
|||||||||
Realized gain (loss) on commodity derivatives ($ per Mcfe) |
0.59 | 0.72 | 0.13 | 22 | |||||||||
Natural gas equivalents including realized derivative impact ($ per Mcfe) |
$ | 4.63 | $ | 5.77 | $ | 1.14 | 25 | ||||||
Natural gas, oil and natural gas liquids revenues. The total increase in revenues for the nine months ended September 30, 2011, as compared to the nine months ended September 30, 2010, was largely attributable to higher oil and gas production volumes as well as an increase in realized oil prices, and the increasing percentage of oil and natural gas liquids as an overall percentage of our equivalent production. The increase in our production volumes in the nine months ended September 30, 2011, as compared to the nine months ended September 30, 2010, was primarily related to our drilling operations in the Eagle Ford Shale. We expect continued growth in oil and natural gas liquids production volumes while the drilling we plan to do specifically for natural gas will generally mitigate natural declines.
Without taking into consideration the impact of realized gains or losses on commodity derivatives, the net dollar effect of changes in prices (calculated as the change in period-to-period average prices multiplied by current period production volumes for natural gas, oil and natural gas liquids) and the net dollar effect of the change in production (calculated as the changes in period-to-period volumes for oil and gas multiplied by the prior period average prices) are shown below.
58
Effects of Changes in Prices and Volumes:
| |
Change in prices(1) | Production volumes for the nine months ended September 30, 2011(2) |
Total net dollar effect of change |
|||||||
|---|---|---|---|---|---|---|---|---|---|---|
| |
|
(in thousands) |
(in thousands) |
|||||||
Effect of change in prices: |
||||||||||
Natural gas |
$ | (0.23 | ) | 6,240.7 | $ | (1,407 | ) | |||
Oil |
18.59 | 151.7 | 2,820 | |||||||
Natural gas liquids |
11.61 | 11.8 | 137 | |||||||
Total due to prices |
1,550 | |||||||||
| |
Change in production volumes(2) |
Average prices for the nine months ended September 30, 2010(1) |
|
|||||||
|---|---|---|---|---|---|---|---|---|---|---|
| |
(in thousands) |
|
|
|||||||
Effect of change in volumes: |
||||||||||
Natural gas |
1,606.0 | $ | 3.70 | 5,942 | ||||||
Oil |
125.7 | 74.96 | 9,422 | |||||||
Natural gas liquids |
(6.0 | ) | 39.49 | (237 | ) | |||||
Total due to volumes |
15,127 | |||||||||
Total change in revenues |
$ | 16,677 | ||||||||
- (1)
- Prices
shown are realized, exclude realized gains (losses) on commodity derivatives and are based on $ per Mcf for natural gas and $ per Bbl
for oil and natural gas liquids.
- (2)
- Production volumes are presented in MMcf for natural gas and MBbls for oil and natural gas liquids.
Realized gain (loss) on commodity derivatives. Our realized gain on commodity derivatives increased by approximately $2.3 million to $5.2 million for the nine months ended September 30, 2011 from $2.9 million for the nine months ended September 30, 2010. The realized gain from our open natural gas positions increased primarily as a result of the decline in natural gas prices during the comparable periods. The realized gain from our open oil positions increased because of the decline in oil prices and our decision to monetize these positions during the period ended September 30, 2011. Due to realized gains on commodity derivatives, for the nine months ended September 30, 2011, we realized an additional $0.76 per Mcf on our natural gas volumes and an additional $3.59 per Bbl on our oil volumes. On a natural gas equivalent basis, the gain was $0.72 per Mcfe. For the nine months ended September 30, 2010, realized gains on commodity derivatives increased prices on our natural gas by $0.62 per Mcf. On a natural gas equivalent basis, the gain was $0.59 per Mcfe.
Year ended December 31, 2010 as compared to year ended December 31, 2009
The following table sets forth summary information regarding natural gas, oil and natural gas liquids revenues, production volumes, average product prices and realized gains or losses on commodity
59
derivatives for the periods indicated. We determine natural gas equivalents by using the ratio of six Mcf of natural gas to one barrel of oil or one barrel of natural gas liquids.
| |
Year Ended December 31, | |
|
||||||||||
|---|---|---|---|---|---|---|---|---|---|---|---|---|---|
| |
Total Unit Change |
Total % Change |
|||||||||||
| |
2009 | 2010 | |||||||||||
| |
(in thousands, except as otherwise noted) |
||||||||||||
Revenues: |
|||||||||||||
Natural gas sales |
$ | 12,079 | $ | 23,453 | $ | 11,374 | 94 | % | |||||
Oil sales |
2,539 | 3,723 | 1,184 | 47 | |||||||||
Natural gas liquids sales |
834 | 964 | 130 | 16 | |||||||||
Total revenues |
15,452 | 28,140 | 12,688 | 82 | |||||||||
Realized gain (loss) on commodity derivatives |
(33 | ) | 4,546 | 4,579 | — | ||||||||
Total revenues including derivative impact |
$ | 15,419 | $ | 32,686 | $ | 17,267 | 112 | ||||||
Production: |
|||||||||||||
Natural gas (MMcf) |
3,601.3 | 6,627.0 | 3,025.7 | 84 | |||||||||
Oil (MBbls) |
43.5 | 48.2 | 4.7 | 11 | |||||||||
Natural gas liquids (MBbls) |
25.9 | 24.1 | (1.8 | ) | (7 | ) | |||||||
Equivalents (MMcfe) |
4,017.7 | 7,060.8 | 3,043.1 | 76 | |||||||||
Average daily equivalent production (MMcfed) |
11.0 | 19.3 | 8.3 | 76 | |||||||||
Average Prices: |
|||||||||||||
Natural gas ($ per Mcf) |
$ | 3.35 | $ | 3.54 | $ | 0.19 | 6 | ||||||
Oil ($ per Bbl) |
58.37 | 77.24 | 18.87 | 32 | |||||||||
Natural gas liquids ($ per Bbl) |
32.20 | 40.00 | 7.80 | 24 | |||||||||
Equivalents ($ per Mcfe) |
3.85 |
3.99 |
0.14 |
4 |
|||||||||
Realized gain (loss) on commodity derivatives ($ per Mcfe) |
(0.01 | ) | 0.64 | 0.65 | — | ||||||||
Natural gas equivalents including derivative impact ($ per Mcfe) |
$ | 3.84 | $ | 4.63 | $ | 0.79 | 21 | ||||||
Natural gas, oil and natural gas liquids revenues. Our increase in total revenues was attributable to higher oil and gas production volumes as well as an increase in realized oil, gas and natural gas liquids prices for the year ended December 31, 2010 as compared to the year ended December 31, 2009. The increase in production was primarily related to our Arkoma Basin Woodford Shale drilling program.
Without taking into consideration the impact of realized gains or losses on commodity derivatives, the net dollar effect of increases in prices (calculated as the change in period-to-period average prices multiplied by current period production volumes for natural gas, oil and natural gas liquids) and the net dollar effect of the change in production (calculated as the change in period-to-period volumes for oil, gas and natural gas liquids multiplied by the prior period average prices) are shown below.
60
Effects of Changes in Prices and Volumes:
| |
Change in prices(1) | Production volumes for the year ended December 31, 2010(2) |
Total net dollar effect of change |
|||||||
|---|---|---|---|---|---|---|---|---|---|---|
| |
|
(in thousands) |
(in thousands) |
|||||||
Effect of change in prices: |
||||||||||
Natural gas |
$ | 0.19 | 6,627.0 | $ | 1,238 | |||||
Oil |
18.87 | 48.2 | 910 | |||||||
Natural gas liquids |
7.80 | 24.1 | 188 | |||||||
Total due to prices |
2,336 | |||||||||
| |
Change in production volumes(2) |
Average prices for the year ended December 31, 2009(1) |
|
|||||||
|---|---|---|---|---|---|---|---|---|---|---|
| |
(in thousands) |
|
|
|||||||
Effect of change in volumes: |
||||||||||
Natural gas |
3,025.7 | $ | 3.35 | 10,136 | ||||||
Oil |
4.7 | 58.37 | 274 | |||||||
Natural gas liquids |
(1.8 | ) | 32.20 | (58 | ) | |||||
Total due to volumes |
10,352 | |||||||||
Total change in revenues |
$ | 12,688 | ||||||||
- (1)
- Prices
shown are realized, exclude realized gains (losses) on commodity derivatives and are based on $ per Mcf for natural gas and $ per Bbl for oil and
natural gas liquids.
- (2)
- Production volumes are presented in MMcf for natural gas and MBbls for oil and natural gas liquids.
Realized gain (loss) on commodity derivatives. Our realized gain on commodity derivatives increased by approximately $4.6 million to $4.5 million for the year ended December 31, 2010 from a realized loss of $33,000 for the year ended December 31, 2009. The realized gain from our open natural gas positions increased primarily as a result of the decline in natural gas prices during the comparable periods. Due to realized gains on commodity derivatives, for the year ended December 31, 2010, we realized an additional $0.69 per Mcf on our natural gas volumes. On a natural gas equivalent basis, the gain was $0.64 per Mcfe. For the year ended December 31, 2009, realized losses on commodity derivatives decreased prices on our natural gas by $0.01 per Mcf. On a natural gas equivalent basis, the loss was $0.01 per Mcfe.
Year ended December 31, 2009 as compared to year ended December 31, 2008
The following table sets forth summary information regarding natural gas, oil and natural gas liquids revenues, production volumes, average product prices and realized gains or losses on commodity
61
derivatives for the periods indicated. We determine natural gas equivalents by using the ratio of six Mcf of natural gas to one barrel of oil or one barrel of natural gas liquids.
| |
Year Ended December 31, |
|
|
||||||||||
|---|---|---|---|---|---|---|---|---|---|---|---|---|---|
| |
Total Unit Change |
Total % Change |
|||||||||||
| |
2008 | 2009 | |||||||||||
Revenues: |
|||||||||||||
Natural gas sales |
$ | 13,978 | $ | 12,079 | $ | (1,899 | ) | (14 | )% | ||||
Oil sales |
5,477 | 2,539 | (2,938 | ) | (54 | ) | |||||||
Natural gas liquids sales |
1,290 | 834 | (456 | ) | (35 | ) | |||||||
Total revenues |
20,745 | 15,452 | (5,293 | ) | (26 | ) | |||||||
Realized gain (loss) on commodity derivatives |
— | (33 | ) | (33 | ) | — | |||||||
Total revenues including derivative impact |
$ | 20,745 | $ | 15,419 | $ | (5,326 | ) | (26 | ) | ||||
Production: |
|||||||||||||
Natural gas (MMcf) |
1,638.1 | 3,601.3 | 1,963.2 | 120 | |||||||||
Oil (MBbls) |
55.1 | 43.5 | (11.6 | ) | (21 | ) | |||||||
Natural gas liquids (MBbls) |
24.8 | 25.9 | 1.1 | 4 | |||||||||
Equivalents (MMcfe) |
2,117.5 | 4,017.7 | 1,900.2 | 90 | |||||||||
Average daily equivalent production (MMcfed) |
5.8 | 11.0 | 5.2 | 90 | |||||||||
Average Prices: |
|||||||||||||
Natural gas ($ per Mcf) |
$ | 8.53 | $ | 3.35 | $ | (5.18 | ) | (61 | ) | ||||
Oil ($ per Bbl) |
99.40 | 58.37 | (41.03 | ) | (41 | ) | |||||||
Natural gas liquids ($ per Bbl) |
52.02 | 32.20 | (19.82 | ) | (38 | ) | |||||||
Equivalents ($ per Mcfe) |
9.80 |
3.85 |
(5.95 |
) |
(61 |
) |
|||||||
Realized gain (loss) on commodity derivatives ($ per Mcfe) |
— | (0.01 | ) | (0.01 | ) | — | |||||||
Natural gas equivalents including derivative impact ($ per Mcfe) |
$ | 9.80 | $ | 3.84 | $ | (5.96 | ) | (61 | ) | ||||
Natural gas, oil and natural gas liquids revenues. Our increase in natural gas production for the year ended December 31, 2009, as compared to the year ended December 31, 2008, was primarily related to the acquisition of a private company in the Arkoma Basin and our subsequent drilling operations on its properties in the Woodford Shale. The decrease in total revenues in 2009 resulted from higher oil and gas production volumes being more than offset by lower realized oil, gas and natural gas liquids prices for the year ended December 31, 2009 as compared to the year ended December 31, 2008.
Without taking into consideration the impact of realized gains or losses on commodity derivatives, the net dollar effect of decreases in prices (calculated as the change in period-to-period average prices multiplied by current period production volumes for natural gas, oil and natural gas liquids) and the net dollar effect of the changes in production (calculated as the change in period-to-period volumes for oil, gas and natural gas liquids multiplied by the prior period average prices) are shown below.
62
Effects of Changes in Prices and Volumes:
| |
Change in prices(1) | Production volumes at December 31, 2009(2) |
Total net dollar effect of change |
|||||||
|---|---|---|---|---|---|---|---|---|---|---|
| |
|
(in thousands) |
(in thousands) |
|||||||
Effect of change in prices: |
||||||||||
Natural gas |
$ | (5.18 | ) | 3,601.3 | $ | (18,645 | ) | |||
Oil |
(41.03 | ) | 43.5 | (1,785 | ) | |||||
Natural gas liquids |
(19.82 | ) | 25.9 | (513 | ) | |||||
Total due to prices |
(20,943 | ) | ||||||||
| |
Change in production volumes(2) |
Average prices for the year ended December 31, 2008(1) |
|
|||||||
|---|---|---|---|---|---|---|---|---|---|---|
| |
(in thousands) |
|
|
|||||||
Effect of change in volumes: |
||||||||||
Natural gas |
1,963.2 | $ | 8.53 | 16,746 | ||||||
Oil |
(11.6 | ) | 99.40 | (1,153 | ) | |||||
Natural gas liquids |
1.1 | 52.02 | 57 | |||||||
Total due to volumes |
15,650 | |||||||||
Total change in revenues |
$ | (5,293 | ) | |||||||
- (1)
- Prices
shown are realized, exclude realized gains (losses) on commodity derivatives and are based on $ per Mcf for natural gas and $ per Bbl for oil and
natural gas liquids.
- (2)
- Production volumes are presented in MMcf for natural gas and MBbls for oil and natural gas liquids.
Realized gain (loss) on commodity derivatives. Our realized loss on commodity derivatives increased to $33,000 for the year ended December 31, 2009 from zero for the year ended December 31, 2008. The realized loss from our open natural gas positions increased primarily as a result of the increase in natural gas prices during the comparable periods and the initiation of our commodity risk management strategy. Due to our commodity derivative activities, we realized approximately $(0.01) per Mcfe of production during 2009 as compared to no impact in 2008 as we did not have any derivative positions in 2008. On a natural gas equivalents basis, the loss was $0.01 per Mcfe.
63
Expenses
Nine months ended September 30, 2011 as compared to nine months ended September 30, 2010
The following table summarizes our operating expenses and other income (expense) for the periods indicated.
| |
Nine Months Ended September 30, |
|
|
||||||||||
|---|---|---|---|---|---|---|---|---|---|---|---|---|---|
| |
Total Unit Change |
Total % Change |
|||||||||||
| |
2010 | 2011 | |||||||||||
| |
(in thousands, except as otherwise noted) |
||||||||||||
Operating expenses: |
|||||||||||||
Lease operating |
$ | 4,849 | $ | 6,812 | $ | 1,963 | 40 | % | |||||
Workovers |
2,085 | 511 | (1,574 | ) | (75 | ) | |||||||
Severance and ad valorem taxes |
1,260 | 2,399 | 1,139 | 90 | |||||||||
Exploration |
3,363 | 4,154 | 791 | 24 | |||||||||
Depletion, depreciation and amortization |
11,138 | 23,981 | 12,843 | 115 | |||||||||
Impairment of natural gas and oil properties |
6,077 | 24,545 | 18,468 | 304 | |||||||||
General and administrative |
12,294 | 17,899 | 5,605 | 46 | |||||||||
Total operating expenses |
41,066 | 80,301 | 39,235 | 96 | |||||||||
Operating loss |
(21,270 |
) |
(43,828 |
) |
(22,558 |
) |
106 |
||||||
Other income (expense): |
|||||||||||||
Gain on property sales |
809 | 282 | (527 | ) | (65 | ) | |||||||
Gain on derivative instruments |
8,222 | 5,137 | (3,085 | ) | (38 | ) | |||||||
Interest expense |
(5,049 | ) | (5,154 | ) | (105 | ) | 2 | ||||||
Other income (expense) |
(577 | ) | (41 | ) | 536 | (93 | ) | ||||||
Total other income (expense) |
3,405 | 224 | (3,181 | ) | (93 | ) | |||||||
Loss from continuing operations |
(17,865 |
) |
(43,604 |
) |
(25,739 |
) |
144 |
||||||
Income from discontinued operations |
5,232 |
9,987 |
4,755 |
91 |
|||||||||
Net loss |
$ |
(12,633 |
) |
$ |
(33,617 |
) |
$ |
(20,984 |
) |
166 |
|||
Expenses per Mcfe: |
|||||||||||||
Lease operating |
$ | 0.99 | $ | 0.94 | $ | (0.05 | ) | (5 | ) | ||||
Workovers |
0.43 | 0.07 | (0.36 | ) | (84 | ) | |||||||
Severance and ad valorem taxes |
0.26 | 0.33 | 0.07 | 27 | |||||||||
Depletion, depreciation and amortization |
2.27 | 3.32 | 1.05 | 46 | |||||||||
General and administrative |
2.51 | 2.48 | (0.03 | ) | (1 | ) | |||||||
Lease operating and workovers. Our lease operating expense increased by $2.0 million, an increase of 40%, for the nine months ended September 30, 2011 as compared to the nine months ended September 30, 2010. Over this period, our production increased 47% from 4.9 Bcfe to 7.2 Bcfe. As a result, our lease operating expense per unit decreased $0.05 per Mcfe, or 5%, for the nine months ended September 30, 2011 as compared to the nine months ended September 30, 2010. Our workovers decreased substantially for the nine months ended September 30, 2011 as compared to the nine months ended September 30, 2010. This decrease was a result of workover activities on some of our conventional South Texas properties that took place during the nine months ended September 30, 2010 that did not occur during the comparable period in 2011.
64
Severance and ad valorem taxes. Our severance and ad valorem taxes increased 90%, for the nine months ended September 30, 2011 as compared to the nine months ended September 30, 2010. The increase in our severance and ad valorem taxes was primarily due to the increases in our production and revenues by 47% and 84%, respectively, for the nine months ended September 30, 2011 as compared to the nine months ended September 30, 2010.
Depletion, depreciation and amortization. Our depletion, depreciation and amortization increased 115%, for the nine months ended September 30, 2011 as compared to the nine months ended September 30, 2010. This increase is a result of additional drilling and completion costs associated with our Eagle Ford Shale development activities. As we receive additional well results and new proved reserve estimates, we will reassess our unit-of-production depletion calculation. A portion of this increase was also due to the increases in our production by 47% for the nine months ended September 30, 2011 as compared to the nine months ended September 30, 2010.
Impairment of natural gas and oil properties. Impairment charges on our oil and gas properties consisted of the following during the nine months ended September 30:
| |
2010 | 2011 | |||||
|---|---|---|---|---|---|---|---|
Proved Properties: |
|||||||
Eagle Ford Shale |
$ | — | $ | 18,265 | |||
Other South Texas Properties |
4,689 | 2,274 | |||||
Other Areas |
111 | 23 | |||||
Unproved Properties |
|||||||
Eagle Ford Shale |
1,055 | ||||||
Other South Texas Properties |
1,000 | — | |||||
Other Arkoma Basin |
— | 2,755 | |||||
Other Areas |
277 | 173 | |||||
Total Impairment |
$ | 6,077 | $ | 24,545 | |||
Impairment charges on our Eagle Ford Shale proved properties resulted from downward reserve revisions based on the results of our drilling performance. Additionally, we concluded during the nine months ended September 30, 2011 that, given the current low natural gas price environment, we would no longer pursue drilling activities on an Eagle Ford Shale prospect area located in the dry gas window in the near term, which resulted in the unproved property impairment. Impairment charges on our other South Texas Properties resulted from declines in natural gas prices that reduced our estimated future net cash flow related to these properties during both the nine months ended September 30, 2010 and 2011. For our other Arkoma Basin unproved properties, we drilled a dry hole on our Oklahoma Wildlife Prospect that led to our decision to forego developing the remainder of that prospect, resulting in the unproved property impairment. Unproved property impairments recorded during the nine months ended September 30, 2010, on our other South Texas Properties resulted from our decision to not pursue development on certain leaseholds in that area. Remaining impairment charges were relatively comparable between periods.
General and administrative expense. Our general and administrative expense increased by approximately 46% for the nine months ended September 30, 2011 as compared to the nine months ended September 30, 2010. This increase is primarily the result of increased personnel expense related to the closing of our Fort Smith, Arkansas office. Cash severance expense associated with closing the office included approximately $1.0 million of severance payments and other direct costs, and share-based compensation expense related to accelerated vesting amounted to $1.0 million. Additionally, our executives and Fort Smith employees earned approximately $1.5 million of cash bonuses related to the sale of certain non-strategic Arkoma Basin properties during the nine months ended September 30,
65
2011, and such charge was not present in the 2010 period. Additionally, share-based compensation costs increased by $1.8 million.
Gain (loss) on derivative instruments. The following table summarizes our gain (loss) on derivative instruments for the periods indicated.
| |
Nine Months Ended September 30, |
||||||
|---|---|---|---|---|---|---|---|
| |
2010 | 2011 | |||||
| |
(in thousands) |
||||||
Gain (loss) on derivative instruments: |
|||||||
Realized commodity derivative gain |
$ | 2,889 | $ | 5,209 | |||
Unrealized commodity derivative gain (loss) |
6,953 | (17 | ) | ||||
Total commodity derivative gain |
9,842 | 5,192 | |||||
Realized interest rate derivative loss |
(723 |
) |
(752 |
) |
|||
Unrealized interest rate derivative gain (loss) |
(897 | ) | 697 | ||||
Total interest rate derivative loss |
(1,620 | ) | (55 | ) | |||
Total gain on derivative instruments |
$ | 8,222 | $ | 5,137 | |||
Our unrealized loss on commodity derivatives was $17,000 for the nine months ended September 30, 2011, compared to a gain of $7.0 million for the nine months ended September 30, 2010.
During the period from January 1, 2011 through September 30, 2011, the net fair value of our commodity derivatives remained constant at $6.3 million. During the period from January 1, 2010 through September 30, 2010, the net fair value of our commodity derivatives increased from $1.1 million to $8.1 million, resulting in a net unrealized gain of $7.0 million for the nine months ended September 30, 2011. This increase in the net fair value of our commodity derivatives was primarily due to a decrease in natural gas prices in the first nine months of 2010.
Our realized losses from interest rate derivatives remained fairly constant at $0.8 million for the nine months ended September 30, 2011 as compared to the nine months ended September 30, 2010. We recorded an unrealized gain of $0.7 million for the nine months ended September 30, 2011 as compared to an unrealized loss of $0.9 million for the nine months ended September 30, 2010. The gain we recorded in the period ended September 30, 2011, related to an increase in the one month LIBOR rates during the period, while the loss we recorded in the period ended June 30, 2010, related to a decrease in one month LIBOR rates during the period. The impacts of our commodity derivatives are described in our discussion of revenues.
Income (loss) from discontinued operations. During the year ended December 31, 2010 and the nine months ended September 30, 2011, we sold portions of our Arkoma Basin properties that were either located in non-core areas of our operations in the Arkoma Basin or represented small, non-operated interests in such properties. The increase in income from discontinued operations resulted primarily from increased gains on sale. Properties sold during the nine months ended September 30, 2010 resulted in a gain of $2.2 million versus $8.2 million for properties sold during the nine months ended September 30, 2011. The net results of operations on sold properties decreased by $1.2 million from the nine months ended September 30, 2010 to 2011, due to the absence of the result of operations of the properties sold during 2010.
66
Year ended December 31, 2010 as compared to year ended December 31, 2009
The following table summarizes our operating expenses and other income (expense) for the periods indicated.
| |
Year Ended December 31, | |
|
||||||||||
|---|---|---|---|---|---|---|---|---|---|---|---|---|---|
| |
Total Unit Change |
Total % Change |
|||||||||||
| |
2009 | 2010 | |||||||||||
| |
(in thousands, except as otherwise noted) |
||||||||||||
Operating expenses: |
|||||||||||||
Lease operating |
$ | 4,947 | $ | 6,687 | $ | 1,740 | 35 | % | |||||
Workovers |
764 | 1,993 | 1,229 | 161 | |||||||||
Severance and ad valorem taxes |
1,265 | 1,803 | 538 | 43 | |||||||||
Exploration |
1,547 | 3,579 | 2,032 | 131 | |||||||||
Depletion, depreciation and amortization |
13,208 | 17,288 | 4,080 | 31 | |||||||||
Impairment of natural gas and oil properties |
7,963 | 20,788 | 12,825 | 161 | |||||||||
General and administrative |
25,700 | 16,711 | (8,989 | ) | (35 | ) | |||||||
Total operating expenses |
55,394 | 68,849 | 13,455 | 24 | |||||||||
Operating loss |
(39,942 |
) |
(40,709 |
) |
(767 |
) |
2 |
||||||
Other income (expense): |
|||||||||||||
Gain on property sales |
46 | 802 | 756 | — | |||||||||
Gain on derivative instruments |
63 | 7,865 | 7,802 | — | |||||||||
Interest expense |
(4,582 | ) | (6,787 | ) | (2,205 | ) | 48 | ||||||
Other income (expense) |
160 | (566 | ) | (726 | ) | (454 | ) | ||||||
Total other income (expense) |
(4,313 | ) | 1,314 | 5,627 | (131 | ) | |||||||
Loss from continuing operations before taxes |
(44,255 |
) |
(39,395 |
) |
4,860 |
(11 |
) |
||||||
Income tax expense |
(33 |
) |
(13 |
) |
20 |
(61 |
) |
||||||
Loss from continuing operations |
(44,288 |
) |
(39,408 |
) |
4,880 |
(11 |
) |
||||||
Income from discontinued operations |
2,150 |
5,912 |
3,762 |
175 |
|||||||||
Net loss |
(42,138 |
) |
(33,496 |
) |
8,642 |
(21 |
) |
||||||
Less: net loss attributable to non-controlling interests |
1,365 |
— |
(1,365 |
) |
— |
||||||||
Net loss attributable to Cinco Resources, Inc. stockholders |
$ |
(40,773 |
) |
$ |
(33,496 |
) |
$ |
7,277 |
(18 |
) |
|||
Expenses per Mcfe: |
|||||||||||||
Lease operating |
$ | 1.23 | $ | 0.95 | $ | (0.28 | ) | (23 | ) | ||||
Workovers |
0.19 | 0.28 | 0.09 | 47 | |||||||||
Severance and ad valorem taxes |
0.31 | 0.26 | (0.05 | ) | (16 | ) | |||||||
Depletion, depreciation and amortization |
3.29 | 2.45 | (0.84 | ) | (26 | ) | |||||||
General and administrative |
6.40 | 2.37 | (4.03 | ) | (63 | ) | |||||||
Lease operating and workovers. The increase in our lease operating expense of 35% in 2010, as compared to 2009, resulted from the combination of a 76% increase in production from 4.0 Bcfe in 2009 to 7.1 Bcfe in 2010 and a 23% decrease in our expense per unit. The decrease in our expense per unit was attributable to our ability to spread our fixed well operating costs over a larger production volume. The increase in workover expense resulted from greater workover activity on some of our
67
conventional South Texas properties during the year ended December 31, 2010 as compared to the year ended December 31, 2009.
Severance and ad valorem taxes. The increase in our severance and ad valorem taxes was primarily due to the increases in our production and revenues by 76% and 82%, respectively, for the year ended December 31, 2010 as compared to the year ended December 31, 2009.
Exploration. The increase in exploration costs was primarily attributable to an increase in seismic purchases and other geological and geophysical expenses incurred in 2010 relative to 2009.
Depletion, depreciation and amortization. The increase in our depletion, depreciation and amortization expense resulted from the combination of an 76% increase in production in 2010 relative to 2009 and a 26% decrease in our depletion expense per unit-of-production for 2010 relative to 2009. The decrease in our depletion expense per unit of production resulted primarily from our addition in 2010 of estimated proved reserves associated with our Woodford Shale properties.
Impairment of natural gas and oil properties. Impairment charges on our oil and gas properties consisted of the following during the years ended December 31:
| |
2009 | 2010 | |||||
|---|---|---|---|---|---|---|---|
Proved Properties: |
|||||||
Other South Texas Properties |
$ | 4,742 | $ | 16,541 | |||
Woodford Shale |
2,207 | — | |||||
Other Areas |
211 | 349 | |||||
Unproved Properties |
|||||||
Other South Texas Properties |
— | 2,122 | |||||
Woodford Shale |
— | 1,637 | |||||
Other Areas |
803 | 139 | |||||
Total Impairment |
$ | 7,963 | $ | 20,788 | |||
Impairment charges on our proved properties resulted from declines in natural gas prices that reduced our estimated future net cash flow related to these properties during both the years ended December 31, 2009 and 2010. Unproved property impairments recorded during both periods resulted primarily from our decision to not pursue development on certain leaseholds in the respective areas.
General and administrative expense. Our general and administrative expense decreased by approximately 35% for the year ended December 31, 2010 as compared to the year ended December 31, 2009. This decrease was primarily the result of a $1.5 million decrease in personnel expense related synergies realized with our acquisition of a private Arkoma Basin company. In addition to these personnel synergies, consulting expense decreased by approximately $3.5 million as a result of lower legal, tax and accounting fees, and miscellaneous expenses decreased by $2.6 million primarily due to decreased legal settlement expenses.
68
Gain (loss) on derivative instruments. The following table summarizes our gain (loss) on derivative instruments for the periods indicated.
| |
Year Ended December 31, | ||||||
|---|---|---|---|---|---|---|---|
| |
2009 | 2010 | |||||
| |
(in thousands) |
||||||
Gain (loss) on derivative instruments: |
|||||||
Realized commodity derivative gain (loss) |
$ | (33 | ) | $ | 4,546 | ||
Unrealized commodity derivative gain |
1,124 | 5,156 | |||||
Total commodity derivative gain |
1,091 | 9,702 | |||||
Realized interest rate derivative loss |
(340 |
) |
(978 |
) |
|||
Unrealized interest rate derivative loss |
(688 | ) | (859 | ) | |||
Total interest rate derivative loss |
(1,028 | ) | (1,837 | ) | |||
Total gain on derivative instruments |
$ | 63 | $ | 7,865 | |||
Our unrealized gain on commodity derivatives was $5.2 million for 2010, compared to a gain of $1.1 million during 2009.
During the period from January 1, 2010 through December 31, 2010, the net fair value of our commodity derivatives increased from $1.1 million to $6.3 million, resulting in a net unrealized gain of $5.2 million for the year ended December 31, 2010. This increase in the net fair value of our commodity derivatives was primarily due to a decrease in natural gas prices during 2010. During the period from January 1, 2009 through December 31, 2009, the net fair value of our commodity derivatives increased from $0.0 million to $1.1 million, resulting in a net unrealized gain of $ 1.1 million for the year ended December 31, 2009. This increase in the net fair value of our commodity derivatives was primarily due to a decrease in natural gas prices in 2009 and the initiation of a commodity risk management strategy using derivatives.
Our realized losses from interest rate derivatives increased to $1.0 million for the year ended December 31, 2010 as compared to a loss of $0.3 million for the year ended December 31, 2009. We recorded an unrealized loss of $0.9 million for the year ended December 31, 2010 as compared to an unrealized loss of $0.7 million for the year ended December 31, 2009. The losses we recorded in the years ended December 31, 2010 and 2009 related to a decrease in the one month LIBOR rates during the applicable periods. The impacts of our commodity derivatives are described in our discussion of revenues.
Interest expense. During the year ended December 31, 2010, the amount drawn on our senior secured revolving credit facility was higher than in 2009, and we ended the year with a balance of $56.0 million, as compared to the year-end balance of $40.7 million in 2009. This increase in borrowings was the primary reason for higher interest expense in 2010 as compared to 2009.
Income (loss) from discontinued operations. During the year ended December 31, 2010 and the nine months ended September 30, 2011, we sold portions of our Arkoma Basin properties that were either located in non-core areas of our operations in the Arkoma Basin or represented small, non-operated interests in such properties. The increase in income from discontinued operations resulted from increased gains on sale and higher revenues due primarily to increased commodity prices. Properties sold during the year ended December 31, 2010 resulted in a gain of $2.1 million while there were no properties sold during the year ended December 31, 2009. The net results of operations on sold properties increased by $1.7 million from 2009 to 2010, due primarily to increased commodity prices realized during 2010 as compared to 2009.
69
Year ended December 31, 2009 as compared to year ended December 31, 2008
The following table summarizes our operating expenses and other income (expense) for the periods indicated.
| |
Year Ended December 31, |
|
|
||||||||||
|---|---|---|---|---|---|---|---|---|---|---|---|---|---|
| |
Total Unit Change |
Total % Change |
|||||||||||
| |
2008 | 2009 | |||||||||||
| |
(in thousands, except as otherwise noted) |
||||||||||||
Operating expenses: |
|||||||||||||
Lease operating |
$ | 4,326 | $ | 4,947 | $ | 621 | 14 | % | |||||
Workovers |
3,434 | 764 | (2,670 | ) | (78 | ) | |||||||
Severance and ad valorem taxes |
1,287 | 1,265 | (22 | ) | (2 | ) | |||||||
Exploration |
6,839 | 1,547 | (5,292 | ) | (77 | ) | |||||||
Depletion, depreciation and amortization |
7,130 | 13,208 | 6,078 | 85 | |||||||||
Impairment of natural gas and oil properties |
4,536 | 7,963 | 3,427 | 76 | |||||||||
General and administrative |
9,083 | 25,700 | 16,617 | 183 | |||||||||
Total operating expenses |
36,635 | 55,394 | 18,759 | 51 | |||||||||
Operating loss |
(15,890 |
) |
(39,942 |
) |
(24,052 |
) |
151 |
||||||
Other income (expense): |
|||||||||||||
Gain on property sales |
168 | 46 | (122 | ) | (73 | ) | |||||||
Gain on derivative instruments |
— | 63 | 63 | — | |||||||||
Interest expense |
(425 | ) | (4,582 | ) | (4,157 | ) | 978 | ||||||
Other income |
746 | 160 | (586 | ) | (79 | ) | |||||||
Total other income (expense) |
489 | (4,313 | ) | (4,802 | ) | — | |||||||
Loss from continuing operations before taxes |
(15,401 |
) |
(44,255 |
) |
(28,854 |
) |
187 |
||||||
Income tax expense |
(16 |
) |
(33 |
) |
(17 |
) |
106 |
||||||
Loss from continuing operations |
(15,417 |
) |
(44,288 |
) |
(28,871 |
) |
187 |
||||||
Income from discontinued operations |
— |
2,150 |
2,150 |
— |
|||||||||
Net loss |
(15,417 |
) |
(42,138 |
) |
(26,721 |
) |
173 |
||||||
Less: net loss attributable to non-controlling interests |
— |
1,365 |
1,365 |
— |
|||||||||
Net loss attributable to Cinco Resources, Inc. stockholders |
$ |
(15,417 |
) |
$ |
(40,773 |
) |
$ |
(25,356 |
) |
164 |
|||
Expenses per Mcfe: |
|||||||||||||
Lease operating |
$ | 2.04 | $ | 1.23 | $ | (0.81 | ) | (40 | ) | ||||
Workovers |
1.62 | 0.19 | (1.43 | ) | (88 | ) | |||||||
Severance and ad valorem taxes |
0.61 | 0.31 | (0.30 | ) | (49 | ) | |||||||
Depletion, depreciation and amortization |
3.37 | 3.29 | (0.08 | ) | (2 | ) | |||||||
General and administrative |
4.29 | 6.40 | 2.11 | 49 | |||||||||
Lease operating and workovers. Our increase in lease operating expense of 14% in 2009 relative to 2008 resulted from a 90% increase in production from 2.1 Bcfe in 2008 to 4.0 Bcfe in 2009. As a result of this increase in production, our lease operating expense per unit decreased in 2009 as we were able to spread our fixed production costs over a larger volume base. Our workovers decreased significantly during 2009 as compared to 2008 as a result of lower workover activity on some of our conventional
70
South Texas properties during the year ended December 31, 2009 as compared to the year ended December 31, 2008.
Exploration. The decrease in exploration and dry hole costs in 2009, as compared to 2008, was primarily attributable to unsuccessful South Texas exploration activity in 2008.
Depletion, depreciation and amortization. The increase in our depletion, depreciation and amortization in 2009 relative to 2008 resulted from the combination of a 90% increase in production in 2009 and a slight decrease in our depletion expense per unit-of-production for 2009 as compared to 2008.
Impairment of natural gas and oil properties. Impairment charges on our oil and gas properties consisted of the following during the years ended December 31:
| |
2008 | 2009 | |||||
|---|---|---|---|---|---|---|---|
Proved Properties: |
|||||||
Other South Texas Properties |
$ | 4,295 | $ | 4,742 | |||
Woodford Shale |
— | 2,207 | |||||
Other Areas |
— | 211 | |||||
Unproved Properties |
|||||||
Other South Texas Properties |
241 | — | |||||
Other Areas |
— | 803 | |||||
Total Impairment |
$ | 4,536 | $ | 7,963 | |||
Impairment charges on our proved properties resulted from declines in natural gas prices that reduced our estimated future net cash flow related to these properties. Unproved property impairments recorded during both periods resulted primarily from our decision to not pursue development on certain leaseholds in the respective areas.
General and administrative expense. The significant increase in our general and administrative expense of 183% in 2009 relative to 2008 was primarily attributable to our acquisition in 2009 of a private Arkoma Basin company. Personnel costs increased by $11.4 million in 2009 over 2008 as we retained most of the staff of the acquired company for the first eight months of 2009 and provided severance upon their departure. Additionally, professional services increased $3.0 million in 2009 over 2008. These professional services consisted largely of consulting, legal, tax and accounting related to the Arkoma Basin acquisition. Moreover, miscellaneous expenses increased $2.5 million in 2009 relative to 2008 largely due to the payment of a legal judgment in 2009 related to litigation involving the acquired Arkoma Basin company.
71
Gain (loss) on derivative instruments. The following table summarizes our gain (loss) on derivative instruments for the periods indicated.
| |
Year Ended December 31, | ||||||
|---|---|---|---|---|---|---|---|
| |
2008(1) | 2009 | |||||
| |
(in thousands) |
||||||
Gain (loss) on derivative instruments: |
|||||||
Realized commodity derivative loss |
$ | — | $ | (33 | ) | ||
Unrealized commodity derivative gain |
— | 1,124 | |||||
Total commodity derivative gain |
— | 1,091 | |||||
Realized interest rate derivative loss |
— |
(340 |
) |
||||
Unrealized interest rate derivative loss |
— | (688 | ) | ||||
Total interest rate derivative loss |
— | (1,028 | ) | ||||
Total gain on derivative instruments |
$ | — | $ | 63 | |||
- (1)
- There were no commodity or interest rate derivatives in 2008.
Our unrealized gain on commodity derivatives was $1.1 million for 2009, and we had no commodity derivative positions in 2008.
During the period from January 1, 2009 through December 31, 2009, the net fair value of our commodity derivatives increased from $0.0 million to $1.1 million, resulting in a net unrealized gain of $1.1 million for the year ended December 31, 2009. This increase in the net fair value of our commodity derivatives was primarily due to a decrease in natural gas prices during 2009 and the initiation of our commodity risk management strategy utilizing derivatives. During the period from January 1, 2008 through December 31, 2008, we had no unrealized gains or losses as we had no commodity derivative positions.
Our realized losses from interest rate derivatives increased to $0.3 million for the year ended December 31, 2009 as compared to a loss of $0.0 million for the year ended December 31, 2008. We recorded an unrealized loss of $0.7 million for the year ended 2009 as compared to an unrealized loss of $0.0 million for the year ended 2008. The losses we recorded in the year ended December 31, 2009 related to a decrease in the one month LIBOR rates during 2009 and the initiation of our interest rate risk management strategy in 2009. We had no interest rate derivatives in 2008.
Interest expense. Our interest expense increased significantly in 2009 as compared to 2008. During 2009, the amount drawn on our senior secured revolving credit facility was higher than in 2008, and we ended the year with a balance of $40.7 million as compared to the year-end balance of $12.0 million for 2008. This increase in borrowings was the primary reason for higher interest expense in 2009 as compared to 2008.
Income from non-controlling interest. The income from non-controlling interest in 2009 is related to the acquisition of a portion of the stock of a private Arkoma Basin company in the first quarter of 2009. We acquired the remaining stock of this entity in the third quarter of 2009, making it our wholly-owned subsidiary.
Critical Accounting Policies and Estimates
The discussion and analysis of our financial condition and results of operations are based on our consolidated financial statements and have been prepared in accordance with GAAP and include the accounts of Cinco Resources, Inc. and its wholly-owned subsidiaries. All significant intercompany accounts and transactions have been eliminated.
72
In preparing the accompanying financial statements, management has made certain estimates and assumptions that affect reported amounts in the financial statements and disclosures of contingencies. We have outlined below certain accounting policies that are of particular importance to the presentation of our financial condition and results of operations and require the application of significant judgment or estimates by our management. Actual results may differ from those estimates. Significant assumptions are required in the valuation of proved oil and natural gas reserves, share-based compensation, asset retirement obligations, and deferred income tax assets and liabilities. It is at least reasonably possible these estimates could be revised in the near term, and these revisions could be material.
Revenues and accounts receivable
We recognize revenues for our production when the quantities are delivered to, or collected by, the respective purchaser using the sales method. Delivery or collection by a customer occurs at the custody transfer point, which is typically when the natural gas enters a third party's pipeline or oil exits the lease by truck. Prices for such production are defined in sales contracts and are readily determinable based on certain publicly available indices. All transportation costs are included in lease operating expense.
Method of accounting for oil and natural gas properties
We use the successful efforts method of accounting for our oil and natural gas producing activities. Costs to acquire mineral interests in natural gas and oil properties and to drill and equip development wells and related asset retirement costs are capitalized. Costs to drill exploratory wells are capitalized pending determination of whether the wells have found proved reserves. If we determine that the wells did not find proved reserves, the costs are charged to expense. There were no exploratory wells capitalized, pending determination of whether the wells found proved reserves at December 31, 2010 or 2009.
Geological and geophysical costs, including seismic studies and costs of carrying and retaining unproved properties are charged to expense as incurred. We capitalize interest on expenditures for significant exploration and development projects that last more than one year while activities are in progress to bring the assets to their intended use. Through December 31, 2010 and 2009, we have not capitalized any interest costs because our exploration and development projects generally last less than one year. Costs incurred to maintain wells and related equipment are charged to expense as incurred. On the sale or retirement of a complete unit of a proved property, the cost and related accumulated depletion, depreciation and amortization are eliminated from the property accounts, and the resulting gain or loss is recognized. On the retirement or sale of a partial unit of proved property, the cost is charged to accumulated depletion and amortization with a resulting gain or loss recognized in income.
Capitalized amounts attributable to proved natural gas and oil properties are depleted by the unit-of-production method over proved reserves. Unproved natural gas and oil properties that are individually significant are periodically assessed for impairment of value, and a loss is recognized at the time of impairment by providing an impairment allowance.
Capitalized costs related to proved natural gas and oil properties, including wells and related equipment and facilities, are evaluated for impairment based on an analysis of undiscounted future net cash flows. If undiscounted cash flows are insufficient to recover the net capitalized costs related to proved properties, then we recognize an impairment charge in income from operations equal to the difference between the net capitalized costs related to proved properties and their estimated fair values based on the present value.
On the sale of an entire interest in an unproved property for cash or cash equivalent, gain or loss on the sale is recognized, taking into consideration the amount of any recorded impairment if the
73
property had been assessed individually. If a partial interest in an unproved property is sold, the amount received is treated as a reduction of the cost of the interest retained.
Share-based compensation
We measure and record compensation expense for all share-based payment awards to employees and directors based on estimated grant-date fair values. Compensation costs for share-based awards are recognized over the requisite service period based on the grant-date fair value.
Derivative instruments
We are exposed to certain risks relating to our ongoing business operations. Our largest areas of risk exposure relate to commodity prices and interest rates. We use derivative instruments primarily to manage commodity price risk and interest rate risk.
All derivative financial instruments are recognized at fair value as either assets or liabilities on our consolidated balance sheet. Changes in the fair value of these derivative financial instruments are recorded in the consolidated statement of operations. Cash settlements with counterparties to our derivative financial instruments are also recorded in the consolidated statement of operations. By using derivative financial instruments to hedge exposures to changes in commodity prices and interest rates, we expose ourselves to credit risk and market risk. Credit risk is the failure of the counterparty to perform under the terms of the derivative contract. To mitigate this risk, the derivative instruments are placed with a number of counterparties whom we believe to be creditworthy. It is our policy to enter into derivative contracts only with counterparties deemed by management to be competent and competitive market makers.
Market risk is the change in the value of a derivative financial instrument that results from a change in commodity prices, interest rates or other relevant factors affecting the value of the derivative. The market risks associated with commodity price and interest rate contracts are managed by establishing and monitoring parameters that limit the types and degree of market risk that may be undertaken. We do not hold or issue derivative financial instruments for speculative trading purposes.
Fair value measures
Certain of our assets and liabilities are measured at fair value at each reporting date. Fair value represents the price that would be received to sell the asset or paid to transfer the liability in an orderly transaction between market participants. This price is commonly referred to as the "exit price."
Fair value measurements are classified according to a hierarchy that prioritizes the inputs underlying the valuation techniques. This hierarchy consists of three broad levels. Level 1 inputs on the hierarchy consist of unadjusted quoted prices in active markets for identical assets and liabilities and have the highest priority. Level 2 measurements are based on inputs other than quoted prices that are generally observable for the asset or liability. Common examples of Level 2 inputs include quoted prices for similar assets and liabilities in active markets or quoted prices for identical assets and liabilities in markets not considered to be active. Level 3 measurements have the lowest priority and are based upon inputs that are not observable from objective sources. The most common Level 3 fair value measurement is an internally developed cash flow model. We use valuation techniques based on the available inputs to measure the fair values of our assets and liabilities.
Oil and natural gas reserve quantities and future net revenues
Netherland, Sewell & Associates, Inc., our independent reserve engineers, has prepared our estimates of oil and natural gas reserves and associated future net revenues. While the SEC has recently adopted rules which allow us to disclose proved, probable and possible reserves, we have elected to present only estimated proved reserves in this prospectus. The SEC's revised rules define proved reserves as the quantities of oil and natural gas, which, by analysis of geoscience and
74
engineering data, can be estimated with reasonable certainty to be economically producible—from a given date forward, from known reservoirs, and under existing economic conditions, operating methods and government regulations—prior to the time at which contracts providing the right to operate expire, unless evidence indicates that renewal is reasonably certain, regardless of whether deterministic or probabilistic methods are used for the estimation. The project to extract the hydrocarbons must have commenced or the operator must be reasonably certain that it will commence the project within a reasonable time. Our independent reserve engineers must make many subjective assumptions based on their professional judgment in developing reserves estimates. Reserves estimates are updated at least annually and consider recent production levels and other technical information about each well. Estimating oil and natural gas reserves is complex and is not exact because of the numerous uncertainties inherent in the process. The process relies on interpretations of available geological, geophysical, petrophysical, engineering and production data. The extent, quality and reliability of both the data and the associated interpretations can vary. The process also requires certain economic assumptions, including, but not limited to, oil and natural gas prices, revenues, development expenditures, operating expenses, capital expenditures and taxes. Actual future production, oil and natural gas prices, revenues, taxes, development expenditures, operating expenses and quantities of recoverable oil and natural gas will most likely vary from our estimates. Accordingly, reserves estimates are generally different from the quantities of oil and natural gas that are ultimately recovered. Any significant variance could materially and adversely affect our future reserves estimates, financial position, results of operations and cash flows. We cannot predict the amounts or timing of future reserves revisions. If such revisions are significant, they could significantly affect future amortization of capitalized costs and result in impairment of assets that may be material.
Recent Accounting Pronouncements
Fair value
In May 2011, the FASB issued Accounting Standards Update, or ASU, 2011-04 Amendments to Achieve Common Fair Value Measurement and Disclosure Requirements in U.S. GAAP and IFRS which provides a consistent definition of fair value and common requirements for measurement of and disclosure about fair value between GAAP and International Financial Reporting Standards. This new guidance changes some fair value measurement principles and disclosure requirements, but does not require additional fair value measurements and is not intended to establish valuation standards or affect valuation practices outside of financial reporting. The update is effective for annual periods beginning after December 15, 2011 and we are in the process of evaluating the impact, if any, the adoption of this update will have on our financial statements.
Internal Controls and Procedures
We have begun the process of evaluating our internal control over financial reporting. We are in the early phases of our review and will not complete our review until well after this offering is completed. We cannot predict the outcome of our review at this time. During the course of the review, we may identify control deficiencies, which could give rise to significant deficiencies and other material weaknesses. Management has taken steps to improve our internal control over financial reporting, including the implementation of new accounting processes and control procedures and the identification of gaps in our skills base and expertise of the staff required to meet the financial reporting requirements of a public company.
We are not currently required to comply with the SEC's rules implementing Section 404 of the Sarbanes Oxley Act, and are therefore not required to make a formal assessment of the effectiveness of our internal control over financial reporting for that purpose. Upon becoming a public company, we will be required to comply with the SEC's rules implementing Section 302 of the Sarbanes-Oxley Act, which will require our management to certify financial and other information in our quarterly and annual reports and provide an annual management report on the effectiveness of our internal control
75
over financial reporting. We will not be required to make our first assessment of our internal control over financial reporting until the year following our first annual report required to be filed with the SEC. To comply with the requirements of being a public company, we will need to upgrade our systems, including information technology, implement additional financial and management controls, reporting systems and procedures and hire additional accounting, finance and legal staff.
Our independent registered public accounting firm is not yet required to formally attest to the effectiveness of our internal controls over financial reporting until such time as we become an "accelerated filer" as defined in Rule 12b-2 of the Exchange Act. When and if it is required to do so, our independent registered public accounting firm may issue a report that is adverse in the event it is not satisfied with the level at which our controls are documented, designed, operated or monitored.
Quantitative and Qualitative Disclosures About Market Risk
The primary objective of the following information is to provide forward-looking quantitative and qualitative information about our potential exposure to market risk. The term "market risk" refers to the risk of loss arising from adverse changes in oil and gas prices and interest rates. The disclosures are not meant to be precise indicators of expected future losses, but rather indicators of how we view and manage our ongoing market risk exposures. All of our market risk sensitive instruments were entered into to manage commodity price or interest rate risk, rather than for speculative trading.
Commodity price exposure
For a discussion of how we use financial commodity put, collar, swap and basis swap contracts to mitigate some of the potential negative impact on our cash flow caused by changes in oil and gas prices, see "—Derivative Instruments."
76
A summary of our commodity derivative positions as of September 30, 2011 through the periods presented below is as follows:
| |
Contract Period | |||||||||
|---|---|---|---|---|---|---|---|---|---|---|
Position Descriptions
|
2011 | 2012 | 2013 | |||||||
Swaps (MMBtu) |
— | 1,362,500 | 912,500 | |||||||
Average price per MMBtu |
$ | — | $ | 5.17 | $ | 5.22 | ||||
Closed out swaps (MMBtu)(1) |
814,900 |
— |
— |
|||||||
Average price per MMBtu |
$ | 0.62 | — | — | ||||||
Two-way collars (MMBtu) |
85,000 |
127,500 |
— |
|||||||
Average price per MMBtu |
||||||||||
Ceiling sold price (call) |
$ | 7.50 | $ | 7.50 | $ | — | ||||
Floor purchased price (put) |
7.00 | 7.00 | — | |||||||
Three-way collars (MMBtu) |
85,000 |
127,500 |
— |
|||||||
Average price per MMBtu |
||||||||||
Ceiling sold price (call) |
$ | 8.55 | $ | 8.55 | $ | — | ||||
Floor purchased price (put) |
7.00 | 7.00 | — | |||||||
Floor sold price (put) |
5.00 | 5.00 | — | |||||||
Put spreads (MMBtu)(2) |
579,000 |
2,546,000 |
— |
|||||||
Average price per MMBtu |
||||||||||
Floor purchased price (put) |
$ | 6.66 | $ | 6.59 | $ | — | ||||
Floor sold price (put) |
4.51 | 4.81 | — | |||||||
Sold calls (MMBtu) |
524,000 |
514,710 |
— |
|||||||
Average price per MMBtu |
||||||||||
Ceiling sold price (call) |
$ | 5.83 | $ | 6.40 | $ | — | ||||
Basis swaps (NYMEX-CPE) |
||||||||||
Volume (MMBtu) |
646,798 | 1,448,077 | — | |||||||
Average price per MMBtu |
$ | (0.53 | ) | $ | (0.49 | ) | $ | — | ||
- (1)
- Closed
out swaps represent an offsetting purchased and sold swap with the $MMBtu representing the difference between the two which will be received by Cinco
regardless of future price movements in the underlying commodity.
- (2)
- Natural gas put spread positions incorporate long put positions assuming a floor purchased price (put) and a floor sold price (put) of zero.
Interest rate risk
As part of our senior secured revolving credit facility and our second lien term loan facility, we have debt which bears interest at floating rates. At September 30, 2011, the indebtedness outstanding on our senior secured revolving credit facility was $53.0 million and bore an interest rate of approximately 3.35%, while the $30.0 million outstanding as of that date on our second lien term loan facility bore an interest rate of 13.0% Based on the total outstanding borrowing under our senior secured revolving credit facility at September 30, 2011, a 1.0% increase in LIBOR or base rate levels would result in an estimated $0.5 million increase in interest expense for the year ended December 31, 2011 before giving effect to interest rate derivatives. While our second lien term loan facility is a floating rate facility, the levels of the interest rate floors of 3.50% for LIBOR borrowing and 5.00% for base rate borrowings are well above the 3-month LIBOR levels of 0.35% or base rate levels of 3.25% at September 30, 2011. Therefore, a 1.0% change in LIBOR or base rate levels would not impact the 13.0% interest rate paid on our second lien term loan.
77
Through interest rate derivative contracts, we have attempted to mitigate our exposure to changes in interest rates. We have entered into fixed interest rate swap agreements which hedge our exposure to interest rate variations on our senior secured revolving credit facility. As shown in the following table, at September 30, 2011, we had interest rate swaps outstanding for a notional amount of $50.0 million with fixed pay rates averaging 2.21% that expire in September 2013.
| |
Remaining 2011 | 2012 | |||||
|---|---|---|---|---|---|---|---|
Notional principal amount (in thousands) |
$ | 50,000 | $ | 50,000 | |||
Weighted average interest rates |
2.21 | % | 2.21 | % | |||
Counterparty risk and customer concentration
Our principal exposures to credit risk are through receivables resulting from commodity derivatives contracts (approximately $6.1 million at November 30, 2011), joint interest receivables and the receivables from the sale of our oil and natural gas production to energy marketing companies and pipeline companies. We are subject to credit risk due to the concentration of our oil and natural gas receivables with several significant customers. We do not generally require our customers to post collateral, and the inability of our significant customers to meet their obligations to us, or their insolvency or liquidation, may adversely affect our financial results.
For the year ended December 31, 2010, natural gas and oil sales to four purchasers amounted to approximately 60% of our total natural gas and oil sales. For the year ended December 31, 2009, natural gas and oil sales to two purchasers amounted to approximately 40% of our total natural gas and oil sales. Management believes that there are potential alternative purchasers. However, there can be no assurance that we can establish such relationships or that those relationships will result in increased purchases.
Off-Balance Sheet Arrangements
As of September 30, 2011, we did not have any off-balance sheet arrangements.
78
Overview
We are an independent exploration and production company focused on the acquisition and development of unconventional oil and natural gas resources. Our assets are located primarily in three core areas: the Eagle Ford Shale in South Texas, the Powder River Basin of Wyoming and the Woodford Shale in the Arkoma Basin of eastern Oklahoma. Our management and senior technical team have significant operational experience in these basins, as well as in the geological zones we target for development. We have accumulated a balanced portfolio of assets comprised of more mature, gas-prone Woodford Shale assets and less-developed, oil-prone properties in the Eagle Ford Shale and Powder River Basin. The majority of our Woodford Shale assets are held by production. We intend to focus most of our near-term activities on the development of our Eagle Ford Shale assets, as well as further evaluation of our Powder River Basin properties.
We have accumulated approximately 138,000 net acres across our operational footprint, approximately 66% of which are undeveloped. Our property base consists of 935 gross (368.5 net) identified drilling locations. Given the early stage in our evaluation of the play, so far, we have identified 24 gross (23.9 net) drilling locations on our Powder River Basin acreage. Netherland, Sewell & Associates, Inc., our independent reserve engineers, estimated our proved reserves as of May 31, 2011 to be 222.5 Bcfe, of which approximately 90% were natural gas and 33% were classified as proved developed reserves. For December 2011, our average net daily production was 30.0 MMcfed, approximately 66% of which was natural gas. We exercise a high degree of operational control over our assets. We operated approximately 89% of our estimated proved reserves on a volume basis as of May 31, 2011 and approximately 90% of our average daily net production for December 2011.
The majority of our Eagle Ford Shale acreage was acquired from March 2007 to June 2010 and is located in southeastern Atascosa, Karnes, Live Oak and Zavala counties in South Texas. We have over 12,900 net acres in what we believe to be a largely oil-prone portion of the play. The Eagle Ford Shale is one of the most active resource plays in the United States, with a rig count of over 200 in November 2011. We drilled and completed 12 gross (10.8 net) wells on our Eagle Ford Shale acreage through December 2011, and we plan to devote a significant portion of our drilling capital to this play in the near term. For the month of December 2011, net production from our Eagle Ford Shale wells averaged 10.5 MMcfed, consisting of 81% oil, 8% natural gas liquids and 11% natural gas.
Since acquiring our first acreage in the Powder River Basin in April 2011, we have established a position of over 64,000 net acres in Niobrara and Weston counties in Wyoming. The Powder River Basin is one of the key oil and natural gas-producing basins located in the Rocky Mountain states of Wyoming and Montana. Much of the recent industry focus in this area has been centered around the oil-prone Niobrara Shale. We believe our acreage offers multiple stacked horizons prospective for oil that include the Niobrara Shale as well as the Turner Sandstone, Mowry Shale and Muddy Sandstone. We believe the basin's geological characteristics and historical vertical well data support the development of our acreage as an economic oil resource play. Throughout the Powder River Basin, and specifically to the north and west of our acreage, significant drilling activity is currently being conducted by industry participants like Chesapeake Energy, EOG Resources and El Paso Corp. We are currently evaluating our Powder River Basin acreage position and developing a drilling plan.
We acquired our initial Woodford Shale assets in March 2009 and have over 26,600 net acres in Atoka, Pittsburg and Haskell counties in Oklahoma. The Woodford Shale is one of the more mature and prolific shale gas plays in the United States, with over 1,000 horizontal wells drilled in the Arkoma Basin Woodford Shale since the first horizontal well was drilled in this play in 2005. A substantial portion of our acreage is positioned within one of the more actively drilled parts of the play, allowing us to utilize significant data from nearby analogous wells as well as our own development expertise to better determine well potential. We believe our acreage represents a high-quality natural gas
79
component for our portfolio due to its low-risk development profile, scale and largely held-by-production status.
The following table provides our summary operating data:
| |
|
Identified Drilling Locations(1) |
|
|
Estimated Proved Reserves as of May 31, 2011 |
December 2011 Average Daily Net Production |
||||||||||||||||||||||||||||
|---|---|---|---|---|---|---|---|---|---|---|---|---|---|---|---|---|---|---|---|---|---|---|---|---|---|---|---|---|---|---|---|---|---|---|
| |
|
Producing Wells(1) | ||||||||||||||||||||||||||||||||
| |
Net Acreage(1) |
|||||||||||||||||||||||||||||||||
| |
Gross | Net | PUDs(2) | Gross | Net | Bcfe | %Gas | %Developed | MMcfed | %Gas | ||||||||||||||||||||||||
South Texas: |
||||||||||||||||||||||||||||||||||
Eagle Ford Shale |
12,983 | 94 | 83.3 | 8 | 12 | 10.8 | 16 | 34 | % | 35 | % | 10.5 | 11 | % | ||||||||||||||||||||
Other |
3,607 | 37 | 21.8 | 19 | 44 | 16.5 | 46 | 74 | 38 | 3.2 | 81 | |||||||||||||||||||||||
Area |
16,590 | 131 | 105.1 | 27 | 56 | 27.3 | 62 | 64 | 37 | 13.7 | 27 | |||||||||||||||||||||||
Rocky Mountains: |
||||||||||||||||||||||||||||||||||
Powder River Basin(3) |
64,043 | 24 | 23.9 | — | 6 | 5.9 | — | — | — | 0.2 | 54 | |||||||||||||||||||||||
DJ Basin |
21,201 | — | — | — | 78 | 70.3 | 3 | 100 | 100 | 0.9 | 100 | |||||||||||||||||||||||
Area |
85,245 | 24 | 23.9 | — | 84 | 76.2 | 3 | 100 | 100 | 1.1 | 89 | |||||||||||||||||||||||
Arkoma Basin: |
||||||||||||||||||||||||||||||||||
Woodford Shale(4)(5) |
26,611 | 780 | 239.5 | 51 | 216 | 40.1 | 151 | 100 | 29 | 15.2 | 100 | |||||||||||||||||||||||
Other |
9,549 | — | — | — | 3 | 0.0 | 7 | 100 | 55 | — | — | |||||||||||||||||||||||
Area |
36,161 | 780 | 239.5 | 51 | 219 | 40.1 | 158 | 100 | 30 | 15.2 | 100 | |||||||||||||||||||||||
Total |
137,995 | 935 | 368.5 | 78 | 359 | 143.6 | 223 | 90 | % | 33 | % | 30.0 | 66 | % | ||||||||||||||||||||
- (1)
- As
of December 31, 2011.
- (2)
- Represents
the number of gross identified potential drilling locations to which proved undeveloped reserves were attributable, based on our May 31,
2011 reserve report.
- (3)
- Given
the early stage in our evaluation of the play, so far, we have identified 24 gross (23.9 net) drilling locations on our Powder River Basin acreage.
- (4)
- Gross
and net identified drilling locations in the Woodford Shale are primarily based on 80-acre spacing.
- (5)
- Includes Woodford Shale wells, all up-hole zones in Woodford Shale wells and Hunton wells with Woodford Shale offset locations.
In drilling our identified locations to establish commercial quantities of oil, natural gas liquids and natural gas production, we consider numerous factors that include but are not limited to the following:
- (i)
- the
presence of a prospective reservoir interval under our acreage,
- (ii)
- the
presence of hydrocarbons in the reservoir interval,
- (iii)
- the
ability to utilize existing and well proven methods to drill and complete wells in the reservoir that will produce hydrocarbons and
- (iv)
- the potential to produce hydrocarbons that will provide an acceptable rate of return based on drilling costs, amount and type of hydrocarbons recovered, commodity prices and operating costs.
We evaluated all of these factors in assessing our existing acreage and formulating our development plans in each of our core areas. We expect to develop the majority of our identified drilling locations utilizing horizontal drilling and hydraulic fracture stimulation, but have developed specific drilling and completion procedures and techniques in each of our core areas based on the reservoir conditions and other relevant factors.
80
As of December 31, 2011, we have identified a total of 935 gross potential drilling locations, 94 of which underlie our Eagle Ford Shale acreage, 24 of which underlie our Powder River Basin acreage, 780 of which underlie our Woodford Shale acreage and 37 of which underlie our non-Eagle Ford Shale South Texas acreage. We expect to drill our Eagle Ford Shale and Woodford Shale acreage horizontally. We will evaluate the merits of both horizontal drilling and vertical drilling on our Powder River Basin acreage. We expect to develop our non-Eagle Ford Shale South Texas acreage with vertical wells. We consider our Eagle Ford Shale, Powder River Basin and Woodford Shale as resource plays, with similar technical attributes used in identifying potential drilling locations. We consider our non-Eagle Ford Shale South Texas properties as a conventional play, with some, but not all, of the technical attributes used in identifying potential drilling locations in a resource play.
In the Woodford Shale and Eagle Ford Shale, we have identified potential locations through a combination of geological and engineering analysis. Both the Arkoma Basin of eastern Oklahoma and the Eagle Ford Shale of South Texas are historically productive basins where there is extensive geological and engineering information available. Specifically, this technical information includes open-hole log data, production statistics from operated and non-operated wells, petro-physical data describing the reservoir rock attributes and 2-D and 3-D seismic data. We have obtained this information from public sources and our own proprietary databases developed from our prior operational experience in these basins. Based on this data and our evaluation and analysis of it, we have developed detailed maps on which we have identified potential drilling locations. We plan an active drilling program in both of these areas subject to acceptable commodity prices, availability of drilling and completion equipment and qualified personnel and sufficient capital resources.
In the Powder River Basin, several intervals of interest have been developed historically using vertical wells on, and in close proximity to, our acreage. As of December 31, 2011, we had not drilled any wells on our Powder River Basin acreage and are basing our technical analysis on open-hole log data, production statistics from non-operated wells, petro-physical data describing the reservoir rock attributes and 2-D and 3-D seismic data. We believe several of the intervals, including the Niobrara Shale, the Turner Sandstone, the Mowry Shale and the Muddy Sandstone being developed on and around our acreage are potential oil resource plays. As such, we have used this technical data, particularly log and historical production data, in mapping the gross interval for these horizons that underlie a majority of our entire acreage position in the Powder River Basin. This is the main factor we considered in identifying our potential locations on this acreage. As of December 31, 2011, we had identified 24 drilling locations and expect to identify more potential drilling locations through the information we intend to gather from our drilling and re-completion activity and geological analysis planned for 2012. See "Risk Factors—Risks Related to the Oil and Natural Gas Industry and Our Business—Drilling locations that we decide to drill may not yield natural gas, oil or natural gas liquids in commercially viable quantities" and "Risk Factors—Risks Related to the Oil and Natural Gas Industry and Our Business—Our identified potential drilling location inventories are scheduled over several years, making them susceptible to uncertainties that could materially alter the occurrence or timing of their drilling. In addition, we may not be able to raise the substantial amount of capital that would be necessary to drill a substantial portion of our identified potential drilling locations."
Our capital expenditure budget is primarily focused on developing our Eagle Ford Shale acreage through the use of horizontal drilling and multi-stage fracture stimulation techniques, as well as further evaluating our Powder River Basin acreage. We will also continue to seek acreage in our three core areas. Through September 30, 2011, we had spent or committed to spend approximately $99.6 million
81
of our 2011 capital expenditure budget of $155.0 million. The following table details our anticipated capital expenditure budget by region for the year ending December 31, 2012:
| |
Number of Wells | |
||||||||
|---|---|---|---|---|---|---|---|---|---|---|
| |
Capital Expenditures |
|||||||||
| |
Gross | Net | ||||||||
| |
|
|
($ in millions) |
|||||||
Drilling |
||||||||||
Eagle Ford Shale |
11 | 11.0 | $ | 108.6 | ||||||
Powder River Basin |
3 | 3.0 | 21.6 | |||||||
Woodford Shale |
20 | 3.9 | 20.4 | |||||||
Other Areas(1) |
— | — | 2.8 | |||||||
Sub-total |
34 | 17.9 | 153.4 | |||||||
Leasehold, Seismic and Other(2) |
— | — | 18.6 | |||||||
Total |
34 | 17.9 | $ | 172.0 | ||||||
- (1)
- Includes
workovers on South Texas non-Eagle Ford Shale properties.
- (2)
- Includes a $13.5 million payment due in 2012 with respect to our acquisition of Powder River Basin acreage in November 2011.
The actual amount of capital we spend in 2012 may fluctuate materially based on market conditions and the success of our drilling results as the year progresses. Please see "Management's Discussion and Analysis of Financial Condition and Results of Operations—Liquidity and Capital Resources."
Our Strategies
Our primary objective is to increase stockholder value by growing estimated proved reserves, production and cash flow at attractive rates of return on invested capital. We intend to achieve this objective by pursuing the following strategies:
Continue Development of Our Eagle Ford Shale Assets; Accelerate Evaluation of Powder River Basin Properties
We intend to allocate over 84% of our 2012 drilling capital expenditure budget to drilling on our Eagle Ford Shale and Powder River Basin assets. We are actively developing our Eagle Ford Shale acreage and plan to drill 11 gross (11.0 net) wells in 2012. We intend to accelerate the evaluation of our Powder River Basin properties in 2012. This evaluation includes completing vertical wellbores, drilling and completing horizontal wells, analysis of core data, existing 3-D seismic data, production data and well data and continued review of industry activity in the area.
Balance Commodity Mix Through Growth in Oil Production
We believe our development efforts in the Eagle Ford Shale and Powder River Basin will better balance our commodity mix. While our current estimated proved reserves and production are predominantly natural gas from the Woodford Shale, the majority of our project inventory that we plan to develop through 2012 is oil-prone. As we develop this portion of our asset base, we believe our production profile will reflect a more oil-oriented commodity mix that capitalizes on the current commodity price environment. With over 64% of our Woodford Shale acreage held by production, we have the option to expand our natural gas development efforts as the commodity price environment supports such activity.
82
Enhance Returns Through Operational Efficiencies
Our management team is focused on continually improving efficiencies in developing and operating our asset base. We seek to manage drilling and completion costs to decrease the amount of initial capital invested in our wells, and we are building centralized infrastructure that can be repeatedly used for future development. Specifically, we have invested time and capital in planning and installing production infrastructure, such as central gas treating, oil and water storage and gas compression facilities that can service our future development needs with minimal additional capital investment. We also believe the concentration of our acreage position, the significant percentage of acreage that is already held by production and our high degree of operational control will allow us to realize cost efficiencies with future development.
Pursue Strategic Acquisitions within Our Core Areas
In the near term, we intend to continue to identify, evaluate and acquire additional acreage in our core areas. We intend to focus on acquiring undeveloped acreage with minimal existing production or producing acreage with significant undeveloped potential. While we do not currently have any plans to expand beyond our core areas, we may evaluate other basins that we believe have the potential for attractive returns.
Maintain Financial Discipline and Actively Manage Commodity Price Risk
We seek a capital structure with sufficient liquidity to execute our growth plans while maintaining conservative leverage, providing financial and operational flexibility. We manage commodity price risk through the use of derivatives that we continually evaluate. We intend to use a portion of the net proceeds from this offering to repay all of our outstanding indebtedness under our credit facilities.
Our Strengths
The following are our key competitive strengths that we believe will allow us to effectively execute our business strategies.
Substantial Acreage Positions in Key Unconventional Plays
We currently have a total of approximately 138,000 net acres in our three core operating areas. The majority of this acreage is in or near areas of considerable activity by both major and independent operators. We believe that a substantial portion of our acreage in the Eagle Ford Shale and Powder River Basin is oil-prone. We believe our Woodford Shale acreage represents a highly predictable and well-defined asset with significant value which we have continued to enhance through cost reduction and reserve and production enhancement initiatives. We hold the majority of our Woodford Shale acreage by production. We believe our lease terms in our other core areas will allow us to hold our other acreage within term based on our current drilling plans.
Powder River Basin Resource Potential
We currently have approximately 64,000 net acres in the Powder River Basin. We believe this acreage offers significant oil resource potential in a series of stacked horizons including the Niobrara Shale, Turner Sandstone, Mowry Shale and Muddy Sandstone. We believe the basin's geological characteristics and historic vertical well production data may support development as an economic oil resource play. We are continuing our geological analysis. Our operational program for 2012 contemplates fracture stimulating two existing vertical wells, re-entering and re-completing two existing short, horizontal wells and drilling three new additional horizontal wells.
83
Substantial Drilling Inventory
We have an inventory of 935 gross (368.5 net) identified drilling locations. In 2012 we plan to drill 34 gross (17.9 net) wells, leaving us a substantial drilling inventory for future years. Of our oil-prone assets, we have approximately 94 gross (83.3 net) identified drilling locations in the Eagle Ford Shale and 24 gross (23.9 net) locations currently identified in our Powder River Basin acreage. We expect to identify additional Powder River Basin drilling locations as we further evaluate this acreage. We also have a substantial natural gas drilling location inventory with approximately 780 gross (239.5 net) identified drilling locations in the Woodford Shale, as well as approximately 37 gross (21.8 net) identified locations on our other properties in South Texas.
High Degree of Operational Control
We operate over 92% of our net acreage and 86% of our identified drilling locations. Additionally, we operated approximately 89% of our estimated proved reserves on a volume basis as of May 31, 2011 and approximately 90% of our average daily net production for December 2011. We believe that this high level of operational control will enable us to develop our resource base in an efficient and cost-effective manner. Additionally, our operated positions enable us to better manage the pace of development and align our capital spending with our capital resources.
Proximity to Significant Industry Infrastructure and Access to Multiple Product Markets
Our core areas have substantial existing hydrocarbon transportation, processing and refining capacity, as well as access to multiple product sales points. We believe that our access to this infrastructure will allow us to get production on line more rapidly and achieve competitive product pricing when compared to other more remote producing basins.
Experienced, Incentivized Management and Employee Base
Our senior management team has significant experience in the oil and gas industry and has spent a substantial amount of their careers focused on our core areas. Our senior technical team is comprised of geoscience, engineering and operational professionals who average 28 years of industry experience and have worked extensively in multiple North American resource plays. Additionally, our management and employees will have a significant common stock ownership interest following the completion of this offering, which we believe will better align the interest of management, employees and stockholders.
Focus Areas
We have focused our efforts on developing a multi-year drilling inventory of onshore unconventional resource plays in geographic areas and geologic settings where our management and senior technical staff have significant experience. We have sought to develop this drilling inventory so that it consists of both natural gas and oil-prone projects, allowing us to enhance returns by allocating capital based on prevailing commodity price conditions. We have also sought to balance our portfolio between well established unconventional plays which have significant drilling and production history with earlier stage opportunities that have less horizontal drilling and modern fracture stimulation history available but provide a lower cost of entry. Based on these criteria, our focus is on three specific core areas consisting of the Eagle Ford Shale of South Texas, the Powder River Basin of Wyoming and the Woodford Shale in the Arkoma Basin of eastern Oklahoma.
South Texas—Eagle Ford Shale
The Eagle Ford Shale of South Texas extends from the Mexican border to the northeast into East Texas. It is an organically rich, Cretaceous age shale that is prospective in areas with depths ranging from 4,000 to 14,000 feet and formation thicknesses of 75 to 300 feet. Depending on several factors,
84
but primarily on depth, the Eagle Ford Shale has three distinctive phase windows—a dry gas window, a wet gas window and an oil window. The dry gas window produces natural gas with little associated oil or natural gas liquids, the wet gas window produces natural gas with significant amounts of associated oil and natural gas liquids and the oil window produces oil with some associated natural gas that contains significant amounts of natural gas liquids. The dry gas window runs along the southern portion of the play and transitions into the wet gas window moving north before transitioning into the oil window in the northern part of the play. The first horizontal Eagle Ford Shale well was drilled in 2008 in LaSalle County. Since then, drilling activity has expanded across South Texas to the counties of Atascosa, Bee, Dewitt, Dimmit, Frio, Gonzales, Karnes, Lavaca, Live Oak, Maverick, McMullen, Webb, Wilson and Zavala.
The Eagle Ford Shale is one of the most active domestic onshore unconventional plays with a reported 200 rigs running as of November 2011. The Eagle Ford Shale is being developed using horizontal drilling and hydraulic fracture stimulation. Public information indicates that operators are typically drilling wells with laterals from 3,500 to 8,000 feet. Wells are typically being completed with 15 to 25 fracture stimulation stages. Like most unconventional plays, production rates in the Eagle Ford Shale typically decline rapidly from their initially reported rates over the first several years of production. In addition to the Eagle Ford Shale, development of other historically productive formations like the Austin Chalk, Buda Limestone and the Pearsall Shale are occurring in proximity to our Eagle Ford Shale acreage. We intend to monitor this development and evaluate any potential implications for our acreage.
At December 31, 2011, we had a total 12,983 net acres across the Eagle Ford Shale play, 10,781 net acres of which were located in our four primary acreage blocks. We have an average working interest of 89% and are the operator in all these acreage blocks. These acreage blocks consist of contiguous tracks of at least 1,100 net acres in size and are located within a 20 mile radius of each other. We specifically targeted contiguous acreage blocks in excess of 1,000 acres where we could drill multiple wells from the same pad and build central production facilities to service our wells. We believe this type of concentrated operational footprint will lead to greater operational efficiencies. We have drilled and completed 12 gross wells on our Eagle Ford Shale acreage and have identified 94 gross (83.3 net) drilling locations. For December 2011, our net production from our Eagle Ford Shale wells averaged 10.5 MMcfed, consisting of 81% oil, 8% natural gas liquids and 11% natural gas. We intend to concentrate our drilling efforts primarily in acreage blocks that are in the oil window of the Eagle Ford Shale play. A further description of our primary acreage blocks follows:
Axle Tree Ranch
Our Axle Tree Ranch properties consist of 1,139 gross (1,139 net) acres located in northern Live Oak and southern Karnes Counties in South Texas. The average depth of the Eagle Ford Shale on our Axle Tree Ranch acreage is 11,500 feet, and results to date indicate that this acreage is within the oil window. We own a 100% working interest in this acreage and are the operator. We have drilled and completed three gross (three net) wells on this acreage, and we have identified eight additional drilling locations. We expect the lateral lengths of our remaining locations to average approximately 4,500 feet. We have installed central gas treating facilities that will remove impurities such as carbon dioxide and hydrogen sulfide, allowing us to process our gas and improve our per unit economics through sales of the resulting natural gas liquids. With the three completed wells, approximately 80% of this acreage is held by production, and we will be required to drill and complete one additional well by February 2013 to hold the remaining acreage by production. We have the option to extend for an additional two years any acreage that is not held by production by February 2013.
85
Heard Ranch
Our Heard Ranch properties consist of 1,583 gross (1,583 net) acres located in southeastern Atascosa County in South Texas. The average depth of the Eagle Ford Shale on our Heard Ranch acreage is 10,800 feet, and results to date indicate that this acreage is within the oil window. We own a 100% working interest in this acreage and are the operator. We have drilled five gross (five net) wells on this acreage, and we have identified 14 additional drilling locations. We expect the lateral lengths of our remaining locations to average approximately 4,400 feet. Our gas production on this acreage has a relatively high liquids content and low levels of impurities, allowing it to be processed without additional treating. We improve our per unit economics through sales of the resulting natural gas liquids. All of this acreage is held by production.
Simmons Area
Our Simmons properties consist of 7,029 gross (6,677 net) acres located in southeastern Atascosa County in South Texas. The average depth of the Eagle Ford Shale on our Simmons acreage is 8,500 feet, and results to date indicate that this acreage is within the oil window. We own a 100% working interest in this acreage and are the operator. We have drilled and completed one gross (one net) well on this acreage. We have identified 46 additional drilling locations on this acreage, two of which we have drilled and expect to complete in February 2012. The average size and configuration of our Simmons project will allow us to drill our longest laterals, averaging 6,700 feet, with some locations being longer than 8,000 feet. Our gas production has a high level of impurities, including carbon dioxide and hydrogen sulfide, and a high liquids content. We plan to tie into a sour gas line to the west of this acreage, allowing our gas production to be treated and processed to separate the higher value natural gas liquids to improve our per unit economics. We plan to concentrate our 2012 drilling in this area as we will be required to drill and complete approximately 19 additional wells by June 2013 to hold this acreage by production. We have the option to extend a majority of this acreage for an additional two years if it is not held by production by June 2013 by making extension payments.
Southwest Pawnee
Our Southwest Pawnee properties consist of 2,345 gross (1,382 net) acres located in central Live Oak County in South Texas. The average depth of the Eagle Ford Shale on our Southwest Pawnee acreage is 14,000 feet, and our wells on this acreage are some of the deepest Eagle Ford Shale wells drilled to date by any operator. Results to date indicate that this acreage is within the dry gas window of the play. We own a 59% working interest in this acreage and are the operator. We have drilled three gross (1.8 net) wells on this acreage and we have identified 26 additional drilling locations. As of December 31, 2011, the Dena Forehand #2H well was not fully completed as we finished only four of the expected 12 fracture stimulation stages. We expect to complete the remaining stages at a later date and do not believe production rates from this well are comparable to the fully completed wells in the area. Our gas production contains levels of carbon dioxide in excess of pipeline quality specifications, and we have installed central treating facilities to process produced gas to pipeline specifications. With the three drilled and completed wells, approximately 64% of this acreage is held by production, and we will be required to drill and complete two additional wells by April 2013 and May 2014, respectively, to hold the remaining acreage by production. Given that this acreage is in the dry gas window, we do not anticipate significant activity in this area in the near term.
Other Eagle Ford Shale Acreage
We own approximately 4,911 gross (2,203 net) acres in southwestern Zavala County in South Texas. The average depth of the Eagle Ford Shale on this acreage is 5,000 feet. We own an approximate 44% working interest in this acreage and are not the operator. We do not believe that well results in the surrounding area justify additional development at this time. Our leases in this area will begin to expire in April 2012 and will have fully expired by August 2012.
86
Rocky Mountains—Powder River Basin
The Powder River Basin is one of the key oil and gas basins located in the Rocky Mountain States of Wyoming and Montana. Specifically, the Powder River Basin is located in southwestern Montana and northeastern Wyoming. Most of the oil development in the Powder River Basin has been through drilling conventional vertical wells, but over the last decade operators have successfully tested multiple zones through horizontal drilling and multistage fracture stimulation. Throughout the Power River Basin, and specifically to the north and west of our acreage, large domestic operators such as Chesapeake Energy, EOG Resources and El Paso Corp. have leased large acreage positions and are conducting significant amounts of horizontal drilling activity. In addition, we have observed an increase in transaction activity and broad interest in the basin by new entrants such as large international operators and private equity sponsors. Given the significant amount of historic production and the high levels of current activity in the basin, there is substantial infrastructure including pipelines, refineries and oilfield service equipment.
The basin has a history of substantial oil and gas production from multiple pay zones. Based on our geologic evaluation, we believe the organically rich, Cretaceous age Mowry Shale could be the source rock for production from several oil-prone formations including the Turner Sandstone and the Muddy Sandstone. The Mowry Shale dips gently from east to west and pinches out on the eastern part of the basin. In our area of the basin, the Mowry Shale is found at an average depth of 7,500 to 8,000 feet, and ranges in thickness from 150 to 200 feet. We believe that the Muddy Sandstone, which sits directly below the Mowry Shale, could act as a conduit for oil sourced from the Mowry Shale.
Largely through the acquisition of acreage from two private companies, we have assembled a position of approximately 64,000 net acres in the southeastern portion of the Powder River Basin, specifically northwestern Niobrara County and Weston County. Given our high level of working interest in many of the sections we own, we expect to be the operator on the majority of this acreage. The Muddy Sandstone has been drilled vertically on our acreage and has been an oil producing zone on our acreage and throughout the basin. Based on data from offsetting wells located on or near our acreage, the Muddy Sandstone's thickness in our area is typically 10 feet to 30 feet. We believe the Mowry Shale and Muddy Sandstone sequence is a prospective oil resource play on our acreage as it has been shown to be productive in offsetting vertical wells, is present in acceptable thickness based on nearby well control, appears to have natural fracturing and is a good candidate for horizontal drilling and hydraulic fracture stimulation. We will attempt to drill horizontally in the Muddy Sandstone and fracture stimulate both zones. Our operational program for 2012 contemplates fracture stimulating two existing vertical wells, re-entering and re-completing two existing short-lateral, horizontal wells and drilling three new additional horizontal wells. Due to the early stage of evaluation of our acreage so far, we have identified 24 gross (23.9 net) drilling locations but will continue to evaluate and expect to identify additional drilling locations.
In addition to the Mowry / Muddy sequence, other area operators, including Chesapeake Energy, EOG Resources and El Paso Corp. are actively drilling the Niobrara Shale, the Turner Sandstone and other prospective formations in close proximity to our acreage. We plan to monitor this activity as data from offsetting wells indicate both formations are present on our acreage.
The lease terms we have in the Powder River Basin are typically longer than we have in either South Texas or the Arkoma Basin. Our acreage leased from private individuals in the Powder River Basin averages approximately four years of primary term with the option to extend for an additional four years, while our federal acreage typically carries a term of eight years.
Other Rocky Mountain Acreage
In addition to our Powder River Basin acreage, we also have 21,201 net acres in the McCourt Field in Cheyenne County, Nebraska. This field is located in the northeastern portion of the DJ Basin and produces dry gas from the Niobrara Shale formation at average depths of 3,600 feet. We are the
87
operator of this field, own an average working interest of 87% and hold all of our acreage by production. Our net production from this field averaged approximately 900 Mcf per day in December 2011. Due to the current gas price environment and relatively low reserves per well, we do not anticipate drilling any new gas wells in the near term.
Arkoma Basin—Woodford Shale
The Arkoma Basin is a historically prolific, largely gas-prone basin in eastern Oklahoma and western Arkansas. The basin produces largely natural gas from multiple horizons ranging in depth from 3,000 to 14,000 feet. Given the basin's long productive history, there is significant pipeline, processing and service company infrastructure available to operators. While operators have historically developed the basin using vertical wells, in 2005 operators began drilling horizontal wells in the Woodford Shale. Since then, developing the Woodford Shale using horizontal drilling and hydraulic fracture stimulation has become common practice and the Woodford Shale is regarded as one of the more mature onshore, gas shale plays in the United States. Industry sources indicate that as of November 30, 2011, over 700 horizontal wells have been drilled in the Woodford Shale, and companies such as BP, ExxonMobil, Newfield Exploration and Petroquest are all active in the play. The productive fairway for the Arkoma Basin Woodford Shale consists of Atoka, Coal, Haskell, Hughes and Pittsburg Counties, Oklahoma. In this productive fairway, the Woodford Shale ranges in depth from 5,000 to 13,000 feet and has thicknesses ranging from 30 to 250 feet.
Our Woodford Shale properties consist of approximately 26,600 net acres primarily in Atoka, Haskell and Pittsburg Counties in Oklahoma. The depth of the Woodford Shale on our acreage ranges from approximately 6,000 to 13,000 feet, while thicknesses range from approximately 50 to 250 feet. We drilled our first horizontal well in 2009 and since then have drilled 35 gross (11.9 net) horizontal wells and have completed all of them as producers. Our Woodford Shale properties represent a substantial undeveloped resource base, and we have identified 780 gross (239.5 net) drilling locations on our acreage. Based on our high ownership interest in many of our sections, we expect to operate 403 gross (201.8 net) wells as development occurs. Given the basin's multiple producing horizons above the Woodford Shale, we do encounter other productive zones while drilling our Woodford Shale horizontal wells. We are evaluating completions on several Atoka zones in existing wellbores and believe industry participants are evaluating the potential of horizontal drilling in other horizons that have produced in vertical wellbores across the basin. Many of these zones of interest are shallower than the Woodford Shale, and hence would be held by production through establishing production from the Woodford Shale. Considering the current low natural gas price environment and the fact that approximately 64% of our Woodford Shale acreage is held by production, we anticipate running one operated drilling rig in 2012. We expect to drill 20 gross (3.9 net) Woodford Shale wells in 2012.
Operating Summary
The following table sets forth information regarding our unaudited oil and natural gas production, revenues and realized prices and production costs for the years ended December 31, 2008, 2009 and 2010 and the nine months ended September 30, 2010 and 2011. For additional information on price calculations, see information set forth in "Management's Discussion and Analysis of Financial
88
Condition and Results of Operations." We determine natural gas equivalents by using the ratio of six Mcf of natural gas to one barrel of oil or one barrel of natural gas liquids.
| |
Years Ended December 31 | Nine Months Ended September 30, |
||||||||||||||
|---|---|---|---|---|---|---|---|---|---|---|---|---|---|---|---|---|
| |
2008 | 2009 | 2010 | 2010 | 2011 | |||||||||||
Production data: |
||||||||||||||||
Natural gas (MMcf) |
1,638.1 | 3,601.3 | 6,627.0 | 4,634.7 | 6,240.7 | |||||||||||
Oil (MBbls) |
55.1 | 43.5 | 48.2 | 26.0 | 151.7 | |||||||||||
Natural gas liquids (MBbls) |
24.8 | 25.9 | 24.1 | 17.8 | 11.8 | |||||||||||
Natural gas equivalents (MMcfe) |
2,117.5 | 4,017.7 | 7,060.8 | 4,897.5 | 7,221.7 | |||||||||||
Average daily equivalent production (MMcfed) |
5.8 | 11.0 | 19.3 | 17.9 | 26.5 | |||||||||||
Average sales prices: |
||||||||||||||||
Natural gas ($ per Mcf) |
$ | 8.53 | $ | 3.35 | $ | 3.54 | $ | 3.70 | $ | 3.47 | ||||||
Oil ($ per Bbl) |
99.40 | 58.37 | 77.24 | 74.96 | 93.55 | |||||||||||
Natural gas liquids ($ per Bbl) |
52.02 | 32.20 | 40.00 | 39.49 | 51.10 | |||||||||||
Natural gas equivalents ($ per Mcfe) |
9.80 |
3.85 |
3.99 |
4.04 |
5.05 |
|||||||||||
Realized gain (loss) on commodity derivatives ($ per Mcfe) |
— | (0.01 | ) | 0.64 | 0.59 | 0.72 | ||||||||||
Natural gas equivalents including realized gain (loss) on commodity derivatives ($ per Mcfe)(1) |
$ | 9.80 | $ | 3.84 | $ | 4.63 | $ | 4.63 | $ | 5.77 | ||||||
Costs and expenses (per Mcfe of production): |
||||||||||||||||
Lease operating |
$ | 2.04 | $ | 1.23 | $ | 0.95 | $ | 0.99 | $ | 0.94 | ||||||
Workovers |
1.62 | 0.19 | 0.28 | 0.43 | 0.07 | |||||||||||
Severance and ad valorem taxes |
0.61 | 0.31 | 0.26 | 0.26 | 0.33 | |||||||||||
- (1)
- These prices include realized gains or losses on cash settlements for our commodity derivatives. None of our commodity derivatives are designated as cash flow or fair value hedges.
89
The following table sets forth information regarding our average daily net production and total production for the nine months ended September 30, 2011 from our primary operating areas:
| |
Natural Gas (Mcf) |
Oil (Bbls) |
Natural gas liquids (Bbls) |
Natural Gas Equivalent (Mcfe) |
Percentage of Area Total Net Production |
|||||||||||
|---|---|---|---|---|---|---|---|---|---|---|---|---|---|---|---|---|
South Texas: |
||||||||||||||||
Eagle Ford Shale |
2,280 | 470 | — | 5,100 | 64 | % | ||||||||||
Other |
2,117 | 85 | 43 | 2,885 | 36 | |||||||||||
Area Total |
4,397 | 555 | 43 | 7,985 | ||||||||||||
Rocky Mountains: |
||||||||||||||||
Powder River Basin |
— | — | — | — | — | |||||||||||
DJ Basin |
972 | — | — | 972 | 100 | |||||||||||
Area Total |
972 | — | — | 972 | ||||||||||||
Arkoma Basin: |
||||||||||||||||
Woodford Shale |
15,812 | 1 | — | 15,818 | 90 | |||||||||||
Other |
1,677 | — | — | 1,677 | 10 | |||||||||||
Area Total |
17,489 | 1 | — | 17,495 | ||||||||||||
Total |
22,858 | 556 | 43 | 26,452 | ||||||||||||
Producing Wells
The following table sets forth the number of oil and natural gas wells in which we owned a working interest at December 31, 2011. Producing wells consist of producing wells and wells capable of producing, including natural gas wells awaiting pipeline connections to commence deliveries and oil wells awaiting connection to production facilities. Gross wells are the total number of producing wells in which we have working interests, and net wells are the sum of our fractional working interests owned in gross wells.
| |
Oil | Natural Gas | Total | ||||||||||||||||
|---|---|---|---|---|---|---|---|---|---|---|---|---|---|---|---|---|---|---|---|
| |
Gross | Net | Gross | Net | Gross | Net | |||||||||||||
South Texas: |
|||||||||||||||||||
Eagle Ford Shale |
9 | 9.0 | 3 | 1.8 | 12 | 10.8 | |||||||||||||
Other |
2 | 1.5 | 42 | 15.0 | 44 | 16.5 | |||||||||||||
Area Total |
11 | 10.5 | 45 | 16.8 | 56 | 27.3 | |||||||||||||
Rocky Mountains: |
|||||||||||||||||||
Powder River Basin |
6 | 5.9 | — | — | 6 | 5.9 | |||||||||||||
DJ Basin |
— | — | 78 | 70.3 | 78 | 70.3 | |||||||||||||
Area Total |
6 | 5.9 | 78 | 70.3 | 84 | 76.2 | |||||||||||||
Arkoma Basin: |
|||||||||||||||||||
Woodford Shale |
— | — | 216 | 40.1 | 216 | 40.1 | |||||||||||||
Other |
— | — | 3 | 0.0 | 3 | 0.0 | |||||||||||||
Area Total |
— | — | 219 | 40.1 | 219 | 40.1 | |||||||||||||
Total |
17 | 16.4 | 342 | 127.2 | 359 | 143.6 | |||||||||||||
Estimated Proved Reserves
The following table sets forth our estimated proved oil and natural gas reserves at December 31, 2009 and 2010 and May 31, 2011. The estimated reserves shown are for proved reserves only and do
90
not include any unproved reserves classified as probable or possible reserves that might exist for our properties, nor do they include any consideration that could be attributable to interests in unproved and unevaluated acreage beyond those tracts for which proved reserves have been estimated. Proved oil and natural gas reserves are the estimated quantities of crude oil, natural gas and natural gas liquids which geological and engineering data demonstrate with reasonable certainty to be recoverable in future years from known reservoirs under existing economic and operating conditions. Our total estimated proved reserves are estimated using a conversion ratio of one Bbl per six Mcf.
| |
At December 31, | At May 31, | ||||||||
|---|---|---|---|---|---|---|---|---|---|---|
| |
2009 | 2010 | 2011 | |||||||
Estimated Proved Reserves(1)(2) |
||||||||||
Natural gas (MMcf) |
138,524 | 229,497 | 199,989 | |||||||
Oil (MBbls) |
1,463 | 2,183 | 2,908 | |||||||
Natural gas liquids (MBbls) |
771 | 812 | 848 | |||||||
Total natural gas equivalent (MMcfe) |
151,928 | 247,467 | 222,525 | |||||||
Estimated Proved Developed Reserves |
||||||||||
Natural gas (MMcf) |
58,807 | 78,210 | 66,845 | |||||||
Oil (MBbls) |
466 | 693 | 682 | |||||||
Natural gas liquids (MBbls) |
394 | 387 | 376 | |||||||
Total natural gas equivalent (MMcfe) |
63,967 | 84,690 | 73,193 | |||||||
Percent developed |
42.1 | % | 34.2 | % | 32.9 | % | ||||
Estimated Proved Undeveloped Reserves |
||||||||||
Natural gas (MMcf) |
79,717 | 151,287 | 133,144 | |||||||
Oil (MBbls) |
997 | 1,490 | 2,226 | |||||||
Natural gas liquids (MBbls) |
377 | 425 | 472 | |||||||
Total natural gas equivalent (MMcfe) |
87,961 | 162,777 | 149,332 | |||||||
PV-10(3) (in thousands) |
$ |
62,138 |
$ |
130,675 |
$ |
122,290 |
||||
Standardized Measure(4) (in thousands) |
$ | 61,573 | $ | 129,801 | $ | |||||
- (1)
- Numbers
in table may not total due to rounding.
- (2)
- Our
estimated proved reserves and related future net revenues, PV-10 and Standardized Measure were determined using index prices for oil and
natural gas, without giving effect to derivative transactions, and were held constant throughout the life of the properties. Our estimated proved reserves were determined using the unweighted averages
of the historical first-day-of-the-month prices for the prior 12 months of $57.65 per Bbl for oil and $3.87 per MMBtu for natural gas at
December 31, 2009; $75.96 per Bbl for oil and $4.38 per MMBtu for natural gas at December 31, 2010; and $84.29 per Bbl for oil and $4.18 per MMBtu for natural gas at May 31, 2011.
These prices were adjusted by lease for quality, transportation fees, geographical differentials, marketing bonuses or deductions and other factors affecting the price received at the wellhead.
- (3)
- PV-10 is a non-GAAP financial measure and generally differs from Standardized Measure, the most directly comparable GAAP financial measure, because it does not include the effects of income taxes on future net revenues. PV-10 is not an estimate of the fair market value of our oil and natural gas properties. We and others in the industry use PV-10 as a measure to compare the relative size and value of estimated proved reserves held by companies without regard to the
91
specific tax characteristics of such entities. The following table provides a reconciliation of our Standardized Measure to PV-10 for the periods presented:
| |
At December 31, | At May 31, | ||||||||
|---|---|---|---|---|---|---|---|---|---|---|
| |
2009 | 2010 | 2011 | |||||||
| |
(in millions) |
|||||||||
Standardized Measure of discounted net cash flows |
$ | 61.6 | $ | 129.7 | $ | |||||
Present value of future income tax discounted at 10%(5) |
0.5 | 0.9 | ||||||||
PV-10 |
$ | 62.1 | $ | 130.7 | $ | 122.3 | ||||
- (4)
- Standardized
Measure represents the present value of estimated future net cash inflows from proved oil and natural gas reserves, less estimated future
development, production, plugging and abandonment costs and income tax expenses (if applicable), discounted at 10% per annum to reflect the timing of future cash flows. Standardized Measure is not an
estimate of the fair market value of our oil and natural gas properties.
- (5)
- Based on our net operating losses, we do not anticipate paying any future federal income taxes for the periods indicated. Taxes shown are state taxes.
Our total estimated proved oil and natural gas reserves decreased from 247.5 Bcfe at December 31, 2010 to 222.5 Bcfe at May 31, 2011. The decrease of our estimated proved reserves resulted primarily from our sale of approximately 26 Bcfe of estimated proved reserves in the Arkoma Basin in the first five months of 2011 and a 16.3 Bcfe negative reserve revision at our Southwest Pawnee field in the Eagle Ford Shale of South Texas. These decreases in proved reserve were partially offset by proved reserve additions related to our drilling program in the Eagle Ford shale. Our estimated proved reserves comprised of oil and natural gas liquids increased 761 MBbls, or 25.4%, to 3,756 MBbls at May 31, 2011, from the prior estimated total of 2,995 MBbls at December 31, 2010. This increase in estimated oil and natural gas liquids proved reserves is a result of our drilling program in the oil and natural gas liquids windows of the Eagle Ford Shale of South Texas. At May 31, 2011, the percentage of our estimated proved reserves that consisted of oil and natural gas liquids was 10.1%, representing an increase over the total at December 31, 2010 of 7.3%. This increase in the percentage of our estimated proved reserves that were comprised of oil and natural gas liquids resulted from our drilling program in the oil and natural gas liquids windows of the Eagle Ford Shale of South Texas.
Our total estimated proved oil and natural gas reserves of 247.5 Bcfe for the year ended December 31, 2010, increased by 62.9% from the comparable period in 2009 when estimated proved reserves were 151.9 Bcfe. This increase is primarily attributable to our active drilling program in the gas-prone Woodford Shale and our initial drilling program in the Eagle Ford Shale that primarily targeted acreage in the gas window of the Eagle Ford Shale trend. Our estimated proved reserves comprised of oil and natural gas liquids increased by 761 MBbls to 2,995 MBbls at December 31, 2010 from 2,234 MBbls at December 31, 2009. However, our estimated proved reserves comprised of oil and natural gas liquids decreased on a percentage basis to 7.3% for the year ended December 31, 2010 from 8.8% for the year ended December 31, 2009. The reason for this increase on an absolute volume basis and decrease on a percentage basis is that while we added oil and natural gas liquids volumes from some of our Eagle Ford Shale drilling, we added proportionally more gas volumes from both our Woodford Shale and Eagle Ford Shale drilling.
92
The following table sets forth additional summary information by operating area with respect to our estimated proved reserves at May 31, 2011:
| |
Estimated Proved Reserves(1) | |
|
|||||||||||||
|---|---|---|---|---|---|---|---|---|---|---|---|---|---|---|---|---|
| |
Gas (MMcf) |
Oil (MBbls) |
Natural gas liquids (MBbls) |
Natural Gas Equivalent (MMcfe) |
PV-10(2) | |||||||||||
| |
|
|
|
|
(in millions) |
|||||||||||
South Texas: |
||||||||||||||||
Eagle Ford Shale |
5,477.9 | 1,624.5 | 114.5 | 15,911.9 | $ | 27.3 | ||||||||||
Other |
34,282.3 | 1,283.2 | 733.5 | 46,382.5 | 37.8 | |||||||||||
Area Total |
39,760.2 | 2,907.7 | 848.0 | 62,294.4 | 65.1 | |||||||||||
Rocky Mountains: |
||||||||||||||||
Powder River Basin |
— | — | — | — | — | |||||||||||
DJ Basin |
2,451.6 | — | — | 2,451.6 | 0.0 | |||||||||||
Area Total |
2,451.6 | — | — | 2,451.6 | 0.0 | |||||||||||
Arkoma Basin: |
||||||||||||||||
Woodford Shale |
150,756.0 | — | — | 150,756.0 | 50.1 | |||||||||||
Other |
7,020.5 | — | — | 7,020.5 | 7.0 | |||||||||||
Area Total |
157,776.5 | — | — | 157,776.5 | 57.1 | |||||||||||
Total |
199,988.3 | 2,907.7 | 848.0 | 222,522.5 | $ | 122.3 | ||||||||||
- (1)
- Numbers
in table may not total due to rounding.
- (2)
- PV-10 is a non-GAAP financial measure and generally differs from Standardized Measure, the most directly comparable GAAP financial measure, because it does not include the effects of income taxes on future net revenues. PV-10 is not an estimate of the fair market value of our oil and natural gas properties. We and others in the industry use PV-10 as a measure to compare the relative size and value of estimated proved reserves held by companies without regard to the specific tax characteristics of such entities. Our PV-10 at May 31, 2011 may be reconciled to our Standardized Measure of discounted future net cash flows at such date by reducing our PV-10 by the discounted future federal and state income taxes associated with such reserves.
Independent Reserve Engineers
Our reserves estimates and related future net revenues and PV-10 at December 31, 2009 and 2010 and May 31, 2011 were based on reports prepared by Netherland, Sewell & Associates, Inc., our independent reserve engineers, in accordance with generally accepted petroleum engineering and evaluation principles and definitions and current guidelines established by the SEC. Copies of these reports have been filed as exhibits to the registration statement of which this prospectus forms a part.
Technology Used to Establish Reserves
Under the new SEC rules, proved reserves are those quantities of oil and natural gas, which, by analysis of geoscience and engineering data, can be estimated with reasonable certainty to be economically producible from a given date forward, from known reservoirs, and under existing economic conditions, operating methods and government regulations. The term "reasonable certainty" implies a high degree of confidence that the quantities of oil and/or natural gas actually recovered will equal or exceed the estimate. Reasonable certainty can be established using techniques that have been proven effective by actual production from projects in the same reservoir or an analogous reservoir or by other evidence using reliable technology that establishes reasonable certainty. Reliable technology is a grouping of one or more technologies (including computational methods) that have been field tested
93
and have been demonstrated to provide reasonably certain results with consistency and repeatability in the formation being evaluated or in an analogous formation.
In order to establish reasonable certainty with respect to our estimated proved reserves, we used technologies that have been demonstrated to yield results with consistency and repeatability. The technologies and technical data used in the estimation of our proved reserves include, but are not limited to, electric logs, radioactivity logs, core analyses, geologic maps and available downhole and production data, seismic data and well test data. Reserves for proved developed producing wells were estimated using production performance and material balance methods. Certain new producing properties with little production history were forecast using a combination of production performance and analogy to offset production. Non-producing reserve estimates for both developed and undeveloped properties were forecast using either volumetric and/or analogy methods.
Internal Control Over Reserves Estimation Process
We maintain an internal staff of petroleum engineers and geoscience professionals to ensure the integrity, accuracy and timeliness of the data used in our reserves estimation process. Our Senior Vice President and Chief Operating Officer is primarily responsible for overseeing the preparation of our reserves estimates and has over 26 years of industry experience. Our Senior Vice President and Chief Operating Officer received his B.S. degree in Petroleum Engineering from Marietta College and is a Licensed Professional Engineer in the State of Texas. Our Senior Vice President and Chief Operating Officer reports directly to our Chief Executive Officer. Following the preparation of our reserves estimates, for the years ended December 31, 2009 and 2010 and for the five month period ended May 31, 2011, we had our reserves estimates audited for their reasonableness and conformance with generally accepted petroleum engineering and evaluation principles by Netherland, Sewell & Associates, Inc., our independent reserve engineers. Our reserve estimates are reviewed and approved by our senior engineering staff with final approval by our President and Chief Executive Officer and certain other members of our senior management. Our senior management also reviews our independent engineers' reserve estimates and related reports with our senior engineering staff and other members of our technical staff.
94
Acreage
We hold leasehold, mineral or other interests in developed and undeveloped oil and natural gas acreage in the locations set forth in the table below. The following table presents a summary of our acreage interests as of December 31, 2011:
| |
Developed Acreage | Undeveloped Acreage | Total Acreage | ||||||||||||||||
|---|---|---|---|---|---|---|---|---|---|---|---|---|---|---|---|---|---|---|---|
| |
Gross | Net | Gross | Net | Gross | Net | |||||||||||||
South Texas: |
|||||||||||||||||||
Eagle Ford Shale |
4,321 | 3,706 | 12,685 | 9,277 | 17,006 | 12,983 | |||||||||||||
Other |
6,611 | 2,986 | 1,218 | 621 | 7,829 | 3,607 | |||||||||||||
Area Total |
10,932 | 6,692 | 13,903 | 9,898 | 24,835 | 16,590 | |||||||||||||
Rocky Mountains: |
|||||||||||||||||||
Powder River Basin |
240 | 240 | 69,636 | 63,803 | 69,876 | 64,043 | |||||||||||||
DJ Basin |
24,272 | 21,201 | — | — | 24,272 | 21,201 | |||||||||||||
Area Total |
24,512 | 21,441 | 69,636 | 63,803 | 94,148 | 85,244 | |||||||||||||
Arkoma Basin: |
|||||||||||||||||||
Woodford Shale |
39,044 | 18,658 | 21,379 | 7,953 | 60,423 | 26,611 | |||||||||||||
Other |
— | — | 18,124 | 9,549 | 18,124 | 9,549 | |||||||||||||
Area Total |
39,044 | 18,658 | 39,503 | 17,502 | 78,547 | 36,160 | |||||||||||||
Total |
74,488 | 46,791 | 123,042 | 91,203 | 197,530 | 137,994 | |||||||||||||
Undeveloped Acreage Expiration
The following table sets forth the number of gross and net undeveloped acres at December 31, 2011 that will expire over the next three years by operating area unless production is established within the spacing units covering the acreage prior to the expiration dates or unless the existing leases are renewed prior to expiration:
| |
Acres Expiring 2011 |
Acres Expiring 2012 |
Acres Expiring 2013 |
Acres Expiring 2014 |
|||||||||||||||||||||
|---|---|---|---|---|---|---|---|---|---|---|---|---|---|---|---|---|---|---|---|---|---|---|---|---|---|
| |
Gross | Net | Gross | Net | Gross | Net | Gross | Net | |||||||||||||||||
South Texas: |
|||||||||||||||||||||||||
Eagle Ford Shale(1)(2) |
— | — | 4,911 | 2,203 | 9,608 | 9,037 | 386 | 302 | |||||||||||||||||
Other |
— | — | — | — | 320 | 320 | — | — | |||||||||||||||||
Area Total |
— | — | 4,911 | 2,203 | 9,928 | 9,357 | 386 | 302 | |||||||||||||||||
Rocky Mountains: |
|||||||||||||||||||||||||
Powder River Basin(3) |
— | — | — | — | — | — | 7,312 | 4,724 | |||||||||||||||||
DJ Basin |
— | — | — | — | — | — | — | — | |||||||||||||||||
Area Total |
— | — | — | — | — | — | 7,312 | 4,724 | |||||||||||||||||
Arkoma Basin: |
|||||||||||||||||||||||||
Woodford Shale |
1,845 | 812 | 1,979 | 451 | 7,774 | 4,437 | 1,444 | 787 | |||||||||||||||||
Other |
— | — | 10,399 | 6,010 | 6,333 | 2,745 | 1,712 | 1,172 | |||||||||||||||||
Area Total(4) |
1,845 | 812 | 12,378 | 6,461 | 14,107 | 7,182 | 3,156 | 1,959 | |||||||||||||||||
Total |
1,845 | 812 | 17,289 | 8,664 | 24,035 | 16,539 | 10,854 | 6,985 | |||||||||||||||||
- (1)
- In 2013, we have options to extend approximately 7,800 gross (7,700 net) Eagle Ford Shale acres for an additional two years, solely at our election, by making extension payments.
95
- (2)
- All
2,230 net acres scheduled to expire in the Eagle Ford Shale in 2012 are in our Maverick Project in Zavala County, Texas. We do not believe that this
acreage can be developed economically and have elected to let it expire. There are no reserves or production associated with this acreage.
- (3)
- In
2014, we have options to extend approximately 4,950 gross (2,362 net) Powder River Basin acres for an additional three years by making extension
payments.
- (4)
- Of the 6,462 net acres scheduled to expire in 2012 in the Arkoma Basin, approximately 6,010 are in our Oklahoma Wildlife Project which is a conventional natural gas exploration play. In 2011, we drilled an unsuccessful exploration well and plan to let this acreage expire.
Many of the leases comprising the acreage set forth in the table above will expire at the end of their respective primary terms unless production from the acreage has been established prior to such date, in which event the lease will remain in effect until the cessation of production in commercial quantities. We also have options to extend some of our leases through payment of additional lease bonus payments prior to the expiration of the primary term of the leases. In addition, we may attempt to secure a new lease upon the expiration of certain of our acreage; however, there may be third party leases that become effective immediately if our leases expire at the end of their respective terms and production has not been established prior to such date. Our leases are mainly fee leases with three to five years of primary term. We believe that our lease terms are similar to our competitors' fee lease terms as they relate to both primary term and royalty interests.
Drilling Results
The table below sets forth the results of our drilling activities for the periods indicated. The information should not be considered indicative of future performance, nor should it be assumed that there is necessarily any correlation between the number of productive wells drilled, quantities of reserves found or economic value. Productive wells are those that produce, or are capable of producing, commercial quantities of hydrocarbons in sufficient quantities such that proceeds from the sale of the production exceed production expenses and taxes. Dry wells are those that prove to be incapable of producing hydrocarbons in sufficient quantities to justify completion.
| |
Year Ended December 31, | ||||||||||||||||||||||||
|---|---|---|---|---|---|---|---|---|---|---|---|---|---|---|---|---|---|---|---|---|---|---|---|---|---|
| |
2008 | 2009 | 2010 | 2011 | |||||||||||||||||||||
| |
Gross | Net | Gross | Net | Gross | Net | Gross | Net | |||||||||||||||||
Development Wells |
|||||||||||||||||||||||||
Productive |
1 | 0.7 | 9 | 2.1 | 14 | 2.4 | 5 | 2.3 | |||||||||||||||||
Dry |
— | — | — | — | — | — | — | — | |||||||||||||||||
Exploratory Wells |
|||||||||||||||||||||||||
Productive |
2 | 1.2 | 23 | 5.0 | 33 | 8.3 | 15 | 8.7 | |||||||||||||||||
Dry |
1 | 0.7 | — | — | 1 | 0.1 | 1 | 0.5 | |||||||||||||||||
Total Wells |
|||||||||||||||||||||||||
Productive |
3 | 1.9 | 32 | 7.1 | 47 | 10.8 | 20 | 11.0 | |||||||||||||||||
Dry |
1 | 0.7 | — | — | 1 | 0.1 | 1 | 0.5 | |||||||||||||||||
96
Marketing
We market the majority of production from properties we operate for both our account and the account of the other working interest owners in our operated properties. We sell substantially all of our production to a variety of purchasers under contracts ranging from one month to five years, all at market prices. We normally sell production to a relatively small number of customers, as is customary in the exploration, development and production business. However, based on the current demand for oil and natural gas and the availability of alternate purchasers, we believe that the loss of any one of our major purchasers would not have a material adverse effect on our financial condition and results of operations. For information regarding our customers that accounted for 10% or more of our oil and natural gas revenues during the years ended December 31, 2008, 2009 and 2010, see Note 14 in our audited consolidated financial statements, each included elsewhere in this prospectus. See "Risk Factors—Risks Related to the Oil and Natural Gas Industry and Our Business—The inability of one or more of our customers to meet their obligations to us may materially adversely affect our financial results." See also "Certain Relationships and Related Party Transactions."
Title to Properties
Our properties are subject to customary royalty interests, liens incident to operating agreements, liens for current taxes and other burdens, including other mineral encumbrances and restrictions. We do not believe that any of these burdens materially interfere with our use of the properties in the operation of our business. We believe that we have generally satisfactory title to or rights in all of our producing properties. As is customary in the oil and gas industry, we make minimal investigation of title at the time we acquire undeveloped properties. We make title investigations and receive title opinions of local counsel only before we commence drilling operations. We believe that we have satisfactory title to all of our other assets. Although title to our properties is subject to encumbrances in certain cases, we believe that none of these burdens will materially detract from the value of our properties or from our interest therein or will materially interfere with the operation of our business. See "Risk Factors—Risks Related to the Oil and Natural Gas Industry and Our Business—We may incur losses as a result of title defects in the properties in which we invest."
Seasonality
Demand for oil and natural gas generally decreases during the spring and fall months and increases during the summer and winter months. However, seasonal anomalies such as mild winters or mild summers sometimes lessen this fluctuation. In addition, certain natural gas users utilize natural gas storage facilities and purchase some of their anticipated winter requirements during the summer. This can also lessen seasonal demand fluctuations. These seasonal anomalies can increase competition for equipment, supplies and personnel during the spring and summer months, which could lead to shortages and increase costs or delay our operations.
Competition
The oil and natural gas industry is highly competitive and we compete with a substantial number of other companies that have greater resources. Many of these companies explore for, produce and market oil and natural gas, carry on refining operations and market the resultant products on a worldwide basis. The primary areas in which we encounter substantial competition are in locating and acquiring desirable leasehold acreage for our drilling and development operations, locating and acquiring attractive producing oil and gas properties, and obtaining transporters of the oil and gas we produce in certain regions. There is also competition between producers of oil and gas and other industries producing alternative energy and fuel. Furthermore, competitive conditions may be substantially affected by various forms of energy legislation and/or regulation considered from time to time by the government of the United States; however, it is not possible to predict the nature of any
97
such legislation or regulation that may ultimately be adopted or its effects upon our future operations. Such laws and regulations may, however, substantially increase the costs of exploring for, developing or producing gas and oil and may prevent or delay the commencement or continuation of a given operation. The effect of these risks cannot be accurately predicted.
The oil and natural gas industry also competes with other energy-related industries in supplying the energy and fuel requirements of industrial, commercial and individual consumers. See "Risk Factors—Risks Related to the Oil and Natural Gas Industry and Our Business—Competition in the oil and natural gas industry is intense, making it more difficult for us to acquire properties, market oil and natural gas and secure trained personnel."
Regulation of the Oil and Natural Gas Industry
Our operations are substantially affected by federal, state and local laws and regulations. In particular, oil and natural gas production and related operations are, or have been, subject to price controls, taxes and numerous other laws and regulations. All of the jurisdictions in which we own or operate properties for oil and natural gas production have statutory provisions regulating the exploration for and production of oil and natural gas, including provisions related to permits for the drilling of wells, bonding requirements to drill or operate wells, the location of wells, the method of drilling and casing wells, the surface use and restoration of properties upon which wells are drilled, sourcing and disposal of water used in the drilling and completion process, and the abandonment of wells. Our operations are also subject to various conservation laws and regulations. These include regulation of the size of drilling and spacing units or proration units, the number of wells which may be drilled in an area, and the unitization or pooling of oil and natural gas wells, as well as regulations that generally prohibit the venting or flaring of natural gas and that impose certain requirements regarding the ratability or fair apportionment of production from fields and individual wells.
The regulatory burden on the industry increases the cost of doing business and affects profitability. Failure to comply with applicable laws and regulations can result in substantial penalties. Furthermore, such laws and regulations are frequently amended or reinterpreted, and new proposals that affect the oil and natural gas industry are regularly considered by Congress, the states, the Federal Energy Regulatory Commission, or FERC, and the courts. We believe we are in substantial compliance with all applicable laws and regulations, and that continued substantial compliance with existing requirements will not have a material adverse effect on our financial position, cash flows or results of operations. We are not currently aware of any specific pending legislation or regulation that is reasonably likely to be enacted, or for which we cannot predict the likelihood of enactment, and that is reasonably likely to have a material effect on our financial position, cash flows or results of operations.
Regulation of Transportation of Oil
Sales of crude oil, condensate and natural gas liquids are not currently regulated and are made at negotiated prices. Nevertheless, Congress could reenact price controls in the future.
Our sales of crude oil are affected by the availability, terms and cost of transportation. Interstate transportation of oil by pipeline is regulated by FERC pursuant to the ICA, Energy Policy Act of 1992, or the EPAct 1992, and the rules and regulations promulgated under those laws. The ICA and its implementing regulations require that tariff rates for interstate service on oil pipelines, including interstate pipelines that transport crude oil and refined products (collectively referred to as "petroleum pipelines"), be just and reasonable and non-discriminatory and that such rates and terms and conditions of service be filed with FERC. EPAct 1992 deemed certain interstate petroleum pipeline rates then in effect to be just and reasonable under the ICA, which are commonly referred to as "grandfathered rates." Pursuant to EPAct 1992, FERC also adopted a generally applicable ratemaking methodology, which, as currently in effect, allows petroleum pipelines to change their rates provided
98
they do not exceed prescribed ceiling levels that are tied to changes in the Producer Price Index for Finished Goods, or PPI, plus 1.3 percent. For the five-year period beginning July 1, 2011, the index will be PPI plus 2.65%.
FERC has also established cost-of-service ratemaking, market-based rates, and settlement rates as alternatives to the indexing approach. A pipeline may file rates based on its cost-of-service if there is a substantial divergence between its actual costs of providing service and the rate resulting from application of the index. A pipeline may charge market-based rates if it establishes that it lacks significant market power in the affected markets. Further, a pipeline may establish rates through settlement with all current non-affiliated shippers.
Intrastate oil pipeline transportation rates are subject to regulation by state regulatory commissions. The basis for intrastate oil pipeline regulation, and the degree of regulatory oversight and scrutiny given to intrastate oil pipeline rates, varies from state to state. Insofar as effective interstate and intrastate rates are equally applicable to all comparable shippers, we believe that the regulation of oil transportation rates will not affect our operations in any way that is of material difference from those of our competitors who are similarly situated.
Further, interstate and intrastate common carrier oil pipelines must provide service on a non-discriminatory basis. Under this open access standard, common carriers must offer service to all similarly situated shippers requesting service on the same terms and under the same rates. When oil pipelines operate at full capacity, access is governed by prorationing provisions set forth in the pipelines' published tariffs. Accordingly, we believe that access to oil pipeline transportation services generally will be available to us to the same extent as to our similarly situated competitors.
Regulation of Transportation and Sales of Natural Gas
Historically, the transportation and sale for resale of natural gas in interstate commerce has been regulated by the FERC under the Natural Gas Act of 1938, or NGA, the Natural Gas Policy Act of 1978, or NGPA, and regulations issued under those statutes. In the past, the federal government has regulated the prices at which natural gas could be sold. While sales by producers of natural gas can currently be made at market prices, Congress could reenact price controls in the future. Deregulation of wellhead natural gas sales began with the enactment of the NGPA and culminated in adoption of the Natural Gas Wellhead Decontrol Act which removed all price controls affecting wellhead sales of natural gas effective January 1, 1993.
FERC regulates interstate natural gas transportation rates, and terms and conditions of service, which affect the marketing of natural gas that we produce, as well as the revenues we receive for sales of our natural gas. Since 1985, the FERC has endeavored to make natural gas transportation more accessible to natural gas buyers and sellers on an open and non-discriminatory basis. The FERC has stated that open access policies are necessary to improve the competitive structure of the interstate natural gas pipeline industry and to create a regulatory framework that will put natural gas sellers into more direct contractual relations with natural gas buyers by, among other things, unbundling the sale of natural gas from the sale of transportation and storage services. Beginning in 1992, the FERC issued a series of orders, beginning with Order No. 636, to implement its open access policies. As a result, the interstate pipelines' traditional role of providing the sale and transportation of natural gas as a single service has been eliminated and replaced by a structure under which pipelines provide transportation and storage service on an open access basis to others who buy and sell natural gas. Although the FERC's orders do not directly regulate natural gas producers, they are intended to foster increased competition within all phases of the natural gas industry.
In 2000, the FERC issued Order No. 637 and subsequent orders, which imposed a number of additional reforms designed to enhance competition in natural gas markets. Among other things, Order No. 637 revised the FERC's pricing policy by waiving price ceilings for short-term released capacity for
99
a two-year experimental period, and effected changes in FERC regulations relating to scheduling procedures, capacity segmentation, penalties, rights of first refusal and information reporting.
Gathering services, which occur upstream of jurisdictional transmission services, are regulated by the states onshore and in state waters. Although the FERC has set forth a general test for determining whether facilities perform a nonjurisdictional gathering function or a jurisdictional transmission function, the FERC's determinations as to the classification of facilities is done on a case by case basis. To the extent that the FERC issues an order which reclassifies transmission facilities as gathering facilities, and depending on the scope of that decision, our costs of getting gas to point of sale locations may increase. State regulation of natural gas gathering facilities generally includes various safety, environmental and, in some circumstances, nondiscriminatory take requirements. Although such regulation has not generally been affirmatively applied by state agencies, natural gas gathering may receive greater regulatory scrutiny in the future.
Intrastate natural gas transportation and facilities are also subject to regulation by state regulatory agencies, and certain transportation services provided by intrastate pipelines are also regulated by FERC. The basis for intrastate regulation of natural gas transportation and the degree of regulatory oversight and scrutiny given to intrastate natural gas pipeline rates and services varies from state to state. Insofar as such regulation within a particular state will generally affect all intrastate natural gas shippers within the state on a comparable basis, we believe that the regulation of similarly situated intrastate natural gas transportation in any states in which we operate and ship natural gas on an intrastate basis will not affect our operations in any way that is of material difference from those of our competitors. Like the regulation of interstate transportation rates, the regulation of intrastate transportation rates affects the marketing of natural gas that we produce, as well as the revenues we receive for sales of our natural gas.
Regulation of Production
The production of oil and natural gas is subject to regulation under a wide range of local, state and federal statutes, rules, orders and regulations. Federal, state and local statutes and regulations require permits for drilling operations, drilling bonds and reports concerning operations. All of the states in which we own and operate properties have regulations governing conservation matters, including provisions for the unitization or pooling of oil and natural gas properties, the establishment of maximum allowable rates of production from oil and natural gas wells, the regulation of well spacing, and plugging and abandonment of wells. The effect of these regulations is to limit the amount of oil and natural gas that we can produce from our wells and to limit the number of wells or the locations at which we can drill, although we can apply for exceptions to such regulations or to have reductions in well spacing. Moreover, each state generally imposes a production or severance tax with respect to the production and sale of oil, natural gas and natural gas liquids within its jurisdiction.
The failure to comply with these rules and regulations can result in substantial penalties. Our competitors in the oil and natural gas industry are subject to the same regulatory requirements and restrictions that affect our operations.
Market Transparency Rules
In 2007, FERC took steps to enhance its market oversight and monitoring of the natural gas industry by issuing several rulemaking orders designed to promote gas price transparency and to prevent market manipulation. In December 2007, FERC issued a final rule on the annual natural gas transaction reporting requirements, as amended by subsequent orders on rehearing, or Order No. 704. Pursuant to Order No. 704, wholesale buyers and sellers of annual quantities of 2.2 million MMBtu or more of natural gas in the previous calendar year, including intrastate natural gas pipelines, natural gas gatherers, natural gas processors, natural gas marketers and natural gas producers, are required to
100
report, by May 1 of each year, aggregate volumes of natural gas purchased or sold at wholesale in the prior calendar year to the extent such transactions utilize, contribute to, or may contribute to, the formation of price indices. Order No. 704 also requires market participants to indicate whether they report prices to any index publishers and, if so, whether their reporting complies with FERC's policy statement on price reporting. Some of our operations may be required to comply with Order No. 704's annual reporting requirements.
In 2008, the FERC issued Order No. 720, which increases the Internet posting obligations of interstate pipelines, and also requires "major non-interstate" pipelines (defined as pipelines that are not natural gas companies under the NGA that deliver more than 50.0 million MMBtu annually and including gathering systems) to post on the Internet the daily volumes scheduled for each receipt and delivery point on their systems with a design capacity of 15,000 MMBtu per day or greater. Numerous parties requested modification or reconsideration of this rule. An order on rehearing, Order No. 720-A, was issued on January 21, 2010. In that order the FERC reaffirmed its holding that it has jurisdiction over major non-interstate pipelines for the purpose of requiring public disclosure of information to enhance market transparency. Order No. 720-A also granted clarification regarding application of the rule. Two parties have filed appeals of Order Nos. 720 and 720-A to the Fifth Circuit. The parties have filed briefs but no decision has been issued. Unless they qualify for exemptions established by FERC, some of our operations may be required to comply with Order No. 720's posting requirements.
In May 2010, the FERC issued Order No. 735, which requires intrastate pipelines providing transportation services under Section 311 of the NGPA and Hinshaw pipelines operating under Section 1(c) of the NGA to report on a quarterly basis more detailed transportation and storage transaction information, including: rates charged by the pipeline under each contract; receipt and delivery points and zones or segments covered by each contract; the quantity of natural gas the shipper is entitled to transport, store, or deliver; the duration of the contract; and whether there is an affiliate relationship between the pipeline and the shipper. Order No. 735 further requires that such information must be supplied through a new electronic reporting system and will be posted on FERC's website, and that such quarterly reports may not contain information redacted as privileged. The FERC promulgated this rule after determining that such transactional information would help shippers make more informed purchasing decisions and would improve the ability of both shippers and the FERC to monitor actual transactions for evidence of market power or undue discrimination. Order No. 735 also extends the Commission's periodic review of the rates charged by the subject pipelines from three years to five years. In December 2010, the Commission issued Order No. 735-A. In Order No. 735-A, the Commission generally reaffirmed Order No. 735 requiring section 311 and "Hinshaw" pipelines to report on a quarterly basis storage and transportation transactions containing specific information for each transaction, aggregated by contract.
In October 2010, the FERC issued a Notice of Inquiry seeking public comment on the issue of whether and how parties that hold firm capacity on some intrastate pipelines can allow others to use their capacity, including to what extent buy/sell transactions should permitted and whether the FERC should consider requiring such pipelines to offer capacity release programs. In the Notice of Inquiry, the FERC granted a blanket waiver regarding such transactions while the FERC is considering these policy issues. The comment period has ended but the FERC has not yet issued an order.
With regard to our physical sales of natural gas, we are required to observe anti-market manipulation laws and related regulations enforced by the FERC. The Energy Policy Act of 2005, or EPAct 2005, amended the NGA to add an anti-manipulation provision which makes it unlawful for any entity to engage in prohibited behavior to be prescribed by FERC, and furthermore provides FERC with additional civil penalty authority. On January 19, 2006, FERC issued Order No. 670, a rule implementing the anti-manipulation provision of EPAct 2005, and subsequently denied rehearing. The rule makes it unlawful for any entity, directly or indirectly, in connection with the purchase or sale of natural gas subject to the jurisdiction of FERC, or the purchase or sale of transportation services
101
subject to the jurisdiction of FERC, (1) to use or employ any device, scheme or artifice to defraud; (2) to make any untrue statement of material fact or omit to make any such statement necessary to make the statements made not misleading; or (3) to engage in any act, practice, or course of business that operates as a fraud or deceit upon any person. The anti-manipulation rules do not apply to activities that relate only to intrastate or other non-jurisdictional sales or gathering, but do apply to activities of gas pipelines and storage companies that provide interstate services, such as Section 311 service, as well as otherwise non-jurisdictional entities to the extent the activities are conducted "in connection with" gas sales, purchases or transportation subject to FERC jurisdiction, which now includes the annual reporting requirements under Order 704.
With regard to our sales of petroleum and petroleum products, we are required to observe anti-market manipulations laws and related regulations enforced by the Federal Trade Commission, or the FTC. In addition, the CFTC has enforcement authority over market manipulation with respect to certain derivative contracts. Each of FERC, the FTC and the CFTC has the power to assess fines of $1.0 million per day per violation of applicable anti-market manipulation laws and regulations. Should we violate anti-market manipulation laws and regulations, we could also be subject to third party damage claims by, among others, sellers, royalty owners and taxing authorities.
Additional proposals and proceedings that might affect the natural gas industry are pending before Congress, FERC and the courts. We cannot predict the ultimate impact of these or the above regulatory changes to our natural gas operations. We do not believe that we would be affected by any such action materially differently than similarly situated competitors.
Environmental, Health and Safety Regulation
Our exploration, development, production and processing operations are subject to various federal, state and local laws and regulations relating to health and safety, the discharge of materials and environmental protection. These laws and regulations may, among other things, require the acquisition of permits to conduct exploration, drilling and production operations; govern the amounts and types of substances that may be released into the environment in connection with oil and gas drilling and production; restrict the way we handle or dispose of our wastes; limit or prohibit construction or drilling activities in sensitive areas such as wetlands, wilderness areas or areas inhabited by endangered or threatened species; require investigatory and remedial actions to mitigate pollution conditions caused by our operations or attributable to former operations; and impose obligations to reclaim and abandon well sites and pits. Failure to comply with these laws and regulations may result in the assessment of administrative, civil and criminal penalties, the imposition of remedial obligations and the issuance of orders enjoining some or all of our operations in affected areas.
These laws and regulations may also restrict the rate of oil and natural gas production below the rate that would otherwise be possible. The regulatory burden on the oil and gas industry increases the cost of doing business in the industry and consequently affects profitability. Additionally, the Congress and federal and state agencies frequently revise environmental, health and safety laws and regulations, and any changes that result in more stringent and costly waste handling, disposal, cleanup and remediation requirements for the oil and gas industry could have a significant impact on our operating costs.
The clear trend in environmental regulation is to place more restrictions and limitations on activities that may affect the environment, and thus, any changes in environmental laws and regulations or re-interpretations of enforcement policies that result in more stringent and costly waste handling, storage, transport, disposal, or remediation requirements could have a material adverse effect on our operations and financial position in the future. We may be unable to pass on such increased compliance costs to our customers. Moreover, accidental releases or spills may occur in the course of our operations, and we cannot assure you that we will not incur significant costs and liabilities as a result of
102
such releases or spills, including any third party claims for damage to property, natural resources or persons. We maintain insurance against costs of clean-up operations, but we are not fully insured against all such risks. While we believe that we are in substantial compliance with existing environmental laws and regulations and that current requirements would not have a material adverse effect on our financial condition or results of operations, there is no assurance that this will continue in the future.
The following is a summary of certain existing environmental, health and safety laws and regulations that are more significant and to which our business operations are subject and for which compliance in the future may have a material adverse impact on our capital expenditures, results of operations or financial position.
Hazardous Substances and Waste
The Comprehensive Environmental Response, Compensation and Liability Act, CERCLA, also known as the Superfund law, and comparable state laws impose liability without regard to fault or the legality of the original conduct on certain classes of persons who are considered to be responsible for the release of a "hazardous substance" into the environment. These persons include current and prior owners or operators of the site where the release occurred and entities that disposed or arranged for the disposal of the hazardous substances found at the site. Under CERCLA, these "responsible persons" may be subject to strict, joint and several liability for the costs of cleaning up the hazardous substances that have been released into the environment, for damages to natural resources, and for the costs of certain health studies. CERCLA also authorizes the EPA and, in some instances, third parties to act in response to threats to the public health or the environment and to seek to recover from the responsible classes of persons the costs they incur. Neighboring landowners and other third parties may file claims for personal injury and property damage allegedly caused by the release of hazardous substances or other pollutants into the environment; such claims are not uncommon. We generate materials in the course of our operations that may be regulated as hazardous substances.
We also generate solid and hazardous wastes that are subject to the requirements of the Resource, Conservation and Recovery Act, or RCRA, as amended, and comparable state statutes. RCRA imposes requirements on the generation, storage, treatment, transportation and disposal of hazardous wastes. In the course of our operations we generate petroleum hydrocarbon wastes and ordinary industrial wastes that may be regulated as hazardous wastes. RCRA regulations specifically exclude from the definition of hazardous waste "drilling fluids, produced waters and other wastes associated with the exploration, development or production of crude oil, natural gas or geothermal energy." However, legislation has been proposed in Congress from time to time that would reclassify certain natural gas and oil exploration and production wastes as "hazardous wastes," which would make the reclassified wastes subject to much more stringent handling, disposal and clean-up requirements. In addition, in September 2010, the Natural Resources Defense Council filed a petition with the EPA requesting them to reconsider the RCRA exemption for exploration, production and development wastes. To date, the EPA has not taken any action on the petition. If oil and natural gas exploration and production wastes become subject to RCRA through legislation or regulation, it could have a significant impact on our operating costs, as well as the natural gas and oil industry in general.
We currently own or lease, and have in the past owned or leased, properties that have been used for numerous years to explore and produce oil and natural gas. Although we have utilized operating and disposal practices that were standard in the industry at the time, hydrocarbons and wastes may have been disposed of or released on or under the properties owned or leased by us or on or under the other locations where these hydrocarbons and wastes have been taken for treatment or disposal. In addition, certain of these properties have been operated by third parties whose treatment and disposal or release of hydrocarbons and wastes was not under our control. These properties and wastes disposed thereon may be subject to CERCLA, RCRA and analogous state laws. Under these laws, we could be
103
required to remove or remediate previously disposed wastes (including wastes disposed of or released by prior owners or operators), to clean up contaminated property (including groundwater contaminated by prior owners or operators), and to perform remedial operations to prevent future contamination.
Pipeline Safety and Maintenance
Pipelines, gathering systems and terminal operations are subject to increasingly strict safety laws and regulations. Both the transportation and storage of refined products and crude oil involve a risk that hazardous liquids may be released into the environment, potentially causing harm to the public or the environment. In turn, such incidents may result in substantial expenditures for response actions, significant government penalties, liability to government agencies for natural resources damages, and significant business interruption. The U.S. Department of Transportation, or the DOT, has adopted safety regulations with respect to the design, construction, operation, maintenance, inspection and management of our pipeline and storage facilities. These regulations contain requirements for the development and implementation of pipeline integrity management programs, which include the inspection and testing of pipelines and the correction of anomalies. These regulations also require that pipeline operation and maintenance personnel meet certain qualifications and that pipeline operators develop comprehensive spill response plans.
There have been recent initiatives to strengthen and expand pipeline safety regulations and to increase penalties for violations. Partly in response to a series of pipeline incidents, new pipeline safety legislation requiring more stringent spill reporting and disclosure obligations was introduced in the U.S. Congress and was passed by the U.S. House of Representatives in 2010, but was not voted on in the U.S. Senate. Similar legislation is being considered by Congress again this year, either independently or in conjunction with the reauthorization of the Pipeline Safety Act. The DOT has also recently proposed legislation providing for more stringent oversight of pipelines and increased penalties for violations of safety rules, which is in addition to the Pipeline and Hazardous Materials Safety Administration's announced intention to strengthen its rules. The DOT also recently promulgated new regulations extending safety rules to certain low pressure, small diameter pipelines in rural areas. If adopted, these more stringent pipeline laws and regulations would increase our costs of operations.
Air Emissions
The Clean Air Act, or the CAA, as amended, and comparable state laws and regulations restrict the emission of air pollutants from many sources, including oil and gas operations, and impose various monitoring and reporting requirements. These laws and regulations may require us to obtain pre-approval for the construction or modification of certain projects or facilities expected to produce or significantly increase air emissions, obtain and comply with stringent air permit requirements or utilize specific equipment or technologies to control emissions. Obtaining permits has the potential to delay the development of oil and natural gas projects.
On August 20, 2010, the EPA published new regulations under the CAA to control emissions of hazardous air pollutants from existing stationary reciprocating internal combustion engines. The rule may require us to undertake certain expenditures and activities, likely including purchasing and installing emissions control equipment, such as oxidation catalysts or non-selective catalytic reduction equipment, on a portion of our engines located at major sources of hazardous air pollutants and all our engines over a certain size regardless of location, following prescribed maintenance practices for engines (which are consistent with our existing practices), and implementing additional emissions testing and monitoring. On October 19, 2010, industry groups submitted a legal challenge to the U.S. Court of Appeals for the D.C. Circuit and a Petition for Administrative Reconsideration to the EPA for some monitoring aspects of the rule. The legal challenge has been held in abeyance since December 3, 2010, pending the EPA's consideration of the Petition for Administrative Reconsideration. On January 5, 2011, the EPA approved the request for reconsideration of the monitoring issues and on
104
March 9, 2011, the EPA issued a new proposed rule and a direct final rule effective on May 9, 2011 to clarify compliance requirements related to operation and maintenance procedures for continuous parametric monitoring systems. If significant adverse comments are filed on the direct final rule, the EPA would address public comments in a subsequent final rule. Only three comments were submitted regarding the rule, and the EPA has not withdrawn or modified the final rule. Compliance with the final rule currently is required by October 2013.
On June 28, 2011, the EPA issued a final rule, effective August 29, 2011, modifying existing regulations under the CAA that established new source performance standards for manufacturers, owners and operators of new, modified and reconstructed stationary internal combustion engines. Those new requirements may increase our costs of buying and operating such engines. Compliance with the final rule would not be required until at least 2013.
On July 28, 2011, the EPA proposed rules that would establish new air emission controls for oil and natural gas production and natural gas processing operations. Specifically, the EPA's proposed rule package includes New Source Performance Standards to address emissions of sulfur dioxide and volatile organic compounds, or VOCs, and a separate set of emission standards to address hazardous air pollutants frequently associated with oil and natural gas production and processing activities. The proposed rules also would establish specific new requirements regarding emissions from compressors, dehydrators, storage tanks and other production equipment. In addition, the rules would establish new leak detection requirements for natural gas processing plants. The EPA will receive public comment and hold hearings regarding the proposed rules and must take final action on the rules by February 28, 2012. If finalized, these rules could require modifications to our operations or increase our capital and operating costs without being offset by increased product capture. At this point, we cannot predict the final regulatory requirements or the cost to comply with such requirements.
Climate Change
The United States is a party to the United Nations Framework Convention on Climate Change, an international treaty focused on stabilizing GHG concentrations in the atmosphere at a level that would prevent serious damage to the climate system. While neither the treaty itself, nor subsequent related conferences, have established an obligation for the U.S. to reduce its GHG emissions by a set amount, it has put significant political pressure on the U.S. to take responsive action. Both houses of Congress have previously considered legislation to reduce emissions of GHGs. Any future federal laws, treaties or implementing regulations that may be adopted to address GHG emissions could require us to incur increased operating costs and could adversely affect demand for the oil and natural gas we produce.
In addition, the EPA has begun to regulate GHG emissions. In December 2009, the EPA published an Endangerment Finding that certain emissions of GHGs presented an endangerment to human health and the environment. These findings by the EPA allow the agency to proceed with the adoption and implementation of regulations that would restrict emissions of GHGs under existing provisions of the CAA. Consequently, the EPA is requiring a reduction in emissions of GHGs from new motor vehicles beginning with the 2012 model year. Furthermore, the EPA published a final rule on June 3, 2010 to address the permitting of GHG emissions from stationary sources under the Prevention of Significant Deterioration, or PSD, and Title V permitting programs. This rule "tailors" these permitting programs to apply to certain stationary sources of GHG emissions, such as power plants and oil refineries, in a multi-step process, with the largest sources first subject to permitting. Facilities required to obtain PSD permits for their GHG emissions will be required to meet emissions limits that are based on the "best available control technology," which will be established by the permitting agencies on a case-by-case basis. Starting in January 2011, stationary sources that were already obtaining a CAA permit for other pollutants were required to include GHGs in their permits if they emit at least 75,000 tons of these emissions a year. In July 2012, the rule expands to include all new facilities that emit at least 100,000 tons of GHGs per year.
105
In addition, in October 2009, the EPA issued a final rule requiring the reporting of GHGs from specified large GHG emission sources beginning in 2011 for emissions in 2010. This rule requires large stationary sources and suppliers in the U.S. to track and report GHG emissions. The EPA's rules relating to emissions of GHGs from large stationary sources of emissions are currently subject to a number of legal challenges, but the federal courts have thus far declined to issue any injunctions to prevent the EPA from implementing, or requiring state environmental agencies to implement, the rules. On November 30, 2010, the EPA published a rule that sets forth annual reporting requirements for the petroleum and natural gas industry and requires persons that hold state drilling permits for sources that emit 25,000 metric tons or more of carbon dioxide equivalent per year to report the carbon dioxide, methane and nitrous oxide emissions from certain sources, including petroleum refineries, beginning on March 31, 2012. However, in August 2011, the EPA published a proposed rule containing technical amendments to certain GHG reporting requirements that included a six-month extension for reporting GHG emissions from petroleum and natural gas industry sources. Certain onshore oil and natural gas production, processing, transmission, storage and distribution facilities are required to report their GHG emissions on an annual basis beginning in 2012 for emissions occurring in 2011.The adoption and implementation of any regulations imposing reporting obligations on, or limiting emissions of GHGs from, our equipment and operations could require us to incur costs to reduce emissions of GHGs associated with our operations or could adversely affect demand for the oil and natural gas we produce.
Even if such legislation is not adopted at the national level, almost one-half of the states have begun taking actions to control and/or reduce emissions of GHGs, primarily through the planned development of GHG emission inventories and/or regional GHG cap and trade programs. Although most of the state-level initiatives have, to date, focused on large sources of GHG emissions, such as coal-fired electric plants, it is possible that smaller sources of emissions could become subject to GHG emission limitations or allowance purchase requirements in the future. Any one of these climate change regulatory and legislative initiatives could have a material adverse effect on our business, financial condition and results of operations.
Legislation or regulations that may be adopted to address climate change could also affect the markets for our products by making our products more or less desirable than competing sources of energy. To the extent that our products are competing with higher GHG emitting energy sources such as coal, our products would become more desirable in the market with more stringent limitations on GHG emissions. To the extent that our products are competing with lower GHG emitting energy sources such as solar and wind, our products would become less desirable in the market with more stringent limitations on GHG emissions. We cannot predict with any certainty at this time how these possibilities may affect our operations.
Finally, it should be noted that some scientists have concluded that increasing concentrations of GHGs in the Earth's atmosphere may produce climate changes that have significant physical effects, such as increased frequency and severity of storms, floods and other climatic events. If any such effects were to occur, they could adversely affect or delay demand for the oil or natural gas or otherwise cause us to incur significant costs in preparing for or responding to those effects.
Water Discharges
The Federal Water Pollution Control Act, as amended, also known as the Clean Water Act, or the CWA, and analogous state laws impose restrictions and controls regarding the discharge of pollutants into waters of the United States. Courts have interpreted the term "waters of the United States" to include not only traditional navigable waters, but also certain wetlands, small drainages, and creeks. The law surrounding the jurisdiction of the CWA is continually evolving. Pursuant to the CWA and analogous state laws, permits must be obtained to discharge pollutants into state waters or waters of the U.S. Any such discharge of pollutants into regulated waters must be performed in accordance with the terms of the permit issued by the EPA or the analogous state agency. The CWA and regulations
106
implemented thereunder also prohibit the discharge of dredge and fill material into regulated waters, including jurisdictional wetlands, unless authorized by an appropriately issued permit. Spill prevention, control and countermeasure requirements under federal law require appropriate containment berms and similar structures to help prevent the contamination of navigable waters in the event of a petroleum hydrocarbon tank spill, rupture or leak. In addition, the CWA and analogous state laws require individual permits or coverage under general permits for discharges of storm water runoff from certain types of facilities. Federal and state regulatory agencies can impose administrative, civil and criminal penalties as well as other enforcement mechanisms for non-compliance with discharge permits or other requirements of the CWA and analogous state laws and regulations.
The EPA is considering two CWA discharge regulations for hydraulic fracturing operations. One regulation would subject facilities to effluent limits and the other regulation would establish discharge limits on chloride, a pollutant commonly produced during the extraction process. The cost to comply with such regulations or any other restrictions on discharges of wastewater from hydraulic fracturing or other operations could have a significant adverse affect on our operations and profitability.
Endangered Species Act, Migratory Birds, Natural Resource Damages
Various state and federal statutes prohibit certain actions that adversely affect endangered or threatened species and their habitat, migratory birds, wetlands, and natural resources. These statutes include the Endangered Species Act, the Migratory Bird Treaty Act, the CWA and CERCLA. Where the taking of or harm to such species or birds occurs or may occur, or where damages to wetlands, habitat or natural resources occur or may occur, government entities (or, at times, private parties) may act to prevent oil and natural gas exploration activities or may seek damages resulting from the death of endangered animals or migratory birds, the filling of wetlands, construction, or releases of oil, wastes, hazardous substances or other regulated materials. Some of our drilling operations may be in areas where protected species and/or their habitats are suspected or known to exist. In these areas, the operator may be obligated to develop and implement plans to avoid potential adverse effects to protected species and their habitats, and also may be prohibited from conducting drilling operations in certain locations or during certain seasons, such as breeding and nesting seasons, when operations could have an adverse effect on the species. Also, a federal or state agency could order a complete halt to drilling activities in certain locations if it is determined that such activities may have a serious adverse effect on a protected species. The presence of a protected species in areas where we operate could impair the operator's ability to timely complete well drilling and development and could adversely affect future production from those areas.
Employee Health and Safety
We are subject to a number of federal and state laws and regulations, including the federal Occupational Safety and Health Act, as amended, or the OSH Act, and comparable state statutes, whose purpose is to protect the health and safety of workers. In addition, the OSH Act's hazard communication standard, the EPA community right-to-know regulations under Title III of the federal Superfund Amendment and Reauthorization Act and comparable state statutes require that information be maintained concerning hazardous materials used or produced in our operations and that this information be provided to employees, state and local government authorities and citizens. We believe that we are in substantial compliance with all applicable laws and regulations relating to worker health and safety.
Hydraulic Fracturing
Regulations relating to hydraulic fracturing. The federal Safe Drinking Water Act, or the SDWA, and comparable state statutes may restrict the disposal, treatment or release of water produced or used during oil and gas development. Subsurface emplacement of fluids (including disposal wells or
107
enhanced oil recovery) is governed by federal or state regulatory authorities that, in some cases, include the state oil and gas regulatory authority or the state's environmental authority. The federal Energy Policy Act of 2005 amended the Underground Injection Control, or the UIC, provisions of the SDWA to expressly exclude hydraulic fracturing from the definition of "underground injection." However, the U.S. Senate and House of Representatives are currently considering the FRAC Act to amend the SDWA to repeal this exemption. If enacted, the FRAC Act would amend the definition of "underground injection" in the SDWA to encompass hydraulic fracturing activities. If enacted, such a provision could require hydraulic fracturing operations to meet permitting and financial assurance requirements, adhere to certain construction specifications, fulfill monitoring, reporting, and recordkeeping obligations, and meet plugging and abandonment requirements. The FRAC Act also proposes to require the reporting and public disclosure of chemicals used in the fracturing process. If the exemption for hydraulic fracturing is removed from the SDWA, or if the FRAC Act or other legislation is enacted at the federal, state or local level, any restrictions on the use of hydraulic fracturing contained in any such legislation could have a significant impact on our financial condition and results of operations.
Federal agencies are also considering regulation of hydraulic fracturing. The EPA recently asserted federal regulatory authority over hydraulic fracturing involving diesel additives under the SDWA's UIC Program. While the EPA has yet to take any action to enforce or implement this newly asserted regulatory authority, the EPA's interpretation without formal rule making has been challenged and industry groups have filed suit challenging the EPA's interpretation. If the EPA prevails in this lawsuit, its interpretation could result in enforcement actions against service providers or companies that used diesel products in the hydraulic fracturing process or could require such providers or companies to conduct additional studies regarding diesel in the groundwater. The EPA is also collecting information as part of a study into the effects of hydraulic fracturing on drinking water. Initial results are expected in late 2012 and final results expected in 2014. The findings in this study could result in additional regulations, leading to operational burdens similar to those described above. The United States Department of the Interior is likewise considering whether to impose disclosure requirements or other mandates for hydraulic fracturing on federal land.
In addition, some states have placed or are considering placing regulatory burdens upon hydraulic fracturing activities. At the state level, Wyoming and Texas, for example, have enacted requirements for the disclosure of the composition of the fluids used in hydraulic fracturing. On June 17, 2011, Texas signed into law a mandate for public disclosure of the chemicals that operators use during hydraulic fracturing in Texas. The law went into effect September 1, 2011. State regulators have until 2013 to complete implementing rules. In addition, at least three local governments in Texas have imposed temporary moratoria on drilling permits within city limits so that local ordinances may be reviewed to assess their adequacy to address hydraulic fracturing activities. Additional burdens upon hydraulic fracturing, such as reporting requirements or permitting requirements for the hydraulic fracturing activity, will result in additional expense and delay in our operations.
At this time, it is not possible to estimate the potential impact on our business of these state and local actions or the enactment of additional federal or state legislation or regulations affecting hydraulic fracturing.
Our use of hydraulic fracturing. We use hydraulic fracturing as a means to maximize production of oil and gas from formations having low permeability such that natural flow is restricted. Fracture stimulation has been used for decades in the Rocky Mountains, South Texas and the Arkoma Basin. In the Rocky Mountains, other companies in the oil and gas industry have fracture stimulated tens of thousands of wells since the mid 1980s. We have not completed any fracture stimulations in either the DJ Basin or Powder River Basin since acquiring these assets. We anticipate completing two such operations in the Powder River Basin in the first quarter of 2012. Since acquiring our Arkoma Basin assets in 2009, we have conducted fracture stimulation procedures as the operator on 11 horizontal
108
wells where we utilized a total of 106 separate fracture stimulation stages and participated in numerous wells as a non-operator that were fracture stimulated. These non-operated Arkoma Basin wells consisted of 23 horizontal wells where we utilized a total of 217 separate fracture stimulation stages. Since entering the Eagle Ford Shale play of South Texas, we have conducted stimulation procedures on 12 horizontal wells where we have utilized a total of 173 fracture stimulation stages.
We expect that approximately 90% of our total acreage held as of December 31, 2010 may be subject to hydraulic fracturing in one or more reservoirs. Our use of hydraulic fracturing is expected to be required in each of our core areas. Although the cost of each well varies, costs incurred in connection with hydraulic fracturing activities as a percentage of the total cost of drilling and completing a new-drill well are estimated to average approximately 30% (or $2.0 million) in the Powder River Basin, 30% (or $2.0 million) in the Woodford Shale of the Arkoma Basin and 50% (or $4.0 million) in the Eagle Ford Shale of South Texas. These costs are accounted for in the same way that all other costs of drilling and completing our wells are accounted for and are included in our normal capital expenditure budget, which is funded through operating cash flows or borrowings under our credit facility. Based on the expected capital forecast in our proved reserve report, we estimate that we will spend approximately $125.0 million for future fracturing activities on both new-drill wells and workovers on existing wells.
For as long as we have owned and operated properties subject to hydraulic fracturing, there have not been any incidents, citations or suits related to fracturing operations or related to environmental concerns from fracturing operations.
We periodically review our plans and policies regarding oil and gas operations, including hydraulic fracturing, in order to minimize any potential environmental impact. We adhere to applicable legal requirements and industry practices for groundwater protection. Our operations are subject to close supervision by state and federal regulators (including the Bureau of Land Management with respect to federal acreage), who frequently inspect our fracturing operations.
During well construction, steel casing pipe and concrete are employed for protection. Once the pipe is set in place, cement is pumped into the well where it hardens to create an isolating barrier between the steel casing pipe and the surrounding geological formations. In accordance with best industry practices, casing and cement design conforms to the applicable requirements and standards of state agencies. As an example, for any fresh water aquifers, a separate string of casing is set below the base as part of the casing design to eliminate any "pathway" for the fracturing fluid to contact any fresh water aquifers during the hydraulic fracturing operations. Furthermore, the hydrocarbon bearing formations are generally separated from any usable underground fresh water aquifers by thousands of feet of impermeable rock layers. This distance is approximately 5,400 feet, 5,500 feet and 6,000 to 10,000 feet, respectively, for our Powder River Basin, Eagle Ford Shale and Woodford Shale reservoirs that are being fracture stimulated. This wide separation serves as a protective barrier that prevents any migration of fracturing fluids or hydrocarbons upwards into any groundwater zones. In addition, the vendors conducting hydraulic fracturing on our properties monitor pump rates and pressures during the fracturing treatments. This monitoring occurs on a real-time basis to identify abrupt changes in rate or pressure, which permits the operator to modify or cease the fracturing process.
Typical hydraulic fracturing treatments are made up of water, chemical additives and sand. We utilize major hydraulic fracturing service companies who track and report all additive chemicals that are used in fracturing as required by the appropriate government agencies. Each of these companies fracture stimulate a multitude of wells for the industry each year.
We strive to minimize water usage in our fracture stimulation designs. Water recovered from our hydraulic fracturing operations is disposed of in a way that does not impact surface waters. We dispose of our recovered water by means of approved disposal or injection wells.
109
Surface spills and leaks are controlled, contained and remediated in accordance with the applicable requirements of state oil and gas commissions, as well as any Spill Prevention, Control and Countermeasures plans we maintain in accordance with EPA requirements. This would include any action up to and including total abandonment of the wellbore.
Other Laws
The Oil Pollution Act of 1990, as amended, or the OPA, establishes strict liability for owners and operators of facilities that are the site of a release of oil into waters of the U.S. The OPA and its associated regulations impose a variety of requirements on responsible parties related to the prevention of oil spills and liability for damages resulting from such spills. A "responsible party" under the OPA includes owners and operators of certain onshore facilities from which a release may affect waters of the U.S. The OPA assigns liability to each responsible party for oil cleanup costs and a variety of public and private damages. While liability limits apply in some circumstances, a party cannot take advantage of liability limits if the spill was caused by gross negligence or willful misconduct or resulted from violation of a federal safety, construction or operating regulation. If the party fails to report a spill or to cooperate fully in the cleanup, liability limits likewise do not apply. Few defenses exist to the liability imposed by the OPA. The OPA imposes ongoing requirements on a responsible party, including the preparation of oil spill response plans and proof of financial responsibility to cover environmental cleanup and restoration costs that could be incurred in connection with an oil spill.
The National Environmental Policy Act of 1969, as amended, or the NEPA, requires federal agencies to evaluate major agency actions having the potential to significantly impact the environment before their commencement. Generally, federal agencies must prepare either an environmental assessment or an environmental impact statement depending on whether the specific circumstances surrounding the proposed federal action will have a significant impact on the environment. The NEPA process involves public input through comments which can alter the nature of a proposed project either by limiting the scope of the project or requiring resource-specific mitigation. NEPA decisions can be appealed through the administrative and federal court systems by process participants. Although we believe that our actions do not typically trigger NEPA analysis, should we ever be subject to NEPA, the process may result in delaying the permitting and development of projects, increase the costs of permitting and developing some facilities and could result in certain instances in the cancellation of certain leases.
Employees
At December 31, 2011, we had 47 full-time employees. We believe that our relationships with our employees are satisfactory. No employee is covered by a collective bargaining agreement. From time to time, we use the services of independent consultants and contractors to perform various professional services, particularly in the areas of geology and geophysics, construction, design, well site surveillance and supervision, permitting and environmental assessment and legal and income tax preparation and accounting services. Independent contractors, at our request, drill all of our wells and usually perform field and on-site production operation services for us, including pumping, maintenance, dispatching, inspection and testing. If significant opportunities for company growth arise and require additional management and professional expertise, we will seek to employ qualified individuals to fill positions where that expertise is necessary to develop those opportunities.
Offices
Our corporate headquarters are located at 2626 Howell Street, Suite 800, Dallas, Texas 75204, where we lease approximately 21,355 square feet of office space under a lease that expires on December 31, 2015. The phone number at our corporate headquarters is (214) 520-7727. We believe
110
that our current facilities are sufficient to meet our current needs, and that suitable additional or substitute space will be available as needed to accommodate future growth.
Legal Proceedings
We acquired a working interest in a field in Louisiana in 2004. Prior to the acquisition, the former working interest owner hired an independent third party to perform a 3-D seismic study on the land. In September 2005, we, along with the other working interest owners in this field, sued such third party in the 36th Judicial District Court, for the Parish of Beauregard, State of Louisiana for failure to abide by the existing contract. The third party countersued alleging that we and the other working interest owners improperly used the seismic data and are seeking damages. Our management believes that the claims of the third party are without merit. A bench trial on this matter was concluded in November 2011 and we anticipate that the Court will issue a decision in early 2012. We are unable to estimate a range of possible losses in this matter.
Our wholly owned subsidiary, DRI, is a defendant in a lawsuit filed in June 2002 in the 164th Judicial District Court of Harris County, Texas involving notice of preferential rights to acquire additional interests in various properties, as well as the conduct and costs associated with field operations. During 2009, we settled our claims with one of the plaintiffs, the terms of which included our acquisition of the plaintiff's interest in certain of our existing properties. Furthermore, in August 2010 we elected not to pursue further appeals and paid a $1,500,000 judgment concluding significant parts of the litigation. Two issues relating to the preferential rights remain open and are expected to go to trial in February 2012. We do not believe that our exposure to economic damages is material; however, the plaintiffs are also seeking punitive damages and attorney's fees which cannot be quantified. We are vigorously defending ourselves in this matter.
Our wholly owned subsidiary, Camden Resources, LLC, previously filed suit in January 2009 in the 25th Judicial District Court of Colorado County, Texas against one of its tubing vendors alleging faulty construction of certain production casing which failed and resulted in loss to us. During the year ended December 31, 2010, we withdrew our claims, but certain of the other working interest owners in the affected properties filed suit against us in February 2010 in the 25th Judicial District Court of Colorado County, Texas for the recovery of their portion of the loss incurred resulting from the faulty production casing. We are vigorously defending ourselves in this matter. We are unable to estimate a range of possible losses in this matter.
In addition to the aforementioned litigation, from time to time, we are subject to legal proceedings and claims that arise in the ordinary course of business. Like other oil and natural gas producers and marketers, our operations are subject to extensive and rapidly changing federal and state environmental, health and safety and other laws and regulations governing air emissions, wastewater discharges, and solid and hazardous waste management activities. As of the date of this prospectus, we are not currently a party to any material legal proceeding and are not aware of any material legal or governmental proceedings against us, or contemplated to be brought against us other than the aforementioned litigation described above.
111
The following table sets forth the names, ages and positions of our executive officers and directors as of the date of this prospectus.
Name
|
Age | Position(s) held | ||
|---|---|---|---|---|
Jon L. Glass |
56 | Chairman of the Board, President and Chief Executive Officer | ||
Wayne B. Stoltenberg |
44 | Chief Financial Officer and Senior Vice President | ||
Edward P. Travis |
48 | Chief Operating Officer and Senior Vice President | ||
Leigh T. Prieto |
57 | Chief Accounting Officer and Vice President | ||
Craig D. Pollard |
54 | Vice President, Exploration | ||
Chris M. Kidd |
56 | Vice President, Land | ||
Alan D. Bell |
66 | Director | ||
James C. Crain |
63 | Director | ||
Ellen K. Hannan |
55 | Director | ||
W. Howard Keenan, Jr. |
61 | Director | ||
James R. Latimer, III |
65 | Director | ||
Bryan H. Lawrence |
69 | Lead Director |
Jon L. Glass is the Chairman of our board of directors and our President and Chief Executive Officer. Mr. Glass is the founder of Cinco Resources, Inc. and has served as the President and Chief Executive Officer of Cinco Resources since its inception. Mr. Glass has over 31 years of experience in the upstream exploration and production industry, serving in senior executive positions for the last 19 years. From 1999 to 2002, Mr. Glass was President and Chief Executive Officer of United Oil & Minerals, a private oil and gas exploration and production company. From 1992 to 1999, Mr. Glass was with Brigham Exploration, Inc. and served as Vice President—Exploration and a Director of the company from 1995 to 1999. From 1984 to 1992, Mr. Glass served in various capacities with Santa Fe Minerals, an oil and gas exploration company, in a variety of staff and managerial positions mainly focused on Santa Fe Minerals' exploration activities in the midcontinent, Gulf of Mexico (onshore and offshore) and international divisions. Mr. Glass' early geological experience includes two and a half years with Mid-America Pipeline Company and one and a half years with Texaco USA, serving mainly as a midcontinent exploration geologist. Mr. Glass holds a B.S. and an M.S. in Geology from Oklahoma State University and an M.B.A. from the University of Tulsa.
Wayne B. Stoltenberg joined us as our Chief Financial Officer and Senior Vice President in 2008. Mr. Stoltenberg has over 15 years of experience in investment banking, primarily focused on the upstream and coal mining sectors of the energy markets, with Bear Stearns and Credit Suisse. While with these firms, Mr. Stoltenberg participated in a number of public equity and debt financings, bank loans, merger advisory assignments and derivative transactions. Mr. Stoltenberg holds a B.A. from Columbia University and an M.B.A. from the University of Texas at Austin.
Edward P. Travis has served as our Chief Operating Officer and Senior Vice President since 2007. Mr. Travis joined the company in 2007 after working as Chief Operating Officer for Wynn Crosby, a private oil and gas company in Dallas, Texas. Prior to his time at Wynn Crosby, Mr. Travis served as Senior Partner for LaRoche Consultants, Ltd. for nine years and as a Senior Petroleum Consultant for four years with Netherland, Sewell & Associates, Inc. While at both LaRoche and Netherland, Sewell & Associates, Inc., Mr. Travis worked on the evaluation of numerous domestic resource plays. Prior to Netherland, Sewell & Associates, Inc., Mr. Travis spent five years with BP Exploration in various operational reservoir and planning roles and three years with Tenneco Oil as a drilling and reservoir engineer. Mr. Travis holds a B.S. in Petroleum Engineering from Marietta College and is a Licensed Professional Engineer in the State of Texas.
112
Leigh T. Prieto is our Chief Accounting Officer and Vice President. Mr. Prieto joined the company in June 2004. Mr. Prieto began his accounting career with PricewaterhouseCoopers LLP. He has been involved in the oil and gas industry from 1980, holding various positions with Pioneer Natural Resources Company (formerly Parker & Parsley Petroleum Company) for ten years. From 2000 to 2004, Mr. Prieto served as Chief Financial Officer of United Resources, LP (formerly United Oil & Minerals), where he worked with Mr. Glass and Mr. Pollard. Mr. Prieto holds a B.B.A. in Accounting from the University of Texas at Austin and is a licensed Certified Public Accountant in the State of Texas.
Craig D. Pollard is our Vice President, Exploration. Mr. Pollard joined the company in 2003 as an exploration geologist and Vice President, Exploration. Mr. Pollard has more than 25 years of experience in the upstream exploration and production industry, with roles in development geology, exploration geology and region planning and management. From 1999 to 2002, Pollard served as an exploration geologist and vice president of exploration at United Resources, LP, where he worked with Mr. Glass and Mr. Prieto. From 1995 to 1999, Mr. Pollard worked as an exploration geologist with Brigham Exploration, Inc., and from 1987 to 1995, he worked as a development geologist, exploration geologist and regional planner with Sun-Oryx. Mr. Pollard holds a B.S. in Geology from the University of Texas at Austin and an M.S. in Geology from Baylor University.
Chris M. Kidd is our Vice President, Land. Mr. Kidd has over 30 years of land, acquisition and divestiture experience. Mr. Kidd joined the company in June 2008. Mr. Kidd began his career with Hunt Energy, a private oil and gas company in Dallas, Texas, in 1981 as Landman, and was ultimately promoted to District Landman in Oklahoma City, Oklahoma. In 1983, he joined Rosewood Resources, Inc., a Dallas-based private exploration and production company and sister company to Hunt Energy where he served as District Landman and eventually served as Vice President—Land at Rosewood. In 1999, Mr. Kidd joined Nadel and Gussman, LLC, a private oil and gas company in Tulsa, Oklahoma, as Vice President Acquisitions and Divestments. In 2000, he joined Canaan Natural Resources Corporation, an independent energy company, as Vice President Acquisitions and Divestments. In 2002, Mr. Kidd rejoined Nadel and Gussman, LLC as Vice President Acquisitions and Divestments, where he served until he joined the company in 2008. Mr. Kidd holds a B.B.A. in Management from Texas Tech University.
Alan D. Bell has been a member of our board of directors since July 2011. Mr. Bell's prior experience includes 33 years in various capacities at Ernst & Young LLP from 1973 until his retirement in 2006, when he was Director of Ernst & Young's Energy Practice in the Southwest United States. Before joining Ernst & Young, Mr. Bell was a production engineer with Chevron Oil Company in the Gulf of Mexico. During 2009, Mr. Bell served as the Chief Restructuring Officer of Energy Partners Ltd., a New Orleans-based exploration and development company that emerged from Chapter 11 in September 2009. Mr. Bell currently serves on the board of directors of Approach Resources Inc., an independent energy company engaged in the exploration, development, production and acquisition of oil and gas properties, and Dune Energy Inc., an independent energy company based in Houston. During the past five years, Mr. Bell has also been a director of Toreador Resources Corporation, an independent energy company with interests in developed and undeveloped oil properties in France. Mr. Bell earned a degree in Petroleum Engineering from the Colorado School of Mines and an M.B.A. from Tulane University. He is a member of the American Institute of Certified Public Accountants, the Texas Society of Certified Public Accountants and is a licensed Certified Public Accountant in Texas. Mr. Bell is also a member of the Institute of Certified Management Accountants, Association of Certified Fraud Examiners and the Society of Petroleum Engineers.
James C. Crain has been a member of our board of directors since 2010. Mr. Crain has been in the energy industry for over 30 years, both as an attorney and as an executive officer. Since 1984, Mr. Crain has been an officer of Marsh Operating Company, an investment management company focusing on energy investing, including his current position as President, which he has held since 1989.
113
Mr. Crain has served as general partner of Valmora Partners, L.P., a private investment partnership that invests in the oil and gas sector, among others, since 1997. Before joining Marsh in 1984, Mr. Crain was a partner in the law firm of Jenkens & Gilchrist, where he headed the firm's energy section. Mr. Crain is a director of Approach Resources Inc., an independent energy company engaged in the exploration, development, production and acquisition of oil and gas properties, Crosstex Energy, Inc., a midstream natural gas company, and GeoMet, Inc., a natural gas exploration and production company. During the past five years, Mr. Crain also has been a director of Crosstex Energy GP, LLC, the general partner of a midstream natural gas company, and Crusader Energy Inc., an oil and gas exploration and production company. Mr. Crain holds a B.B.A., M.P.A. and J.D. from the University of Texas at Austin.
Ellen K. Hannan has been a member of our board of directors since December 2011. Ms. Hannan has over 30 years of experience in the energy industry. She began her career at Texaco where she spent eight years in financial analysis. She subsequently worked for energy research firm John S. Herold, Inc. (now IHS Herold) and the wealth management and investment advisory firm Bessemer Trust. She then began her 16-year tenure as a research analyst working for Prudential Securities, Bear, Stearns & Co. Inc. and Weeden & Co., L.P. Ms. Hannan graduated from Skidmore College with B.A. in Business and received an M.B.A. from Pace University.
W. Howard Keenan, Jr. has been a member of our board of directors since 2002. Mr. Keenan has over 35 years of experience in the financial and energy businesses. Mr. Keenan is a founder and Manager of Yorktown Partners LLC, the manager of the Yorktown group of investment partnerships, which make investments in companies in the energy industry. The Yorktown group of investment partnerships was formerly affiliated with the investment firm of Dillon, Read & Co. Inc., where Mr. Keenan was employed from 1975 until the merger of Dillon Read with SBC Warburg in 1997. Mr. Keenan currently serves on the board of directors of Concho Resources Inc. and GeoMet, Inc. and certain non-public companies in the energy industry in which the Yorktown group of investment partnerships holds equity interests. Mr. Keenan holds a B.A. from Harvard College and an M.B.A. from Harvard University.
James R. Latimer, III has been a member of our board of directors since July 2011. In addition to serving as a Managing Director of Blackhill Partners LLC, a Dallas-based financial advisory firm serving clients in the energy and technology businesses, Mr. Latimer has headed Explore Horizons, Incorporated, a privately held exploration and production company based in Dallas, Texas, since 1993. Since February 2011, Mr. Latimer has served as Chief Executive Officer of Cano Petroleum, Inc. Previously, Mr. Latimer was co-head of the regional office of what is now Prudential Financial, Inc. He was a director of Prize Energy and its audit committee chairman from October 2000 until its acquisition by Magnum Hunter Resources in March 2002, and he continued as a director and the audit committee chairman of Mangum Hunter until October 2004. In addition, Mr. Latimer's prior experience includes senior executive positions with several private energy companies, consulting with the firm of McKinsey & Co. and service as an officer in the United States Army Signal Corps. Mr. Latimer holds a B.A. in Economics from Yale University and an M.B.A. from Harvard University. He has received the Chartered Financial Analyst and Certified Public Accountant designations. Mr. Latimer previously served on the board of directors of Energy Partners, Ltd., and currently serves as a member of the board of directors of Enron Creditors Recovery Corp., NGP Capital Resources Company and Cano Petroleum, Inc.
Bryan H. Lawrence has been a member of our board of directors since 2002 and is our Lead Director. Mr. Lawrence is a founder and Manager of Yorktown Partners LLC, the manager of the Yorktown group of investment partnerships, which make investments in companies in the energy industry. The Yorktown group of investment partnerships was formerly affiliated with the investment firm of Dillon, Read & Co. Inc., where Mr. Lawrence had been employed since 1966, serving as a Managing Director until the merger of Dillon Read with SBC Warburg in 1997. Mr. Lawrence is a director of Approach Resources Inc., an independent energy company engaged in the exploration,
114
development, production and acquisition of oil and gas properties, Crosstex Energy, Inc. and Crosstex Energy GP, LLC, midstream natural gas companies, Hallador Energy Company, an independent company engaged in the production of coal and the exploration and production of oil and gas, the general partner of Star Gas Partners, L.P., a home heating oil distributor and services provider, Winstar Resources Ltd. and Compass Petroleum Ltd., Canadian oil and gas companies, and certain non-public companies in the energy industry in which the Yorktown group of investment partnerships holds equity interests. During the past five years, Mr. Lawrence has also been a director of TransMontaigne Inc., a refined petroleum products company. Mr. Lawrence holds a B.S. from Hamilton College and an M.B.A. from Columbia University.
Board of Directors
Board Composition
Our amended and restated bylaws will provide that the board of directors shall consist of one or more members, the number to be determined from time to time by resolution of the board of directors. Upon the consummation of this offering, we will have seven directors: Messrs. Glass, Bell, Crain, Keenan, Latimer and Lawrence and Ms. Hannan.
As provided in our amended and restated certificate of incorporation, our board will be divided into three classes of directors, designated Class I, Class II and Class III, with the term of office of each director ending on the date of the third annual meeting following the annual meeting at which such director was elected. The numbers of directors in each class will be as nearly equal as possible at all times. The initial Class I directors will hold office until the 2013 annual meeting of stockholders and until the election and qualification of their respective successors or until their earlier death, retirement, resignation or removal. The initial Class II directors will hold office until the 2014 annual meeting of stockholders and until the election and qualification of their respective successors or until their earlier death, retirement, resignation or removal. The initial Class III directors will hold office until the 2015 annual meeting of stockholders and until the election and qualification of their respective successors or until their earlier death, retirement, resignation or removal.
Director Independence
Because Yorktown will own a majority of our outstanding common stock following the completion of this offering, we will be a "controlled company" as that term is set forth in NASDAQ Rule 5615. Under NASDAQ Rule 5615(c)(2), a "controlled company" may elect not to comply with certain NASDAQ corporate governance requirements, including: (i) the requirement that a majority of our board of directors consist of independent directors, (ii) the requirement that our nominating and governance committee be composed entirely of independent directors with a written charter addressing the committee's purpose and responsibilities and (iii) the requirement that our compensation committee be composed entirely of independent directors with a written charter addressing the committee's purpose and responsibilities. We intend to avail ourselves of the "controlled company" exception under the NASDAQ rules, which exempts us from the requirements that a listed company must have a majority of independent directors on its board of directors and that its compensation and nominating and corporate governance committees be composed entirely of independent directors.
In any event, our board of directors has reviewed the materiality of any relationship that each of our directors has with us, either directly or indirectly. Based on this review, our board of directors has determined that Messrs. Bell, Crain and Latimer and Ms. Hannan are "independent directors" as defined by the NASDAQ rules and Rule 10A-3 of the Exchange Act.
115
Committees of the Board of Directors
We are a "controlled company" as that term is set forth in NASDAQ Rule 5615 because more than 50% of our voting power is held by Yorktown. Under NASDAQ Rule 5615(c)(2), a "controlled company" may elect not to comply with certain NASDAQ corporate governance requirements, including (i) the requirement that a majority of the board of directors consist of independent directors, (ii) the requirement that the nominating and corporate governance committee be composed entirely of independent directors with a written charter addressing the committee's purpose and responsibilities and (iii) the requirement that the compensation committee be composed entirely of independent directors with a written charter addressing the committee's purpose and responsibilities. While these requirements will not apply to us as long as we remain a "controlled company," our compensation committee and our nominating and corporate governance committee will initially consist entirely of independent directors within the meaning of the NASDAQ rules currently in effect.
Prior to the closing of this offering, our board of directors will establish an audit committee, a compensation committee and a nominating and corporate governance committee, and may establish such other committees as the board of directors shall determine from time to time. Each of the standing committees of the board of directors will have the responsibilities described below.
Audit Committee. We anticipate that our audit committee will initially consist of three members who are financially literate, one of whom is an "audit committee financial expert" as described in Item 407(d)(5) of Regulation S-K and at least one of whom is "independent" under the standards of NASDAQ and SEC regulations. After the offering and within the time periods proscribed by NASDAQ and SEC regulations, all of the members of our audit committee will be "independent" under such regulations. This committee will oversee, review, act on and report on various auditing and accounting matters to our board of directors, including: the selection of our independent accountants, the scope of our annual audits, fees to be paid to the independent accountants, the performance of our independent accountants and our accounting practices. In addition, the audit committee will oversee our compliance programs relating to legal and regulatory requirements. We will adopt an audit committee charter defining the committee's primary duties in a manner consistent with the rules of the SEC and NASDAQ, and a copy of such charter will be posted on our website concurrently with, or prior to, the completion of this offering.
Compensation Committee. Following the consummation of this offering, this committee will establish salaries, incentives and other forms of compensation for officers and other employees. Our compensation committee will also administer our incentive compensation and benefit plans following the consummation of this offering. Prior to the consummation of this offering, we will adopt a written compensation committee charter defining the committee's purpose and primary duties in a manner consistent with the rules of the SEC and NASDAQ, and a copy of such charter will be posted on our website concurrently with, or prior to, the completion of this offering.
Nominating and Corporate Governance Committee. This committee will identify, evaluate and recommend qualified nominees to serve on our board of directors, develop and oversee our internal corporate governance processes and maintain a management succession plan. Prior to the consummation of this offering, we will adopt a nominating and corporate governance committee charter defining the committee's purpose and primary duties in a manner consistent with the rules of the SEC and NASDAQ, and a copy of such charter will be posted on our website concurrently with, or prior to, the completion of this offering.
Compensation Committee Interlocks and Insider Participation
No member of our compensation committee has been at any time an employee of ours. None of our executive officers serve, or during the past fiscal year has served, on the board of directors or
116
compensation committee of a company that has one or more executive officers who serve on our board of directors or compensation committee. No member of our board of directors is an executive officer of a company in which one or more of our executive officers serves as a member of the board of directors or compensation committee of that company.
To the extent any members of our compensation committee and affiliates of theirs have participated in transactions with us, a description of those transactions is described in "Certain Relationships and Related Party Transactions."
Code of Business Conduct and Ethics
Our board of directors will adopt a code of business conduct and ethics applicable to our employees, directors and officers, in accordance with applicable U.S. federal securities laws and the corporate governance rules of NASDAQ. Any waiver of this code may be made only by our board of directors and will be promptly disclosed as required by applicable U.S. federal securities laws and the corporate governance rules of NASDAQ.
117
EXECUTIVE COMPENSATION AND OTHER INFORMATION
The following compensation discussion and analysis contains statements regarding our future performance goals and measures. These goals and measures are disclosed in the limited context of our executive compensation program and are not statements of management's expectations or estimates of results or other guidance. We specifically caution investors not to apply these statements to other contexts. Throughout this prospectus, the individuals who serve as our principal executive officer, or CEO, and our principal financial officer, or CFO, as well as the other four most highly compensated individuals included in the Summary Compensation Table in this prospectus, are referred to as our "named executive officers."
Overview and Objectives
We believe our success depends on the continued contributions of our named executive officers. As a private company, we have established our executive compensation program to attract, motivate and retain our key employees in order to enable us to maximize our profitability and value over the long term. Our policies are also intended to support the achievement of our strategic objectives by aligning the interests of our executive officers with those of our stockholders through operational and financial performance goals and equity-based compensation. Following this offering, we expect that the compensation committee of our board of directors may recommend changes to our executive compensation program. Nonetheless, we expect that our compensation program will continue to be focused on building long-term stockholder value by attracting, motivating and retaining talented, experienced executives and other key employees.
Compensation Discussion and Analysis
This compensation discussion and analysis provides a historical description and explanation of our compensation program. Throughout this discussion, the following individuals are referred to as the "named executive officers" and are included in the Summary Compensation Table:
- •
- Jon L. Glass, Chairman of the Board, President and Chief Executive Officer;
- •
- Wayne B. Stoltenberg, Chief Financial Officer and Senior Vice President;
- •
- Edward P. Travis, Chief Operating Officer and Senior Vice President;
- •
- Leigh T. Prieto, Chief Accounting Officer and Vice President;
- •
- Craig D. Pollard, Vice President, Exploration; and
- •
- Chris M. Kidd, Vice President, Land.
Although we are only required to disclose compensation information for our CEO, CFO and three most highly compensated individuals other than our CEO and CFO, we consider each of our named executive officers to be an integral part of our management team, and, therefore, we have voluntarily disclosed compensation information for each of them.
Elements of Compensation
Historically, we have compensated our named executive officers with annual base salaries, annual cash incentive bonuses, long-term equity incentives in the form of restricted stock awards, stock options and employee benefits. Following the consummation of this offering, we expect that these elements will continue to constitute the primary elements of our compensation program, although the relative proportions of each element, and the specific plan and award designs, will likely evolve as we become a more established public company.
Annual Base Salaries. Base salary is the fixed annual compensation we pay to each of our named executive officers for carrying out their specific job responsibilities. Base salaries are a major
118
component of the total annual cash compensation paid to our named executive officers. Base salaries are determined after taking into account many factors, including the following:
- •
- the responsibilities of the officer, the level of experience and expertise required for the position and the strategic
impact of the position;
- •
- the need to recognize each officer's unique value and demonstrated individual contribution, as well as future
contributions;
- •
- the performance of the company and each officer; and
- •
- salaries paid for comparable positions in similarly-situated companies.
For the amounts of base salary that our named executive officers received in 2011, see "—Summary Compensation Table."
Annual Cash Incentive Bonuses. Each year since we began operations, our board of directors has had discretion to award cash bonuses. In exercising its discretion, our board considered company and individual achievement of performance goals in setting award levels. Annual cash bonuses for 2011 were paid to each named executive officer and were awarded on a subjective evaluation of the executive's performance. For the amounts of bonuses that our named executive officers received in 2011, see "—Summary Compensation Table." Our board of directors also has approved special bonuses for Messrs. Stoltenberg and Prieto, to be paid within 10 days after the effectiveness of the registration statement of which this prospectus forms a part. Mr. Stoltenberg will receive a $40,000 bonus, and Mr. Prieto will receive a $30,000 bonus, provided that each officer is employed by us at the time the bonus is paid. These special bonus payments reflect the increased demand and additional responsibilities imposed on Messrs. Stoltenberg and Prieto as a result of our becoming a public company.
Our board of directors has approved our 2012 Annual Incentive Compensation Plan, or our Bonus Plan, to be effective immediately prior to the effectiveness of the registration statement of which this prospectus forms a part. See "—2012 Annual Incentive Compensation Plan" for a description of our Bonus Plan.
Equity-Based Incentive Awards. We have historically used grants of restricted stock pursuant to the terms of our 2008 Long Term Incentive Plan, or our 2008 Plan, as the primary vehicle for linking our long-term performance and increases in stockholder value to the total compensation for our executive officers and providing competitive compensation to attract and retain our executive officers. In connection with our acquisition of Cima, we amended and restated our 2008 Plan and renamed it our 2011 Stock Incentive Plan, or our 2011 Plan. See "—2011 Long Term Incentive Plan" for a description of our 2011 Plan. For the restricted stock grants that our named executive officers received in 2011, see "—Summary Compensation Table." Our board of directors has approved our 2012 Long Term Incentive Plan, or our 2012 Plan, to be effective immediately prior to the effectiveness of the registration statement of which this prospectus forms a part. See "—2012 Long Term Incentive Plan" for a description of our 2012 Plan.
In December 2011, our board of directors approved the grant of restricted stock awards under our 2011 Plan to our named executive officers. The effective date of grant of these awards was January 1, 2012. The awards are subject to forfeiture restrictions and vest after three years. These restricted stock awards were granted as follows: Mr. Glass—27,925 shares; Mr. Stoltenberg—7,445 shares; Mr. Travis—7,445 shares; Mr. Prieto—3,299 shares; Mr. Pollard—2,239 shares; and Mr. Kidd—5,066 shares. As a related matter, our board of directors also approved the grant of additional restricted stock and nonqualified stock option awards under our 2011 Plan to our named executive officers. The date of grant of these awards will be on the closing of this offering, provided that the grantee is still employed by us on that date. If this offering does not close on or before December 31, 2012, the awards will
119
become null and void. These awards reflect the increased demand and additional responsibilities imposed on our executive officers as a result of our becoming a public company and our objectives of maintaining our current management team intact and promoting a certain level of stock holdings by our executive officers. The restricted stock awards are subject to forfeiture restrictions and vest after three years. The restricted stock awards were granted as follows: Mr. Glass—27,925 shares; Mr. Stoltenberg—7,445 shares; Mr. Travis—7,445 shares; Mr. Prieto—3,299 shares; Mr. Pollard—2,239 shares; and Mr. Kidd—5,066 shares. The nonqualified stock option awards are fully vested and exercisable on the date of grant and are subject to a 10-year term. The exercise price of these awards is equal to the initial public offering price per share of our common stock in this offering. The nonqualified stock option awards were granted as follows: Mr. Glass—option to purchase 27,925 shares; Mr. Stoltenberg—option to purchase 7,445 shares; Mr. Travis—option to purchase 7,445 shares; Mr. Prieto—option to purchase 3,299 shares; Mr. Pollard—option to purchase 2,239 shares; and Mr. Kidd—option to purchase 5,066 shares.
Employee Benefits. We have historically provided health, life and other employee benefits to our named executive officers on the same basis as our other full-time employees generally, including medical and dental insurance, short and long-term disability insurance and a 401(k) plan that includes company matching of 5% of each individual's compensation contributed to the plan. We do not sponsor any defined benefit pension plan or nonqualified deferred compensation arrangements. We also will provide each of our named executive officers with supplemental life insurance policies that pay the officer's beneficiary a death benefit equal to a multiple of the officer's annual base salary in the event of his death. We expect to determine the multiple by January 31, 2012.
Compensation Process
The elements of compensation described above under "—Elements of Compensation" and the amounts of compensation for 2011 described below under "—Summary Compensation Table" were established by our board of directors. Following the consummation of this offering, the compensation of our named executive officers will be determined by the compensation committee of our board of directors in consultation with our Chief Executive Officer as to executives other than himself. See "Management—Committees of the Board of Directors—Compensation Committee."
120
Summary Compensation Table
The following table summarizes the total compensation awarded to, earned by or paid to Messrs. Glass, Stoltenberg, Travis, Prieto, Pollard and Kidd. This table and the accompanying narrative should be read in conjunction with the Compensation Discussion and Analysis, which sets forth the objectives and other information regarding our executive compensation program.
Name and Principal Position
|
Year | Salary ($) | Bonus ($) | Restricted Stock Awards ($) |
All Other Compensation ($)(1) |
Total ($) | |||||||||||||
|---|---|---|---|---|---|---|---|---|---|---|---|---|---|---|---|---|---|---|---|
Jon L. Glass |
2011 | $ | 365,654 | $ | 266,039 | $ | 1,631,743 | $ | 12,250 | $ | 2,275,686 | ||||||||
Chairman of the Board, |
2010 | 321,500 | 155,000 | 3,986,447 | 12,250 | 4,475,197 | |||||||||||||
President and Chief |
2009 | 220,000 | 191,021 | 3,121,012 | 18,188 | 3,550,221 | |||||||||||||
Executive Officer |
|||||||||||||||||||
Wayne B. Stoltenberg |
2011 |
$ |
252,615 |
$ |
189,357 |
$ |
662,093 |
$ |
5,723 |
$ |
1,109,788 |
||||||||
Chief Financial Officer and |
2010 | 221,292 | 108,000 | 1,517,361 | 5,649 | 1,852,302 | |||||||||||||
Senior Vice President |
2009 | 212,000 | 20,000 | 1,483,032 | 9,025 | 1,724,057 | |||||||||||||
Edward P. Travis |
2011 |
$ |
258,885 |
$ |
197,922 |
$ |
713,155 |
$ |
15,082 |
$ |
1,185,044 |
||||||||
Chief Operating Officer and |
2010 | 225,119 | 110,000 | 1,518,496 | 9,688 | 1,863,303 | |||||||||||||
Senior Vice President |
2009 | 220,000 | 89,300 | 998,251 | 12,017 | 1,319,568 | |||||||||||||
Leigh T. Prieto |
2011 |
$ |
227,108 |
$ |
176,048 |
$ |
475,760 |
$ |
10,695 |
$ |
889,611 |
||||||||
Chief Accounting Officer and |
2010 | 215,042 | 90,000 | 1,033,223 | 10,792 | 1,349,057 | |||||||||||||
Vice President |
2009 | 213,400 | 100,220 | 1,115,110 | 13,544 | 1,442,274 | |||||||||||||
Craig D. Pollard |
2011 |
$ |
232,617 |
$ |
153,707 |
$ |
523,839 |
$ |
7,605 |
$ |
917,768 |
||||||||
Vice President, Exploration |
2010 | 208,217 | 75,000 | 1,118,362 | 8,384 | 1,409,963 | |||||||||||||
|
2009 | 211,470 | 131,983 | 857,403 | 11,777 | 1,212,633 | |||||||||||||
Chris M. Kidd |
2011 |
$ |
223,001 |
$ |
173,252 |
$ |
375,000 |
$ |
11,150 |
$ |
782,403 |
||||||||
Vice President, Land |
2010 | 211,613 | 70,000 | 851,143 | 10,626 | 1,143,382 | |||||||||||||
|
2009 | 206,700 | 43,874 | 857,403 | 12,569 | 1,120,546 | |||||||||||||
- (1)
- All other compensation reported for Mr. Glass represents $12,250, $12,250 and $12,250 in matching contributions by us under our 401(k) plan in 2011, 2010 and 2009, respectively, and $5,938 paid for estate planning services in 2009. All other compensation reported for Mr. Stoltenberg represents $5,723, $5,649 and $5,700 in matching contributions by us under our 401(k) plan in 2011, 2010 and 2009, respectively, and $3,325 paid for estate planning services in 2009. All other compensation reported for Mr. Travis represents $11,906, $9,324 and $9,167 in matching contributions by us under our 401(k) plan in 2011, 2010 and 2009, respectively, and $3,177, $364 and $2,850 paid for estate planning services in 2011, 2010 and 2009, respectively. All other compensation reported for Mr. Prieto represents $10,695, $10,792, and $10,884 in matching contributions by us under our 401(k) plan in 2011, 2010 and 2009, respectively, and $2,660 paid for estate planning services in 2009. All other compensation reported for Mr. Pollard represents $7,605, $7,601 and $7,549 in matching contributions by us under our 401(k) plan in 2011, 2010 and 2009, respectively, and $783 and $4,228 paid for estate planning services in 2010 and 2009, respectively. All other compensation reported for Mr. Kidd represents $11,150, $10,626 and $10,527 in matching contributions by us under our 401(k) plan in 2011, 2010 and 2009, respectively, and $2,043 paid for estate planning services in 2009.
121
Grants of Plan-Based Awards
The following table provides information concerning each grant of plan-based awards made to our named executive officers during the fiscal year ended December 31, 2011 under our 2011 Plan.
Name
|
Grant Date | All Other Stock Awards; Number of Shares of Stock (#) |
Grant Date Fair Value of Stock ($) |
|||||||
|---|---|---|---|---|---|---|---|---|---|---|
Jon L. Glass |
5/4/2011 | 13,438 | $ | 1,343,800 | ||||||
|
6/30/2011 | 3,406 | 287,943 | |||||||
Wayne B. Stoltenberg |
5/4/2011 |
5,937 |
593,700 |
|||||||
|
6/30/2011 | 809 | 68,393 | |||||||
Edward P. Travis |
5/4/2011 |
5,937 |
593,700 |
|||||||
|
6/30/2011 | 1,413 | 119,455 | |||||||
Leigh T. Prieto |
5/4/2011 |
3,875 |
387,500 |
|||||||
|
6/30/2011 | 1,044 | 88,260 | |||||||
Craig D. Pollard |
5/4/2011 |
4,125 |
412,500 |
|||||||
|
6/30/2011 | 1,317 | 111,339 | |||||||
Chris M. Kidd |
5/4/2011 |
3,750 |
375,000 |
|||||||
Outstanding Equity Awards at December 31, 2011
The following table sets forth certain information with respect to the outstanding stock awards held by the named executive officers that were not vested at December 31, 2011.
| |
Stock Awards | ||||||
|---|---|---|---|---|---|---|---|
Name
|
Number of shares of stock that have not vested (#) |
Market value of shares of stock that have not vested ($) |
|||||
Jon L. Glass |
89,182 | $ | |||||
Wayne B. Stoltenberg |
36,856 | ||||||
Edward P. Travis |
34,335 | ||||||
Leigh T. Prieto |
26,595 | ||||||
Craig D. Pollard |
25,275 | ||||||
Chris M. Kidd |
22,098 | ||||||
Stock Vested During 2011
The following table sets forth certain information with respect to the outstanding stock awards held by the named executive officers that vested during fiscal year 2011.
| |
Stock Awards | ||||||
|---|---|---|---|---|---|---|---|
Name
|
Number of shares acquired on vesting (#) |
Value realized on vesting ($) |
|||||
Jon L. Glass |
9,906 | $ | 853,778 | ||||
Wayne B. Stoltenberg |
2,425 | 210,562 | |||||
Edward P. Travis |
4,114 | 355,426 | |||||
Leigh T. Prieto |
2,969 | 251,805 | |||||
Craig D. Pollard |
3,962 | 344,425 | |||||
Chris M. Kidd |
2,998 | 258,828 | |||||
122
Pension Benefits
We have not maintained and do not currently maintain a defined benefit pension plan or a supplemental executive retirement plan.
Non-Qualified Defined Contribution and Other Non-Qualified Deferred Compensation Plans
We have not had and do not currently have any defined contribution or other plan that provides for the deferral of compensation on a basis that is not tax-qualified.
Potential Payments Upon Termination or Change of Control
The table and narrative below quantify and describe the payments and benefits due to each of our named executive officers in the event of a qualifying termination of employment and/or in the event we undergo a change of control. As discussed below under "—Employment Agreements," immediately prior to the effectiveness of the registration statement of which this prospectus forms a part, we will enter into employment agreements with Jon L. Glass, Wayne B. Stoltenberg and Edward P. Travis. As discussed below under "—Change of Control and Severance Benefit Plan," our board of directors has adopted our Change of Control and Severance Benefit Plan, or our Severance Plan, to be effective immediately prior to the effectiveness of the registration statement of which this prospectus forms a part, to provide severance and change of control benefits to our named executive officers who do not have employment agreements and certain other participants. We have determined that, rather than disclosing the payments and benefits to which each named executive officer actually would have been entitled to on December 31, 2011 before his employment agreement and our Severance Plan were effective, our potential investors would find it more meaningful if we disclosed the payments and benefits to which each named executive officer would have been entitled had his new employment agreement and our Severance Plan been in effect on December 31, 2011. A summary of the termination and change of control provisions of our named executive officers' employment agreements and our Severance Plan appears immediately following this table. We believe that providing enhanced payments and benefits in connection with certain termination events and upon the occurrence of a change of control is essential to our ability to recruit and retain high level professionals to serve as our executive officers, given the heightened concern for financial stability by many professionals in the energy sector due to the industry's history of terminating professionals during cyclical downturns and increasing consolidation in the energy sector.
The amounts disclosed in the table below assume that the termination event and/or the occurrence of the change of control occurred on December 31, 2011. We have also assumed that each named executive officer was employed from January 1, 2011 through December 31, 2011. The actual amounts to be paid are dependent on various factors, which may or may not exist at the time a named executive officer is actually terminated or a change of control actually occurs.
Named Executive Officer
|
Termination without Cause or Good Reason |
Change of Control Only |
Change of Control and Termination without Cause or Good Reason |
Incapacity | Death | |||||||||||
|---|---|---|---|---|---|---|---|---|---|---|---|---|---|---|---|---|
Jon L. Glass |
$ | $ | $ | $ | $ | |||||||||||
Wayne B. Stoltenberg |
||||||||||||||||
Edward P. Travis |
||||||||||||||||
Leigh T. Prieto |
||||||||||||||||
Craig D. Pollard |
||||||||||||||||
Chris M. Kidd |
||||||||||||||||
123
Employment Agreements
Immediately prior to the effectiveness of the registration statement of which this prospectus forms a part, we will enter into employment agreements with Jon L. Glass, Wayne B. Stoltenberg and Edward P. Travis. The following is a summary of the material terms of these employment agreements.
The employment agreement with Mr. Glass provides for an initial term of three years, and the employment agreements with Messrs. Stoltenberg and Travis provide for initial terms of two years. These employment agreements will be automatically renewed for successive one-year periods unless either party gives written notice of non-renewal to the other party at least 90 days before the last day of the then-current term. The employment agreements provide that Messrs. Glass, Stoltenberg, and Travis will receive annual base salaries of $410,000, $285,000, and $285,000, respectively, which may be reviewed and/or adjusted by our compensation committee, in its discretion. The employment agreements also provide that these named executive officers are eligible to participate in our Bonus Plan. Any bonus payable under our Bonus Plan may be based upon the achievement of certain performance goals and objectives during the applicable fiscal year (or other performance period) as determined by our compensation committee in its sole discretion. See "—Compensation Discussion and Analysis—Elements of Compensation—Annual Cash Incentive Bonuses." In addition, the employment agreements provide our named executive officers with five weeks of paid time off. These named executive officers may participate in our employee benefit arrangements offered to similarly situated executives and are entitled to reimbursement of reasonable business expenses. The employment agreements also provide that we will pay for membership with the Petroleum Club of Dallas. Additionally, we will provide each of our named executive officers with supplemental life insurance policies that pay the officer's beneficiary a death benefit equal to a multiple of the officer's annual base salary in the event of his death. We expect to determine the multiple by January 31, 2012.
The employment agreements provide for severance and change in control benefits, or CIC benefits, to be paid to our named executive officers under certain circumstances. The severance benefits are provided to reflect the fact that it may be difficult for executive officers to find comparable employment within a short period of time if they are involuntarily terminated. Change in control benefits are provided in order that the officers may objectively assess and pursue aggressively our interests and the interests of our stockholders with respect to a contemplated change in control, free from personal, financial and employment considerations.
Under the employment agreements, within 30 business days after any termination of employment or earlier if required by law, these named executive officers will be entitled to receive accrued but unpaid salary and reimbursement of eligible expenses. The officers also will be entitled to any unpaid bonus awarded under our Bonus Plan in the fiscal year (or other performance period) prior to the year in which the officer terminates employment. Any bonus will be paid in the manner and at the time provided for in our Bonus Plan, provided that such payment will be made no later than the 15th day of the third calendar month following the fiscal year (or other bonus performance period) with respect to which the bonus relates.
In addition, if we terminate the employment of one of our named executive officers without "cause" or if the officer terminates employment with "good reason," then the named executive officer will be entitled to receive a severance payment and severance benefits continuation. The severance payment will equal a multiple of the officer's annual base salary and target bonus. The multiple applicable to Mr. Glass is two, and the multiple applicable to Messrs. Stoltenberg and Travis is 1.5. The named executive officer also will be entitled to receive severance benefits continuation in the form of the reimbursement of up to 18 months of Consolidated Omnibus Budget Reconciliation Act, or COBRA, premiums, if the officer timely elects and remains eligible for COBRA. If an officer is terminated by reason of our non-extension of his employment term, his severance pay will be limited to 100% of his annual base salary, and he will not be entitled to severance benefits continuation.
124
Severance payments and severance benefits continuations are subject to the officer's delivery to us (and nonrevocation) of a release of claims in a form acceptable to us within 60 days after termination and the officer's continued compliance with certain post-employment obligations relating to confidentiality, non-competition and non-solicitation.
The severance payment described in the preceding paragraph will generally be paid to the officer in monthly installments (each of which may be made in our discretion over one or more of our payroll dates in such month) for up to 20 months as specified in the applicable agreement. However, if the severance payment is more than two multiplied by the officer's annualized compensation for the calendar year before termination or, if less, the maximum amount that may be taken into account under Section 401(a)(17) of the Internal Revenue Code, or the Code ($245,000 for 2011; $250,000 for 2012), for the year in which the officer terminates, then any excess over this amount will be paid in a single lump sum no later than 60 days after termination.
If a named executive officer is terminated by us without "cause," if we elect not to renew the named executive officer's employment agreement, or if the officer terminates employment with "good reason," in each case, within a 12-month period following the date of a change in control, then the officer will be entitled to receive change in control pay, or CIC pay, and CIC benefits continuation in lieu of the severance payment and severance benefits continuation described above. The CIC pay will consist of a multiple of the officer's annual base salary, plus a multiple of the officer's target bonus. The multiple applicable to Mr. Glass is 2.5, and the multiple applicable to Messrs. Stoltenberg and Travis is two. The named executive officer also will be entitled to receive CIC benefits continuation in the form of reimbursement of up to 18 months of COBRA premiums, if the officer timely elects and is eligible to receive COBRA. CIC pay and CIC benefits continuations are subject to the officer's delivery to us (and nonrevocation) of a release of claims within 60 days after termination and the officer's continued compliance with certain post-employment obligations relating to confidentiality, non-competition and non-solicitation.
The CIC pay described in the preceding paragraph will be paid in a lump sum cash payment to the officer on our first payroll date after the officer's release of claims becomes effective but no later than 60 days after the date the officer is terminated.
If a named executive officer is terminated by us without "cause," if we elect not to renew the employment agreement, or if the officer terminates employment with "good reason," and a change in control occurs within 180 days following the officer's termination, then, in lieu of any remaining severance payments and severance benefits continuations that otherwise would be payable to the officer, the officer will receive an amount equal to the CIC pay reduced by any severance payments previously made to the officer and CIC benefits continuation reduced by the number of months previously reimbursed as severance benefits continuation. CIC pay and CIC benefits continuations are subject to the officer's delivery to us (and nonrevocation) of a release of claims within 60 days after termination and the officer's continued compliance with certain post-employment obligations relating to confidentiality, non-competition and non-solicitation.
The CIC pay described in the preceding paragraph will be paid in a lump sum cash payment to the officer on the later of the effective date of the change in control or our first payroll date after the officer's release of claims becomes effective but no later than 60 days after the effective date of the change in control.
The employment agreements with our named executive officers provide that if the benefits to which the officers become entitled in connection with a change in control are subject to the excise tax imposed by Section 4999 of the Code, the payments and benefits provided under the employment agreements may be reduced to avoid the excise tax, if doing so would result in a better net after-tax result for the officer. No excise tax "gross-up" payments are provided.
125
Our named executive officers will be subject to certain confidentiality, non-compete and non-solicitation provisions contained in the employment agreements. The confidentiality covenants will be perpetual, while the non-compete and non-solicitation covenants will apply during the term of the employment agreements and for a period of 12 months following the officer's termination date.
Certain terms used in the employment agreements with our named executive officers are defined below under "—Change of Control and Severance Benefit Plan."
Change of Control and Severance Benefit Plan
In December 2011, our board of directors adopted our Severance Plan, to be effective immediately prior to the effectiveness of the registration statement of which this prospectus forms a part. This plan is intended to provide certain severance and change of control benefits to our named executive officers who do not have employment agreements and certain other participants.
The employees eligible to participate in our Severance Plan will be those determined by our board of directors and listed in the plan, provided that no employee who is entitled to severance or CIC benefits under a separate agreement will be eligible to participate. Messrs. Prieto, Pollard and Kidd will be eligible to participate in our Severance Plan. However, no employee will be eligible unless he executes a separate agreement to comply with restrictive covenants regarding confidentiality, non-competition, non-solicitation and inventions.
Under our Severance Plan, within 30 business days after any participant's termination of employment or earlier if required by law, the participant will be entitled to receive accrued but unpaid salary and reimbursement of eligible expenses. Participants also will be entitled to any unpaid bonus awarded under our Bonus Plan in the calendar year prior to the year in which the participant terminates employment.
In addition, if we terminate the employment of a participant without "cause" or if the participant terminates employment with "good reason," then the participant will be entitled to receive a severance payment and severance benefits continuation. The severance payment will equal a multiple of the participant's annual base salary and target bonus. The multiple applicable Messrs. Prieto, Pollard and Kidd is one. The participant also will be entitled to receive severance benefits continuation in the form of the reimbursement of up to 12 months of COBRA premiums, if the participant timely elects and remains eligible for COBRA. Severance payments and severance benefits continuations are subject to the participant's delivery to us (and nonrevocation) of a release of claims within 60 days after termination and the participant's continued compliance with certain post-employment obligations relating to confidentiality, non-competition and non-solicitation.
The severance payment described in the preceding paragraph will generally be paid to the participant in monthly installments (each of which may be made in our discretion over one or more of our payroll dates in such month) over a period of months applicable to the participant and set forth in our Severance Plan. However, if the severance payment is more than two multiplied by the participant's annualized compensation for the calendar year before termination or, if less, the maximum amount that may be taken into account under Section 401(a)(17) of the Code ($245,000 for 2011; $250,000 for 2012) for the year in which the participant terminates, then any excess over this amount will be paid in a single lump sum no later than 60 days after termination.
If a participant is terminated by us without "cause" or if the participant terminates employment with "good reason," in each case, within a 12-month period following the date of a change of control, then the participant will be entitled to receive CIC pay and CIC benefits continuation in lieu of the severance payment and severance benefits continuation described above. The CIC pay will consist of a multiple of the participant's annual base salary and target bonus. The multiple applicable to Messrs. Prieto, Pollard and Kidd is 1.5. The participant will also be entitled to receive CIC benefits
126
continuation in the form of the reimbursement of up to 18 months of COBRA premiums, if the participant timely elects and remains eligible for COBRA. CIC pay and CIC benefits continuations are subject to the participant's delivery to us (and nonrevocation) of a release of claims within 60 days after termination and the participant's continued compliance with certain post-employment obligations relating to confidentiality, non-competition and non-solicitation.
The CIC pay described in the preceding paragraph will be paid in a lump sum cash payment to the participant on our first payroll date after the participant's release of claims becomes effective but no later than 60 days after the participant is terminated.
If a participant is terminated by us without "cause" or if the participant terminates employment with "good reason," and a change of control occurs within 180 days following the participant's termination, then, in lieu of any remaining severance payments and severance benefits continuations that otherwise would be payable to the participant, the participant will receive an amount equal to the CIC pay reduced by any severance payments previously made to the participant and CIC benefits continuation reduced by the number of months previously reimbursed as severance benefits continuation. CIC pay and CIC benefits continuations are subject to the participant's delivery to us (and nonrevocation) of a release of claims within 60 days after termination and the participant's continued compliance with certain post-employment obligations relating to confidentiality, non-competition and non-solicitation.
The CIC pay described in the preceding paragraph will be paid in a lump sum cash payment to the participant on the later of the effective date of the change of control or our first payroll date after the participant's release of claims becomes effective, but not later than 60 days after the effective date of the change of control.
Our Severance Plan provides that if the benefits to which the participants become entitled in connection with a change of control are subject to the excise tax imposed by Section 4999 of the Code, the payments and benefits provided under our Severance Plan may be reduced to avoid the excise tax, if doing so would result in a better net after-tax result for the participant. No excise tax "gross-up" payments are provided.
Participants in our Severance Plan will be subject to certain confidentiality, non-compete and non-solicitation provisions. The confidentiality covenants will be perpetual, while the non-compete and non-solicitation covenants will apply during the participant's employment and for a period of 12 months following the participant's termination date.
For purposes of the employment agreements and our Severance Plan, the terms listed below are defined as follows:
(i) "cause" means a finding by our board of directors (or the person or committee designated by our board of directors to administer our Severance Plan) of acts or omissions of the officer constituting, in the good faith judgment of our board of directors (or of the administrator of our Severance Plan), any of the following: (a) gross negligence or material misconduct in the performance of his duties and responsibilities; (b) the material failure to comply with the lawful directives of our board of directors (or, under our Severance Plan, the lawful directives of our senior officers or the participant's supervisor); (c) the material failure to devote the individual's full working time, skill, attention and best efforts to, or to substantially and diligently perform, his duties and responsibilities (other than in connection with an approved leave of absence); (d) conduct that is contrary to the best interests of us or any of our affiliates or is likely to damage the business of us or any of our affiliates, including without limitation their reputation; (e) a breach of duty (other than inadvertent acts or omissions) involving fraud, dishonesty, disloyalty, or a conflict of interest; (f) the material violation of, failure to report, or material failure to enforce the personnel, ethical or operational policies and procedures of us or any of our affiliates; (g) the
127
failure to cooperate with any investigation or inquiry authorized by us or any of our affiliates or conducted by a governmental authority related to our or any of our affiliates' business or the officer's conduct; (h) the officer's conviction of, or entry of a plea agreement or consent decree or similar arrangement with respect to, any felony or other serious criminal offense or crime of moral turpitude or any violation of federal or state securities laws; or (i) a material violation of any provision of an employment agreement or any non-solicitation, non-competition, non-disclosure, intellectual property or other agreement (or similar agreement) with us or any of our affiliates.
(ii) "change in control" or "change of control" means (a) any consolidation or merger of Cinco Resources, Inc. in which Cinco Resources, Inc. is not the continuing or surviving corporation or pursuant to which shares of our common stock would be converted into cash, securities or other property, other than a merger of Cinco Resources, Inc. in which the holders of our common stock immediately prior to the merger have the same proportionate ownership of common stock of the surviving corporation immediately after the merger, (b) any sale, lease, exchange, or other transfer of all or substantially all of the assets of Cinco Resources, Inc. and its subsidiaries to any other person or entity (other than one of our affiliates), (c) our stockholders' approval of any plan or proposal for liquidation or dissolution of Cinco Resources, Inc., (d) any person or entity (other than Yorktown or any of its affiliated funds) acquires or gains 50% or more of our total voting power, or (e) as a result of or in connection with a contested election of our directors, the individuals who serve as board members before such election cease to constitute a majority of our board of directors. Notwithstanding the foregoing, a "change in control" or "change of control" does not include (y) the initial public offering of our common stock or a merger of Cinco Resources, Inc. or any other affiliate of Yorktown or (z) any capital raising transaction that is approved by two or more members of our board of directors who meet the independence requirements of the principal exchange or quotation system upon which our shares of common stock are listed or quoted or, if no members of our board of directors meet such independence requirements, that is approved by our board of directors.
(iii) "good reason" means any of the following actions taken without the officer's consent: (a) a material reduction in base salary, (b) a material reduction in the officer's authority, duties or responsibilities, (c) a permanent relocation of the officer's principal place of employment to any location outside of a 100 mile radius of the location from which the officer served us immediately prior to the relocation or (d) a material breach by us of the employment agreement. The officer must notify us within 60 days of the occurrence of any such event, and we have 30 days following notice to cure.
2012 Annual Incentive Compensation Plan
In December 2011, our board of directors adopted our Bonus Plan, to be effective immediately prior to the effectiveness of the registration statement of which this prospectus forms a part. The purpose of our Bonus Plan is to create incentives and rewards that are designed to motivate participating employees to put forth maximum effort toward our success and growth and to enable us to attract and retain experienced individuals who by their position, ability and diligence are able to make important contributions to our success. Our Bonus Plan provides for variable cash compensation earned when established performance objectives are achieved.
Our compensation committee will determine which of our employees will receive awards under our Bonus Plan and will proscribe and interpret the terms and provisions of each award. Each award will set forth the performance goals with respect to each selected performance measure and such other terms and conditions as our compensation committee may determine. Our compensation committee may adjust the performance goals established for a particular performance period to account for certain extraordinary events. After the end of the performance period, our compensation committee will determine the extent to which the applicable performance goals have been satisfied and the amount, if
128
any, payable to each award recipient. The compensation committee has discretion to increase, decrease or eliminate an award based on its assessment of the award recipient's individual performance, subject to the exceptions for awards intended to qualify as performance-based compensation as described below. Our compensation committee will have discretion to determine whether an award recipient whose employment terminates for reasons other than cause will receive payment pursuant to an award, provided that the compensation committee may not take action that would cause an award intended to qualify as "qualified performance-based compensation" under Section 162(m) to not so qualify. Award recipients who are terminated for cause will not be eligible to receive an award payment. An award recipient who terminates by reason of death or disability will be entitled to a prorated portion of the amount he or she would have received had his or her employment not terminated.
For a limited period of time following this offering, the Bonus Plan will qualify for an exception to the deductibility limitations imposed by Section 162(m) of the Code. Section 162(m) imposes a limit of $1,000,000 on the amount that we may deduct for compensation paid to each of our CEO and certain other named executive officers each year. However, if specified conditions are met, some compensation may be excluded from counting against this limit. Compensation that is excluded from the limit includes compensation that meets the requirements under Section 162(m) for "qualified performance-based compensation." Our Bonus Plan is designed to allow for awards that constitute "qualified performance-based compensation" and are deductible for federal income tax purposes although our compensation committee may determine to issue awards that do not meet the requirements for deductibility. Initially, we will rely on a transition exemption from Section 162(m) for the Bonus Plan that applies to compensation plans adopted prior to an initial public offering. The transition exemption for the plan will terminate at the time of our annual meeting that occurs after the third calendar year following the year of our initial public offering.
If our compensation committee determines that an award granted to an employee who is likely to be a covered employee under Section 162(m) of the Code should qualify as performance-based compensation for purposes of Section 162(m) of the Code, the award will be subject to additional terms under our Bonus Plan. Our compensation committee may establish performance goals based on one or more of the business criteria specified in our Bonus Plan. Awards may contain performance measures based on one or more of the following criteria: (a) earnings (either aggregate or per share), (b) net income, (c) operating income, (d) operating profit, (e) cash flow from operations or free cash flow, (f) stockholder returns and other return measures (including, without limitation, return on assets, investment, invested capital and equity), (g) earnings before or after either, or any combination of, interest, taxes, depreciation or amortization and exploration costs, (h) gross revenues, (i) share price (including growth measures and total stockholder return or attainment by the shares of a specified value for a specified period of time), (j) reduction in expense levels determined on a company-wide basis or in respect of one or more operating units, (k) economic value, (l) annual net income to our common stock, (m) changes in annual revenues, (n) strategic business criteria consisting of one or more objectives based on meeting specified revenues, objectively defined project milestones, production volumes, cost targets and goals related to acquisitions and divestitures, or (o) operational performance measures including drilling costs, changes in proven reserves, lifting costs, exploration costs, environmental compliance and accident rates.
These criteria may be applied to us on a consolidated basis and/or for our specified subsidiaries or business or geographical units (except with respect to the total stockholder return and earnings per share criteria). Payment of awards for covered employees may also be contingent upon individual performance goals. Performance goals applicable to awards for covered employees generally must be established not later than 90 days after the beginning of the applicable calendar year performance period.
After the end of the applicable performance period, the compensation committee will determine the amount payable to a covered employee. The amount may be reduced or adjusted to reflect certain
129
events or occurrences, but the compensation committee may not exercise discretion to increase any such amount if the award is intended to qualify as performance-based compensation under Section 162(m) of the Code. The maximum amount that may be paid in cash pursuant to an award granted to a covered employee with respect to our fiscal year that is intended to qualify as performance-based compensation under Section 162(m) of the Code is $1,500,000.
2011 Long Term Incentive Plan
We have historically used grants of restricted stock pursuant to the terms of our 2008 Plan as the primary vehicle for linking our long-term performance and increases in stockholder value to the total compensation for our executive officers and providing competitive compensation to attract and retain our executive officers. For the restricted stock grants that our named executive officers received in 2011, see "—Summary Compensation Table."
In connection with our acquisition of Cima, the Cima 2010 Stock Incentive Plan, or the Cima 2010 Plan, was merged with and into our 2008 Plan and each share of Cima common stock covered by a restricted stock award originally granted under the Cima 2010 Plan was converted into a restricted stock award under our 2008 Plan. We adopted our 2011 Plan as an amendment and restatement of our 2008 Plan and the Cima 2010 Plan.
The purpose of our 2011 Plan is to attract and retain the best personnel for positions of substantial responsibility, to provide additional incentives to our employees, directors and consultants, and to promote the success of our business. Our 2011 Plan provides for grants of (a) incentive stock options qualified as such under U.S. federal income tax laws, (b) stock options that do not qualify as incentive stock options, (c) stock appreciation rights, or SARs, (d) restricted stock awards, (e) restricted stock units, (f) performance awards or (g) other incentive awards.
Our 2011 Plan will not be subject to the Employee Retirement Income Security Act of 1974, as amended, or ERISA. Our 2011 Plan, for a limited period of time following this offering, will qualify for an exception to the deductibility limitations imposed by Section 162(m) of the Code. Section 162(m) of the Code imposes a limit of $1,000,000 on the amount that we may deduct for compensation paid to each of our CEO and certain other named executive officers per year; however, if specified conditions are met, some compensation may be excluded from counting against this limit. Compensation that is excluded from the limit includes compensation that meets the requirements under Section 162(m) for "qualified performance-based" compensation. Our 2011 Plan is designed to allow for awards that constitute "qualified performance-based compensation" and are deductible for federal income tax purposes although our compensation committee may determine to issue awards that do not meet the requirements for deductibility. Initially, we will rely on a transition exemption from Section 162(m) for our 2011 Plan that applies to compensation plans adopted prior to an initial public offering. The transition exemption for the plan will terminate at the time of our annual meeting that occurs after the third calendar year following the year of our initial public offering or, if earlier, at the time we materially modify the plan or all the shares available under the plan are issued.
Shares Available. The maximum aggregate number of shares of our common stock that may be reserved and available for delivery in connection with awards under our 2011 Plan is 168,284 shares, subject to adjustment in accordance with the terms of our 2011 Plan. If common stock subject to any award is not issued or transferred, or ceases to be issuable or transferable for any reason, including (a) shares of common stock subject to an award that is cancelled, forfeited or settled in cash and (b) shares of common stock withheld to pay the exercise price of or to satisfy the withholding obligations with respect to an award, those shares of common stock will again be available for delivery under our 2011 Plan to the extent allowable by law. The maximum number of shares of common stock that may be subject to nonqualified stock options and SARs granted under our 2011 Plan to any one
130
participant during a fiscal year will be 84,142 shares. The maximum aggregate number of shares that may be issued under our 2011 Plan through incentive stock options will be 168,284 shares.
Eligibility. Any individual who provides services to us, including officers, employees, non-employee directors and consultants (each, an "Eligible Person"), is eligible to participate in our 2011 Plan.
Administration. Our compensation committee will administer our 2011 Plan pursuant to its terms, except to the extent our board of directors chooses to take action under our 2011 Plan. Our compensation committee or the board may delegate authority to make certain awards under our 2011 Plan to our Chief Executive Officer or another executive officer. Unless otherwise limited, our compensation committee will have broad discretion to administer our 2011 Plan, including the power to determine to whom and when awards will be granted, to determine the amount of such awards (measured in cash, shares of common stock or otherwise), to proscribe and interpret the terms and provisions of each award, to accelerate the exercise terms of any award, to delegate duties under our 2011 Plan and to execute all other responsibilities permitted or required under our 2011 Plan.
Terms of Options. Our compensation committee may grant (a) incentive stock options that comply with Section 422 of the Code to our employees and (b) nonqualified options to any Eligible Person. The exercise price for an option must not be less than the greater of (a) the par value per share of common stock or (b) the fair market value per share of common stock as of the date of grant. Options may be exercised on such terms as our compensation committee determines, but not later than ten years from the date of grant.
Terms of SARs. SARs may be awarded in connection with or separate from an option. A SAR is the right to receive an amount equal to the excess of the fair market value of one share of our common stock on the date of exercise over the grant price of the SAR. SARs will be exercisable on such terms as our compensation committee determines. The term of a SAR will be for a period determined by our compensation committee but will not exceed ten years. SARs may be paid in cash, common stock or a combination of cash and common stock, as determined by our compensation committee in the award agreement.
Restricted Stock Awards. A restricted stock award is a grant of shares of common stock subject to a risk of forfeiture, restrictions on transferability and any other restrictions determined by our compensation committee. Except as otherwise provided under the terms of our 2011 Plan or an award agreement, the holder of a restricted stock award may have rights as a stockholder, including the right to vote or to receive dividends (subject to any mandatory reinvestment or other requirements determined by our compensation committee). Unless otherwise determined by our compensation committee, a restricted stock award will be forfeited and reacquired by us upon termination of employment. Common stock distributed in connection with a stock split or stock dividend, and other property distributed as a dividend, may be subject to the same restrictions and risk of forfeiture as the restricted stock with respect to which the distribution was made.
Restricted Stock Units. Restricted stock units are rights to receive cash, common stock or a combination of cash and common stock at the end of a specified period. Restricted stock units may be subject to restrictions, including a risk of forfeiture, as determined by our compensation committee. Restricted stock units may be satisfied by cash, common stock or any combination of cash and common stock, as determined by our compensation committee. Unless otherwise determined by our compensation committee, restricted stock units will be forfeited upon termination of a participant's employment. Our compensation committee may, in its sole discretion, grant dividend equivalents with respect to restricted stock units.
Performance Awards. Our 2011 Plan provides for the grant of performance awards that may be granted in the form of cash, common stock or a combination of cash and common stock. Each
131
performance award will set forth (a) the amount, including a target and maximum amount if applicable, the recipient may earn in the form of cash or shares of common stock or a formula for determining that amount, (b) the performance criteria and level of achievement versus the criteria that will determine the amount of cash payable or number of shares of our common stock to be granted, issued, retained and/or vested, (c) the performance period over which performance is to be measured, (d) the timing of any payments to be made, (e) restrictions on the transferability of the award and (f) such other terms and conditions as our compensation committee may determine.
After we become subject to Section 162(m) of the Code, our compensation committee will have the discretion to determine whether all or any portion of a performance award is intended to satisfy the requirements for "qualified performance-based compensation" under Section 162(m). For any performance award that is intended to satisfy this qualified performance-based compensation exception, our compensation committee may establish a performance goal or goals based on one or more of the criteria specified in our 2011 Plan. Performance awards may contain performance measures based on one or more of the following criteria: (a) earnings or earnings per share (whether on a pre-tax, after-tax, operational or other basis), (b) return on equity, (c) total stockholder return (either absolute or compared to a peer group or index), (d) return on assets or net assets, (e) return on capital or invested capital and other related financial measures, (f) return on investment, (g) cash flow from operations, free cash flow, EBITDA or EBITDAX, (h) revenues, (i) income or operating income, (j) expenses or costs or expense levels or cost levels (absolute or per unit), (k) one or more operating ratios, (l) stock price (including growth measures and total stockholder return or attainment by the shares of a specified value for a specified period of time), (m) operating profit, (n) profit margin, (o) capital expenditures, (p) net borrowing, debt leverage levels, credit quality or debt ratings, (q) the accomplishment of mergers, acquisitions, dispositions, public offerings or similar extraordinary business transactions, (r) net asset value per share, (s) economic value added, (t) individual business objectives, (u) growth in production or gas or oil production, (v) oil and gas reserves or growth or additions in reserves, (w) oil and gas replacement ratio(s), (x) finding and development cost per unit, (y) cost reduction targets and/or (z) ratio of debt to proved reserves.
These criteria may be applied to an individual holder of a performance award, to us as a whole or a relevant portion of our operations. The performance goals established using these criteria may be expressed on an absolute or a relative basis, and may employ comparisons based on internal targets or the performance of other companies, or the historical performance of the company or any of its operating units or divisions. Any earnings-based measures may use comparisons relating to capital, shareholder's equity, shares outstanding, assets or net assets.
The maximum amount that may be paid in cash pursuant to a performance award granted to any holder with respect to any single fiscal year, if the award is intended to satisfy the qualified performance-based compensation requirements of Section 162(m) of the Code, is $2,500,000. If a performance award provides for a performance period longer than one fiscal year, the maximum amount that may be paid to the holder under that award is $2,500,000 multiplied by the number of full fiscal years in the performance period. Our 2011 Plan also provides that the maximum number of shares of common stock for which awards may be granted to any single participant during a fiscal year, including awards the vesting or payment of which is subject to the achievement of performance goals, is 84,142.
Before payment is made under any performance award that is intended to satisfy the qualified performance-based compensation requirements of Section 162(m) of the Code, our compensation committee must certify the extent to which the performance goals and other material terms of the award have been satisfied, and our compensation committee has the discretion to reduce, but not to increase, the amount payable and the number of shares that may be received.
132
Other Awards. Our 2011 Plan permits the grant of awards in addition to those described above, subject to applicable legal limitations and the terms of our 2011 Plan. Such awards may include common stock awarded as a bonus, dividend equivalents, convertible or exchangeable debt securities, other rights convertible or exchangeable into common stock, purchase rights for common stock, awards with value and payment contingent upon our performance or any other factors determined by our compensation committee, and awards valued by reference to the book value of common stock or the value of securities of or the performance of specified subsidiaries. Long-term cash awards also may be made under our 2011 Plan. Cash awards also may be granted as an element of or a supplement to any awards permitted under our 2011 Plan. Awards may also be granted in lieu of obligations to pay cash or deliver other property under our 2011 Plan or under other plans or compensation arrangements, subject to any applicable provision under Section 16 of the Exchange Act. Our compensation committee will determine terms and conditions of all such awards.
2012 Long Term Incentive Plan
Our board of directors has adopted our 2012 Plan, to be effective immediately prior to the effectiveness of the registration statement of which this prospectus forms a part.
The purpose of our 2012 Plan is to attract and retain the best personnel for positions of substantial responsibility, to provide additional incentives to our employees, directors and consultants, and to promote the success of our business. Our 2012 Plan provides for grants of (a) incentive stock options qualified as such under U.S. federal income tax laws, (b) stock options that do not qualify as incentive stock options, (c) stock appreciation rights, or SARs, (d) restricted stock awards, (e) restricted stock units, (f) performance awards or (g) other incentive awards.
Our 2012 Plan will not be subject to ERISA. Our 2012 Plan, for a limited period of time following this offering, will qualify for an exception to the deductibility limitations imposed by Section 162(m) of the Code. Section 162(m) of the Code imposes a limit of $1,000,000 on the amount that we may deduct for compensation paid to each of our CEO and certain other named executive officers per year; however, if specified conditions are met, some compensation may be excluded from counting against this limit. Compensation that is excluded from the limit includes compensation that meets the requirements under Section 162(m) for "qualified performance-based" compensation. Our 2012 Plan is designed to allow for awards that constitute "qualified performance-based compensation" and are deductible for federal income tax purposes although our compensation committee may determine to issue awards that do not meet the requirements for deductibility. Initially, we will rely on a transition exemption from Section 162(m) for our 2012 Plan that applies to compensation plans adopted prior to an initial public offering. The transition exemption for the plan will terminate at the time of our annual meeting that occurs after the third calendar year following the year of our initial public offering or, if earlier, at the time we materially modify the plan or all the shares available under the plan are issued.
Shares Available. The maximum aggregate number of shares of our common stock that may be reserved and available for delivery in connection with awards under our 2012 Plan is , subject to adjustment in accordance with the terms of our 2012 Plan. If common stock subject to any award is not issued or transferred, or ceases to be issuable or transferable for any reason, including shares of common stock subject to an award that is cancelled, forfeited or settled in cash, those shares of common stock will again be available for delivery under our 2012 Plan to the extent allowable by law. The maximum number of shares of common stock that may be subject to nonqualified stock options and SARs granted under our 2012 Plan to any one participant during a fiscal year will be shares. The maximum aggregate number of shares that may be issued under our 2012 Plan through incentive stock options will be shares.
Eligibility. Any individual who provides services to us, including officers, employees, non-employee directors and consultants (each, an "Eligible Person"), is eligible to participate in our 2012 Plan.
133
Administration. Our compensation committee will administer our 2012 Plan pursuant to its terms, except to the extent our board of directors chooses to take action under our 2012 Plan. Our compensation committee or the board may delegate authority to make certain awards under our 2012 Plan to our Chief Executive Officer or another executive officer. Unless otherwise limited, our compensation committee will have broad discretion to administer our 2012 Plan, including the power to determine to whom and when awards will be granted, to determine the amount of such awards (measured in cash, shares of common stock or otherwise), to proscribe and interpret the terms and provisions of each award, to accelerate the exercise terms of any award, to delegate duties under our 2012 Plan and to execute all other responsibilities permitted or required under our 2012 Plan.
Terms of Options. Our compensation committee may grant (a) incentive stock options that comply with Section 422 of the Code to our employees and (b) nonqualified options to any Eligible Person. The exercise price for an option must not be less than the greater of (a) the par value per share of common stock or (b) the fair market value per share of common stock as of the date of grant. Options may be exercised on such terms as our compensation committee determines, but not later than ten years from the date of grant.
Terms of SARs. SARs may be awarded in connection with or separate from an option. A SAR is the right to receive an amount equal to the excess of the fair market value of one share of our common stock on the date of exercise over the grant price of the SAR. SARs will be exercisable on such terms as our compensation committee determines. The term of a SAR will be for a period determined by our compensation committee but will not exceed ten years. SARs may be paid in cash, common stock or a combination of cash and common stock, as determined by our compensation committee in the award agreement.
Restricted Stock Awards. A restricted stock award is a grant of shares of common stock subject to a risk of forfeiture, restrictions on transferability and any other restrictions determined by our compensation committee. Except as otherwise provided under the terms of our 2012 Plan or an award agreement, the holder of a restricted stock award may have rights as a stockholder, including the right to vote or to receive dividends (subject to any mandatory reinvestment or other requirements determined by our compensation committee). Unless otherwise determined by our compensation committee, a restricted stock award will be forfeited and reacquired by us upon termination of employment. Common stock distributed in connection with a stock split or stock dividend, and other property distributed as a dividend, may be subject to the same restrictions and risk of forfeiture as the restricted stock with respect to which the distribution was made.
Restricted Stock Units. Restricted stock units are rights to receive cash, common stock or a combination of cash and common stock at the end of a specified period. Restricted stock units may be subject to restrictions, including a risk of forfeiture, as determined by our compensation committee. Restricted stock units may be satisfied by cash, common stock or any combination of cash and common stock, as determined by our compensation committee. Unless otherwise determined by our compensation committee, restricted stock units will be forfeited upon termination of a participant's employment. Our compensation committee may, in its sole discretion, grant dividend equivalents with respect to restricted stock units.
Performance Awards. Our 2012 Plan provides for the grant of performance awards that may be granted in the form of cash, common stock or a combination of cash and common stock. Each performance award will set forth (a) the amount, including a target and maximum amount if applicable, the recipient may earn in the form of cash or shares of common stock or a formula for determining that amount, (b) the performance criteria and level of achievement versus the criteria that will determine the amount of cash payable or number of shares of our common stock to be granted, issued, retained and/or vested, (c) the performance period over which performance is to be measured, (d) the
134
timing of any payments to be made, (e) restrictions on the transferability of the award and (f) such other terms and conditions as our compensation committee may determine.
After we become subject to Section 162(m) of the Code, our compensation committee will have the discretion to determine whether all or any portion of a performance award is intended to satisfy the requirements for "qualified performance-based compensation" under Section 162(m). For any performance award that is intended to satisfy this qualified performance-based compensation exception, our compensation committee may establish a performance goal or goals based on one or more of the criteria specified in our 2012 Plan. Performance awards may contain performance measures based on one or more of the following criteria: (a) earnings or earnings per share (whether on a pre-tax, after-tax, operational or other basis), (b) return on equity, (c) total stockholder return (either absolute or compared to a peer group or index), (d) return on assets or net assets, (e) return on capital or invested capital and other related financial measures, (f) return on investment, (g) cash flow from operations, free cash flow, EBITDA or EBITDAX, (h) revenues, (i) income or operating income, (j) expenses or costs or expense levels or cost levels (absolute or per unit), (k) one or more operating ratios, (l) stock price (including growth measures and total stockholder return or attainment by the shares of a specified value for a specified period of time), (m) operating profit, (n) profit margin, (o) capital expenditures, (p) net borrowing, debt leverage levels, credit quality or debt ratings, (q) the accomplishment of mergers, acquisitions, dispositions, public offerings or similar extraordinary business transactions, (r) net asset value per share, (s) economic value added, (t) individual business objectives, (u) growth in production or gas or oil production, (v) oil and gas reserves or growth or additions in reserves, (w) oil and gas replacement ratio(s), (x) finding and development cost per unit, (y) cost reduction targets and/or (z) ratio of debt to proved reserves.
These criteria may be applied to an individual holder of a performance award, to us as a whole or a relevant portion of our operations. The performance goals established using these criteria may be expressed on an absolute or a relative basis, and may employ comparisons based on internal targets or the performance of other companies, or our historical performance or the historical performance of any of our operating units or divisions. Any earnings-based measures may use comparisons relating to capital, shareholder's equity, shares outstanding, assets or net assets.
The maximum amount that may be paid in cash pursuant to a performance award granted to any holder with respect to any single fiscal year, if the award is intended to satisfy the qualified performance-based compensation requirements of Section 162(m) of the Code, is $2,500,000. If a performance award provides for a performance period longer than one fiscal year, the maximum amount that may be paid to the holder under that award is $2,500,000 multiplied by the number of full fiscal years in the performance period. Our 2012 Plan also provides that the maximum number of shares of common stock for which awards may be granted to any single participant during a fiscal year, including awards the vesting or payment of which is subject to the achievement of performance goals, is .
Before payment is made under any performance award that is intended to satisfy the qualified performance-based compensation requirements of Section 162(m) of the Code, our compensation committee must certify the extent to which the performance goals and other material terms of the award have been satisfied, and our compensation committee has the discretion to reduce, but not to increase, the amount payable and the number of shares that may be received.
Other Awards. Our 2012 Plan permits the grant of awards in addition to those described above, subject to applicable legal limitations and the terms of our 2012 Plan. Such awards may include common stock awarded as a bonus, dividend equivalents, convertible or exchangeable debt securities, other rights convertible or exchangeable into common stock, purchase rights for common stock, awards with value and payment contingent upon our performance or any other factors determined by our compensation committee, and awards valued by reference to the book value of common stock or the
135
value of securities of or the performance of specified subsidiaries. Long-term cash awards also may be made under our 2012 Plan. Cash awards also may be granted as an element of or a supplement to any awards permitted under our 2012 Plan. Awards may also be granted in lieu of obligations to pay cash or deliver other property under our 2012 Plan or under other plans or compensation arrangements, subject to any applicable provision under Section 16 of the Exchange Act. Our compensation committee will determine terms and conditions of all such awards.
Director Compensation
In 2011, our non-employee directors received quarterly payments of $8,750. Our non-employee directors also received an annual retainer of $50,000 payable, at the election of the director, in cash, stock or a combination of both. In 2011, all of our non-employee directors elected to receive cash. Further, our non-employee directors received cash meeting fees of $1,000 for each board meeting attended.
In addition, the members of our special committee received a monthly payment of $25,000, and the chairman of our special committee received a stipend of $10,000 for the first thirty days of his service as chairman of our special committee. See "Certain Relationships and Related Party Transactions—Acquisition of Cima Resources, Inc." for a discussion of the formation of the special committee.
Following the consummation of this offering, our non-employee directors are expected to receive compensation that is commensurate with the compensation that is offered to directors of companies that are similar to ours, including equity-based awards granted under our 2012 Long Term Incentive Plan. We have not compensated, nor do we expect to compensate, our employee directors for their service on our board of directors. In 2011, we reimbursed our directors for their reasonable out-of-pocket expenses incurred in connection with their service as directors, in accordance with our general expense reimbursement policies. Following the consummation of this offering, we expect to continue to reimburse our directors for their reasonable out-of-pocket expenses in connection with their service as directors accordingly.
The following table summarizes the annual compensation for our non-employee directors during 2011. Mr. Glass, who is a full-time employee, and Messrs. Keenan and Lawrence, who are affiliated with Yorktown, do not receive compensation for serving as directors.
Name
|
Fees Earned or Paid in Cash ($) |
Stock Awards ($) |
All Other Compensation ($) |
Total ($) |
|||||||||
|---|---|---|---|---|---|---|---|---|---|---|---|---|---|
Alan D. Bell(1) |
$ | 179,758 | $ | — | $ | — | $ | 179,758 | |||||
James C. Crain |
94,583 | — | — | 94,583 | |||||||||
Ellen K. Hannan(2) |
8,804 | — | — | 8,804 | |||||||||
James R. Latimer, III(3) |
189,758 | — | — | 189,758 | |||||||||
- (1)
- Mr. Bell
became a member of the board in July 2011. Mr. Bell also served as a member of the special committee formed by our board in
connection with our acquisition of Cima. See "Certain Relationships and Related Party Transactions—Acquisition of Cima Resources, Inc." for a discussion of the formation of the
special committee.
- (2)
- Ms. Hannan
became a member of our board in December 2011.
- (3)
- Mr. Latimer became a member of our board in July 2011. Mr. Latimer also served as the chairman of the special committee formed by our board in connection with our acquisition of Cima. See "Certain Relationships and Related Party Transactions—Acquisition of Cima Resources, Inc." for a discussion of the formation of the special committee.
136
Indemnification
Our amended and restated certificate of incorporation and amended and restated bylaws will provide indemnification rights to the members of our board of directors and permit us to purchase insurance on behalf of any officer, director, employee or other agent for any liability arising out of that person's actions as our officer, director, employee or agent, regardless of whether Delaware law would permit indemnification. After completion of this offering, we will evaluate our existing director and officer liability insurance coverage and make such adjustments we deem appropriate. Additionally, we expect to enter into separate indemnification agreements with the members of our board of directors and our executive officers to provide additional indemnification benefits, including the right to receive in advance reimbursements for expenses incurred in connection with a defense for which the director or the executive officer is entitled to indemnification. We believe that the limitation of liability provision in our amended and restated certificate of incorporation and the indemnification agreements will facilitate our ability to continue to attract and retain qualified individuals to serve as directors and executive officers.
137
CERTAIN RELATIONSHIPS AND RELATED PARTY TRANSACTIONS
Acquisition of Companies Under Common Control
In November 2011, we acquired Cima pursuant to a merger of Cima with and into our wholly-owned subsidiary. Cima was managed by our executive officers since its inception in March 2010 and was primarily owned and controlled by Yorktown. Bryan H. Lawrence and W. Howard Keenan, Jr., who are members of our board of directors, are principals of Yorktown. Prior to the merger, our board of directors formed a special committee consisting of independent directors to review and evaluate the terms of the merger and other alternatives, to negotiate the terms of the merger with Cima, to determine whether the terms of the merger were fair to, and in the best interests of, our stockholders (other than Yorktown and its affiliates and associates), and to make a recommendation to the full board of directors with respect to the merger. Based on its review and upon the advice of its own financial and legal advisors, the special committee of the board concluded that the merger was fair to, and in the best interests of our stockholders (other than Yorktown and its affiliates and associates) and recommended that the full board approve and authorize the merger. Based on the recommendation by its special committee, our full board approved and authorized the merger with Cima. As consideration for the shares of Cima common stock we acquired in the merger, we issued 1,323,960 shares of our common stock to the former stockholders of Cima, and 122,586 restricted shares of our common stock to our employees who held Cima restricted shares of common stock under Cima's stock incentive plan. As a result of this merger, Cima became one of our wholly-owned subsidiaries. Our Eagle Ford Shale properties and the majority of our Powder River Basin properties were acquired as a result of the Cima transaction.
On March 8, 2009, we acquired approximately 85% of the outstanding common stock of DRI, an entity primarily owned and controlled by Yorktown, in exchange for 683,305 shares of our common stock. On August 9, 2009, we acquired the remaining outstanding shares of DRI in exchange for 131,565 shares of our common stock along with the issuance of warrants and other payments.
On March 31, 2009, we acquired all of the outstanding common stock of Centurion Exploration Company, LLC ("Centurion"), an entity primarily owned and controlled by Yorktown. The stockholders of Centurion received 19 shares of our common stock in exchange for all of Centurion's common stock outstanding at that date. Prior to our combination with Centurion, Centurion had a note payable to certain funds managed by Yorktown which had a principal balance of $5,000,000 on January 1, 2008. During the year ended December 31, 2008, the amounts outstanding under this note payable were converted into 25,000 shares of our common stock.
Employment Agreements
Immediately prior to this offering, we will enter into employment agreements with certain of our executive officers. See "Executive Compensation and Other Information—Employment Agreements" for a detailed description of these agreements.
Indemnification of Directors and Officers
Section 145 of the Delaware General Corporation Law, or the DGCL, permits indemnification of officers, directors and other corporate agents under specific circumstances and subject to specific limitations. Our amended and restated certificate of incorporation and amended and restated bylaws will provide that we will indemnify our directors and officers to the full extent permitted by the DGCL, including in circumstances in which indemnification is otherwise discretionary under Delaware law.
We expect to enter into indemnification agreements with our directors and executive officers that provide the maximum indemnity allowed to directors and executive officers by Section 145 of the DGCL, as well as certain additional procedural protections. The indemnification agreements will provide that directors and executive officers are and will be indemnified to the fullest extent not
138
prohibited by law against all expenses (including attorneys' fees) and settlement amounts paid or incurred by them in any action or proceeding as our directors or executive officers, including any action on account of their services as executive officers or directors of any other company or enterprise when they are serving in such capacities at our request, and including any action by us or in our right. In addition, the indemnification agreements provide for reimbursement of expenses incurred in conjunction with being a witness in any proceeding to which the indemnitee is not a party. We are required to pay in advance of a final disposition of a proceeding or claim the expenses incurred by the indemnitee no later than ten days after our receipt of an undertaking by or on behalf of the indemnitee to repay the amount of the expenses to the extent that it is ultimately determined that the indemnitee is not entitled to be indemnified by us. The indemnification agreements also provide the indemnitee with remedies in the event that we do not fulfill our obligations under the indemnification agreements.
Section 102(b)(7) of the DGCL permits a corporation to provide in its certificate of incorporation that a director of the corporation will not be personally liable to the corporation or its stockholders for monetary damages for breach of fiduciary duty as a director, except for liability (i) for any breach of the director's duty of loyalty to the corporation or its stockholders, (ii) for acts or omissions not in good faith or which involve intentional misconduct or a knowing violation of law, (iii) for payments of unlawful dividends or unlawful stock repurchases or redemptions or (iv) for any transaction from which the director derived an improper personal benefit. Our amended and restated certificate of incorporation will provide for that limitation of liability.
We will maintain policies of insurance under which our directors and officers are insured, within the limits and subject to the limitations of the policies, against specific expenses in connection with the defense of, and specific liabilities which might be imposed as a result of, actions, suits or proceedings to which they are parties by reason of being or having been directors or officers.
Corporate Opportunities Renunciation
All of our non-employee directors and certain of our stockholders may from time to time have investments in other exploration and production companies that may compete with us. Section 122(17) of the DGCL permits a Delaware corporation, such as Cinco Resources, Inc., to renounce in its certificate of incorporation or by action of its board of directors any interest or expectancy of the corporation in certain opportunities, effectively eliminating the ambiguity in a Delaware corporation's ability to do so in advance arising out of prior Delaware case law. Under corporate law concepts of fiduciary duty, officers and directors generally have a duty to disclose to us opportunities that are related to our business and are generally prohibited from pursuing those opportunities unless we determine that we are not going to pursue them. Our amended and restated certificate of incorporation will provide that Cinco Resources, Inc. renounces any interest or expectancy of Cinco Resources, Inc. in, or in being offered an opportunity to participate in, any business opportunities, including business opportunities within those classes of opportunity currently or subsequently pursued by Cinco Resources, Inc. or its subsidiaries, that may be presented to (i) any of our non-employee directors, (ii) Yorktown or any other investment fund sponsored or managed by Yorktown, including any fund still to be formed, (iii) any affiliate or subsidiary of Yorktown or any other investment fund sponsored or managed by Yorktown, including any fund still to be formed, or (iv) any director, officer or employee of Cinco Resources, Inc. who is also concurrently a director, officer or employee of an affiliate, subsidiary or designate of Yorktown or any other investment fund sponsored or managed by Yorktown, including any fund still to be formed.
Thus, for example, our non-employee directors and Yorktown may pursue opportunities in the oil and gas exploration and production industry for their own account. The designated parties described in the preceding paragraph have no obligation to offer such opportunities to us.
139
Registration Rights Agreement
Prior to the completion of this offering, we will enter into a registration rights agreement with Yorktown and the members of our management team who are existing stockholders, pursuant to which we will grant certain demand and "piggyback" registration rights.
Under the registration rights agreement, Yorktown and the members of our management team will have the right to require us to file a registration statement for the public sale of all of the shares of common stock owned by it or them any time after six months following the date the SEC declares the registration statement, of which this prospectus forms a part, effective. In addition, if we sell any shares of our common stock in a registered underwritten offering after this offering, Yorktown and the members of our management team will have the right to include his or its shares in that offering. The underwriters of any such offering will have the right to limit the number of stockholder shares to be included in such sale.
We will pay all expenses relating to any demand or piggyback registration, except for underwriters' or brokers' commission or discounts. The securities covered by the registration rights agreement will no longer be registrable under the registration rights agreement if they have been sold to the public either pursuant to a registration statement or under Rule 144 promulgated under the Securities Act.
Other Related Party Transactions
Preferred Stock Conversion. In a series of equity rounds commencing in March 2009, Yorktown acquired an aggregate of 525,000 shares of our Series A convertible preferred stock at a purchase price of $200.00 per share. In November 2011, Yorktown converted these shares into 875,000 shares of our common stock. This conversion took place immediately prior to our acquisition of Cima.
Yorktown Investment. In November 2011, Yorktown purchased an additional 250,000 shares of our common stock for $30.0 million. We used this additional capital to fund the initial $13.5 million purchase price payment on our November 2011 acquisition of Powder River Basin acreage and to support our ongoing drilling program.
Cima Transactions. In connection with the formation and subsequent financing of Cima prior to its merger with us, Cima issued and sold its shares to our executive officers in exchange for notes receivable in an aggregate principal amount of $9.6 million. The notes payable by our executive officers were full recourse and earned interest at an annual rate of 3.00%. On November 14, 2011 and prior to Cima's merger with us, the note holders repaid in full the aggregate principal amount and accrued interest under these notes by tendering a portion of the shares acquired with these notes back to Cima. The following table sets forth for each of our executive officers the aggregate amount of the outstanding principal and accrued interest as of October 31, 2011.
Name of executive officer
|
Aggregate principal amount |
Accrued interest | |||||
|---|---|---|---|---|---|---|---|
| |
(in thousands) |
||||||
Jon L. Glass |
$ | 3,494 | $ | 96 | |||
Wayne B. Stoltenberg |
1,544 | 42 | |||||
Edward P. Travis |
1,544 | 35 | |||||
Leigh T. Prieto |
1,008 | 28 | |||||
Craig D. Pollard |
1,073 | 29 | |||||
Chris M. Kidd |
975 | 27 | |||||
Total |
$ | 9,638 | $ | 257 | |||
140
In a series of equity rounds commencing in May 2010, Yorktown purchased shares of Cima's common stock for $130.0 million. This capital was used to acquire and develop Cima's Eagle Ford Shale and Powder River Basin properties.
Procedures for Review and Approval of Related Party Transactions
Before the effective date of the registration statement of which this prospectus forms a part, our board of directors plans to adopt a written related party transactions policy. Pursuant to this policy, the audit committee will review all material facts of all related party transactions and recommend either approval or rejection of entry into the related party transaction to the full board of directors, subject to certain limited exceptions. In determining whether to recommend approval or rejection of entry into a related party transaction, the audit committee shall take into account, among other factors, the following: (i) whether the related party transaction is on terms no less favorable than terms generally available to an unaffiliated third-party under the same or similar circumstances and (ii) the extent of the related person's interest in the transaction. After receiving the audit committee's recommendation, the full board of directors will review all material facts of the related party transaction and either approve or reject the related party transaction. Further, the policy will require that all related party transactions required to be disclosed in our filings with the SEC be so disclosed in accordance with applicable laws, rules and regulations. All of the transactions described above were entered into before the adoption of our related party transactions policy.
141
The following table sets forth certain information as of , 2012 regarding the beneficial ownership of our common stock by (i) each of our executive officers, (ii) each of our directors, (iii) all of our executive officers and directors as a group and (iv) each stockholder known by us to be the beneficial owner of more than 5% of our issued and outstanding common stock.
Beneficial ownership is determined in accordance with the rules of the SEC and includes voting or investment power with respect to the securities. Shares of common stock that may be acquired by an individual or group within 60 days of , 2012, pursuant to the exercise of options or warrants, are deemed to be outstanding for the purpose of computing the percentage ownership of such individual or group, but are not deemed to be outstanding for the purpose of computing the percentage ownership of any other person shown in the table. Percentage of ownership is based on shares of common stock issued and outstanding on , 2012, plus shares of common stock that we are selling in this offering and shares of common stock expected to be granted prior to or contemporaneously with this offering. The underwriters have an option to purchase up to additional shares of common stock from us to cover over-allotments.
Except as indicated in footnotes to this table, we believe that the stockholders named in this table have sole voting and investment power with respect to all shares of common stock shown to be beneficially owned by them, based on information provided to us by such stockholders. Unless otherwise indicated, the address for each director and executive officer listed is: 2626 Howell Street, Suite 800, Dallas, Texas 75204.
| |
|
Percentage of Shares Beneficially Owned | ||||||||
|---|---|---|---|---|---|---|---|---|---|---|
Name and Address of Beneficial Owner
|
Number of Shares Beneficially Owned |
Before the Offering | After the Offering | |||||||
Directors and Executive Officers: |
||||||||||
Jon L. Glass |
||||||||||
Wayne B. Stoltenberg |
||||||||||
Edward P. Travis |
||||||||||
Leigh T. Prieto |
||||||||||
Craig D. Pollard |
||||||||||
Chris M. Kidd |
||||||||||
Alan D. Bell |
||||||||||
James C. Crain |
||||||||||
Ellen K. Hannan |
||||||||||
W. Howard Keenan, Jr. |
||||||||||
James R. Latimer, III |
||||||||||
Bryan H. Lawrence |
||||||||||
All directors and executive officers as a group (12 persons) |
||||||||||
Five Percent Stockholders: |
||||||||||
Yorktown Energy Partners IV, L.P.(1)(2) |
||||||||||
Yorktown Energy Partners V, L.P.(1)(3) |
||||||||||
Yorktown Energy Partners VI, L.P.(1)(4) |
||||||||||
Yorktown Energy Partners VII, L.P.(1)(5) |
||||||||||
Yorktown Energy Partners VIII, L.P.(1)(6) |
||||||||||
Yorktown Energy Partners IX, L.P.(1)(7) |
||||||||||
- *
- Less than one percent.
142
- (1)
- Has
a principal business address of 410 Park Avenue, 19th Floor, New York, New York 10022.
- (2)
- Yorktown IV
Company LLC is the sole general partner of Yorktown Energy Partners IV, L.P. As a result Yorktown IV
Company LLC may be deemed to have the power to vote or direct the vote or to dispose or direct the disposition of the common stock owned by Yorktown Energy Partners IV, L.P.
Yorktown IV Company LLC disclaims beneficial ownership of the common stock owned by Yorktown Energy Partners IV, L.P. in excess of its pecuniary interest therein.
- (3)
- Yorktown V
Company LLC is the sole general partner of Yorktown Energy Partners V, L.P. As a result Yorktown V
Company LLC may be deemed to have the power to vote or direct the vote or to dispose or direct the disposition of the common stock owned by Yorktown Energy Partners V, L.P.
Yorktown V Company LLC disclaims beneficial ownership of the common stock owned by Yorktown Energy Partners V, L.P. in excess of its pecuniary interest therein
- (4)
- Yorktown VI
Company LP is the sole general partner of Yorktown Energy Partners VI, L.P. Yorktown VI Associates LLC
is the sole general partner of Yorktown VI Company LP. As a result, Yorktown VI Associates LLC may be deemed to have the power to vote or direct the vote or to dispose or
direct the disposition of the common stock owned by Yorktown Energy Partners VI, L.P. Yorktown VI Company LP and Yorktown VI Associates LLC disclaim
beneficial ownership of the common stock owned by Yorktown Energy Partners VI, L.P. in excess of their pecuniary interest therein.
- (5)
- Yorktown VII
Company LP is the sole general partner of Yorktown Energy Partners VII, L.P. Yorktown VII
Associates LLC is the sole general partner of Yorktown VII Company LP. As a result, Yorktown VII Associates LLC may be deemed to have the power to vote or direct the
vote or to dispose or direct the disposition of the common stock owned by Yorktown Energy Partners VII, L.P. Yorktown VII Company LP and Yorktown VII
Associates LLC disclaim beneficial ownership of the common stock owned by Yorktown Energy Partners VII, L.P. in excess of their pecuniary interest therein.
- (6)
- Yorktown VIII
Company LP is the sole general partner of Yorktown Energy Partners VIII, L.P. Yorktown VIII
Associates LLC is the sole general partner of Yorktown VIII Company LP. As a result, Yorktown VIII Associates LLC may be deemed to have the power to vote or direct
the vote or to dispose or direct the disposition of the common stock owned by Yorktown Energy Partners VIII, L.P. Yorktown VIII Company LP and Yorktown VIII
Associates LLC disclaim beneficial ownership of the common stock owned by Yorktown Energy Partners VIII, L.P. in excess of their pecuniary interest therein.
- (7)
- Yorktown IX Company LP is the sole general partner of Yorktown Energy Partners IX, L.P. Yorktown IX Associates LLC is the sole general partner of Yorktown IX Company LP. As a result, Yorktown IX Associates LLC may be deemed to have the power to vote or direct the vote or to dispose or direct the disposition of the common stock owned by Yorktown Energy Partners IX, L.P. Yorktown IX Company LP and Yorktown IX Associates LLC disclaim beneficial ownership of the common stock owned by Yorktown Energy Partners IX, L.P. in excess of their pecuniary interest therein.
143
Upon completion of this offering, the authorized capital stock of Cinco Resources, Inc. will consist of shares of common stock, par value $0.10 per share, of which shares will be issued and outstanding, and shares of preferred stock, par value $0.10 per share, of which no shares will be issued and outstanding.
We have applied to have the common stock listed on NASDAQ under the symbol "CINC."
We will adopt an amended and restated certificate of incorporation and amended and restated bylaws concurrently with, or prior to, the completion of this offering. The following summary of the capital stock and amended and restated certificate of incorporation and amended and restated bylaws of Cinco Resources, Inc. does not purport to be complete and is qualified in its entirety by reference to the provisions of applicable law and to our amended and restated certificate of incorporation and amended and restated bylaws, which will be filed as exhibits to the registration statement of which this prospectus is a part.
Common Stock
Except as provided by law or in a preferred stock designation, holders of common stock are entitled to one vote for each share held of record on all matters submitted to a vote of the stockholders, have the exclusive right to vote for the election of directors and do not have cumulative voting rights. Subject to preferences that may be applicable to any outstanding shares or series of preferred stock, holders of common stock are entitled to receive ratably such dividends (payable in cash, stock or otherwise), if any, as may be declared from time to time by our board of directors out of funds legally available for dividend payments. All outstanding shares of common stock are fully paid and non-assessable. The holders of common stock have no preferences or rights of conversion, exchange, pre-emption or other subscription rights. There are no redemption or sinking fund provisions applicable to the common stock. In the event of any liquidation, dissolution or winding-up of our affairs, holders of common stock will be entitled to share ratably in our assets that are remaining after payment or provision for payment of all of our debts and obligations and after liquidation payments to holders of outstanding shares of preferred stock, if any.
Preferred Stock
Our amended and restated certificate of incorporation will authorize our board of directors, subject to any limitations prescribed by law, without further stockholder approval, to establish and to issue from time to time one or more classes or series of preferred stock, par value $0.10 per share, covering up to an aggregate of shares of preferred stock. Each class or series of preferred stock will cover the number of shares and will have the powers, preferences, rights, qualifications, limitations and restrictions determined by our board of directors, which may include, among others, dividend rights, liquidation preferences, voting rights, conversion rights, preemptive rights and redemption rights. The issuance of preferred stock may have the effect of delaying, deferring or preventing a change in control of us without further action by the stockholders and may adversely affect the voting and other rights of the holders of common stock.
Transfer Agent and Registrar
will be the transfer agent and registrar for our common stock.
Anti-Takeover Effects of Provisions of Our Amended and Restated Certificate of Incorporation, Our Amended and Restated Bylaws and Delaware Law
Some provisions of Delaware law, our amended and restated certificate of incorporation and our amended and restated bylaws described below contain anti-takeover provisions that may delay, deter or
144
prevent a tender offer or takeover attempt. These provisions may also have the effect of preventing changes in our management. It is possible that these provisions could make it more difficult to accomplish or could deter transactions that stockholders may otherwise consider to be in their best interest or in our best interests, including transactions that might result in a premium over the market price for our shares. In addition, these provisions may adversely affect the prevailing market price of our common stock.
These provisions, summarized below, are expected to:
- •
- discourage coercive takeover practices and inadequate takeover bids;
- •
- enhance the likelihood of continuity and stability in the composition of our board of directors and in the policies
formulated by our board of directors;
- •
- discourage transactions which may involve an actual or threatened change in control;
- •
- discourage tactics that may be involved in proxy fights; and
- •
- encourage persons seeking to acquire control of us to first negotiate with us.
We believe that the benefits of increased protection and our potential ability to negotiate with the proponent of an unfriendly or unsolicited proposal to acquire or restructure us outweigh the disadvantages of discouraging these proposals because, among other things, negotiation of these proposals could result in an improvement of their terms.
Delaware Law
Upon completion of this offering, we will be subject to the provisions of Section 203 of the DGCL, which regulates corporate takeovers. In general, those provisions prohibit a Delaware corporation, including those whose securities are listed for trading on the NASDAQ, from engaging in any business combination with any interested stockholder for a period of three years following the date that the stockholder became an interested stockholder, unless:
- •
- the business combination or transaction in which the person became interested is approved by the board of directors before
the date the interested stockholder attained that status;
- •
- upon consummation of the transaction that resulted in the stockholder becoming an interested stockholder, the interested
stockholder owned at least 85% of the voting stock of the corporation outstanding at the time the transaction commenced other than, for purposes of determining the voting stock outstanding (but not
the outstanding stock owned by the interested stockholder), shares owned by persons who are directors and also officers of the company and by certain employee stock plans; or
- •
- on or after such time the business combination is approved by the board of directors and authorized at a meeting of stockholders by at least two-thirds of the outstanding voting stock that is not owned by the interested stockholder.
Section 203 defines "business combination" to include the following:
- •
- certain mergers or consolidations involving the corporation and the interested stockholder;
- •
- any sale, transfer, pledge or other disposition of 10% or more of the assets of the corporation to or with the interested
stockholder;
- •
- subject to certain exceptions, any transaction that results in the issuance or transfer by the corporation of any stock of the corporation to the interested stockholder;
145
- •
- subject to certain exceptions, any transaction involving the corporation that has the effect of increasing the
proportionate share of the stock of any class or series of the corporation beneficially owned by the interested stockholder; or
- •
- the receipt by the interested stockholder of the benefit of loans, advances, guarantees, pledges or other financial benefits provided by or through the corporation.
In general, Section 203 defines an interested stockholder as any entity or person beneficially owning 15% or more of the outstanding voting stock of the corporation and any entity or person affiliated with or controlling or controlled by any of these entities or persons.
Our Amended and Restated Certificate of Incorporation and Amended and Restated Bylaws
We anticipate that, upon the completion of the offering, our amended and restated certificate of incorporation and amended and restated bylaws will contain certain provisions that could make it more difficult for a third party to acquire control of us. These provisions may:
- •
- provide advance notice procedures with regard to stockholder nomination of candidates for election as directors or
proposals of business to be brought before meetings of our stockholders. These procedures provide that notice of stockholder nominations or proposals must be timely given in writing to our corporate
secretary prior to the meeting at which the action is to be taken. Generally, to be timely, notice must be received at our principal executive offices not less than 45 days nor more than
75 days prior to the first anniversary date of the annual meeting for the preceding year. Our amended and restated bylaws specify the requirements as to form and content of all stockholders'
notices. These requirements may make it more difficult for stockholders to bring matters before the stockholders at an annual or special meeting;
- •
- provide our board of directors the ability to establish the terms of undesignated preferred stock. This ability makes it
possible for our board of directors to issue, without stockholder approval, preferred stock with voting or other rights or preferences that could impede the success of any attempt to change control of
us. These and other provisions may have the effect of deterring hostile takeovers or delaying changes in control or management of Cinco;
- •
- provide that the authorized number of directors may be changed only by resolution of our board of directors;
- •
- provide that all vacancies, including newly created directorships, may, except as otherwise required by law and subject to
the rights of the holders of any series of preferred stock, be filled by the affirmative vote of a majority of directors then in office, even if less than a quorum;
- •
- provide that any action required or permitted to be taken by the stockholders must be effected at a duly called annual or
special meeting of stockholders and may not be effected by any consent in writing in lieu of a meeting of such stockholders, subject to the rights of the holders of any series of preferred stock;
- •
- provide that certain provisions of our amended and restated certificate of incorporation may be amended only with the
affirmative vote of the holders of at least of our then outstanding common stock;
- •
- provide that our amended and restated bylaws may be amended by the affirmative vote of the holders of at least
of our then outstanding common stock;
- •
- provide that special meetings of our stockholders may only be called by the board of directors; and
- •
- provide that our amended and restated bylaws can be amended or repealed by our board of directors or our stockholders.
146
Limitation of Liability of Directors and Officers; Indemnification Matters
Our amended and restated certificate of incorporation will limit the liability of our directors for monetary damages for breach of their fiduciary duty as directors, except for the following liabilities that cannot be eliminated under the DGCL:
- •
- for any breach of their duty of loyalty to us or our stockholders;
- •
- for acts or omissions not in good faith or which involve intentional misconduct or a knowing violation of law;
- •
- for an unlawful payment of dividends or an unlawful stock purchase or redemption, as provided under Section 174 of
the DGCL; or
- •
- for any transaction from which the director derived an improper personal benefit.
Any amendment or repeal of these provisions will be prospective only and would not affect any limitation on liability of a director for acts or omissions that occurred prior to any such amendment or repeal.
Our amended and restated bylaws also will provide that we will indemnify our directors and officers to the fullest extent permitted by Delaware law; provided that we shall indemnify any such person seeking indemnification in connection with a proceeding (or part thereof) initiated by such person only if such proceeding (or part thereof) was authorized by the board of directors. Our amended and restated bylaws also will explicitly authorize us to purchase insurance to protect any of our officers, directors, employees or agents or any person who is or was serving at our request as an officer, director, employee or agent of another enterprise for any expense, liability or loss, regardless of whether Delaware law would permit indemnification.
We expect to enter into indemnification agreements with each of our directors and executive officers. The agreements will provide that we will indemnify and hold harmless each indemnitee for certain expenses to the fullest extent permitted or authorized by law, including the DGCL, in effect on the date of the agreement or as it may be amended to provide more advantageous rights to the indemnitee. If such indemnification is unavailable as a result of a court decision and if we and the indemnitee are jointly liable in the proceeding, we will contribute funds to the indemnitee for his expenses in proportion to relative benefit and fault of us and indemnitee in the transaction giving rise to the proceeding. The indemnification agreements also will provide that we will indemnify the indemnitee for monetary damages for actions taken as our director or officer or for serving at our request as a director or officer or another position at another corporation or enterprise, as the case may be but only if (i) the indemnitee acted in good faith and, in the case of conduct in his official capacity, in a manner he reasonably believed to be in our best interests and, in all other cases, not opposed to the our best interests and (ii) in the case of a criminal proceeding, the indemnitee must have had no reasonable cause to believe that his conduct was unlawful. The indemnification agreements also will provide that we must advance payment of certain expenses to the indemnitee, including fees of counsel, subject to receipt of an undertaking from the indemnitee to return such advance if it is it is ultimately determined that the indemnitee is not entitled to indemnification.
We believe that the limitation of liability provision in our amended and restated certificate of incorporation and the indemnification agreements will facilitate our ability to continue to attract and retain qualified individuals to serve as directors and officers.
Registration Rights
We will enter into a registration rights agreement with certain holders of our common stock prior to the completion of this offering. See "Certain Relationships and Related Party Transactions—Registration Rights Agreement."
147
SHARES ELIGIBLE FOR FUTURE SALE
Prior to this offering, there has been no public market for our common stock. Future sales of our common stock in the public market, or the availability of such shares for sale in the public market, could adversely affect market prices prevailing from time to time. As described below, only a limited number of shares will be available for sale shortly after this offering due to contractual and legal restrictions on resale. Nevertheless, sales of a substantial number of shares of our common stock in the public market after such restrictions lapse, or the perception that those sales may occur, could adversely affect the prevailing market price at such time and our ability to raise equity-related capital at a time and price we deem appropriate.
Sales of Restricted Shares
Upon the closing of this offering, we will have outstanding an aggregate of shares of common stock. Of these shares, all of the shares of common stock to be sold in this offering will be freely tradable without restriction or further registration under the Securities Act, unless the shares are held by any of our "affiliates" as such term is defined in Rule 144 of the Securities Act. All remaining shares of common stock held by existing stockholders will be deemed "restricted securities" as such term is defined under Rule 144. The restricted securities were issued and sold by us in private transactions and are eligible for public sale only if registered under the Securities Act or if they qualify for an exemption from registration under Rule 144 or Rule 701 under the Securities Act, which rules are summarized below.
As a result of the lock-up agreements described below and the provisions of Rule 144 and Rule 701 under the Securities Act, all of the shares of our common stock (excluding the shares to be sold in this offering) will be available for sale in the public market upon the expiration of the lock-up agreements, beginning 180 days after the date of this prospectus (subject to extension) and when permitted under Rule 144 or Rule 701.
Lock-up Agreements
The underwriters expect that shares of our common stock, including all shares held by our directors, officers and certain of our other stockholders, will be subject to lock-up agreements that prohibit the disposition of those shares during the 180-day period beginning on the date of the final prospectus related to this offering, except with prior written consent of Citigroup Global Markets Inc. and Wells Fargo Securities, LLC and subject to certain exceptions. After the expiration of the 180-day restricted period, these shares may be sold in the public market in the United States, subject to prior registration in the United States, if required, or reliance upon an exemption from U.S. registration, including, in the case of shares held by affiliates of control persons, compliance with volume restrictions under Rule 144. See "Underwriting" for a description of these lock-up provisions.
Rule 144
In general, under Rule 144 as currently in effect, once we have been a reporting company subject to the reporting requirements of Section 13 or 15(d) of the Exchange Act for 90 days, a person (or persons whose shares are aggregated) who is not deemed to have been an affiliate of ours at any time during the three months preceding a sale, and who has beneficially owned restricted securities within the meaning of Rule 144 for at least six months (including any period of consecutive ownership of preceding non-affiliated holders) would be entitled to sell those shares, subject only to the availability of current public information about us. A non-affiliated person who has beneficially owned restricted securities within the meaning of Rule 144 for at least one year would be entitled to sell those shares without regard to the provisions of Rule 144.
148
Once we have been a reporting company subject to the reporting requirements of Section 13 or 15(d) of the Exchange Act for 90 days, a person (or persons whose shares are aggregated) who is deemed to be an affiliate of ours and who has beneficially owned restricted securities within the meaning of Rule 144 for at least six months would be entitled to sell within any three-month period a number of shares that does not exceed the greater of one percent of the then outstanding shares of our common stock or the average weekly trading volume of our common stock reported through NASDAQ during the four calendar weeks preceding the filing of notice of the sale. Such sales are also subject to certain manner of sale provisions, notice requirements and the availability of current public information about us.
Rule 701
Employees, directors, officers, consultants or advisors who purchases shares from us in connection with a compensatory stock or option plan or other written compensatory agreement in accordance with Rule 701 before the effective date of the registration statement of which this prospectus is a part are entitled to sell such shares 90 days after the effective date of the registration statement of which this prospectus is a part in reliance on Rule 144 without having to comply with the holding period requirement of Rule 144 and, in the case of non-affiliates, without having to comply with the public information, volume limitation or notice filing provisions of Rule 144. The SEC has indicated that Rule 701 will apply to typical stock options granted by an issuer before it becomes subject to the reporting requirements of the Exchange Act, along with the shares acquired upon exercise of such options, including exercises after the date of this prospectus.
Stock Issued Under Employee Plans
We intend to file a registration statement on Form S-8 under the Securities Act to register stock issuable under our 2011 Plan and our 2012 Plan. This registration statement is expected to be filed following the effective date of the registration statement of which this prospectus is a part and will be effective upon filing. Accordingly, shares registered under such registration statement will be available for sale in the open market following the effective date, unless such shares are subject to vesting restrictions with us, Rule 144 restrictions applicable to our affiliates or the lock-up restrictions described above.
Registration Rights
We will enter into a registration rights agreement with certain holders of our common stock prior to the completion of this offering. See "Certain Relationships and Related Party Transactions—Registration Rights Agreement."
149
MATERIAL U.S. FEDERAL INCOME TAX CONSIDERATIONS TO NON-U.S. HOLDERS
The following is a general discussion of the material U.S. federal income tax consequences of the acquisition, ownership and disposition of our common stock to a non-U.S. holder. For the purpose of this discussion, a non-U.S. holder is any beneficial owner of our common stock (other than a partnership or entity treated as a partnership for U.S. federal income tax purposes) that is not for U.S. federal income tax purposes any of the following:
- •
- an individual citizen or resident of the U.S., including an alien individual who is a lawful permanent resident of the
U.S. or who meets the "substantial presence" test under Section 7701(b) of the Internal Revenue Code of 1986, as amended, or the Code;
- •
- a corporation (or other entity treated as a corporation for U.S. federal income tax purposes) created or organized in the
U.S. or under the laws of the U.S. or any state or the District of Columbia;
- •
- an estate whose income is subject to U.S. federal income tax regardless of its source; or
- •
- a trust (x) whose administration is subject to the primary supervision of a U.S. court and which has one or more U.S. persons who have the authority to control all substantial decisions of the trust or (y) which has made a valid election to be treated as a U.S. person.
If a partnership (or an entity treated as a partnership for U.S. federal income tax purposes) holds our common stock, the tax treatment of a partner in the partnership will generally depend on the status of the partner and upon the activities of the partnership. Accordingly, we urge partnerships that hold our common stock and partners in such partnerships to consult their tax advisors.
This discussion assumes that a non-U.S. holder will hold our common stock issued pursuant to this offering as a capital asset (generally, property held for investment). This discussion does not address all aspects of U.S. federal income taxation or any aspects of estate, gift, alternative minimum tax, state, local or non-U.S. taxation, nor does it consider any U.S. federal income tax considerations that may be relevant to non-U.S. holders that may be subject to special treatment under U.S. federal income tax laws, including, without limitation, U.S. expatriates, insurance companies, tax-exempt or governmental organizations, dealers in securities or currency, banks or other financial institutions, investors whose functional currency is other than the U.S. dollar, registered investment companies, real estate investment trusts, "controlled foreign corporations," passive foreign investment companies, persons who own, directly or indirectly, more than 5% of our common stock, traders in securities that mark-to-market, investors who acquired our common stock through the exercise of employee stock options or otherwise as compensation or through a tax-qualified retirement plan, investors that hold our common stock as a result of a constructive sale and investors that hold our common stock as part of a hedge, straddle or conversion transaction. Furthermore, the following discussion is based on current provisions of the Code and Treasury Regulations and administrative and judicial interpretations thereof, all as in effect on the date hereof, and all of which are subject to change, possibly with retroactive effect.
We have not sought any ruling from the Internal Revenue Service, or the IRS, with respect to the statements made and the conclusions reached in the following discussion, and there can be no assurance that the IRS will agree with such statements and conclusions.
We urge each prospective investor to consult a tax advisor regarding the U.S. federal, state, local and non-U.S. income and other tax consequences of acquiring, holding and disposing of shares of our common stock.
150
Dividends
We have not paid any dividends on our common stock, and we do not plan to pay any dividends for the foreseeable future. However, if we do pay dividends on our common stock, those payments will constitute dividends for U.S. tax purposes to the extent paid from our current or accumulated earnings and profits, as determined under U.S. federal income tax principles. To the extent those dividends exceed our current and accumulated earnings and profits, the dividends will constitute a return of capital and will first reduce a non-U.S. holder's adjusted tax basis in the common stock, but not below zero, and then will be treated as gain from the sale of the common stock; see "—Gain on Disposition of Common Stock."
Any dividend (out of earnings and profits) paid to a non-U.S. holder of our common stock generally will be subject to U.S. withholding tax either at a rate of 30% of the gross amount of the dividend or such lower rate as may be specified by an applicable tax treaty. To receive the benefit of a reduced treaty rate, a non-U.S. holder must provide us with an IRS Form W-8BEN or other appropriate version of IRS Form W-8 certifying qualification for the reduced rate.
Dividends received by a non-U.S. holder that are effectively connected with a U.S. trade or business conducted by the non-U.S. holder (and, if required by an applicable tax treaty, attributable to a permanent establishment or fixed tax base maintained by the non-U.S. holder in the United States) are exempt from such withholding tax. To obtain this exemption, the non-U.S. holder must provide us with an IRS Form W-8ECI (or applicable substitute or successor form) properly certifying such exemption. Such effectively connected dividends, although not subject to withholding tax, will be subject to U.S. federal income tax on a net income basis at the regular graduated U.S. federal income tax rates in the same manner as if the non-U.S. holder were a U.S. person (as defined in the Code). In addition to the income tax described above, dividends received by corporate non-U.S. holders that are effectively connected with a U.S. trade or business of the corporate non-U.S. holder may be subject to a branch profits tax at a rate of 30% or such lower rate as may be specified by an applicable tax treaty.
A non-U.S. holder of our common stock may obtain a refund of any excess amounts withheld if the non-U.S. holder is eligible for a reduced rate of United States withholding tax and an appropriate claim for refund is timely filed with the IRS.
In certain circumstances, amounts received by a non-U.S. holder upon the redemption of our common stock may be treated as a dividend distribution with respect to the common stock, rather than as a payment in exchange for the common stock that results in the recognition of capital gain or loss, as described below (see "—Gain on Disposition of Common Stock"). In these circumstances, the redemption payment would be included in gross income as a dividend to the extent that such payment is made out of our earnings and profits (as described above). The determination of whether a redemption of common stock will be treated as a dividend distribution, rather than as a payment in exchange for the common stock, will depend on whether and to what extent the redemption reduces the non-U.S. holder's ownership in us. The rules applicable to redemptions are complex, and each non-U.S. holder should consult its own tax advisor to determine the consequences of a redemption to it.
Gain on Disposition of Common Stock
A non-U.S. holder generally will not be subject to U.S. federal income tax on any gain realized upon the sale or other disposition of our common stock unless:
- •
- the gain is effectively connected with a U.S. trade or business of the non-U.S. holder and, if required by an applicable tax treaty, is attributable to a permanent establishment or fixed base maintained by such non-U.S. holder in the United States;
151
- •
- the non-U.S. holder is an individual who is present in the U.S. for a period or periods aggregating
183 days or more during the calendar year in which the sale or disposition occurs and certain other conditions are met; or
- •
- we are or have been a "U.S. real property holding corporation" for U.S. federal income tax purposes during specified periods.
Unless an applicable tax treaty provides otherwise, gain described in the first bullet point above will be subject to U.S. federal income tax on a net income basis at the regular graduated U.S. federal income tax rates in the same manner as if the non-U.S. holder were a U.S. person (as defined in the Code). Corporate non-U.S. holders also may be subject to a branch profits tax equal to 30% (or such lower rate as may be specified by an applicable tax treaty) of its earnings and profits that are effectively connected with a U.S. trade or business.
Gain described in the second bullet point above (which may be offset by U.S. source capital losses, provided that the non-U.S. holder has timely filed U.S. federal income tax returns with respect to such losses) will be subject to a flat 30% U.S. federal income tax (or such lower rate as may be specified by an applicable tax treaty).
Non-U.S. holders should consult any applicable income tax treaties that may provide for different rules.
We believe that we currently are, and expect to remain for the foreseeable future, a "U.S. real property holding corporation." However, so long as our common stock is "regularly traded on an established securities market," a non-U.S. holder will be subject to U.S. federal net income tax on a disposition of our common stock only if the non-U.S. holder actually or constructively holds, or held at any time during the shorter of the five-year period preceding the date of disposition or the non-U.S. holder's holding period, more than 5% of our common stock. If our common stock is not considered to be so traded, all non-U.S. holders would be subject to U.S. federal net income tax on a disposition of our common stock, and a 10% withholding would apply to the gross proceeds from the sale of our common stock by a non-U.S. holder.
Backup Withholding and Information Reporting
Generally, we must report annually to the IRS the amount of dividends paid to each non-U.S. holder, the name and address of the recipient, and the amount, if any, of tax withheld with respect to those dividends. A similar report is sent to each non-U.S. holder. These information reporting requirements apply even if withholding was not required. Pursuant to tax treaties or other agreements, the IRS may make its reports available to tax authorities in the recipient's country of residence.
Payments of dividends to a non-U.S. holder may be subject to backup withholding (at the applicable rate) unless the non-U.S. holder establishes an exemption, for example, by properly certifying its non-U.S. status on an IRS Form W-8BEN or another appropriate version of IRS Form W-8. Notwithstanding the foregoing, backup withholding may apply if either we or our paying agent has actual knowledge, or reason to know, that the beneficial owner is a U.S. person that is not an exempt recipient.
Payments of the proceeds from sale or other disposition by a non-U.S. holder of our common stock effected outside the U.S. by or through a foreign office of a broker generally will not be subject to information reporting or backup withholding. However, information reporting (but not backup withholding) will apply to those payments if the broker does not have documentary evidence that the holder is a non-U.S. holder, an exemption is not otherwise established, and the broker has certain relationships with the U.S.
152
Payments of the proceeds from a sale or other disposition by a non-U.S. holder of our common stock effected by or through a U.S. office of a broker generally will be subject to information reporting and backup withholding (at the applicable rate) unless the non-U.S. holder establishes an exemption, for example, by properly certifying its non-U.S. status on an IRS Form W-8BEN or another appropriate version of IRS Form W-8. Notwithstanding the foregoing, information reporting and backup withholding may apply if the broker has actual knowledge, or reason to know, that the holder is a U.S. person that is not an exempt recipient.
Backup withholding is not an additional tax. Rather, the U.S. federal income tax liability of persons subject to backup withholding will be reduced by the amount of tax withheld. If withholding results in an overpayment of taxes, a refund may be obtained, provided that the required information is timely furnished to the IRS.
Legislation Affecting Common Stock Held Through Foreign Accounts
Recently enacted legislation will require, after December 31, 2012, withholding at a rate of 30% on dividends in respect of, and gross proceeds from the sale of, shares of our common stock held by or through certain foreign financial institutions (including investment funds), unless such institution enters into an agreement with the Secretary of the Treasury to, among other things, report, on an annual basis, information with respect to accounts with or shares in the institution held by certain U.S. persons and by certain non-U.S. entities that are wholly or partially owned by United States persons, and to withhold on payments made to certain account holders. Accordingly, the entity through which shares of our common stock is held will affect the determination of whether such withholding is required. Similarly, dividends in respect of, and gross proceeds from the sale of, shares of our common stock held by an investor that is a non-financial foreign entity will be subject to withholding at a rate of 30% if such entity or another non-financial foreign entity is the beneficial owner of the payment, unless, among other things, the beneficial owner or the payee either (i) certifies to us that such entity does not have any "substantial United States owners" or (ii) provides certain information regarding the entity's "substantial United States owners," which we will in turn provide to the Secretary of the Treasury. Non-U.S. Holders are encouraged to consult with their tax advisors.
153
There are certain considerations to be made in connection with the purchase of our common stock by (1) employee benefit plans that are subject to Title I of the United States Employee Retirement Income Security Act of 1974, as amended, or ERISA, (2) plans, individual retirement accounts, and other arrangements that are subject to Section 4975 of the Code or provisions under any federal, state, local, non-U.S., or other laws or regulations that are similar to such provisions of the Code or ERISA, which similar provisions are collectively referred to herein as "Similar Laws," and (3) entities whose underlying assets are considered to include "plan assets" of any such plan, account or arrangement, each of (1), (2) and (3), a "Plan."
ERISA and the Code impose certain duties on persons who are fiduciaries of a Plan subject to Title I of ERISA or Section 4975 of the Code, which Plan is referred to herein as an "ERISA Plan," and prohibit certain transactions involving the assets of an ERISA Plan and its fiduciaries or other interested parties. Under ERISA and the Code, any person who exercises any discretionary authority or control over the administration of such an ERISA Plan or the management or disposition of the assets of such an ERISA Plan, or who renders investment advice for a fee or other compensation to such a Plan, is generally considered to be a fiduciary of the ERISA Plan.
In considering an investment in our common stock using a portion of the assets of any Plan, a fiduciary should determine whether the investment is in accordance with the documents and instruments governing the Plan and the applicable provisions of ERISA, the Code or any Similar Law relating to a fiduciary's duties to the Plan including, without limitation, the prudence, diversification, delegation of control and prohibited transaction provisions of ERISA, the Code and any other applicable Similar Laws.
154
Citigroup Global Markets Inc. and Wells Fargo Securities, LLC are acting as joint book-running managers of this offering and as representatives of the underwriters named below. Subject to the terms and conditions stated in the underwriting agreement dated the date of this prospectus, each underwriter named below has severally agreed to purchase, and we have agreed to sell to that underwriter, the number of shares set forth opposite the underwriter's name.
Underwriter
|
Number of Shares | |
|---|---|---|
Citigroup Global Markets Inc. |
||
Wells Fargo Securities, LLC |
||
Total |
||
The underwriting agreement provides that the obligations of the underwriters to purchase the shares included in this offering are subject to approval of legal matters by counsel and to other conditions. The underwriters are obligated to purchase all the shares (other than those covered by the over-allotment option described below) if they purchase any of the shares.
Shares sold by the underwriters to the public will initially be offered at the initial public offering price set forth on the cover of this prospectus. Any shares sold by the underwriters to securities dealers may be sold at a discount from the initial public offering price not to exceed $ per share. If all the shares are not sold at the initial offering price, the underwriters may change the offering price and the other selling terms. The representatives have advised us that the underwriters do not intend to make sales to discretionary accounts.
If the underwriters sell more shares than the total number set forth in the table above, we have granted to the underwriters an option, exercisable for 30 days from the date of this prospectus, to purchase up to additional shares at the initial public offering price less the underwriting discount. The underwriters may exercise the option solely for the purpose of covering over-allotments, if any, in connection with this offering. To the extent the option is exercised, each underwriter must purchase a number of additional shares approximately proportionate to that underwriter's initial purchase commitment. Any shares issued or sold under the option will be issued and sold on the same terms and conditions as the other shares that are the subject of this offering.
We, our officers and directors, and certain of our other stockholders have agreed that, for a period of 180 days from the date of this prospectus, we and they will not, without the prior written consent of Citigroup Global Markets Inc. and Wells Fargo Securities, LLC, dispose of or hedge any shares or any securities convertible into or exchangeable for our common stock. Citigroup Global Markets Inc. and Wells Fargo Securities, LLC in their sole discretion may release any of the securities subject to these lock-up agreements at any time, which, in the case of officers and directors, shall be with notice. Notwithstanding the foregoing, if (i) during the last 17 days of the 180-day restricted period, we issue an earnings release or material news or a material event relating to our company occurs; or (ii) prior to the expiration of the 180-day restricted period, we announce that we will release earnings results during the 16-day period beginning on the last day of the 180-day restricted period, the restrictions described above shall continue to apply until the expiration of the 18-day period beginning on the issuance of the earnings release or the occurrence of the material news or material event.
Prior to this offering, there has been no public market for our shares. Consequently, the initial public offering price for the shares was determined by negotiations between us and the representatives. Among the factors considered in determining the initial public offering price were our results of operations, our current financial condition, our future prospects, our markets, the economic conditions in and future prospects for the industry in which we compete, our management, and currently
155
prevailing general conditions in the equity securities markets, including current market valuations of publicly traded companies considered comparable to our company. We cannot assure you, however, that the price at which the shares will sell in the public market after this offering will not be lower than the initial public offering price or that an active trading market in our shares will develop and continue after this offering.
We have applied to have our shares listed on NASDAQ under the symbol "CINC."
The following table shows the underwriting discounts and commissions that we are to pay to the underwriters in connection with this offering. These amounts are shown assuming both no exercise and full exercise of the underwriters' over-allotment option.
| |
No Exercise | Full Exercise | |||||
|---|---|---|---|---|---|---|---|
Per share |
$ | $ | |||||
Total |
$ | $ | |||||
We estimate that our portion of the total expenses of this offering will be $ .
In connection with this offering, the underwriters may purchase and sell shares in the open market. Purchases and sales in the open market may include short sales, purchases to cover short positions, which may include purchases pursuant to the over-allotment option, and stabilizing purchases.
- •
- Short sales involve secondary market sales by the underwriters of a greater number of shares than they are required to
purchase in this offering.
- •
- "Covered" short sales are sales of shares in an amount up to the number of shares represented by the underwriters'
over-allotment option.
- •
- "Naked" short sales are sales of shares in an amount in excess of the number of shares represented by the underwriters'
over-allotment option.
- •
- Covering transactions involve purchases of shares either pursuant to the underwriters' over-allotment option
or in the open market after the distribution has been completed in order to cover short positions.
- •
- To close a naked short position, the underwriters must purchase shares in the open market after the distribution has been
completed. A naked short position is more likely to be created if the underwriters are concerned that there may be downward pressure on the price of the shares in the open market after pricing that
could adversely affect investors who purchase in this offering.
- •
- To close a covered short position, the underwriters must purchase shares in the open market after the distribution has
been completed or must exercise the over-allotment option. In determining the source of shares to close the covered short position, the underwriters will consider, among other things, the
price of shares available for purchase in the open market as compared to the price at which they may purchase shares through the over-allotment option.
- •
- Stabilizing transactions involve bids to purchase shares so long as the stabilizing bids do not exceed a specified maximum.
Purchases to cover short positions and stabilizing purchases, as well as other purchases by the underwriters for their own accounts, may have the effect of preventing or retarding a decline in the market price of the shares. They may also cause the price of the shares to be higher than the price that would otherwise exist in the open market in the absence of these transactions. The underwriters may conduct these transactions on NASDAQ, in the over-the-counter market or otherwise. If the underwriters commence any of these transactions, they may discontinue them at any time.
156
Conflicts of Interest
Affiliates of each of Citigroup Global Markets Inc. and Wells Fargo Securities, LLC are lenders and, in the case of Wells Fargo Securities, LLC, agent for the lenders, under our senior secured revolving credit facility and second lien term loan facility. Because these affiliates will receive in excess of 5% of the net proceeds of this offering in connection with our repayment of amounts outstanding under our senior secured revolving credit facility and second lien term loan facility, a "conflict of interest" under Financial Industry Regulatory Authority ("FINRA") Rule 5121 is deemed to exist. Accordingly, this offering is being made in compliance with FINRA Rule 5121. FINRA Rule 5121 requires that a "qualified independent underwriter" participate in the preparation of this prospectus and the registration statement of which this prospectus is a part and exercise the usual standards of due diligence with respect thereto. has assumed the responsibilities of acting as the qualified independent underwriter in this offering. No underwriter having a conflict of interest under FINRA Rule 5121 will confirm sales to any account over which the underwriter exercised discretionary authority without the specific written approval of the accountholder. will not receive any additional fees for serving as qualified independent underwriter in connection with this offering. We have agreed to indemnify against liabilities incurred in connection with acting as a qualified independent underwriter, including liabilities under the Securities Act.
The underwriters are full service financial institutions engaged in various activities, which may include securities trading, commercial and investment banking, financial advisory, investment management, principal investment, hedging, financing and brokerage activities. Certain of the underwriters and their respective affiliates have in the past performed commercial banking, investment banking and advisory services for us from time to time for which they have received customary fees and reimbursement of expenses and may, from time to time, engage in transactions with and perform services for us in the ordinary course of their business for which they may receive customary fees and reimbursement of expenses. In the ordinary course of their various business activities, the underwriters and their respective affiliates may make or hold a broad array of investments and actively trade debt and equity securities (or related derivative securities) and financial instruments (which may include bank loans and/or credit default swaps) for their own account and for the accounts of their customers and may at any time hold long and short positions in such securities and instruments. Such investment and securities activities may involve our securities and instruments.
We have agreed to indemnify the underwriters against certain liabilities, including liabilities under the Securities Act, or to contribute to payments the underwriters may be required to make because of any of those liabilities.
Notice to Prospective Investors in the European Economic Area
In relation to each member state of the European Economic Area that has implemented the Prospectus Directive (each, a relevant member state), with effect from and including the date on which the Prospectus Directive is implemented in that relevant member state (the relevant implementation date), an offer of shares described in this prospectus may not be made to the public in that relevant member state other than:
- •
- to any legal entity which is a qualified investor as defined in the Prospectus Directive;
- •
- to fewer than 100 or, if the relevant member state has implemented the relevant provision of the 2010 PD Amending
Directive, 150 natural or legal persons (other than qualified investors as defined in the Prospectus Directive), as permitted under the Prospectus Directive, subject to obtaining the prior consent of
the relevant Dealer or Dealers nominated by us for any such offer; or
- •
- in any other circumstances falling within Article 3(2) of the Prospectus Directive,
157
provided that no such offer of shares shall require us or any underwriter to publish a prospectus pursuant to Article 3 of the Prospectus Directive.
For purposes of this provision, the expression an "offer of securities to the public" in any relevant member state means the communication in any form and by any means of sufficient information on the terms of the offer and the shares to be offered so as to enable an investor to decide to purchase or subscribe for the shares, as the expression may be varied in that member state by any measure implementing the Prospectus Directive in that member state, and the expression "Prospectus Directive" means Directive 2003/71/EC (and amendments thereto, including the 2010 PD Amending Directive, to the extent implemented in the relevant member state) and includes any relevant implementing measure in the relevant member state. The expression 2010 PD Amending Directive means Directive 2010/73/EU.
The sellers of the shares have not authorized and do not authorize the making of any offer of shares through any financial intermediary on their behalf, other than offers made by the underwriters with a view to the final placement of the shares as contemplated in this prospectus. Accordingly, no purchaser of the shares, other than the underwriters, is authorized to make any further offer of the shares on behalf of the sellers or the underwriters.
Notice to Prospective Investors in the United Kingdom
This prospectus is only being distributed to, and is only directed at, persons in the United Kingdom that are qualified investors within the meaning of Article 2(1)(e) of the Prospectus Directive that are also (i) investment professionals falling within Article 19(5) of the Financial Services and Markets Act 2000 (Financial Promotion) Order 2005 (the "Order") or (ii) high net worth entities, and other persons to whom it may lawfully be communicated, falling within Article 49(2)(a) to (d) of the Order (each such person being referred to as a "relevant person"). This prospectus and its contents are confidential and should not be distributed, published or reproduced (in whole or in part) or disclosed by recipients to any other persons in the United Kingdom. Any person in the United Kingdom that is not a relevant person should not act or rely on this document or any of its contents.
Notice to Prospective Investors in France
Neither this prospectus nor any other offering material relating to the shares described in this prospectus has been submitted to the clearance procedures of the Autorité des Marchés Financiers or of the competent authority of another member state of the European Economic Area and notified to the Autorité des Marchés Financiers. The shares have not been offered or sold and will not be offered or sold, directly or indirectly, to the public in France. Neither this prospectus nor any other offering material relating to the shares has been or will be:
- •
- released, issued, distributed or caused to be released, issued or distributed to the public in France; or
- •
- used in connection with any offer for subscription or sale of the shares to the public in France.
Such offers, sales and distributions will be made in France only:
- •
- to qualified investors (investisseurs qualifiés) and/or to
a restricted circle of investors (cercle restreint d'investisseurs), in each case investing for their own account, all as defined in, and in accordance
with articles L.411-2, D.411-1, D.411-2, D.734-1, D.744-1, D.754-1 and D.764-1 of the French Code monétaire et financier;
- •
- to investment services providers authorized to engage in portfolio management on behalf of third parties; or
158
- •
- in a transaction that, in accordance with article L.411-2-II-1°-or-2°-or 3° of the French Code monétaire et financier and article 211-2 of the General Regulations (Règlement Général) of the Autorité des Marchés Financiers, does not constitute a public offer (appel public à l'épargne).
The shares may be resold directly or indirectly, only in compliance with articles L.411-1, L.411-2, L.412-1 and L.621-8 through L.621-8-3 of the French Code monétaire et financier.
Notice to Prospective Investors in Hong Kong
The shares may not be offered or sold in Hong Kong by means of any document other than (i) in circumstances which do not constitute an offer to the public within the meaning of the Companies Ordinance (Cap. 32, Laws of Hong Kong), or (ii) to "professional investors" within the meaning of the Securities and Futures Ordinance (Cap. 571, Laws of Hong Kong) and any rules made thereunder, or (iii) in other circumstances which do not result in the document being a "prospectus" within the meaning of the Companies Ordinance (Cap. 32, Laws of Hong Kong) and no advertisement, invitation or document relating to the shares may be issued or may be in the possession of any person for the purpose of issue (in each case whether in Hong Kong or elsewhere), which is directed at, or the contents of which are likely to be accessed or read by, the public in Hong Kong (except if permitted to do so under the laws of Hong Kong) other than with respect to shares which are or are intended to be disposed of only to persons outside Hong Kong or only to "professional investors" within the meaning of the Securities and Futures Ordinance (Cap. 571, Laws of Hong Kong) and any rules made thereunder.
Notice to Prospective Investors in Japan
The shares offered in this prospectus have not been registered under the Securities and Exchange Law of Japan. The shares have not been offered or sold and will not be offered or sold, directly or indirectly, in Japan or to or for the account of any resident of Japan, except (i) pursuant to an exemption from the registration requirements of the Securities and Exchange Law and (ii) in compliance with any other applicable requirements of Japanese law.
Notice to Prospective Investors in Singapore
This prospectus has not been registered as a prospectus with the Monetary Authority of Singapore. Accordingly, this prospectus and any other document or material in connection with the offer or sale, or invitation for subscription or purchase, of the shares may not be circulated or distributed, nor may the shares be offered or sold, or be made the subject of an invitation for subscription or purchase, whether directly or indirectly, to persons in Singapore other than (i) to an institutional investor under Section 274 of the Securities and Futures Act, Chapter 289 of Singapore (the "SFA"), (ii) to a relevant person pursuant to Section 275(1), or any person pursuant to Section 275(1A), and in accordance with the conditions specified in Section 275 of the SFA or (iii) otherwise pursuant to, and in accordance with the conditions of, any other applicable provision of the SFA, in each case subject to compliance with conditions set forth in the SFA.
Where the shares are subscribed or purchased under Section 275 of the SFA by a relevant person which is:
- •
- a corporation (which is not an accredited investor (as defined in Section 4A of the SFA)) the sole business of
which is to hold investments and the entire share capital of which is owned by one or more individuals, each of whom is an accredited investor; or
- •
- a trust (where the trustee is not an accredited investor) whose sole purpose is to hold investments and each beneficiary of the trust is an individual who is an accredited investor,
159
shares, debentures and units of shares and debentures of that corporation or the beneficiaries' rights and interest (howsoever described) in that trust shall not be transferred within six months after that corporation or that trust has acquired the shares pursuant to an offer made under Section 275 of the SFA except:
- •
- to an institutional investor (for corporations, under Section 274 of the SFA) or to a relevant person defined in
Section 275(2) of the SFA, or to any person pursuant to an offer that is made on terms that such shares, debentures and units of shares and debentures of that corporation or such rights and
interest in that trust are acquired at a consideration of not less than S$200,000 (or its equivalent in a foreign currency) for each transaction, whether such amount is to be paid for in cash or by
exchange of securities or other assets, and further for corporations, in accordance with the conditions specified in Section 275 of the SFA;
- •
- where no consideration is or will be given for the transfer; or
- •
- where the transfer is by operation of law.
160
The validity of the shares of common stock offered by this prospectus will be passed upon for Cinco Resources, Inc. by Thompson & Knight LLP, Dallas, Texas. Certain legal matters in connection with this offering will be passed upon for the underwriters by Vinson & Elkins L.L.P., Dallas, Texas.
Our consolidated financial statements as of December 31, 2009 and 2010 and for each of the three years in the period ended December 31, 2010 included in this prospectus have been so included in reliance on the report of Hein & Associates LLP, an independent registered public accounting firm, given on the authority of said firm as experts in auditing and accounting.
The estimates of our proved reserves as of December 31, 2009, December 31, 2010 and May 31, 2011 included in this prospectus are based on a reserve report prepared by Netherland, Sewell & Associates, Inc., our independent reserve engineers. These estimates are included in this prospectus in reliance upon the authority of the firm as experts in these matters.
WHERE YOU CAN FIND MORE INFORMATION
We have filed with the SEC a registration statement on Form S-1 (including the exhibits, schedules and amendments thereto) under the Securities Act, with respect to the shares of our common stock offered hereby. This prospectus does not contain all of the information set forth in the registration statement and the exhibits and schedules thereto. For further information with respect to us and the common stock offered hereby, we refer you to the registration statement and the exhibits and schedules filed therewith. Statements contained in this prospectus as to the contents of any contract, agreement or any other document are summaries of the material terms of this contract, agreement or other document. With respect to each of these contracts, agreements or other documents filed as an exhibit to the registration statement, reference is made to the exhibits for a more complete description of the matter involved. A copy of the registration statement, and the exhibits and schedules thereto, may be inspected without charge at the public reference facilities maintained by the SEC at 100 F Street NE, Washington, D.C. 20549. Copies of these materials may be obtained, upon payment of a duplicating fee, from the Public Reference Section of the SEC at 100 F Street NE, Washington, D.C. 20549. Please call the SEC at 1-800-SEC-0330 for further information on the operation of the public reference facility. The SEC maintains a website that contains reports, proxy and information statements and other information regarding registrants that file electronically with the SEC. The address of the SEC's website is http://www.sec.gov.
After we have completed this offering, we will file annual, quarterly and current reports, proxy statements and other information with the SEC. We expect to have an operational website concurrently with the completion of this offering and we expect to make our periodic reports and other information filed with or furnished to the SEC available, free of charge, through our website, as soon as reasonably practicable after those reports and other information are electronically filed with or furnished to the SEC. Information on our website or any other website is not incorporated by reference into this prospectus and does not constitute a part of this prospectus. You may read and copy any reports, statements or other information on file at the public reference rooms. You can also request copies of these documents, for a copying fee, by writing to the SEC, or you can review these documents on the SEC's website, as described above. In addition, we will provide electronic or paper copies of our filings free of charge upon request.
161
INDEX TO CONSOLIDATED FINANCIAL STATEMENTS
OF CINCO RESOURCES, INC.
F-1
REPORT OF INDEPENDENT REGISTERED PUBLIC ACCOUNTING FIRM
To
the Board of Directors and Stockholders
Cinco Resources, Inc.
We have audited the accompanying consolidated balance sheets of Cinco Resources, Inc. and subsidiaries (collectively, the "Company") as of December 31, 2009 and 2010, and the related consolidated statements of operations, changes in stockholders' equity and cash flows for each of the three years in the period ended December 31, 2010. These financial statements are the responsibility of the Company's management. Our responsibility is to express an opinion on these financial statements based on our audits.
We conducted our audits in accordance with the standards of the Public Company Accounting Oversight Board (United States). Those standards require that we plan and perform the audit to obtain reasonable assurance about whether the financial statements are free of material misstatement. The Company is not required to have, nor were we engaged to perform, an audit of its internal control over financial reporting. Our audits included consideration of internal control over financial reporting as a basis for designing audit procedures that are appropriate in the circumstances, but not for the purpose of expressing an opinion on the effectiveness of the Company's internal control over financial reporting. Accordingly, we express no such opinion. An audit also includes examining, on a test basis, evidence supporting the amounts and disclosures in the financial statements, assessing the accounting principles used and significant estimates made by management, as well as evaluating the overall financial statement presentation. We believe that our audits provide a reasonable basis for our opinion.
In our opinion, the consolidated financial statements referred to above present fairly, in all material respects, the financial position of Cinco Resources, Inc. and subsidiaries as of December 31, 2009 and 2010, and the results of their operations and their cash flows for each of the three years in the period ended December 31, 2010, in conformity with U.S. generally accepted accounting principles.
/s/
Hein & Associates LLP
Dallas, Texas
January 12, 2012
F-2
Cinco Resources, Inc.
Consolidated Balance Sheets
(Amounts in thousands, except shares and per-share amounts)
| |
As of December 31, | ||||||
|---|---|---|---|---|---|---|---|
| |
2009 | 2010 | |||||
ASSETS |
|||||||
CURRENT ASSETS: |
|||||||
Cash and cash equivalents |
$ | 9,647 | $ | 37,982 | |||
Accounts receivable, net: |
|||||||
Joint interest owners |
5,970 | 12,219 | |||||
Natural gas and oil sales |
2,633 | 2,209 | |||||
Oilfield inventory |
2,167 | 624 | |||||
Derivative assets |
59 | 3,522 | |||||
Deferred tax assets |
377 | — | |||||
Prepaid expenses and other current assets |
1,372 | 1,230 | |||||
Assets of discontinued operations |
8,154 | 18,302 | |||||
Total current assets |
30,379 | 76,088 | |||||
PROPERTY AND EQUIPMENT: |
|||||||
Natural gas and oil properties, at cost, using the successful efforts method of accounting |
291,554 | 395,813 | |||||
Other property and equipment, at cost |
1,973 | 1,110 | |||||
|
293,527 | 396,923 | |||||
Less: accumulated depletion, depreciation and amortization |
(137,166 | ) | (169,471 | ) | |||
Net property and equipment |
156,361 | 227,452 | |||||
OTHER NON-CURRENT ASSETS: |
|||||||
Derivative assets |
1,243 | 1,618 | |||||
Deferred tax assets |
— | 970 | |||||
Assets of discontinued operations |
14,324 | — | |||||
Other |
2,454 | 1,988 | |||||
Total other non-current assets |
18,021 | 4,576 | |||||
Total assets |
$ | 204,761 | $ | 308,116 | |||
LIABILITIES AND STOCKHOLDERS' EQUITY |
|||||||
CURRENT LIABILITIES: |
|||||||
Accounts payable |
$ | 384 | $ | 1,708 | |||
Accrued liabilities |
11,724 | 42,061 | |||||
Derivative liabilities |
866 | 248 | |||||
Natural gas and oil sales payable |
5,662 | 2,895 | |||||
Advances from joint interest owners |
4,027 | 4,316 | |||||
Liabilities of discontinued operations |
2,276 | 1,980 | |||||
Deferred tax liabilities |
— | 970 | |||||
Total current liabilities |
24,939 | 54,178 | |||||
NON-CURRENT LIABILITIES: |
|||||||
Long-term debt |
70,700 | 86,000 | |||||
Derivative liabilities |
— | 159 | |||||
Asset retirement obligations |
6,221 | 6,592 | |||||
Deferred tax liabilities |
377 | — | |||||
Total liabilities |
102,237 | 146,929 | |||||
COMMITMENTS AND CONTINGENCIES (NOTE 13) |
|||||||
STOCKHOLDERS' EQUITY: |
|||||||
Series A convertible preferred stock—$0.10 par value, 625,000 shares authorized; 525,000 shares issued and outstanding at both years; liquidation preference of $105,000 |
53 | 53 | |||||
Common stock—$0.10 par value, 2,675,000 and 4,075,000 shares authorized, respectively; 1,797,337 and 2,844,082 shares issued and outstanding, respectively |
180 | 284 | |||||
Additional paid-in-capital |
243,718 | 342,489 | |||||
Notes receivable from stockholders |
(26,142 | ) | (32,858 | ) | |||
Accumulated deficit |
(115,285 | ) | (148,781 | ) | |||
Total stockholders' equity |
102,524 | 161,187 | |||||
Total liabilities and stockholders' equity |
$ | 204,761 | $ | 308,116 | |||
See accompanying notes to these consolidated financial statements.
F-3
Cinco Resources, Inc.
Consolidated Statements of Operations
(Amounts in thousands, except shares and per-share amounts)
| |
For the years ended December 31, | |||||||||
|---|---|---|---|---|---|---|---|---|---|---|
| |
2008 | 2009 | 2010 | |||||||
REVENUES: |
||||||||||
Natural gas sales |
$ | 13,978 | $ | 12,079 | $ | 23,453 | ||||
Oil sales |
5,477 | 2,539 | 3,723 | |||||||
Natural gas liquids sales |
1,290 | 834 | 964 | |||||||
Total revenues |
20,745 | 15,452 | 28,140 | |||||||
OPERATING EXPENSES: |
||||||||||
Lease operating |
4,326 | 4,947 | 6,687 | |||||||
Workovers |
3,434 | 764 | 1,993 | |||||||
Severance and ad valorem taxes |
1,287 | 1,265 | 1,803 | |||||||
Exploration |
6,839 | 1,547 | 3,579 | |||||||
Depletion, depreciation and amortization |
7,130 | 13,208 | 17,288 | |||||||
Impairment of natural gas and oil properties |
4,536 | 7,963 | 20,788 | |||||||
General and administrative |
9,083 | 25,700 | 16,711 | |||||||
Total operating expenses |
36,635 | 55,394 | 68,849 | |||||||
OPERATING LOSS |
(15,890 |
) |
(39,942 |
) |
(40,709 |
) |
||||
OTHER INCOME (EXPENSE): |
||||||||||
Gain on property sales |
168 | 46 | 802 | |||||||
Gain on derivative instruments |
— | 63 | 7,865 | |||||||
Interest expense |
(425 | ) | (4,582 | ) | (6,787 | ) | ||||
Other income (expense) |
746 | 160 | (566 | ) | ||||||
Total other income (expense) |
489 | (4,313 | ) | 1,314 | ||||||
LOSS FROM CONTINUING OPERATIONS BEFORE TAXES |
(15,401 | ) | (44,255 | ) | (39,395 | ) | ||||
INCOME TAX EXPENSE |
(16 |
) |
(33 |
) |
(13 |
) |
||||
LOSS FROM CONTINUING OPERATIONS |
(15,417 | ) | (44,288 | ) | (39,408 | ) | ||||
INCOME FROM DISCONTINUED OPERATIONS |
— |
2,150 |
5,912 |
|||||||
NET LOSS |
(15,417 | ) | (42,138 | ) | (33,496 | ) | ||||
LESS: NET LOSS ATTRIBUTABLE TO NON-CONTROLLING INTERESTS |
— |
1,365 |
— |
|||||||
NET LOSS ATTRIBUTABLE TO CINCO RESOURCES, INC. STOCKHOLDERS |
$ | (15,417 | ) | $ | (40,773 | ) | $ | (33,496 | ) | |
EARNINGS PER COMMON SHARE: |
||||||||||
Basic and diluted from continuing operations |
$ | (21.46 | ) | $ | (29.50 | ) | $ | (18.24 | ) | |
Basic and diluted from discontinued operations |
— | 1.48 | 2.74 | |||||||
Total basic and diluted |
$ | (21.46 | ) | $ | (28.02 | ) | $ | (15.50 | ) | |
WEIGHTED AVERAGE SHARES OUTSTANDING: |
||||||||||
Basic and diluted |
718,437 | 1,455,087 | 2,160,654 | |||||||
See accompanying notes to these consolidated financial statements.
F-4
Consolidated Statements of Changes in Stockholders' Equity
For the years ended December 31, 2008, 2009 and 2010
(Amounts in thousands, except shares and per-share amounts)
| |
Preferred Stock | Common Stock | |
Notes Receivable from Stockholders |
|
|
|
|||||||||||||||||||||
|---|---|---|---|---|---|---|---|---|---|---|---|---|---|---|---|---|---|---|---|---|---|---|---|---|---|---|---|---|
| |
Additional Paid-in Capital |
Accumulated Deficit |
Non-controlling Interests |
|
||||||||||||||||||||||||
| |
Shares | Amount | Shares | Amount | Total | |||||||||||||||||||||||
BALANCES, January 1, 2008 |
— | $ | — | 609,470 | $ | 61 | $ | 134,372 | $ | (6,076 | ) | $ | (59,095 | ) | $ | — | $ | 69,262 | ||||||||||
Issuance of common stock for cash |
— | — | 125,000 | 12 | 24,988 | — | — | — | 25,000 | |||||||||||||||||||
Issuance of common stock pursuant to conversion of note payable to related party |
— | — | 25,000 | 3 | 4,997 | — | — | — | 5,000 | |||||||||||||||||||
Issuance of common stock pursuant to exercise of stock options |
— | — | 300 | — | 48 | — | — | — | 48 | |||||||||||||||||||
Issuance of common stock awards |
— | — | 35,398 | 4 | (4 | ) | — | — | — | — | ||||||||||||||||||
Share-based compensation expense |
— | — | — | — | 1,825 | — | — | — | 1,825 | |||||||||||||||||||
Interest on notes receivable from stockholders, net of tax |
— | — | — | — | 364 | (364 | ) | — | — | — | ||||||||||||||||||
Repurchase and cancellation of common stock, at cost |
— | — | — | — | (20 | ) | — | — | — | (20 | ) | |||||||||||||||||
Net loss |
— | — | — | — | — | — | (15,417 | ) | — | (15,417 | ) | |||||||||||||||||
BALANCES, December 31, 2008 |
— | — | 795,168 | 80 | 166,570 | (6,440 | ) | (74,512 | ) | — | 85,698 | |||||||||||||||||
Issuance of preferred stock for cash |
525,000 | 53 | — | — | 104,947 | — | — | — | 105,000 | |||||||||||||||||||
Redemption of notes receivable from officers in exchange for return of common stock |
— | — | (32,504 | ) | (3 | ) | (6,498 | ) | 6,501 | — | — | — | ||||||||||||||||
Acquisition of company under common control |
— | — | 683,305 | 68 | (33,358 | ) | (13,016 | ) | — | (6,578 | ) | (52,884 | ) | |||||||||||||||
Exchanges of stock options for common stock |
— | — | 13,028 | 1 | (1 | ) | — | — | — | — | ||||||||||||||||||
Issuance of common stock awards |
— | — | 112,450 | 11 | (11 | ) | — | — | — | — | ||||||||||||||||||
Repurchase and cancellation of common stock, at cost |
— | — | (6,195 | ) | — | (837 | ) | — | — | — | (837 | ) | ||||||||||||||||
Share-based compensation expense |
— | — | — | — | 5,287 | — | — | — | 5,287 | |||||||||||||||||||
Issuance of warrants |
— | — | — | — | 710 | — | — | — | 710 | |||||||||||||||||||
Loss on settlement |
— | — | — | — | — | 1,688 | — | — | 1,688 | |||||||||||||||||||
Acquisition of non-controlling interests |
— | — | 131,565 | 13 | (7,956 | ) | — | — | 7,943 | — | ||||||||||||||||||
Issuance of common stock for notes receivable |
— | — | 100,520 | 10 | 14,312 | (14,322 | ) | — | — | — | ||||||||||||||||||
Interest on notes receivable from stockholders, net of tax |
— | — | — | — | 553 | (553 | ) | — | — | — | ||||||||||||||||||
Net loss |
— | — | — | — | — | — | (40,773 | ) | (1,365 | ) | (42,138 | ) | ||||||||||||||||
BALANCES, December 31, 2009 |
525,000 | 53 | 1,797,337 | 180 | 243,718 | (26,142 | ) | (115,285 | ) | — | 102,524 | |||||||||||||||||
Issuance of common stock for cash |
— | — | 840,000 | 84 | 83,916 | — | — | — | 84,000 | |||||||||||||||||||
Issuance of common stock for notes receivable |
— | — | 59,300 | 6 | 5,924 | (5,930 | ) | — | — | — | ||||||||||||||||||
Issuance of common stock awards |
— | — | 157,666 | 16 | (16 | ) | — | — | — | — | ||||||||||||||||||
Repurchase and cancellation of common stock, at cost |
— | — | (9,771 | ) | (1 | ) | (563 | ) | — | — | — | (564 | ) | |||||||||||||||
Share-based compensation expense |
— | — | — | — | 8,723 | — | — | — | 8,723 | |||||||||||||||||||
Forfeiture of common stock awards |
— | — | (450 | ) | (1 | ) | 1 | — | — | — | — | |||||||||||||||||
Interest on notes receivable from stockholders, net of tax |
— | — | — | — | 786 | (786 | ) | — | — | — | ||||||||||||||||||
Net loss |
— | — | — | — | — | — | (33,496 | ) | — | (33,496 | ) | |||||||||||||||||
BALANCES, December 31, 2010 |
525,000 | $ | 53 | 2,844,082 | $ | 284 | $ | 342,489 | $ | (32,858 | ) | $ | (148,781 | ) | $ | — | $ | 161,187 | ||||||||||
See accompanying notes to these consolidated financial statements.
F-5
Cinco Resources, Inc.
Consolidated Statements of Cash Flows
(Amounts in thousands)
| |
For the years ended December 31, |
|||||||||
|---|---|---|---|---|---|---|---|---|---|---|
| |
2008 | 2009 | 2010 | |||||||
CASH FLOWS FROM OPERATING ACTIVITIES: |
||||||||||
Net loss |
$ | (15,417 | ) | $ | (42,138 | ) | $ | (33,496 | ) | |
Adjustments to reconcile net loss to net cash provided by (used in) operating activities: |
||||||||||
Exploration expense |
6,839 | 1,534 | 3,575 | |||||||
Depletion, depreciation and amortization |
7,130 | 15,150 | 19,515 | |||||||
Impairment of natural gas and oil properties |
4,536 | 8,071 | 20,923 | |||||||
Share-based compensation expense |
1,825 | 5,287 | 8,723 | |||||||
Issuance of warrants |
— | 710 | — | |||||||
Loss on settlement |
— | 1,910 | — | |||||||
Gain on property sales |
(168 | ) | (46 | ) | (2,881 | ) | ||||
Unrealized gain on derivative instruments |
— | (436 | ) | (4,297 | ) | |||||
Amortization of loan fees |
— | 190 | 843 | |||||||
Changes in operating assets and liabilities: |
||||||||||
Accounts receivable, net |
1,264 | 6,374 | (5,825 | ) | ||||||
Oilfield inventory |
117 | 454 | 1,345 | |||||||
Prepaid expenses and other current assets |
122 | 541 | 142 | |||||||
Accounts payable |
(1,358 | ) | (34,810 | ) | 1,324 | |||||
Accrued liabilities |
837 | 768 | 7,171 | |||||||
Natural gas and oil sales payable |
299 | (2,831 | ) | (2,756 | ) | |||||
Advances from joint interest owners |
1,190 | (750 | ) | 289 | ||||||
Other non-current assets and liabilities |
96 | (5 | ) | 139 | ||||||
Net cash provided by (used in) operating activities |
7,312 | (40,027 | ) | 14,734 | ||||||
CASH FLOWS FROM INVESTING ACTIVITIES: |
||||||||||
Exploration and development of natural gas and oil properties |
(26,651 | ) | (25,032 | ) | (92,640 | ) | ||||
Proceeds from property sales |
3,326 | 3,455 | 8,409 | |||||||
Acquisition of natural gas and oil properties |
(8,671 | ) | (3,384 | ) | (299 | ) | ||||
Cash acquired upon acquisition of Dernick Resources, Inc. |
— | 67 | — | |||||||
Other property and equipment additions |
(248 | ) | (259 | ) | (89 | ) | ||||
Net cash used in investing activities |
(32,244 | ) | (25,153 | ) | (84,619 | ) | ||||
CASH FLOWS FROM FINANCING ACTIVITIES: |
||||||||||
Payment of debt issuance costs |
— | (2,137 | ) | (516 | ) | |||||
Borrowings under revolving line of credit |
18,000 | 4,500 | 29,300 | |||||||
Repayments under revolving line of credit |
(6,863 | ) | (50,540 | ) | (14,000 | ) | ||||
Proceeds from issuance of Series A Convertible Preferred Stock |
— | 105,000 | — | |||||||
Proceeds from issuance of common stock |
25,048 | — | 84,000 | |||||||
Repurchase and cancellation of common stock |
(20 | ) | (837 | ) | (564 | ) | ||||
Net cash provided by financing activities |
36,165 | 55,986 | 98,220 | |||||||
NET INCREASE (DECREASE) IN CASH AND CASH EQUIVALENTS |
11,233 | (9,194 | ) | 28,335 | ||||||
CASH AND CASH EQUIVALENTS, beginning of year |
7,608 | 18,841 | 9,647 | |||||||
CASH AND CASH EQUIVALENTS, end of year |
$ | 18,841 | $ | 9,647 | $ | 37,982 | ||||
SUPPLEMENTAL DISCLOSURE OF CASH FLOW INFORMATION: |
||||||||||
Cash paid during the period: |
||||||||||
Interest |
$ | 146 | $ | 3,596 | $ | 4,737 | ||||
Taxes |
16 | 33 | 13 | |||||||
SUPPLEMENTAL DISCLOSURE OF NON-CASH TRANSACTIONS: |
||||||||||
Accrual of interest on stockholder notes receivable |
364 | 553 | 786 | |||||||
Redemption of notes receivable from officers in exchange for common stock |
— | 6,501 | — | |||||||
Issuance of common stock in exchange for acquisition of note receivable, related party |
5,000 | — | — | |||||||
Capitalized asset retirement obligations |
3,183 | 1,651 | 57 | |||||||
Distribution of personal property to former officers |
— | 220 | — | |||||||
See accompanying notes to these consolidated financial statements.
F-6
Cinco Resources, Inc.
Notes to Consolidated Financial Statements
(Amounts in thousands, except shares and per-share amounts)
1. Nature of Business and Organization
Nature of Business
Cinco Resources, Inc. (together with its subsidiaries, "Cinco," "we," "us," or "our") is an independent energy company focused on the acquisition and development of unconventional oil and natural gas resources. Our properties are located primarily in three core areas: the Eagle Ford Shale in South Texas, the Powder River Basin of Wyoming and the Woodford Shale in the Arkoma Basin of Eastern Oklahoma.
Organization
Cinco was formed on August 1, 2002, as a Delaware corporation by certain members of our senior management team and private investment funds managed by Yorktown Partners LLC ("Yorktown").
On March 9, 2009, we acquired approximately 85% of the outstanding common stock of Dernick Resources, LLC ("DRI"), an entity under common control, in exchange for 683,305 shares of our common stock. On August 9, 2009, we acquired the remaining outstanding shares of DRI in exchange for 131,565 shares of our common stock along with the issuance of warrants and other payments. The acquisition of DRI represents a combination of companies under common control. As we did not acquire 100% of DRI's common stock on the initial acquisition date, we have not consolidated DRI's financial position and results from operations prior to March 9, 2009, as we have for other acquisitions of other companies under common control. See Note 5—Combination of Companies Under Common Control.
On March 31, 2009, we acquired all of the outstanding common stock of Centurion Exploration Company, LLC ("Centurion"), a company under common control. The stockholders of Centurion received 19 shares of our common stock in exchange for all of Centurion's common stock outstanding at that date. Prior to our combination with Centurion, Centurion had a note payable to certain funds managed by Yorktown which had a principal balance of $5,000 on January 1, 2008. During the year ended December 31, 2008, the amounts outstanding under this note payable were converted into 25,000 shares of our common stock. All common stock and per share amounts in the accompanying consolidated financial statements and notes to consolidated financial statements have been adjusted for all periods to give effect to the acquisition of Centurion.
On March 31, 2010, our management and funds managed by Yorktown formed Cima Resources, Inc. ("Cima"), a Delaware corporation and company under common control, for the purpose of exploring, developing, acquiring and producing natural gas and oil properties in the Eagle Ford Shale in South Texas. We managed the corporate affairs of Cima and served as operator of its natural gas and oil properties until November 17, 2011, when we acquired all of the outstanding shares of common stock of Cima. The stockholders of Cima received one share of our common stock in exchange for each share of Cima's common stock held by them at that date. All shares of common stock and per share amounts in the accompanying consolidated financial statements and notes to consolidated financial statements have been adjusted for all periods to give effect to the acquisition of Cima. See Note 17—Subsequent Events for further discussion.
F-7
Cinco Resources, Inc.
Notes to Consolidated Financial Statements (Continued)
(Amounts in thousands, except shares and per-share amounts)
2. Summary of Significant Accounting Policies
Consolidation and Basis of Presentation
The accompanying audited consolidated financial statements have been prepared in accordance with accounting principles generally accepted in the United States of America ("U.S. GAAP") and include the accounts of the Company and its wholly-owned subsidiaries, Cinco Logistics, LLC ("CLL"), Camden Resources, LLC ("Camden"), Centurion, DRI, Cinco Natural Resources Corporation ("CNRC") and Cima. Intercompany accounts and transactions have been eliminated.
Significant Estimates
The preparation of financial statements in conformity with U.S. GAAP requires management to make estimates and assumptions that affect the amounts reported in the financial statements and accompanying notes. These estimates and assumptions may also affect disclosure of contingent assets and liabilities at the date of the financial statements and the reported amounts of revenues and expenses during the reporting period. Our audited consolidated financial statements are based on a number of significant estimates, including oil and natural gas revenues, accrued assets and liabilities, stock-based compensation, valuation of derivative instruments and oil and natural gas reserves. The estimates of oil and natural gas reserves quantities and future net cash flows are the basis for the calculation of depletion and impairment of oil and natural gas properties, as well as estimates of asset retirement obligations and certain tax accruals. While we believe these estimates are reasonable, changes in facts and assumptions or the discovery of new information may result in revised estimates. Actual results could differ from these estimates and it is at least reasonably possible these estimates could be revised in the near term, and these revisions could be material.
Cash and Cash Equivalents
All highly liquid investments with original maturities of three months or less are considered to be cash equivalents. At times, the amount of cash and cash equivalents on deposit in financial institutions exceeds federally insured limits. We regularly evaluate these institutions and believe our risk of loss is negligible.
Revenues and Accounts Receivable
We sell our natural gas and oil production to various purchasers (see Note 14). In addition, we may participate with industry partners in the drilling, completion and operation of oil and natural gas wells. Substantially all of our accounts receivable are due from either purchasers of natural gas and oil or participants in oil and natural gas wells. Accounts receivable, joint interest owners, are due within 30 days of the invoice date. Accounts receivable, natural gas and oil sales, are due under normal trade terms, generally requiring payment within 30 to 60 days of production. No interest is charged on past-due balances. Payments made on all accounts receivable are applied to the earliest unpaid items.
We review our accounts receivable periodically and reduce the carrying amount by a valuation allowance that reflects our best estimate of the amount that may not be collectible. We recorded an allowance of $243 and $134 for estimated uncollectible amounts at December 31, 2009 and 2010, respectively.
F-8
Cinco Resources, Inc.
Notes to Consolidated Financial Statements (Continued)
(Amounts in thousands, except shares and per-share amounts)
2. Summary of Significant Accounting Policies (Continued)
Oilfield Inventory
Oilfield inventory consists of tubular goods and other well equipment to be used in developing oil and gas properties or repair operations. It is valued at the lower of cost or market value using the average cost method which approximated fair value at December 31, 2009 and 2010.
Advances Paid
We participate in the drilling of natural gas and oil wells with other working interest partners. Due to the capital intensive nature of natural gas and oil drilling activities, the working interest partner responsible for conducting the drilling operations may request advance payments from other working interest partners for their share of the costs. We expect such advances paid to be applied by working interest partners against joint interest billings for our share of drilling operations within 90 days from when the advance is paid.
Natural Gas and Oil Properties
Our natural gas and oil properties consisted of the following at December 31:
| |
2009 | 2010 | |||||
|---|---|---|---|---|---|---|---|
Mineral interests in properties: |
|||||||
Unproved properties |
$ | 11,709 | $ | 27,876 | |||
Proved properties |
20,889 | 21,507 | |||||
Wells and related equipment and facilities |
258,722 | 346,196 | |||||
Support equipment and facilities |
234 | 234 | |||||
Total capitalized costs |
291,554 | 395,813 | |||||
Less: Accumulated depletion and depreciation |
(135,852 | ) | (168,883 | ) | |||
Net capitalized costs |
$ | 155,702 | $ | 226,930 | |||
Proved Natural Gas and Oil Properties
We follow the successful efforts method of accounting for our natural gas and oil producing activities. Under this method, all property acquisition costs and cost of development wells are capitalized as incurred. Costs to drill exploratory wells are capitalized pending determination of whether the well has found proved reserves. If an exploratory well does not find proved reserves, the costs of drilling the well are charged to expense. There were no exploratory wells capitalized pending determinations of whether the wells found proved reserves at December 31, 2009 or 2010.
Geological and geophysical costs, including seismic studies and costs of carrying and retaining unproved properties, are charged to exploration expense as incurred. Expenditures for maintenance, repairs and minor renewals necessary to maintain properties in operating condition are charged to workover expense as incurred. Major betterments, replacements and renewals are capitalized to the appropriate property and equipment accounts.
We capitalize interest on expenditures for significant exploration and development projects that last more than one year while activities are in progress to bring the assets to their intended use.
F-9
Cinco Resources, Inc.
Notes to Consolidated Financial Statements (Continued)
(Amounts in thousands, except shares and per-share amounts)
2. Summary of Significant Accounting Policies (Continued)
Through December 31, 2009 and 2010, we had not capitalized any interest costs because drilling of our exploration and development wells generally lasts less than one year.
Capitalized costs of proved properties are amortized using the unit-of-production basis based on production and estimates of proved reserves quantities. Depletion expense for proved natural gas and oil properties amounted to $6,655, $12,688 and $16,778 for the years ended December 31, 2008, 2009 and 2010, respectively.
On the sale or retirement of a complete unit of a proved property or field, the cost and related accumulated depletion, depreciation and amortization are eliminated from the property accounts, and the resulting gain or loss is recognized in income. On the retirement or sale of a partial unit of proved property, the cost is charged to accumulated depletion, depreciation and amortization unless doing so significantly affects the unit-of-production amortization rate for an entire field, in which case the resulting gain or loss is recognized in income.
Unproved Natural Gas and Oil Properties
Unproved natural gas and oil properties consist of costs incurred to acquire unproved leases. Unproved lease acquisition costs are capitalized until the leases expire or when we specifically identify leases that will revert to the lessor, at which time we expense the associated unproved lease acquisition costs to impairment. Lease acquisition costs related to successful exploratory drilling are reclassified to proved properties.
On the sale of an entire interest in an unproved property for cash or cash equivalents, gain or loss is recognized to the extent of the difference between the proceeds received and the net carrying value of the property. Proceeds from sales of partial interests in unproved properties are accounted for as a recovery of costs unless the proceeds exceed the entire cost of the property.
Impairment of Natural Gas and Oil Properties
We review our proved natural gas and oil properties for impairment whenever events and circumstances indicate that a decline in the recoverability of their carrying value may have occurred. We estimate the expected undiscounted future cash flows of our natural gas and oil properties and compare such undiscounted future cash flows to the carrying amount of the natural gas and oil properties to determine if the carrying amount is recoverable. If the carrying amount exceeds the estimated undiscounted future cash flows, we will adjust the carrying amount of the natural gas and oil properties to fair value. See further discussion in Note 7—Fair Value Measurements. We assess our unproved natural gas and oil properties periodically for impairment on a property-by-property basis based on remaining lease terms, drilling results or future plans to develop acreage and record
F-10
Cinco Resources, Inc.
Notes to Consolidated Financial Statements (Continued)
(Amounts in thousands, except shares and per-share amounts)
2. Summary of Significant Accounting Policies (Continued)
impairment expense for any decline in value. Based on our analysis the following impairments were recorded during the years ending December 31:
| |
2008 | 2009 | 2010 | |||||||
|---|---|---|---|---|---|---|---|---|---|---|
Impairment of natural gas and oil properties |
||||||||||
Proved properties |
$ | 4,295 | $ | 7,160 | $ | 16,890 | ||||
Unproved properties |
241 | 803 | 3,898 | |||||||
Total impairment of natural gas and oil properties |
$ | 4,536 | $ | 7,963 | $ | 20,788 | ||||
Proved property impairment recorded resulted from declines in well production and a decrease in natural gas prices causing the projected reserves to be significantly lower. Unproved property impairment recorded resulted from the abandonment of several prospects which we determined did not warrant development during the respective years, none of which were individually significant.
Other Property and Equipment
Other property and equipment consisted of the following at December 31:
| |
2009 | 2010 | |||||
|---|---|---|---|---|---|---|---|
Land |
$ | 10 | $ | 10 | |||
Leasehold improvements |
55 | 16 | |||||
Furniture and fixtures |
585 | 445 | |||||
Computer software and equipment |
1,323 | 639 | |||||
Total |
1,973 | 1,110 | |||||
Less: Accumulated depletion and depreciation |
(1,314 | ) | (588 | ) | |||
Net other property and equipment |
$ | 659 | $ | 522 | |||
Furniture, fixtures and equipment are carried at cost. Depreciation of furniture, fixtures and equipment is provided using the straight-line method over estimated useful lives ranging from three to ten years. Gain or loss on retirement, sale or other disposition of assets is included in income in the period of disposition. Depreciation expense for other property and equipment amounted to $165, $220 and $179 for the years ended December 31, 2008, 2009 and 2010, respectively.
Natural Gas and Oil Sales Payable
Natural gas and oil sales payable represents amounts collected from purchasers for natural gas and oil sales which are either revenues due to other revenue interest owners or severance taxes due to the respective state or local tax authorities. Generally, we are required to remit amounts due under these liabilities within 30 to 60 days of the end of the month in which the related production occurred.
Advances from Joint Interest Owners
Advances from joint interest owners represent amounts collected from other parties holding working interests in properties operated by us in advance of drilling or workover operations on natural gas and oil wells. As amounts are expended on behalf of the other parties, the advances are applied to joint interest billings.
F-11
Cinco Resources, Inc.
Notes to Consolidated Financial Statements (Continued)
(Amounts in thousands, except shares and per-share amounts)
2. Summary of Significant Accounting Policies (Continued)
Asset Retirement Obligations
Asset retirement obligations ("ARO") consist of future plugging and abandonment expenses on natural gas and oil properties. We record the fair value of our ARO in the period in which wells are completed and first placed in service and a corresponding increase in the carrying amount of natural gas and oil properties. The liability is accreted to its present value each period and the capitalized cost is depreciated using the unit-of-production method. The accretion costs are recorded as a component of depletion, depreciation and amortization on our consolidated statements of operations. We also adjust the liability for changes resulting from revisions to the timing or the amount of the original estimate. If the liability is settled for an amount other than the recorded amount, a gain or loss is recognized in earnings as an increase to lease operating expense.
The following is a summary of changes in the ARO, including ARO related to discontinued operations, during the years ended December 31:
| |
2008 | 2009 | 2010 | |||||||
|---|---|---|---|---|---|---|---|---|---|---|
ARO, beginning of year |
$ | 2,656 | $ | 5,251 | $ | 7,206 | ||||
Change in assumptions |
2,309 | 23 | — | |||||||
Liabilities incurred |
874 | 1,628 | 57 | |||||||
Liabilities settled |
(898 | ) | (33 | ) | (363 | ) | ||||
Accretion of discount |
310 | 337 | 370 | |||||||
ARO, end of year |
$ | 5,251 | $ | 7,206 | $ | 7,270 | ||||
The change in assumptions for the year ended December 31, 2008 related to revisions of estimated future plugging and abandonment costs based on actual costs incurred for similar properties.
Revenues
We recognize revenues for natural gas and oil production when the quantities are delivered to or collected by the respective purchaser, using the sales method. The sales prices for such production, net of transportation costs, are defined in sales contracts and are readily determinable based on certain publicly available indices. All transportation costs are included in lease operating expense on our consolidated statements of operations.
Production Costs
Production costs, including pumpers' salaries, saltwater disposal, repairs and maintenance and other operating expenses are expensed as incurred and included in lease operating expense on our consolidated statements of operations.
Share-Based Compensation
Share-based awards, including options and stock awards, are measured using the fair market value of the stock as of the grant date. We recognize compensation expense, based on the grant-date fair value, over the requisite service period. Share-based compensation costs are recorded in general and administrative expense and amounted to $1,825, $5,287 and $8,723 for the years ended December 31, 2008, 2009 and 2010, respectively.
F-12
Cinco Resources, Inc.
Notes to Consolidated Financial Statements (Continued)
(Amounts in thousands, except shares and per-share amounts)
2. Summary of Significant Accounting Policies (Continued)
Income Taxes
We are subject to United States federal income tax as well as state and local taxes in Arkansas, Oklahoma, Texas, Louisiana and Nebraska. Deferred tax assets and liabilities are recognized for the estimated future tax consequences attributable to the differences between the financial statement carrying amounts of existing assets and liabilities and their respective tax bases. Deferred tax assets and liabilities are measured using the tax rate in effect for the year in which those temporary differences are expected to be recovered or settled. The effect of a change in tax rates on deferred tax assets and liabilities is recognized in income in the year of the enacted tax rate change. We periodically review deferred tax assets and record a valuation allowance to reduce the carrying amounts of such assets to amounts that are more-likely-than-not to be recognized. In the event we incur interest or penalties in connection with income taxes, such amounts are included in income tax expense on our consolidated statements of operations.
We have reviewed our income tax returns and determined no uncertain tax positions exist. Our income tax returns for the years ended December 31, 2007, 2008, 2009 and 2010 remain open for examination by the respective federal and state taxing authorities.
Derivatives
We are exposed to certain risks relating to our on-going business operations. Our largest areas of risk exposure relate to commodity prices and interest rates. We use derivative instruments primarily to manage commodity price risk and interest rate risk.
All derivative financial instruments are recognized at fair value as either assets or liabilities on our consolidated balance sheet. We have elected not to apply hedge accounting for our existing derivative financial instruments, and as a result, we recognize the change in derivative fair value between reporting periods in the consolidated statements of operations. Cash settlements with counterparties to our derivative financial instruments are also recorded in the consolidated statements of operations.
By using derivative financial instruments to hedge exposures to changes in commodity prices and interest rates, we are exposed to credit risk and market risk. Credit risk is the failure of the counterparty to perform under the terms of the derivative contract. To mitigate this risk, the derivative instruments are placed with a number of counterparties whom we believe are creditworthy. It is our policy to enter into derivative contracts only with counterparties we deem to be competent and competitive market makers.
Market risk is the change in the value of a derivative financial instrument that results from a change in commodity prices, interest rates or other relevant factors affecting the value of the derivative. The market risks associated with commodity price and interest rate contracts are managed by establishing and monitoring parameters that limit the types and degree of market risk that may be undertaken. We do not hold or issue derivative financial instruments for speculative trading purposes.
Earnings Per Share
We compute basic net income per share using the weighted-average number of shares of common stock outstanding during the period. Diluted net income per share is computed using the weighted-
F-13
Cinco Resources, Inc.
Notes to Consolidated Financial Statements (Continued)
(Amounts in thousands, except shares and per-share amounts)
2. Summary of Significant Accounting Policies (Continued)
average number of shares of common stock and includes the effect of all potentially dilutive shares of common stock underlying the following:
| |
As of December 31, | |||||||||
|---|---|---|---|---|---|---|---|---|---|---|
| |
2008 | 2009 | 2010 | |||||||
Stock options (Note 11) |
37,614 | — | — | |||||||
Series A Convertible Preferred Stock (Note 9) |
— | 525,000 | 525,000 | |||||||
Warrants (Note 5) |
— | 70,700 | 70,700 | |||||||
The effect of dilutive shares is calculated using the treasury stock method. The shares of common stock underlying the stock options, Preferred Shares and warrants, as shown in the preceding table, are not included in weighted average shares outstanding for the years ended December 31, 2008, 2009 or 2010 as their effects would be anti-dilutive.
Fair Value Measurements
Certain of our assets and liabilities are measured at fair value. Fair value is the price that would be received to sell an asset or paid to transfer a liability in an orderly transaction between market participants at the measurement date. This price is commonly referred to as the "exit price." We use market data or assumptions that market participants would use in pricing the asset or liability, including assumptions about risk and the risks inherent in the inputs to the valuation technique. These inputs can be readily observable, market corroborated or generally unobservable. FASB ASC 820 establishes a fair value hierarchy that prioritizes the inputs used to measure fair value. The hierarchy gives the highest priority to unadjusted quoted prices in active markets for identical assets or liabilities (Level 1 measurement) and lowest priority to unobservable inputs (Level 3 measurement). The three levels of fair value hierarchy defined by ASC 820 are as follows:
- •
- Level 1—Quoted prices are available in active markets for identical assets or liabilities as of the
reporting date.
- •
- Level 2—Pricing inputs are other than quoted prices in active markets included in Level 1, which
are either directly or indirectly observable as of the reporting date. Level 2 includes those financial instruments that are valued using models or other valuation methodologies. These models
are primarily industry-standard models that consider various assumptions, including quoted forward prices for commodities, time value, volatility factors and current market and contractual prices for
the underlying instruments, as well as other relevant economic measures.
- •
- Level 3—Pricing inputs include significant inputs that are generally less observable from objective sources. These inputs may be used with internally developed methodologies that result in management's best estimate of fair value.
ASC 820 requires financial asset and liabilities to be classified on the lowest level of input that is significant to the fair value measurement. Our assessment of the significance of a particular input to the fair value measurement requires judgment and may affect the valuation of the fair value of assets and liabilities and their placement within the fair value hierarchy levels.
F-14
Cinco Resources, Inc.
Notes to Consolidated Financial Statements (Continued)
(Amounts in thousands, except shares and per-share amounts)
2. Summary of Significant Accounting Policies (Continued)
Financial Instruments
The carrying values of financial instruments including cash and cash equivalents, accounts receivable, accounts payable and long-term debt approximate fair value due to the short maturity of these instruments and the use of variable market interest rates where applicable as of December 31, 2009 and 2010.
New Accounting Pronouncements
Fair Value. In May 2011, the FASB issued Accounting Standards Update ("ASU") 2011-04, Amendments to Achieve Common Fair Value Measurement and Disclosure Requirements in U.S. GAAP and IFRS ("ASU 2011-04"). ASU 2011-04 amends Accounting Standards Codification ("ASC") 820, Fair Value Measurements ("ASC 820"), providing a consistent definition and measurement of fair value, as well as similar disclosure requirements between U.S. GAAP and International Financial Reporting Standards. ASU 2011-04 changes certain fair value measurement principles, clarifies the application of existing fair value measurements and expands the ASC 820 disclosure requirements, particularly for Level 3 fair value measurements. We do not expect the adoption of ASU 2011-04 to have a material effect on our consolidated financial statements, but it may require certain additional disclosures. The amendments in ASU 2011-04 are to be applied prospectively. For public entities, the amendments are effective during interim and annual periods beginning after December 15, 2011.
3. Acquisitions
During the years ended December 31, 2008 and 2009, we completed acquisitions of additional working interests in our existing properties. The following is a summary of these acquisitions:
Acquisition Date
|
Effective Date | Cash Consideration | Description | ||||
|---|---|---|---|---|---|---|---|
| February 29, 2008 | December 1, 2007 | $ | 1,265 | Working interests in the Redfish Bay, Paisano and Matagorda Bay fields | |||
| March 25, 2008 | February 1, 2008 | 677 | Working interests in the Redfish Bay field | ||||
| June 26, 2008 | May 1, 2008 | 6,729 | Working interests in the Hostetter field | ||||
| April 9, 2009 | February 1, 2009 | 60 | Working interests in the Paisano field | ||||
| April 29, 2009 | April 8, 2009 | 3,324 | Working interests in the Redfish Bay field | ||||
During the year ended December 31, 2010, we acquired mineral interests in unproved properties for total cash consideration of $299.
The revenues and operating expenses related to the additional working interests acquired are included in our consolidated statements of operations subsequent to the acquisition dates listed above.
4. Discontinued Operations
During the year ended December 31, 2010, we sold our interest in certain Arkoma Basin properties for cash consideration totaling $6,237. During 2011, we sold gas and oil properties located in Arkansas and Oklahoma for an unadjusted purchase price of $24,425. The operating results of the
F-15
Cinco Resources, Inc.
Notes to Consolidated Financial Statements (Continued)
(Amounts in thousands, except shares and per-share amounts)
4. Discontinued Operations (Continued)
properties and the gain from the sale of the properties sold have been excluded from continuing operations on our consolidated statements of operations and are included in income from discontinued operations. The following is a summary of discontinued operations for the years ended December 31:
| |
2009 | 2010 | |||||
|---|---|---|---|---|---|---|---|
Revenues |
|||||||
Natural gas sales |
$ | 6,173 | $ | 8,768 | |||
Oil sales |
— | 3 | |||||
Natural gas liquids sales |
— | 1 | |||||
Total revenues |
6,173 | 8,772 | |||||
Operating expenses |
|||||||
Lease operating |
1,823 | 2,364 | |||||
Workovers |
2 | 9 | |||||
Severance and ad valorem taxes |
161 | 208 | |||||
Exploration |
(13 | ) | (4 | ) | |||
Depletion, depreciation and amortization |
1,942 | 2,227 | |||||
Impairment of natural gas and oil properties |
108 | 135 | |||||
Total operating expenses |
4,023 | 4,939 | |||||
Operating income |
2,150 |
3,833 |
|||||
Gain on sale of natural gas and oil properties |
— |
2,079 |
|||||
Income from discontinued operations |
$ |
2,150 |
$ |
5,912 |
|||
5. Combination of Companies under Common Control
Pursuant to our strategy to increase our proved mineral interests, we acquired approximately 85% of the outstanding common stock of DRI, an entity under common control, on March 9, 2009 in exchange for 683,305 shares of our common stock.
The acquisition was accounted for as a combination of companies under common control under which we recorded DRI's historic carrying values of assets acquired and liabilities assumed on the acquisition date. As we did not acquire 100% of DRI's common stock on the initial acquisition date, we have not consolidated DRI's financial position and results from operations prior to March 9, 2009,
F-16
Cinco Resources, Inc.
Notes to Consolidated Financial Statements (Continued)
(Amounts in thousands, except shares and per-share amounts)
5. Combination of Companies under Common Control (Continued)
as we have for other acquisitions of other companies under common control. The following is a summary of amounts we recorded on the acquisition of DRI:
| |
March 9, 2009 | |||
|---|---|---|---|---|
Cash |
$ | 67 | ||
Accounts receivable: |
||||
Joint interest owners |
3,227 | |||
Natural gas and oil sales |
5,185 | |||
Inventory |
5,122 | |||
Prepaids and other current assets |
1,011 | |||
Property and equipment |
78,578 | |||
Other assets |
482 | |||
Total assets acquired |
93,672 | |||
Accounts payable |
30,743 |
|||
Accrued liabilities |
2,591 | |||
Natural gas and oil sales payable |
6,854 | |||
Bank notes payable |
104,740 | |||
Asset retirement obligations |
1,628 | |||
Total liabilities assumed |
146,556 | |||
Net liabilities assumed |
$ | 52,884 | ||
In August 2009, we acquired the remaining non-controlling interests of DRI. Under the terms of the acquisition, we exchanged each remaining share of DRI stock for 35 shares of our common stock, resulting in the issuance of 131,565 shares of our common stock. Concurrently, we sold a total of 100,520 shares of our common stock to four former members of DRI's management in exchange for notes receivable of $14,322. The excess of the consideration paid over the carrying value of the non-controlling interest was charged to additional paid-in capital.
In conjunction with our acquisition of the non-controlling interests in DRI during August 2009, we entered into a Settlement Agreement with certain former DRI stockholders. Under the terms of the Settlement Agreement, the former stockholders were entitled to cash severance payments, personal property, use of our office facilities and other benefits, along with a total of 70,700 warrants for the purchase of our common stock with a strike price of $150 per share. Warrants issued to the former DRI stockholders expire August 28, 2016. The fair value of the warrants issued amounted to $710. See Note 7—Fair Value Measurements for further discussion. The cash payments amounted to $2,885, and the personal property had a carrying value at the time of distribution of approximately $220. The total value of cash, personal property and warrants conveyed to the former stockholders upon settlement amounted to $3,815, and such amount is included in general and administrative expense on our consolidated statements of operations for the year ended December 31, 2009.
Effective March 31, 2009, we entered into an agreement and plan of merger with Centurion, an entity affiliated through common ownership. Under the terms of the merger agreement, we acquired all of Centurion's outstanding shares, resulting in Centurion becoming a wholly-owned subsidiary. All of
F-17
Cinco Resources, Inc.
Notes to Consolidated Financial Statements (Continued)
(Amounts in thousands, except shares and per-share amounts)
5. Combination of Companies under Common Control (Continued)
the outstanding shares of Centurion common stock issued and outstanding immediately prior to March 31, 2009, were converted into 19 shares of our common stock. The transaction was accounted for as a reorganization of companies under common control, similar to a pooling of interests. As of the date of the merger, we recorded the net assets of Centurion at the historical carrying values of Centurion.
On March 31, 2010, our management and funds managed by Yorktown formed Cima, a Delaware corporation and company under common control, for the purpose of exploring, developing, acquiring and producing natural gas and oil properties in the Eagle Ford Shale in South Texas. We managed the corporate affairs of Cima and served as operator of its natural gas and oil properties until November 17, 2011 when we acquired all of the outstanding shares of common stock of Cima. The stockholders of Cima received one share of common stock in exchange for each share of Cima's common stock held by them at that date. All shares of common stock and per-share amounts in the accompanying consolidated financial statements and notes to consolidated financial statements have been adjusted for all periods to give effect to the acquisition of Cima. See Note 17—Subsequent Events for further discussion.
6. Derivative Instruments
Commodity Derivatives
We periodically enter into derivative financial instruments to mitigate the risk of volatility in commodity prices with respect to a portion of our gas and oil production. We use these instruments to manage the inherent uncertainty of future revenues due to gas and oil price volatility. Our derivative financial instruments include fixed-price swaps, basis swaps, costless price collars, call options and put spreads. Under the terms of the fixed-price swaps, we will receive a fixed price for our production and pay a variable market price to the contract counterparty. For the basis swaps, we pay a fixed differential between two regional gas index prices and receive a variable differential on the same two index prices to the contract counterparty. Two-way collars set a floor and ceiling price for the hedged production. If the applicable monthly price indices are outside of the ranges set by the floor and ceiling prices in the various collars, we will cash-settle the difference with the counterparty to the collars. A three-way collar is a combination of three options: a sold call, a purchased put and a sold put. The sold call establishes the maximum price that we will receive for the contracted commodity volumes. The purchased put establishes the minimum price that we will receive for the contracted volumes unless the market price for the commodity falls below the sold put strike price, at which point the minimum price equals the reference price (i.e., NYMEX) plus the excess of the purchased put strike price over the sold put strike price. A put spread consists of a purchased put and a sold put. The purchased put establishes the minimum price we will receive for the contracted volumes unless the market price for the commodity falls below the sold put strike price, at which point the minimum price equals the reference price (i.e. NYMEX) plus the excess of the purchased put strike over the sold put strike. A sold call requires us to pay the difference between the reference price (i.e. NYMEX) and the market price for the commodity if the market price exceeds the strike price of the sold call option.
The following is a summary of our net open natural gas derivative positions as of December 31, 2010. The natural gas prices listed below are New York Mercantile Exchange ("NYMEX") Henry Hub prices. Basis swaps are between NYMEX Henry Hub and Centerpoint East ("CPE") Inside FERC, a
F-18
Cinco Resources, Inc.
Notes to Consolidated Financial Statements (Continued)
(Amounts in thousands, except shares and per-share amounts)
6. Derivative Instruments (Continued)
mid-continent index point. Where we have purchased deferred premium put or call options, the prices below reflect the cost of such option purchases.
| |
Contract Period | ||||||
|---|---|---|---|---|---|---|---|
Position Description
|
2011 | 2012 | |||||
Swaps (MMBtu) |
1,825,000 | 450,000 | |||||
Average price per MMBtu |
$ | 4.51 | $ | 5.11 | |||
Two-way collars (MMBtu) |
295,000 |
127,500 |
|||||
Average price per MMBtu |
|||||||
Ceiling sold price (call) |
$ | 7.50 | $ | 7.50 | |||
Floor purchased price (put) |
6.64 | 7.00 | |||||
Three-way collars (MMBtu) |
826,000 |
127,500 |
|||||
Average price per MMBtu |
|||||||
Ceiling sold price (call) |
$ | 8.12 | $ | 8.55 | |||
Floor purchased price (put) |
6.90 | 7.00 | |||||
Floor sold price (put) |
5.19 | 5.00 | |||||
Put spreads (MMBtu)(1) |
2,244,000 |
2,546,000 |
|||||
Average price per MMBtu |
|||||||
Floor purchased price (put) |
$ | 6.37 | $ | 6.59 | |||
Floor sold price (put) |
3.69 | 4.81 | |||||
Sold calls (MMBtu) |
1,859,000 |
2,546,000 |
|||||
Average price per MMBtu |
|||||||
Ceiling sold price (call) |
$ | 5.23 | $ | 6.40 | |||
Basis swaps (MMBtu) |
2,848,890 |
1,448,077 |
|||||
Average price per MMBtu |
$ | (0.53 | ) | $ | (0.49 | ) | |
MMBtu—million British thermal units
- (1)
- Put spread positions incorporate long put positions assuming a floor purchased price (put) and a floor sold price (put) of zero.
Interest Rate Swaps
We periodically enter into interest rate swaps to manage our exposure to interest rate volatility. Our interest rate swaps include contracts in which we pay a fixed rate and receive a variable rate on a total notional principal amount.
At December 31, 2009 and 2010, we had a $50,000 notional amount and a weighted average fixed month LIBOR price of 2.21% through September 30, 2012.
F-19
Cinco Resources, Inc.
Notes to Consolidated Financial Statements (Continued)
(Amounts in thousands, except shares and per-share amounts)
6. Derivative Instruments (Continued)
Open Derivative Instruments
The following summarizes the location and fair value of our open derivative instruments as of December 31:
| |
Balance Sheet Location | 2009 | 2010 | ||||||
|---|---|---|---|---|---|---|---|---|---|
Short-term commodity derivatives |
Derivative assets, current | $ | 59 | $ | 4,266 | ||||
Short-term interest rate swaps(1) |
Derivative assets, current | — | (744 | ) | |||||
|
59 | 3,522 | |||||||
Long-term commodity derivatives |
Derivative assets |
1,091 |
2,108 |
||||||
Long-term interest rate swaps(1) |
Derivative assets | 152 | (490 | ) | |||||
|
1,243 | 1,618 | |||||||
Short-term commodity derivatives |
Derivative liabilities, current |
26 |
59 |
||||||
Short-term interest rate swaps |
Derivative liabilities, current | 840 | 189 | ||||||
|
866 | 248 | |||||||
Long-term commodity derivatives |
Derivative liabilities |
— |
34 |
||||||
Long-term interest rate swaps |
Derivative liabilities | — | 125 | ||||||
|
— | 159 | |||||||
- (1)
- Unrealized losses on interest rate swaps included in derivative assets, current and derivative assets pursuant to master netting agreements.
None of our derivatives are designated as hedging instruments.
Unrealized gains and losses, at fair value, are included on our consolidated balance sheets as current or non-current assets or liabilities based on the period covered under the related contracts. Changes in the fair value of our commodity derivative contracts and interest rate swap contracts are recorded in earnings as they occur. The following is a summary of the effect of derivative instruments on our consolidated statement of operations for the years ended December 31:
| |
|
Amount of Gain (Loss) Recognized |
|||||||
|---|---|---|---|---|---|---|---|---|---|
| |
Location of Gain (Loss) Recognized on the Statement of Operations |
||||||||
Description
|
2009 | 2010 | |||||||
Realized gain (loss) on commodity derivatives |
Gain on derivative instruments | $ | (33 | ) | $ | 4,546 | |||
Realized loss on interest rate swaps |
Gain on derivative instruments | (340 | ) | (978 | ) | ||||
Total realized gain (loss) on derivative instruments |
(373 | ) | 3,568 | ||||||
Unrealized gain on commodity derivatives |
Gain on derivative instruments |
1,124 |
5,156 |
||||||
Unrealized loss on interest rate swaps |
Gain on derivative instruments | (688 | ) | (859 | ) | ||||
Total unrealized gain on derivative instruments |
436 | 4,297 | |||||||
Net gain on derivative instruments |
$ | 63 | $ | 7,865 | |||||
All of our oil and gas properties are pledged as collateral under our commodity derivative arrangements.
F-20
Cinco Resources, Inc.
Notes to Consolidated Financial Statements (Continued)
(Amounts in thousands, except shares and per-share amounts)
7. Fair Value Measurements
The following tables summarize the valuation of our financial assets and liabilities that were accounted for at fair value on a recurring basis in accordance with the fair value hierarchy:
| |
As of December 31, 2009 | ||||||||||||
|---|---|---|---|---|---|---|---|---|---|---|---|---|---|
| |
Level 1 | Level 2 | Level 3 | Total Fair Value |
|||||||||
Commodity derivative assets |
$ | — | $ | 1,150 | $ | — | $ | 1,150 | |||||
Interest rate derivative assets |
— | 152 | — | 152 | |||||||||
Commodity derivative liabilities |
— | (26 | ) | — | (26 | ) | |||||||
Interest rate derivative liabilities |
— | (840 | ) | — | (840 | ) | |||||||
|
$ | — | $ | 436 | $ | — | $ | 436 | |||||
| |
As of December 31, 2010 | ||||||||||||
|---|---|---|---|---|---|---|---|---|---|---|---|---|---|
| |
Level 1 | Level 2 | Level 3 | Total Fair Value |
|||||||||
Commodity derivative assets |
$ | — | $ | 6,374 | $ | — | $ | 6,374 | |||||
Commodity derivative liabilities |
— | (93 | ) | — | (93 | ) | |||||||
Interest rate derivative liabilities |
$ | — | $ | (1,548 | ) | $ | — | $ | (1,548 | ) | |||
|
$ | — | $ | 4,733 | $ | — | $ | 4,733 | |||||
We estimate the fair value of derivative contracts based on the present value of the difference in exchange-quoted forward price curves and contractual settlement prices, multiplied by notional quantities. We valued the option contracts using industry-standard option pricing models and observable market inputs. Additional disclosures related to fair value of derivative financial instruments are provided in Note 6—Derivative Instruments.
Assets and liabilities accounted for at fair value on a non-recurring basis in accordance with the fair value hierarchy include asset retirement obligations incurred and warrants. The fair value of our asset retirement obligations incurred totaled $3,183, $1,651 and $57 for the years ended December 31, 2008, 2009 and 2010, respectively. The fair value of additions to the asset retirement obligation liability is measured using valuation techniques consistent with the income approach, which converts future cash flows to a single discounted amount. Significant inputs to the valuation include: (i) estimated plug and abandonment cost per well based on our experience and information from third-party vendors; (ii) estimated remaining life per well; (iii) future inflation factors; and (iv) our average credit adjusted risk free rate. These assumptions represent Level 3 inputs. See Note 2—Summary of Significant Accounting Policies for further discussion of our asset retirement obligation.
The fair value of our warrants was determined using Level 3 inputs and totaled $710 during the year ended December 31, 2009. The fair value of warrants issued was determined using the Black-Scholes method, using the following assumptions: volatility—26.7%; risk-free rate—3.15%; expected life—7 years; and expected dividend yield of 0%. We determined volatility based on publicly available data for peer companies, risk-free rates based on rates for seven-year U.S. Treasury securities, expected lives based on our best estimate of the time the warrants will remain outstanding, and dividend rates based on our history of not paying dividends and plans not to pay dividends for the foreseeable future.
F-21
Cinco Resources, Inc.
Notes to Consolidated Financial Statements (Continued)
(Amounts in thousands, except shares and per-share amounts)
7. Fair Value Measurements (Continued)
In addition, if the carrying amount of our gas and oil properties exceeds the estimated undiscounted future cash flows, we will adjust the carrying amount of the natural gas and oil properties to fair value. The fair value of our natural gas and oil properties uses valuation techniques consistent with the income and market approach. The factors used to determine fair value are subject to management's judgment and expertise and include, but are not limited to, recent sales prices of comparable properties, the present value of future cash flows, net of estimated operating and development costs using estimates of proved reserves, future commodity pricing, future production estimates, anticipated capital expenditures and various discount rates commensurate with the risk and current market conditions associated with the expected cash flow projected. These assumptions represent Level 3 inputs. See further discussion in Note 2—Summary of Significant Accounting Policies.
8. Long-Term Debt
Long-term debt consisted of the following as of December 31:
| |
2009 | 2010 | |||||
|---|---|---|---|---|---|---|---|
Senior secured revolving credit facility |
$ | 40,700 | $ | 56,000 | |||
Second lien term loan facility |
30,000 | 30,000 | |||||
Total long-term debt |
$ | 70,700 | $ | 86,000 | |||
Senior secured revolving credit facility. In October 2009, we entered into a senior secured revolving credit facility with a group of banks that matures in October 2012. The amount of borrowings under our senior secured credit facility is limited to the lesser of $300,000 or the amount of the borrowing base which is determined semi-annually on October 1 and April 1 by the lenders primarily based on estimates of the value of our proved reserves. As of December 31, 2010, our borrowing base was $66,000, leaving $10,000 available for borrowing.
Borrowings under our senior secured revolving credit facility bear interest at our election at either (i) a London Inter Bank Offer Rate, or LIBOR, based rate or (ii) the issuing bank's base rate plus an applicable margin ranging from 2.25% to 3.25%. Should we elect base rate pricing, our applicable margin would be 1.25% or 2.25%. As of December 31, 2010, the interest rate payable on borrowings under our senior secured revolving credit facility was 3.29%. There is also an annual commitment fee, payable quarterly, of 0.50% on the undrawn portion of our borrowing base.
Second lien term loan facility. In addition to borrowings on our senior secured revolving credit facility, in October 2009 we entered into a second lien term loan facility with a group of banks. The size of this second lien term loan facility is $50,000 of which $30,000 is available for borrowing and has been outstanding since October 2009. This credit facility matures in April 2013. Borrowings under our second lien term loan facility bear interest at the greater of one month LIBOR or 3.50% plus a margin of 9.50%. As of December 31, 2010, the interest rate payable on borrowings under our second lien term loan facility was 13%.
Both the senior secured revolving credit facility and second lien term loan facility are collateralized by substantially all of our assets and require us to maintain certain financial ratios, among other covenants, including a minimum current ratio, minimum debt coverage ratio, minimum asset coverage
F-22
Cinco Resources, Inc.
Notes to Consolidated Financial Statements (Continued)
(Amounts in thousands, except shares and per-share amounts)
8. Long-Term Debt (Continued)
ratio and a minimum interest coverage ratio. As of December 31, 2010, we were not in compliance with the current ratio covenant. However, subsequent to December 31, 2010, we received a waiver of noncompliance from the lenders' agent.
Future annual contractual maturities of long-term debt as of December 31, 2010, were as follows:
Years Ending December 31,
|
Amounts | |||
|---|---|---|---|---|
2011 |
$ | — | ||
2012 |
56,000 | |||
2013 |
30,000 | |||
Total |
$ | 86,000 | ||
See Note 17—Subsequent Events for further discussion.
9. Series A Convertible Preferred Stock
During the year ended December 31, 2009, we issued 525,000 shares of our Series A Convertible Preferred Stock ("Preferred Shares") to an affiliate of an existing stockholder for total cash proceeds of $105,000. The Preferred Shares were convertible into shares of common stock at an initial conversion price of $200 per share. Holders of Preferred Shares were entitled to one vote per common share issuable upon conversion at the time of voting. Holders of the Preferred Shares were not entitled to dividends or demand for redemption, though such holders were entitled to a liquidation preference of $200 per share.
On November 15, 2011, all of the outstanding Preferred Shares were converted into 875,000 shares of common stock pursuant to an induced conversion. See Note 17—Subsequent Events for further discussion.
10. Notes Receivable from Stockholders
Through January 1, 2009, we had issued 37,928 shares of common stock to officers in exchange for full-recourse promissory notes which accrued interest at 6.00%. On March 30, 2009, these notes and related accrued interest were redeemed in exchange for 32,504 shares of common stock held by these officers.
During 2009, we issued common stock to certain former DRI stockholders in exchange for full-recourse promissory notes which accrue interest at 2.78% per annum and have maturity dates of August 28, 2015.
During the year ended December 31, 2010, we issued 59,300 shares of our common stock to officers in exchange for full-recourse promissory notes which bear interest at 3.00% per annum.
Notes receivable from officers and former officers are collateralized by the underlying common stock purchased and are reported in the accompanying balance sheets as notes receivable from officers including accrued interest, reducing stockholders' equity. Interest earned is reported net of related income tax as a component of additional paid-in capital in the accompanying statement of changes in
F-23
Cinco Resources, Inc.
Notes to Consolidated Financial Statements (Continued)
(Amounts in thousands, except shares and per-share amounts)
10. Notes Receivable from Stockholders (Continued)
stockholders' equity. All outstanding principal and interest amounts are due at maturity. The following is a summary of principal and interest amounts outstanding at December 31:
| |
2008 | 2009 | 2010 | |||||||
|---|---|---|---|---|---|---|---|---|---|---|
Principal |
$ | 5,121 | $ | 25,902 | $ | 31,832 | ||||
Accrued interest |
1,319 | 240 | 1,026 | |||||||
Total |
$ | 6,440 | $ | 26,142 | $ | 32,858 | ||||
Subsequent to December 31, 2010, the note receivable from officers were redeemed in exchange for shares of our common stock. See Note 17—Subsequent Events for further discussion.
11. Share-Based Compensation
On August 30, 2002, our Board of Directors approved the 2002 Stock Option Plan (the "Plan") for certain of our officers and employees. The Plan, as amended, provides 35,000 options available for grant with exercise prices between $100 and $200 per share. The Plan terminates on August 29, 2012. Options granted under the Plan generally expire the earlier of 10 years from the date of grant, or August 29, 2012, and typically vest ratably over three years. On March 30, 2009, our Board of Directors approved the conversion of all stock options then outstanding into common stock awards. A total of 37,614 stock options were converted to 13,028 shares of common stock. There were no stock options outstanding at December 31, 2009 or 2010.
On February 28, 2008, our Board of Directors approved the 2008 Stock Incentive Plan (the "2008 Plan") for certain of our officers and employees. The 2008 Plan provides us the opportunity to grant options, stock appreciation rights and shares of our common stock, up to 11% of our total shares of common stock outstanding, generally at the beginning of each fiscal year. The 2008 Plan terminates on February 28, 2018. Under the 2008 Plan, awards of common stock typically vest in three equal portions over a requisite service period of three years, or vest at the end of a three-year requisite service period.
On July 14, 2010, Cima's Board of Directors approved the 2010 Stock Incentive Plan (the "2010 Plan") for certain officers, employees, directors and consultants. The 2010 Plan provides the opportunity to grant options, stock appreciation rights and shares of common stock, up to 9% of the total shares of common stock outstanding, generally at the beginning of each fiscal year. Under the 2010 Plan, awards of common stock to officers, employees and consultants typically vest at the end of a three-year requisite service period. Awards of common stock to directors vest immediately.
F-24
Cinco Resources, Inc.
Notes to Consolidated Financial Statements (Continued)
(Amounts in thousands, except shares and per-share amounts)
11. Share-Based Compensation (Continued)
A summary of the status of non-vested common stock awards is as follows:
| |
Number of Shares | Weighted Average Grant Date Fair Value Per Share |
|||||
|---|---|---|---|---|---|---|---|
Nonvested common stock awards at January 1, 2008 |
— | $ | — | ||||
Awards granted |
35,398 | 200.00 | |||||
Awards vested |
— | — | |||||
Nonvested common stock awards at December 31, 2008 |
35,398 | 200.00 | |||||
Awards granted |
125,478 | 81.04 | |||||
Awards vested |
(11,712 | ) | 200.00 | ||||
Nonvested common stock awards at December 31, 2009 |
149,164 | 99.93 | |||||
Awards granted |
157,666 | 90.87 | |||||
Awards vested |
(28,261 | ) | 151.75 | ||||
Awards forfeited |
(450 | ) | 81.04 | ||||
Nonvested common stock awards at December 31, 2010 |
278,119 | $ | 89.56 | ||||
Unrecognized compensation costs related to non-vested common stock amounted to $16,045 as of December 31, 2010, and are expected to be recognized over the remaining requisite service period of approximately two years.
As of December 31, 2010, there were 42,171 and 587 shares of common stock available for issuance under the 2008 Plan and the 2010 Plan, respectively.
12. Income Taxes
The following is a summary of our income tax expense for the years ended December 31:
| |
2008 | 2009 | 2010 | |||||||
|---|---|---|---|---|---|---|---|---|---|---|
Current |
||||||||||
Federal |
$ | — | $ | — | $ | — | ||||
State |
16 | 33 | 13 | |||||||
|
16 | 33 | 13 | |||||||
Deferred |
||||||||||
Federal |
— | — | — | |||||||
State |
— | — | — | |||||||
Total income tax expense |
$ | 16 | $ | 33 | $ | 13 | ||||
F-25
Cinco Resources, Inc.
Notes to Consolidated Financial Statements (Continued)
(Amounts in thousands, except shares and per-share amounts)
12. Income Taxes (Continued)
Income tax expense differed from amounts computed by applying the federal income tax rate of 34% to pre-tax income from continuing operations as a result of the following:
| |
2008 | 2009 | 2010 | |||||||
|---|---|---|---|---|---|---|---|---|---|---|
Income tax benefit at the U.S. federal statutory rate |
$ | (5,236 | ) | $ | (15,047 | ) | $ | (13,395 | ) | |
State taxes, net of federal benefit |
(191 | ) | (226 | ) | (6,295 | ) | ||||
Change in valuation allowance |
6,088 | 15,578 | 20,130 | |||||||
Permanent differences |
23 | 23 | 22 | |||||||
Other |
(668 | ) | (295 | ) | (449 | ) | ||||
Income tax expense |
$ | 16 | $ | 33 | $ | 13 | ||||
Deferred tax assets and liabilities are the result of temporary differences between the financial statement carrying values and tax bases of assets and liabilities. Significant components of net deferred tax assets and liabilities are as follows:
| |
As of December 31, | ||||||
|---|---|---|---|---|---|---|---|
| |
2009 | 2010 | |||||
Current deferred tax assets (liabilities): |
|||||||
Derivatives |
$ | 284 | $ | (991 | ) | ||
Interest on notes receivable from stockholders |
509 | — | |||||
Other |
— | 51 | |||||
|
793 | (940 | ) | ||||
Valuation allowance |
(416 | ) | (30 | ) | |||
Net current deferred tax assets (liabilities) |
377 | (970 | ) | ||||
Non-current deferred tax assets (liabilities): |
|||||||
Natural gas and oil properties |
(23,172 | ) | (12,508 | ) | |||
Net operating loss carryforwards |
82,232 | 94,230 | |||||
Share-based compensation |
2,393 | 5,189 | |||||
Derivatives |
(437 | ) | (773 | ) | |||
Tax credits |
695 | 681 | |||||
Other |
66 | 323 | |||||
|
61,777 | 87,142 | |||||
Valuation allowance |
(62,154 | ) | (86,172 | ) | |||
Net non-current deferred tax assets (liabilities) |
$ | (377 | ) | $ | 970 | ||
F-26
Cinco Resources, Inc.
Notes to Consolidated Financial Statements (Continued)
(Amounts in thousands, except shares and per-share amounts)
12. Income Taxes (Continued)
We provided a valuation allowance related to our deferred tax assets resulting primarily from net operating loss carryforwards based on our analysis of our ability to realize the related tax benefits. Net operating loss carryforwards for tax purposes have the following expiration dates:
Expiration Dates
|
Amounts | |||
|---|---|---|---|---|
2021 |
$ | 154 | ||
2022 |
7,941 | |||
2023 |
23,149 | |||
2024 |
13,507 | |||
2025 |
47,300 | |||
2026 |
68,510 | |||
2027 |
36,666 | |||
2028 |
8,107 | |||
2029 |
33,960 | |||
2030 |
15,556 | |||
|
$ | 254,850 | ||
As of December 31, 2010, we had net operating loss carryforwards of approximately $254,850 for federal income tax purposes that begin to expire in 2021, for which we have recorded a full valuation allowance. Utilization of net operating loss carryforwards may be limited by ownership changes which may have occurred or could occur in the future and by the separate return limitation year ("SRLY") rules.
13. Commitments and Contingencies
Lease Obligations
We have non-cancelable operating leases for office space that expire during the years ended December 31, 2013 and 2015. We incurred lease rental expenses of $513, $806 and $807 during the years ended December 31, 2008, 2009 and 2010, respectively. Future minimum payments under non-cancellable operating leases, as of December 31, 2010, were as follows:
Years
|
Minimum Payments | |||
|---|---|---|---|---|
2011 |
$ | 633 | ||
2012 |
633 | |||
2013 |
633 | |||
2014 |
592 | |||
2015 |
535 | |||
|
$ | 3,026 | ||
F-27
Cinco Resources, Inc.
Notes to Consolidated Financial Statements (Continued)
(Amounts in thousands, except shares and per-share amounts)
13. Commitments and Contingencies (Continued)
Litigation
Seismic litigation
We acquired a working interest in a field in Louisiana in 2004. Prior to the acquisition, the former working interest owner hired an independent third party to perform a 3-D seismic study on the land. In September 2005, we, along with the other working interest owners in this field, sued such third party in the 36th Judicial District Court, for the Parish of Beauregard, State of Louisiana for failure to abide by the existing contract. The third party countersued alleging that we and the other working interest owners improperly used the seismic data and is seeking damages. We believe that the claims of the third party are without merit. A bench trial on this matter was concluded in November 2011 and we anticipate that the court will issue a decision in early 2012. We are unable to estimate a range of possible losses in this matter.
DRI litigation
We are a defendant in a lawsuit filed in June 2002 in the 164th Judicial District Court of Harris County, Texas, involving notice of preferential rights to acquire additional interests in various properties, as well as the conduct and costs associated with field operations. During 2009, we settled our claims with one of the plaintiffs, the terms of which included our acquisition of the plaintiff's interest in certain of our existing properties. Furthermore, in August 2010 we elected not to pursue further appeals and paid a $1,500 judgment concluding significant parts of the litigation. Two issues relating to the preferential rights remain open and are expected to go to trial in February 2012. We do not believe that our exposure to economic damages is material; however, the plaintiffs are also seeking punitive damages and attorney's fees which cannot be quantified. We are vigorously defending ourselves in this matter.
Camden litigation
We previously filed suit in January 2009 in the 25th Judicial District Court of Colorado County, Texas against one of our tubing vendors alleging faulty construction of certain production casing which failed and resulted in loss to us. During the year ended December 31, 2010, we withdrew our claims, but certain of the other working interest owners in the affected properties filed suit against us in February 2010 in the 25th Judicial District Court of Colorado County, Texas, for the recovery of their portion of the loss incurred resulting from the faulty production casing. We are vigorously defending ourselves in this matter. We are unable to estimate a range of possible losses in this matter.
In addition to the aforementioned litigation, from time to time, we are subject to legal proceedings and claims that arise in the ordinary course of business. Like other oil and natural gas producers and marketers, our operations are subject to extensive and rapidly changing federal and state environmental, health and safety and other laws and regulations governing air emissions, wastewater discharges, and solid and hazardous waste management activities. We are not currently a party to any material legal proceeding and are not aware of any material legal or governmental proceedings against us, or contemplated to be brought against us other than the aforementioned litigation described above.
F-28
Cinco Resources, Inc.
Notes to Consolidated Financial Statements (Continued)
(Amounts in thousands, except shares and per-share amounts)
13. Commitments and Contingencies (Continued)
Environmental Issues
We are engaged in oil and gas exploration and production and may become subject to certain liabilities as they relate to environmental cleanup of well sites or other environmental restoration procedures as they relate to the drilling of oil and gas wells and the operation thereof. In connection with our acquisition of existing or previously drilled well bores, we may not be aware of what environmental safeguards were taken at the time such wells were drilled or during such time the wells were operated. Should it be determined that a liability exists with respect to any environmental clean up or restoration, we would be responsible for curing such a violation. No claim has been made, nor are we aware of any liability that exists, as it relates to any environmental cleanup, restoration or the violation of any rules or regulations relating thereto.
14. Major Customers and Concentrations
For the year ended December 31, 2010, natural gas and oil sales to four purchasers amounted to approximately 60% of our total natural gas and oil sales. For the year ended December 31, 2009, natural gas and oil sales to two purchasers amounted to approximately 40% of our total natural gas and oil sales, and accounts receivable due from one party amounted to approximately 17% of our total accounts receivable. For the year ended December 31, 2008, natural gas and oil sales to one purchaser amounted to approximately 28% and 45%, respectively, of our total natural gas and oil sales. We believe that there are potential alternative purchasers. However, there can be no assurance that we can establish such relationships and that those relationships will result in increased purchasers.
Our industry is cyclical, and from time to time there is a shortage of drilling rigs, equipment, supplies and qualified personnel. During these periods, the costs and delivery times of rigs, equipment and supplies are substantially greater. We are particularly sensitive to higher rig costs and drilling rig availability. If the unavailability or high cost of drilling rigs, equipment, supplies or qualified personnel were particularly severe in the areas where we operate, it could be material and adversely affect us. We believe that there are potential alternative providers of drilling services and that it may be necessary to establish relationships with new contractors. However, there can be no assurance that we can establish such relationships and that those relationships will result in increased availability of drilling rigs.
15. Oil and Gas Producing Activities
Set forth below is certain information regarding the costs incurred for oil and gas property acquisition, development and exploration activities for the years ended December 31:
| |
2008 | 2009 | 2010 | |||||||
|---|---|---|---|---|---|---|---|---|---|---|
Property acquisition costs: |
||||||||||
Unproved properties |
$ | 12,564 | $ | 18,665 | $ | 299 | ||||
Proved properties |
73 | 63,299 | — | |||||||
Exploration costs |
7,365 | 23,176 | 102,911 | |||||||
Developmental costs |
15,889 | 5,339 | 12,952 | |||||||
Total costs incurred |
$ | 35,891 | $ | 110,479 | $ | 116,162 | ||||
F-29
Cinco Resources, Inc.
Notes to Consolidated Financial Statements (Continued)
(Amounts in thousands, except shares and per-share amounts)
16. Disclosures About Oil and Gas Producing Activities (Unaudited)
Proved Reserves
The estimates of proved reserves and related valuations for the years ended December 31, 2009 and 2010 were prepared by Netherland, Sewell & Associates, Inc., independent petroleum engineers, and prepared internally for the year ended December 31, 2008. Each year's estimate of proved reserves and related valuations were also prepared in accordance with then-current provisions of ASC 932 and Statement of Financial Accounting Standards 69, or SFAS 69, Disclosures about Oil and Gas Producing Activities.
In 2009, the SEC provided new guidelines for estimating and reporting oil and natural gas reserves. Included in these new guidelines were two important changes impacting our reserves estimates and value at December 31, 2009. First, proved undeveloped reserves can be assigned to well locations more than one offset location away from an existing well if supported by geologic continuity and existing technology. Second, under these new guidelines, oil and natural gas reserves at December 31, 2009 and 2010 and at May 31, 2011 were estimated using an unweighted, arithmetic averages of the first-day-of-the-month oil and natural gas prices for the preceding 12-month period.
Estimates of proved reserves are inherently imprecise and are continually subject to revision based on production history, results of additional exploration and development, price changes and other factors. All of our estimated oil and natural gas reserves are attributable to properties within the
F-30
Cinco Resources, Inc.
Notes to Consolidated Financial Statements (Continued)
(Amounts in thousands, except shares and per-share amounts)
16. Disclosures About Oil and Gas Producing Activities (Unaudited) (Continued)
United States. A summary of our changes in quantities of proved oil and natural gas reserves for the years ended December 31, 2008, 2009 and 2010 are as follows:
| |
Natural Gas (MMcf) |
Oil (MBbls) |
Natural Gas Liquids (MBbls) |
Total (MMcfe) |
|||||||||
|---|---|---|---|---|---|---|---|---|---|---|---|---|---|
Proved Developed and Proved Undeveloped Reserves: |
|||||||||||||
Balances—January 1, 2008 |
31,469 | 2,036 | 997 | 49,667 | |||||||||
Extensions, discoveries and other additions |
7,981 | 165 | 62 | 9,343 | |||||||||
Purchases of minerals in place |
4,891 | 205 | 99 | 6,715 | |||||||||
Divestitures |
(216 | ) | (7 | ) | (5 | ) | (288 | ) | |||||
Production |
(1,638 | ) | (55 | ) | (25 | ) | (2,118 | ) | |||||
Revisions to previous estimates |
(3,366 | ) | (372 | ) | 116 | (4,902 | ) | ||||||
Balances—December 31, 2008 |
39,121 |
1,972 |
1,244 |
58,417 |
|||||||||
Extensions, discoveries and other additions |
3,938 | 48 | 42 | 4,478 | |||||||||
Purchases of minerals in place |
105,325 | 225 | 122 | 107,407 | |||||||||
Production |
(6,111 | ) | (43 | ) | (26 | ) | (6,525 | ) | |||||
Revisions to previous estimates |
(3,748 | ) | (739 | ) | (612 | ) | (11,854 | ) | |||||
Balances—December 31, 2009 |
138,525 |
1,463 |
770 |
151,923 |
|||||||||
Extensions, discoveries and other additions |
91,920 | 880 | 63 | 97,578 | |||||||||
Divestitures |
(3,641 | ) | — | — | (3,641 | ) | |||||||
Production |
(8,854 | ) | (48 | ) | (24 | ) | (9,286 | ) | |||||
Revisions to previous estimates |
11,551 | (112 | ) | 3 | 10,897 | ||||||||
Balances—December 2010 |
229,501 | 2,183 | 812 | 247,471 | |||||||||
Proved Developed Reserves: |
|||||||||||||
December 31, 2008 |
19,781 | 563 | 692 | 27,311 | |||||||||
December 31, 2009 |
58,806 | 466 | 394 | 63,966 | |||||||||
December 31, 2010 |
78,211 | 693 | 387 | 84,691 | |||||||||
The following is a discussion of the material changes in our proved reserve quantities for the years ended December 31, 2008, 2009 and 2010:
Year Ended December 31, 2008
For the year ended December 31, 2008, our negative revision of 4,902 MMcfe of previously estimated quantities consisted of a negative revision of 255 MBbls of oil and natural gas liquids and a negative revision of 3,372 MMcf of natural gas. Of the negative revision of our proved reserves for this period, 510 MMcfe were related to decreases in oil and natural gas prices from those used to calculate the prior year's proved reserves and 4,392 MMcfe were related to performance. Additions related to extensions of 9,343 MMcfe for this period consisted of 7,981 MMcf of natural gas extensions and 227 MBbls of oil and natural gas liquids extensions. Our additions resulting from extensions consisted of
F-31
Cinco Resources, Inc.
Notes to Consolidated Financial Statements (Continued)
(Amounts in thousands, except shares and per-share amounts)
16. Disclosures About Oil and Gas Producing Activities (Unaudited) (Continued)
2,455 MMcfe related to the drilling of new wells and 6,888 MMcfe related to new proved undeveloped locations. Additionally, acquisitions during the period were 6,715 MMcfe, consisting of 4,891 MMcf of natural gas and 304 MBbls of oil and natural gas liquids. The increase in proved reserves from acquisitions resulted from our purchase of additional interests in our non-Eagle Ford Shale South Texas conventional properties. The oil and natural gas prices used in calculating our reserves at December 31, 2008, were the unweighted averages of the historical first-day-of-the-month prices for the prior 12 months of $92.50 per Bbl of oil and $6.79 per MMBtu of natural gas.
Year Ended December 31, 2009
For the year ended December 31, 2009, our negative revision of 11,854 MMcfe of previously estimated quantities consisted of a negative revision of 1,351 MBbls of oil and natural gas liquids and a negative revision of 3,748 MMcf of natural gas. The negative revision of our proved reserves for this period related to decreases in oil and natural gas prices from those used to calculate the prior year's proved reserves was 5,006 MMcfe, while 6,848 MMcfe related to well performance. Additions related to extensions of 4,478 MMcfe for this period consisted of 3,938 MMcf of natural gas extensions and 90 MBbls of oil and natural gas liquids extensions. Our additions resulting from extensions consisted of 1,697 MMcfe related to the drilling of new wells and 2,781 MMcfe related to new proved undeveloped locations. Additionally, acquisitions during the period were 107,407 MMcfe, consisting of 105,325 MMcf of natural gas and 347 MBbls of oil and natural gas liquids. The increase in natural gas proved reserves from acquisitions was primarily related to our acquisition of Arkoma Basin properties from a private company primarily owned and controlled by Yorktown, while the increase in acquisitions of oil and natural gas liquids proved reserves related to the acquisition of additional interests in some of our non Eagle Ford Shale conventional South Texas properties. The oil and natural gas prices used in calculating our reserves at December 31, 2009, were the unweighted averages of the historical first-day-of-the-month prices for the prior 12 months of $57.65 per Bbl of oil and $3.87 per MMBtu of natural gas.
Year Ended December 31, 2010
For the year ended December 31, 2010, our positive revision of 10,897 MMcfe of previously estimated quantities consisted of a negative revision of 109 MBbls of oil and natural gas liquids and a positive revision of 11,551 MMcf of natural gas. The positive revision of natural gas reserve quantities is primarily due to improved well performance in our Arkoma Basin Woodford Shale wells, while the negative revisions of our oil and natural gas liquids reserve volumes was due to performance in certain of our non-Eagle Ford Shale South Texas conventional properties. Additions related to extensions of 97,578 MMcfe for this period consisted of 91,912 MMcf of natural gas extensions and 944 MBbls of oil and natural gas liquids extensions. Our additions related to extensions consisted of 29,945 MMcfe related to the drilling of new wells and 67,633 MMcfe related to new proved undeveloped locations. Additionally, divestitures during the period were 3,641 MMcf and related to the sale of natural non-Woodford Shale gas properties in the Arkoma Basin. The oil and natural gas prices used in calculating our reserves at December 31, 2010, were the unweighted averages of the historical first-day-of-the-month prices for the prior 12 months of $75.96 per Bbl of oil and $4.38 per MMBtu of natural gas.
F-32
Cinco Resources, Inc.
Notes to Consolidated Financial Statements (Continued)
(Amounts in thousands, except shares and per-share amounts)
16. Disclosures About Oil and Gas Producing Activities (Unaudited) (Continued)
Standardized Measure of Discounted Future Net Cash Flows Relating to Proved Reserves
The standardized measure of discounted future net cash flows relating to proved oil and natural gas reserves and the changes in standardized measure of discounted future net cash flows relating to proved oil and natural gas reserves were prepared in accordance with then-current provisions of ASC 932 and SFAS 69. Future cash inflows were computed by applying the unweighted, arithmetic average on the closing price on the first day of each month for the 12-month period prior to December 31, 2010 to estimated future production. Future production and development costs are computed by estimating the expenditures to be incurred in developing and producing the proved oil and natural gas reserves at year end, based on year-end costs and assuming continuation of existing economic conditions.
Estimated future income tax expenses are calculated by applying appropriate year-end statutory tax rates to estimated future pre-tax net cash flows relating to proved oil and natural gas reserves, less the tax basis of properties involved.
Future income tax expenses give effect to permanent differences, tax credits and loss carryforwards relating to the proved oil and natural gas reserves. Future net cash flows are discounted at a rate of 10% annually to derive the standardized measure of discounted future net cash flows. This calculation procedure does not necessarily result in an estimate of the fair market value of our oil and natural gas properties.
The standardized measure of discounted future net cash flows relating to proved oil and natural gas reserves were as follows as of December 31:
| |
2008 | 2009 | 2010 | |||||||
|---|---|---|---|---|---|---|---|---|---|---|
Future cash flows |
$ | 329,406 | $ | 546,482 | $ | 1,040,751 | ||||
Future production costs |
(114,976 | ) | (180,459 | ) | (301,005 | ) | ||||
Future development costs |
(87,807 | ) | (176,279 | ) | (318,978 | ) | ||||
Future income tax expense |
(10,676 | ) | (1,724 | ) | (2,992 | ) | ||||
Future net cash flows |
115,947 | 188,020 | 417,776 | |||||||
10% annual discount for estimated timing of cash flows |
(60,351 | ) | (126,447 | ) | (287,966 | ) | ||||
Standardized measure of discounted future net cash flows |
$ | 55,596 | $ | 61,573 | $ | 129,810 | ||||
Future cash flows as shown above were reported without consideration for the effects of derivative instruments outstanding at the end of each period.
F-33
Cinco Resources, Inc.
Notes to Consolidated Financial Statements (Continued)
(Amounts in thousands, except shares and per-share amounts)
16. Disclosures About Oil and Gas Producing Activities (Unaudited) (Continued)
Changes in Standardized Measure of Discounted Future Net Cash Flows
The changes in the standardized measure of discounted future net cash flows relating to proved oil and natural gas reserves were as follows for the years ended December 31:
| |
2008 | 2009 | 2010 | |||||||
|---|---|---|---|---|---|---|---|---|---|---|
Balance, beginning of period |
$ | 118,988 | $ | 55,596 | $ | 61,573 | ||||
Future production costs |
— | — | — | |||||||
Net change in sales and transfer prices and in production (lifting) costs related to future production |
(85,379 | ) | (19,344 | ) | 36,231 | |||||
Changes in estimated future development costs |
(9,796 | ) | 3,391 | (12,332 | ) | |||||
Sales and transfers of all oil and gas produced during the period |
(11,698 | ) | (12,659 | ) | (23,848 | ) | ||||
Net change due to extensions, discoveries and improved recovery |
13,546 | 1,628 | 47,610 | |||||||
Net change due to purchase of minerals in place |
9,170 | 39,885 | — | |||||||
Net change due to divestitures |
(1,077 | ) | — | (3,401 | ) | |||||
Net change due to revisions in quantity estimates |
(16,017 | ) | (12,478 | ) | 5,754 | |||||
Previously estimated development costs incurred during the period |
3,183 | 2,513 | 5,339 | |||||||
Accretion of discount |
15,872 | 5,961 | 6,214 | |||||||
Changes in timing and other |
(16,908 | ) | (6,377 | ) | 6,971 | |||||
Net changes in income taxes |
35,712 | 3,457 | (301 | ) | ||||||
Standardized measure of discounted future net cash flows |
$ | 55,596 | $ | 61,573 | $ | 129,810 | ||||
The commodity prices, inclusive of adjustments for quality and location, used to determine future net revenues related to the standardized measure calculation were as follows as of December 31:
| |
2008 | 2009 | 2010 | |||||||
|---|---|---|---|---|---|---|---|---|---|---|
Natural gas (per Mcf) |
$ | 5.49 | $ | 3.18 | $ | 3.67 | ||||
Oil (per Bbl) |
43.43 | 58.40 | 75.98 | |||||||
Natural gas liquids (per Bbl) |
25.48 | 30.00 | 39.41 | |||||||
17. Subsequent Events (Unaudited)
On April 28, 2011, we sold gas and oil properties located in Arkansas and Oklahoma for an unadjusted purchase price of $24,250. We used $13,000 of the proceeds to reduce amounts outstanding under our senior secured revolving credit facility.
Effective May 1, 2011, we acquired mineral interests in unproved properties in Niobrara and Weston Counties in the Powder River Basin of Wyoming for total consideration of $18,677. Cash consideration paid at close was $12,000 with the remaining balance due in three annual installments of $2,226.
At December 31, 2010, we had issued 59,300 shares of our common stock to officers in exchange for full-recourse promissory notes which accrued interest at 3.00% per annum. On May 4, 2011, we issued 37,062 shares of our common stock to officers in exchange for full-recourse promissory notes which accrued interest at 3.00% per annum. On November 14, 2011, we redeemed the balance of these
F-34
Cinco Resources, Inc.
Notes to Consolidated Financial Statements (Continued)
(Amounts in thousands, except shares and per-share amounts)
17. Subsequent Events (Unaudited) (Continued)
notes, $9,894, including accrued interest, in exchange for 82,448 shares of our common stock held by these officers.
Effective November 14, 2011, Cima's Board of Directors authorized a reverse split of Cima's common stock at a ratio of 500 for one. As a result of the reverse split, every 500 shares of Cima common stock outstanding were combined into one share of Cima common stock. The reverse split did not affect the amount of Cima's equity nor the number of our shares outstanding. Subsequent to the reverse stock split, all fractional shares were repurchased for $60,000 per share for an aggregate amount of $1,135 and cancelled.
Effective after the Cima reverse stock split on November 14, 2011, Cima's Board of Directors authorized a forward split of Cima's common stock at a ratio of one for 500. As a result of the forward split, each share of Cima common stock outstanding was converted into 500 shares of Cima common stock. The forward split did not affect the amount of Cima's equity nor the number of our shares outstanding.
Effective November 17, 2011, Cinco entered into an agreement and plan of merger with Cima, an entity affiliated through common ownership. Under the terms of the merger agreement, Cinco acquired all of Cima's outstanding shares, resulting in Cima becoming a wholly-owned subsidiary of Cinco. All of the outstanding shares of Cima common stock issued and outstanding immediately prior to the merger were converted into 1,446,546 shares of Cinco common stock. The transaction was accounted for as a reorganization of entities under common control, similar to a pooling of interests. As of the date of the merger, the net assets of Cima were recorded by Cinco at the historical carrying values of Cima. For financial statement presentation purposes, the financial position and results of operations have been presented on a combined basis, as if the merger occurred on January 1, 2010.
On November 17, 2011, our Board of Directors approved the Cinco Resources, Inc. 2011 Long Term Incentive Plan (the "2011 Plan"). The 2011 Plan amended and restated the 2008 Plan and the 2010 Plan. The 2010 Plan was merged with the 2008 Plan, and each share of Cima common stock covered by a restricted stock award originally granted under the 2010 Plan was converted into a Cinco restricted stock award.
At December 31, 2010, we had 525,000 Preferred Shares outstanding. The Preferred Shares were convertible into shares of common stock at an initial conversion price of $200 per share. On November 15, 2011 and prior to the merger with Cima, all of our Preferred Shares were converted to 875,000 shares of our common stock pursuant to an induced conversion offer to the holders of our Preferred Shares to convert such shares to common stock at an adjusted conversion rate of $120 per share. As a result of the induced conversion, we will record a deemed preferred dividend of $42,000 during the three months ended December 31, 2011.
On November 21, 2011, we issued 250,000 shares of our common stock to an affiliate of an existing stockholder for total cash proceeds of $30,000. This additional capital was used to fund the initial $13,500 payment on our recent acquisition of Powder River Basin acreage and to support our on-going drilling program. Additionally, immediately prior to our acquisition of Cima in November 2011, we used approximately $7,700 of cash to (i) fund the repurchase of 54,954 shares of Cima common stock and (ii) fund the purchase of fractional shares resulting from Cima's 500 for one reverse common stock split.
F-35
Cinco Resources, Inc.
Notes to Consolidated Financial Statements (Continued)
(Amounts in thousands, except shares and per-share amounts)
17. Subsequent Events (Unaudited) (Continued)
On November 21, 2011, we acquired mineral interests in unproved and proved properties in Niobrara County, Wyoming in the Powder River Basin for total consideration of $25,000. At closing, we paid $12,500 in cash and executed a promissory note which provides for payment on November 21, 2012 of $12,500 plus interest at a rate of 5% per annum. The note is secured by a first priority security interest and lien on the properties acquired. The purchase of this acreage resulted in a seller's bonus fee totaling $1,998 due to a third party. At closing, we paid cash consideration of $999, and the remaining balance is due November 21, 2012.
In December 2011, we amended our senior secured revolving credit facility and our second lien term loan facility. As amended, our $300,000 senior secured revolving credit facility has an initial borrowing base of $85,000, a maturity date of January 4, 2016, and financial covenants substantially similar to our previous credit facilities. We intend to use a portion of the proceeds from our initial public offering to repay all amounts under our senior secured revolving credit facility and to repay all amounts under and retire our second lien term loan facility.
On December 14, 2011, our Board of Directors approved the issuance, effective January 1, 2012, of 61,444 restricted shares of common stock to employees, which shares vest at the end of a three-year requisite service period. Our Board of Directors further approved the issuance of 53,420 restricted shares of common stock and 53,420 stock options to employees, each effective upon the closing of our initial public offering and each of which vests at the end of a three-year requisite service period.
* * * * * * *
F-36
Cinco Resources, Inc.
Unaudited Consolidated Balance Sheet
(Amounts in thousands, except shares and per-share amounts)
| |
As of September 30, 2011 |
|||
|---|---|---|---|---|
ASSETS |
||||
CURRENT ASSETS: |
||||
Cash and cash equivalents |
$ | 27,489 | ||
Accounts receivable, net: |
||||
Joint interest owners |
4,716 | |||
Natural gas and oil sales |
3,407 | |||
Oilfield inventory |
746 | |||
Derivative assets |
4,615 | |||
Prepaid expenses and other current assets |
408 | |||
Assets of discontinued operations |
— | |||
Total current assets |
41,381 | |||
PROPERTY AND EQUIPMENT: |
||||
Natural gas and oil properties, at cost, using the successful efforts method of accounting |
487,110 | |||
Other property and equipment, at cost |
1,068 | |||
|
488,178 | |||
Less: accumulated depletion, depreciation and amortization |
(213,439 | ) | ||
Net property and equipment |
274,739 | |||
OTHER NON-CURRENT ASSETS: |
||||
Derivative assets |
798 | |||
Deferred tax assets |
1,519 | |||
Other |
1,359 | |||
Total other non-current assets |
3,676 | |||
Total assets |
$ | 319,796 | ||
LIABILITIES AND STOCKHOLDERS' EQUITY |
||||
CURRENT LIABILITIES: |
||||
Accounts payable |
$ | 2,272 | ||
Accrued liabilities |
27,895 | |||
Derivative liabilities |
— | |||
Natural gas and oil sales payable |
5,147 | |||
Advances from joint interest owners |
179 | |||
Current maturities of long-term debt |
2,184 | |||
Current deferred tax liabilities |
1,519 | |||
Total current liabilities |
39,196 | |||
NON-CURRENT LIABILITIES: |
||||
Long-term debt, net of current maturities |
87,164 | |||
Derivative liabilities |
— | |||
Asset retirement obligations |
6,951 | |||
Total liabilities |
133,311 | |||
COMMITMENTS AND CONTINGENCIES (Note 14) |
||||
STOCKHOLDERS' EQUITY: |
||||
Series A convertible preferred stock—$0.10 par value, 625,000 shares authorized; 525,000 issued and outstanding; liquidation preference of $105,000 |
53 | |||
Common stock—$0.10 par value, 4,075,000 shares authorized; 3,448,623 shares issued and outstanding |
345 | |||
Additional paid-in capital |
405,795 | |||
Notes receivable from stockholders |
(37,310 | ) | ||
Accumulated deficit |
(182,398 | ) | ||
Total stockholders' equity |
186,485 | |||
Total liabilities and stockholders' equity |
$ | 319,796 | ||
See accompanying notes to these consolidated financial statements.
F-37
Cinco Resources, Inc.
Unaudited Consolidated Statements of Operations
(Amounts in thousands, except shares and per-share amounts)
| |
Nine months ended September 30, |
||||||
|---|---|---|---|---|---|---|---|
| |
2010 | 2011 | |||||
REVENUES: |
|||||||
Natural gas sales |
$ | 17,144 | $ | 21,679 | |||
Oil sales |
1,949 | 14,191 | |||||
Natural gas liquids sales |
703 | 603 | |||||
Total revenues |
19,796 | 36,473 | |||||
OPERATING EXPENSES: |
|||||||
Lease operating |
4,849 | 6,812 | |||||
Workovers |
2,085 | 511 | |||||
Severance and ad valorem taxes |
1,260 | 2,399 | |||||
Exploration |
3,363 | 4,154 | |||||
Depletion, depreciation and amortization |
11,138 | 23,981 | |||||
Impairment of natural gas and oil properties |
6,077 | 24,545 | |||||
General and administrative |
12,294 | 17,899 | |||||
Total operating expenses |
41,066 | 80,301 | |||||
OPERATING LOSS |
(21,270 | ) | (43,828 | ) | |||
OTHER INCOME (EXPENSE): |
|||||||
Gain on property sales |
809 | 282 | |||||
Gain on derivative instruments |
8,222 | 5,137 | |||||
Interest expense |
(5,049 | ) | (5,154 | ) | |||
Other expense |
(577 | ) | (41 | ) | |||
Total other income |
3,405 | 224 | |||||
LOSS FROM CONTINUING OPERATIONS |
(17,865 | ) | (43,604 | ) | |||
INCOME FROM DISCONTINUED OPERATIONS |
5,232 | 9,987 | |||||
NET LOSS |
$ | (12,633 | ) | $ | (33,617 | ) | |
EARNINGS PER COMMON SHARE: |
|||||||
Basic and diluted from continuing operations |
$ | (8.74 | ) | $ | (13.74 | ) | |
Basic and diluted from discontinued operations |
2.56 | 3.15 | |||||
Total basic and diluted |
$ | (6.18 | ) | $ | (10.59 | ) | |
WEIGHTED AVERAGE SHARES OUTSTANDING: |
|||||||
Basic and diluted |
2,043,380 | 3,174,324 | |||||
See accompanying notes to these consolidated financial statements.
F-38
Unaudited Consolidated Statements of Changes in Stockholders' Equity
For the nine months ended September 30, 2011
(Amounts in thousands, except shares and per-share amounts)
| |
Preferred Stock | Common Stock | |
|
|
|
|||||||||||||||||||
|---|---|---|---|---|---|---|---|---|---|---|---|---|---|---|---|---|---|---|---|---|---|---|---|---|---|
| |
Additional Paid-in Capital | Notes Receivable from Stockholders | Accumulated Deficit | |
|||||||||||||||||||||
| |
Shares | Amount | Shares | Amount | Total | ||||||||||||||||||||
BALANCES, January 1, 2011 |
525,000 | $ | 53 | 2,844,082 | $ | 284 | $ | 342,489 | $ | (32,858 | ) | $ | (148,781 | ) | $ | 161,187 | |||||||||
Issuance of common stock for cash |
— | — | 525,000 | 53 | 52,447 | — | — | 52,500 | |||||||||||||||||
Issuance of common stock for notes receivable |
— | — | 37,062 | 4 | 3,702 | (3,706 | ) | — | — | ||||||||||||||||
Issuance of common stock awards |
— | — | 65,460 | 7 | (7 | ) | — | — | — | ||||||||||||||||
Forfeiture of common stock awards |
(3,000 | ) | (1 | ) | 1 | — | — | — | |||||||||||||||||
Share-based compensation expense |
— | — | — | — | 8,127 | — | — | 8,127 | |||||||||||||||||
Interest on notes receivable from stockholders, net of tax |
— | — | — | — | 746 | (746 | ) | — | — | ||||||||||||||||
Repurchase and cancellation of common stock, at cost |
— | — | (19,982 | ) | (2 | ) | (1,710 | ) | — | — | (1,712 | ) | |||||||||||||
Net loss |
— | — | — | — | — | — | (33,617 | ) | (33,617 | ) | |||||||||||||||
BALANCES, September 30, 2011 |
525,000 | $ | 53 | 3,448,622 | $ | 345 | $ | 405,795 | $ | (37,310 | ) | $ | (182,398 | ) | $ | 186,485 | |||||||||
See accompanying notes to these consolidated financial statements.
F-39
Cinco Resources, Inc.
Unaudited Consolidated Statements of Cash Flows
(Amounts in thousands, except shares and per-share amounts)
| |
Nine months ended September 30, |
||||||
|---|---|---|---|---|---|---|---|
| |
2010 | 2011 | |||||
CASH FLOWS FROM OPERATING ACTIVITIES: |
|||||||
Net loss |
$ | (12,633 | ) | $ | (33,617 | ) | |
Adjustments to reconcile net loss to net cash provided by operating activities: |
|||||||
Exploration expense |
3,354 | 4,152 | |||||
Depletion, depreciation and amortization |
12,757 | 24,425 | |||||
Impairment of natural gas and oil properties |
6,181 | 24,545 | |||||
Share-based compensation expense |
6,290 | 8,127 | |||||
Gain on property sales |
(3,007 | ) | (8,475 | ) | |||
Unrealized gain on derivative instruments |
(6,056 | ) | (680 | ) | |||
Amortization of loan fees |
606 | 698 | |||||
Changes in operating assets and liabilities: |
|||||||
Accounts receivable, net |
(332 | ) | 6,305 | ||||
Oilfield inventory |
1,226 | (173 | ) | ||||
Prepaid expenses and other current assets |
256 | 822 | |||||
Accounts payable |
(330 | ) | 564 | ||||
Accrued liabilities |
1,020 | (10,530 | ) | ||||
Natural gas and oil sales payable |
(1,142 | ) | 2,395 | ||||
Advances from joint interest owners |
(251 | ) | (4,137 | ) | |||
Other non-current assets and liabilities |
137 | 17 | |||||
Net cash provided by operating activities |
8,076 | 14,438 | |||||
CASH FLOWS FROM INVESTING ACTIVITIES: |
|||||||
Exploration and development of natural gas and oil properties |
(64,963 | ) | (84,820 | ) | |||
Proceeds from property sales |
5,900 | 24,279 | |||||
Acquisition of natural gas and oil properties |
(40 | ) | (12,044 | ) | |||
Other property and equipment additions |
(74 | ) | (134 | ) | |||
Net cash used in investing activities |
(59,177 | ) | (72,719 | ) | |||
CASH FLOWS FROM FINANCING ACTIVITIES: |
|||||||
Payment of debt issuance costs |
(412 | ) | — | ||||
Borrowings under revolving line of credit |
29,300 | — | |||||
Repayments under revolving line of credit |
(14,000 | ) | (3,000 | ) | |||
Proceeds from issuance of common stock |
42,000 | 52,500 | |||||
Repurchase and cancellation of common stock |
(557 | ) | (1,712 | ) | |||
Net cash provided by financing activities |
56,331 | 47,788 | |||||
NET INCREASE (DECREASE) IN CASH AND CASH EQUIVALENTS |
5,230 | (10,493 | ) | ||||
CASH AND CASH EQUIVALENTS, beginning of period |
9,647 | 37,982 | |||||
CASH AND CASH EQUIVALENTS, end of period |
$ | 14,877 | $ | 27,489 | |||
SUPPLEMENTAL DISCLOSURE OF CASH FLOW INFORMATION: |
|||||||
Cash paid during the period: |
|||||||
Interest |
4,859 | 4,643 | |||||
Taxes |
— | — | |||||
SUPPLEMENTAL DISCLOSURE OF NON-CASH TRANSACTIONS: |
|||||||
Accrual of interest on stockholder notes receivable |
575 | 746 | |||||
Acquisition of properties in exchange for debt |
— | 6,677 | |||||
Issuance of notes receivable to officers in exchange for common stock |
— | 3,706 | |||||
Capitalized asset retirement obligations |
12 | 3,143 | |||||
See accompanying notes to these consolidated financial statements.
F-40
Cinco Resources, Inc.
Notes to Consolidated Financial Statements
(Amounts in thousands, except shares and per-share amounts)
1. Organization and Nature of Business
Nature of Business
Cinco Resources, Inc. (together with its subsidiaries, "Cinco," "we," "us," or "our") is an independent energy company focused on the acquisition and development of unconventional oil and natural gas resources. Our properties are located primarily in three core areas: the Eagle Ford Shale in South Texas, the Powder River Basin of Wyoming and the Woodford Shale in the Arkoma Basin of Eastern Oklahoma.
2. Summary of Significant Accounting Policies
Consolidation and Basis of Presentation
The accompanying interim unaudited consolidated financial statements have been prepared in accordance with accounting principles generally accepted in the United States of America ("U.S. GAAP") and include the accounts of the Company and its wholly-owned subsidiaries. Intercompany accounts and transactions have been eliminated. In our opinion, these interim unaudited consolidated financial statements include all adjustments of a normal recurring nature necessary for a fair statement of the results for the interim periods presented.
Certain disclosures have been condensed or omitted from these interim unaudited consolidated financial statements. Accordingly, they do not include all of the information and notes required by U.S. GAAP for complete financial statements and should be read in conjunction with the audited consolidated financial statements and notes for the year ended December 31, 2010.
Significant Estimates
The preparation of financial statements in conformity with U.S. GAAP requires us to make estimates and assumptions that affect the amounts reported in the financial statements and accompanying notes. These estimates and assumptions may also affect disclosure of contingent assets and liabilities at the date of the financial statements and the reported amounts of revenues and expenses during the reporting period. Our interim unaudited consolidated financial statements are based on a number of significant estimates, including natural gas and oil revenues, accrued assets and liabilities, stock-based compensation, valuation of derivative instruments and natural gas and oil reserves. The estimates of natural gas and oil reserves quantities and future net cash flows are the basis for the calculation of depletion and impairment of natural gas and oil properties, as well as estimates of asset retirement obligations and certain tax accruals. While we believe our estimates are reasonable, changes in facts and assumptions or the discovery of new information may result in revised estimates. Actual results could differ from these estimates and it is at least reasonably possible these estimates could be revised in the near term. These revisions could be material.
New Accounting Pronouncements
Fair Value. In May 2011, the FASB issued Accounting Standards Update ("ASU") 2011-04, Amendments to Achieve Common Fair Value Measurement and Disclosure Requirements in U.S. GAAP and IFRS ("ASU 2011-04"). ASU 2011-04 amends Accounting Standards Codification ("ASC") 820, Fair Value Measurements ("ASC 820"), providing a consistent definition and measurement of fair value, as well as similar disclosure requirements between U.S. GAAP and International Financial Reporting
F-41
Cinco Resources, Inc.
Notes to Consolidated Financial Statements (Continued)
(Amounts in thousands, except shares and per-share amounts)
2. Summary of Significant Accounting Policies (Continued)
Standards. ASU 2011-04 changes certain fair value measurement principles, clarifies the application of existing fair value measurements and expands the ASC 820 disclosure requirements, particularly for Level 3 fair value measurements. We do not expect the adoption of ASU 2011-04 to have a material effect on our consolidated financial statements, but may require certain additional disclosures. The amendments in ASU 2011-04 are to be applied prospectively. For public entities, the amendments are effective during interim and annual periods beginning after December 15, 2011.
3. Impairment of Natural Gas and Oil Properties
We review our proved natural gas and oil properties for impairment whenever events and circumstances indicate that a decline in the recoverability of their carrying value may have occurred. We estimate the expected undiscounted future cash flows of our natural gas and oil properties and compare such undiscounted future cash flows to the carrying amount of the natural gas and oil properties to determine if the carrying amount is recoverable. If the carrying amount exceeds the estimated undiscounted future cash flows, we will adjust the carrying amount of the natural gas and oil properties to fair value. See further discussion in Note 8—Fair Value Measurements. We assess our unproved natural gas and oil properties periodically for impairment on a property-by-property basis based on remaining lease terms, drilling results or future plans to develop acreage and record impairment expense for any decline in value. Based on our analysis, the following impairments were recorded during the nine months ended September 30:
| |
2010 | 2011 | |||||
|---|---|---|---|---|---|---|---|
Impairment of natural gas and oil properties |
|||||||
Proved properties |
$ | 4,800 | $ | 20,562 | |||
Unproved properties |
1,277 | 3,983 | |||||
Total impairment of natural gas and oil properties |
$ | 6,077 | $ | 24,545 | |||
Proved property impairment recorded resulted from declines in well production and a decrease in natural gas prices causing the projected reserves to be significantly lower. Unproved property impairment recorded resulted from the abandonment of several prospects which we determined did not warrant development during the respective period, none of which were individually significant.
4. Earnings Per Share
We compute basic net income per share using the weighted-average number of shares of common stock outstanding during the period. Diluted net income per share is computed using the weighted-average number of shares of common stock and includes the effect of all potentially dilutive common shares underlying the following:
| |
As of September 30, | ||||||
|---|---|---|---|---|---|---|---|
| |
2010 | 2011 | |||||
Series A Convertible Preferred Stock (Note 10) |
525,000 | 525,000 | |||||
Warrants |
70,700 | 70,700 | |||||
F-42
Cinco Resources, Inc.
Notes to Consolidated Financial Statements (Continued)
(Amounts in thousands, except shares and per-share amounts)
4. Earnings Per Share (Continued)
The shares of common stock underlying the Preferred Shares and warrants, as shown in the preceding table, are not included in weighted average shares outstanding for the nine months ended September 30, 2010 and 2011 as their effects were anti-dilutive.
5. Acquisitions
Effective May 1, 2011, we acquired mineral interests in unproved properties in Niobrara and Weston Counties in the Powder River Basin of Wyoming for total consideration of $18,677. Cash consideration paid at closing was $12,000 with the remaining balance being financed by the seller and due in three annual installments of $2,226. See Note 9—Long-Term Debt for further discussion.
6. Discontinued Operations
During the year ended December 31, 2010, we sold our interest in certain Arkoma Basin properties for cash consideration totaling $6,237. During the nine months ended September, 2011, we sold gas and oil properties located in Arkansas and Oklahoma for an unadjusted purchase price of $24,425. The operating results of the properties and the gain from the sale of the properties sold have been excluded from continuing operations on our consolidated statements of operations and are included in income from discontinued operations. The following is a summary of discontinued operations for the nine months ended September 30:
| |
2010 | 2011 | |||||
|---|---|---|---|---|---|---|---|
Revenues |
|||||||
Natural gas sales |
$ | 6,771 | $ | 3,029 | |||
Oil sales |
3 | 15 | |||||
Natural gas liquids sales |
1 | 1 | |||||
Total revenues |
6,775 | 3,045 | |||||
Operating expenses |
|||||||
Lease operating |
1,856 | 710 | |||||
Workovers |
9 | 17 | |||||
Severance and ad valorem taxes |
162 | 82 | |||||
Exploration |
(9 | ) | (2 | ) | |||
Depletion, depreciation and amortization |
1,619 | 444 | |||||
Impairment of natural gas and oil properties |
104 | — | |||||
Total operating expenses |
3,741 | 1,251 | |||||
Operating income |
3,034 |
1,794 |
|||||
Gain on sale of natural gas and oil properties |
2,198 |
8,193 |
|||||
Income from discontinued operations |
$ | 5,232 | $ | 9,987 | |||
F-43
Cinco Resources, Inc.
Notes to Consolidated Financial Statements (Continued)
(Amounts in thousands, except shares and per-share amounts)
7. Derivative Instruments
Commodity Derivatives
We periodically enter into derivative financial instruments to mitigate the risk of volatility in commodity prices with respect to a portion of our gas and oil production. We use these instruments to manage the inherent uncertainty of future revenues due to gas and oil price volatility. Our derivative financial instruments include fixed-price swaps, basis swaps, costless price collars, call options and put spreads. Under the terms of the fixed-price swaps, we will receive a fixed price for our production and pay a variable market price to the contract counterparty. For the basis swaps, we pay a fixed differential between two regional gas index prices and receive a variable differential on the same two index prices to the contract counterparty. Two-way collars set a floor and ceiling price for the hedged production. If the applicable monthly price indices are outside of the ranges set by the floor and ceiling prices in the various collars, we will cash-settle the difference with the counterparty to the collars. A three-way collar is a combination of three options: a sold call, a purchased put and a sold put. The sold call establishes the maximum price that we will receive for the contracted commodity volumes. The purchased put establishes the minimum price that we will receive for the contracted volumes unless the market price for the commodity falls below the sold put strike price, at which point the minimum price equals the reference price (i.e., NYMEX) plus the excess of the purchased put strike price over the sold put strike price. A put spread consists of a purchased put and a sold put. The purchased put establishes the minimum price we will receive for the contracted volumes unless the market price for the commodity falls below the sold put strike price, at which point the minimum price equals the reference price (i.e. NYMEX) plus the excess of the purchased put strike over the sold put strike. A sold call requires us to pay the difference between the reference price (i.e. NYMEX) and the market price for the commodity if the market price exceeds the strike price of the sold call option.
The following is a summary of our net open natural gas and oil derivative positions as of September 30, 2011. The natural gas prices listed below are New York Mercantile Exchange ("NYMEX") Henry Hub prices while the oil prices listed below are NYMEX Crude Oil Futures. Basis swaps are between NYMEX Henry Hub and Centerpoint East ("CPE") Inside FERC, a mid-continent
F-44
Cinco Resources, Inc.
Notes to Consolidated Financial Statements (Continued)
(Amounts in thousands, except shares and per-share amounts)
7. Derivative Instruments (Continued)
index point. Where we have purchased deferred premium put or call options, the prices below reflect the cost of such option purchases.
| |
Contract Period | |||||||||
|---|---|---|---|---|---|---|---|---|---|---|
Position Descriptions
|
2011 | 2012 | 2013 | |||||||
Swaps (MMBtu) |
— | 1,362,500 | 912,500 | |||||||
Average price per MMBtu |
$ | — | $ | 5.17 | $ | 5.22 | ||||
Closed out swaps (MMBtu)(1) |
814,900 |
|||||||||
Average price per MMBtu |
$ | 0.62 | ||||||||
Two-way collars (MMBtu) |
85,000 |
127,500 |
— |
|||||||
Average price per MMBtu |
||||||||||
Ceiling sold price (call) |
$ | 7.50 | $ | 7.50 | $ | — | ||||
Floor purchased price (put) |
7.00 | 7.00 | — | |||||||
Three-way collars (MMBtu) |
85,000 |
127,500 |
— |
|||||||
Average price per MMBtu |
||||||||||
Ceiling sold price (call) |
$ | 8.55 | $ | 8.55 | $ | — | ||||
Floor purchased price (put) |
7.00 | 7.00 | — | |||||||
Floor sold price (put) |
5.00 | 5.00 | — | |||||||
Put spreads (MMBtu)(2) |
579,000 |
2,546,000 |
— |
|||||||
Average price per MMBtu |
||||||||||
Floor purchased price (put) |
$ | 6.66 | $ | 6.59 | $ | — | ||||
Floor sold price (put) |
4.51 | 4.81 | — | |||||||
Sold calls (MMBtu) |
524,000 |
514,710 |
— |
|||||||
Average price per MMBtu |
||||||||||
Ceiling sold price (call) |
$ | 5.83 | $ | 6.40 | $ | — | ||||
Basis swaps (MMBtu) |
646,798 |
1,448,077 |
— |
|||||||
Average price per MMBtu |
$ | (0.53 | ) | $ | (0.49 | ) | $ | — | ||
MMBtu—Million British thermal units
- (1)
- Closed
out swaps represent an offsetting purchased and sold swap with the $MMBtu representing the difference between the two which will be received by Cinco
regardless of future price movements in the underlying commodity.
- (2)
- Natural gas put spread positions incorporate long put positions assuming a floor purchased price (put) and a floor sold price (put) of zero.
Interest Rate Swaps
We periodically enter into interest rate swaps to manage our exposure to interest rate volatility. Our interest rate swaps include contracts in which we pay a fixed rate and receive a variable rate on a total notional principal amount.
F-45
Cinco Resources, Inc.
Notes to Consolidated Financial Statements (Continued)
(Amounts in thousands, except shares and per-share amounts)
7. Derivative Instruments (Continued)
At September 30, 2011, we had a $50,000 notional amount and a weighted average fixed month LIBOR price of 2.21% through September 30, 2012.
Open Derivative Instruments
The following summarizes the location and fair value of our open derivative instruments as of September 30, 2011:
| |
Balance Sheet Location | Fair Value | ||||
|---|---|---|---|---|---|---|
Short-term commodity derivatives |
Derivative assets, current | $ | 5,465 | |||
Short-term interest rate swaps(1) |
Derivative assets, current | (850 | ) | |||
|
4,615 | |||||
Long-term commodity derivatives |
Derivative assets |
798 |
||||
- (1)
- Unrealized loss on interest rate swaps are included in derivative assets, current pursuant to master netting agreements.
None of our derivatives are designated as hedging instruments.
Unrealized gains and losses, at fair value, are included on our consolidated balance sheets as current or non-current assets or liabilities based on the period covered under the related contracts. Changes in the fair value of our commodity derivative contracts and interest rate swap contracts are recorded in earnings as they occur. The following is a summary of the effect of derivative instruments on our consolidated statement of operations for the nine months ended September 30:
| |
|
Amount of Gain (Loss) Recognized |
|||||||
|---|---|---|---|---|---|---|---|---|---|
| |
Location of Gain (Loss) Recognized on the Statement of Operations |
||||||||
Description
|
2010 | 2011 | |||||||
Realized gain on commodity derivatives |
Gain on derivative instruments | $ | 2,889 | $ | 5,209 | ||||
Realized loss on interest rate swaps |
Gain on derivative instruments | (723 | ) | (752 | ) | ||||
Total realized gain on derivative instruments |
2,166 | 4,457 | |||||||
Unrealized gain (loss) on commodity derivatives |
Gain on derivative instruments |
6,953 |
(17 |
) |
|||||
Unrealized gain (loss) on interest rate swaps |
Gain on derivative instruments | (897 | ) | 697 | |||||
Total unrealized gain on derivative instruments |
6,056 | 680 | |||||||
Net gain on derivative instruments |
$ | 8,222 | $ | 5,137 | |||||
All of our oil and gas properties are pledged as collateral under our commodity derivative arrangements.
F-46
Cinco Resources, Inc.
Notes to Consolidated Financial Statements (Continued)
(Amounts in thousands, except shares and per-share amounts)
8. Fair Value Measurements
The following tables summarize the valuation of our financial assets and liabilities that were accounted for at fair value on a recurring basis in accordance with the fair value hierarchy as of September 30, 2011:
| |
Level 1 | Level 2 | Level 3 | Total Fair Value |
|||||||||
|---|---|---|---|---|---|---|---|---|---|---|---|---|---|
Commodity derivative assets |
$ | — | $ | 6,263 | $ | — | $ | 6,263 | |||||
Interest rate derivative liabilities |
— | (850 | ) | — | (850 | ) | |||||||
|
$ | — | $ | 5,413 | $ | — | $ | 5,413 | |||||
We estimate the fair value of derivative contracts based on the present value of the difference in exchange-quoted forward price curves and contractual settlement prices, multiplied by notional quantities. We valued the option contracts using industry-standard option pricing models and observable market inputs. Additional disclosures related to fair value of derivative financial instruments are provided in Note 7—Derivative Instruments.
Assets and liabilities accounted for at fair value on a non-recurring basis in accordance with the fair value hierarchy include asset retirement obligations incurred and warrants. The fair value of our asset retirement obligations incurred totaled $57 during the nine months ended September 30, 2011. The fair value of additions to the asset retirement obligation liability is measured using valuation techniques consistent with the income approach, which converts future cash flows to a single discounted amount. Significant inputs to the valuation include: (i) estimated plug and abandonment cost per well based on our experience; (ii) estimated remaining life per well based on the reserve life per well; (iii) future inflation factors; and (iv) our average credit adjusted risk free rate. These assumptions represent Level 3 inputs.
In addition, if the carrying amount of our natural gas and oil properties exceeds the estimated undiscounted future cash flows, we will adjust the carrying amount of the natural gas and oil properties to fair value. The fair value of our natural gas and oil properties uses valuation techniques consistent with the income and market approach. The factors used to determine fair value are subject to management's judgment and expertise and include, but are not limited to, recent sales prices of comparable properties, the present value of future cash flows, net of estimated operating and development costs using estimates of proved reserves, future commodity pricing, future production estimates, anticipated capital expenditures and various discount rates commensurate with the risk and current market conditions associated with the expected cash flow projected. These assumptions represent Level 3 inputs. See further discussion in Note 3—Impairment of Natural Gas and Oil Properties.
F-47
Cinco Resources, Inc.
Notes to Consolidated Financial Statements (Continued)
(Amounts in thousands, except shares and per-share amounts)
9. Long-Term Debt
Long-term debt consisted of the following as of September 30, 2011:
Senior secured revolving credit facility |
$ | 53,000 | ||
Second lien term loan facility |
30,000 | |||
Acquisition note payable, net of discount of $329 |
6,348 | |||
|
89,348 | |||
Less: current portion, net of discount of $42 |
2,184 | |||
Total long-term debt |
$ | 87,164 | ||
Senior secured revolving credit facility. In October 2009, we entered into a senior secured revolving credit facility with a group of banks for a term of three years that matures in October 2012. The amount of borrowings under our senior secured revolving credit facility is limited to the lesser of $300,000 or the amount of the borrowing base which is determined semi-annually on October 1 and April 1 by the lenders primarily based on estimates of the value of our proved reserves. As of September 30, 2011, our borrowing base was $63,000, leaving $10,000 available for borrowing.
Borrowings under our senior secured revolving credit facility bear interest at our election at either (i) a London Inter Bank Offer Rate, or LIBOR, based rate or (ii) the issuing bank's base rate plus an applicable margin ranging from 2.25% to 3.25%. Should we elect base rate pricing, our applicable margin would be 1.25% to 2.25%. As of September 30, 2011, the interest rate payable on borrowings under our senior secured revolving credit facility was approximately 3.29%. There is also an annual commitment fee, payable quarterly, of 0.50% on the undrawn portion of our borrowing base.
Second lien term loan facility. In addition to borrowings on our senior secured revolving credit facility, in October 2009 we entered into a second lien term loan facility with a group of banks. The size of this second lien term loan facility is $50,000 of which $30,000 is available for borrowing and has been outstanding since October 2009. This credit facility matures in April 2013. Borrowings under our second lien term loan facility bear interest at the greater of one month LIBOR of 3.50% plus a margin of 9.50%. As of September 30, 2011, the interest rate payable on borrowings under our second lien term loan facility was 13%. Both the senior secured revolving credit facility and second lien term loan facility are collateralized by substantially all of our assets and require us to maintain certain financial ratios, among other covenants, including a minimum current ratio, minimum debt coverage ratio, minimum asset coverage ratio and a minimum interest coverage ratio. In April 2011, we were granted a limited waiver for non-compliance with our current ratio covenant for the quarters ending December 31, 2010 and March 31, 2011 and were permitted to sell certain assets for an unadjusted sales price of approximately $24,250. This asset sale brought us into compliance with our current ratio covenant as of September 30, 2011.
Acquisition note payable. In connection with the acquisition on May 1, 2011 of mineral interests in Niobrara and Weston Counties in the Powder River Basin of Wyoming, we issued a promissory note to the seller, collateralized by the properties, in the principal amount of $6,677. Balances outstanding under this note do not bear interest and are due in three annual installments of $2,226, until May 2014, at which time all outstanding principal amounts are due. We recorded the note at present value using an imputed interest rate of 3.25% per annum. We amortize the original imputed discount of $412 over
F-48
Cinco Resources, Inc.
Notes to Consolidated Financial Statements (Continued)
(Amounts in thousands, except shares and per-share amounts)
9. Long-Term Debt (Continued)
the term of this note using the interest method. At September 30, 2011, the unamortized discount amounted to $329.
Future annual contractual maturities of long-term debt as of September 30, 2011, were as follows:
Years Ending December 31,
|
Amounts | |||
|---|---|---|---|---|
2011 |
$ | — | ||
2012 |
55,226 | |||
2013 |
32,226 | |||
2014 |
2,225 | |||
Total |
$ | 89,677 | ||
See Note 15—Subsequent Events for further discussion.
10. Series A Convertible Preferred Stock
During the year ended December 31, 2009, we issued 525,000 shares of our Series A Convertible Preferred Stock ("Preferred Shares") to an affiliate of an existing stockholder for total cash proceeds of $105,000. The Preferred Shares were convertible into shares of common stock at an initial conversion price of $200 per share. Holders of Preferred Shares were entitled to one vote per common share issuable upon conversion at the time of voting. Holders of the Preferred Shares were not entitled to dividends or demand of redemption, though such holders are entitled to a liquidation preference of $200 per share.
On November 15, 2011, all of the outstanding Preferred Shares were converted into 875,000 shares of common stock pursuant to an induced conversion. See Note 15—Subsequent Events for further discussion.
11. Notes Receivable from Stockholders
During 2009, Cinco issued common stock to certain former officers of DRI in exchange for full-recourse promissory notes which accrue interest at 2.78% per annum and have maturity dates of August 28, 2015.
During the year ended December 31, 2010, we issued 59,300 shares of our common stock to officers in exchange for full-recourse promissory notes which bear interest at 3.00% per annum.
On May 4, 2011, we issued 37,062 shares of common stock to officers in exchange for full-recourse promissory notes which accrued interest at 3.00% per annum. On November 14, 2011, we redeemed the balance of the notes from officers, $9,894, including accrued interest, in exchange for 82,448 shares of our common stock held by these officers. See Note 15—Subsequent Events for further discussion.
F-49
Cinco Resources, Inc.
Notes to Consolidated Financial Statements (Continued)
(Amounts in thousands, except shares and per-share amounts)
11. Notes Receivable from Stockholders (Continued)
Notes receivable from officers and former officers are collateralized by the underlying common stock purchased and are reported in the accompanying consolidated balance sheets as notes receivable from officers including accrued interest, reducing stockholders' equity. Interest earned is reported net of related income tax as a component of additional paid-in capital in the accompanying statement of changes in stockholders' equity. All outstanding principal and interest amounts are due at maturity. The following is a summary of principal and interest amounts outstanding as of September 30, 2011:
| |
|
|||
|---|---|---|---|---|
Principal |
$ | 35,538 | ||
Accrued interest |
1,772 | |||
Total |
$ | 37,310 | ||
Subsequent to September 30, 2011, the notes receivable from officers were redeemed in exchange for shares of our common stock. See Note 15—Subsequent Events for further discussion.
12. Share-Based Compensation
On February 28, 2008, our Board of Directors approved the 2008 Plan for certain of our officers and employees. The 2008 Plan provides us the opportunity to grant options, stock appreciation rights and shares of its common stock, up to 11% of our total shares of common stock outstanding, generally at the beginning of each fiscal year. The 2008 Plan terminates on February 28, 2018. Under the 2008 Plan, stock awards typically vest in three equal portions over a requisite service period of three years, or vest at the end of a three-year requisite service period.
On July 14, 2010, Cima's Board of Directors approved the 2010 Plan for certain officers, employees, directors and consultants. The 2010 Plan provides the opportunity to grant options, stock appreciation rights and shares of common stock, up to 9% of the total shares of common stock outstanding, generally at the beginning of each fiscal year. Under the 2010 Plan, awards of common stock to officers, employees and consultants typically vest at the end of a three-year requisite service period. Awards of common stock to directors vest immediately.
A summary of the status of non-vested common stock awards is as follows:
| |
Number of Shares |
Weighted Average Grant Date Fair Value Per Share |
|||||
|---|---|---|---|---|---|---|---|
Nonvested common stock awards at December 31, 2010 |
278,119 | $ | 89.56 | ||||
Awards granted |
65,460 | 97.04 | |||||
Awards vested |
(52,643 | ) | 97.36 | ||||
Awards forfeited |
(3,000 | ) | 87.36 | ||||
Nonvested common stock awards at September 30, 2011 |
287,936 | $ | 89.86 | ||||
Unrecognized compensation costs related to non-vested common stock awards amounted to $13,670 as of September 30, 2011, and are expected to be recognized over the remaining requisite service period of approximately two years.
F-50
Cinco Resources, Inc.
Notes to Consolidated Financial Statements (Continued)
(Amounts in thousands, except shares and per-share amounts)
12. Share-Based Compensation (Continued)
As of September 30, 2011, there were 70,049 and 7,075 shares of common stock available for issuance under the 2008 Plan and the 2010 Plan, respectively.
13. Income Taxes
Our effective income tax rates differed from the statutory federal income tax rate for the nine months ended September 30, 2010 and 2011 primarily due to state taxes and changes in the valuation allowance provided against the Company's deferred tax assets.
14. Commitments and Contingencies
Drilling Obligations
In August 2011, we entered into a drilling contract effective March 2012. The contract term is for one year and commits us to a daily rate ranging from $23 to $26 for a maximum obligation of approximately $8,395 to $9,490.
Litigation
Seismic litigation
We acquired a working interest in a field in Louisiana in 2004. Prior to the acquisition, the former working interest owner hired an independent third party to perform a 3-D seismic study on the land. In September 2005, we, along with the other working interest owners in this field, sued such third party in the 36th Judicial District Court, for the Parish of Beauregard, State of Louisiana for failure to abide by the existing contract. The third party countersued alleging that we and the other working interest owners improperly used the seismic data and is seeking damages. We believe that the claims of the third party are without merit. A bench trial on this matter was concluded in November 2011, and we anticipate that the court will issue a decision in early 2012. We are unable to estimate a range of possible losses in this matter.
DRI litigation
We are a defendant in a lawsuit filed in June 2002 in the 164th Judicial District Court of Harris County, Texas, involving notice of preferential rights to acquire additional interests in various properties, as well as the conduct and costs associated with field operations. During 2009, we settled our claims with one of the plaintiffs, the terms of which included our acquisition of the plaintiff's interest in certain of our existing properties. Furthermore, in August 2010 we elected not to pursue further appeals and paid a $1,500 judgment concluding significant parts of the litigation. Two issues relating to the preferential rights remain open and are expected to go to trial in February 2012. We do not believe that our exposure to economic damages is material; however, the plaintiffs are also seeking punitive damages and attorney's fees which cannot be quantified. We are vigorously defending ourselves in this matter.
F-51
Cinco Resources, Inc.
Notes to Consolidated Financial Statements (Continued)
(Amounts in thousands, except shares and per-share amounts)
14. Commitments and Contingencies (Continued)
Camden litigation
We previously filed suit in January 2009 in the 25th Judicial District Court of Colorado County, Texas against one of our tubing vendors alleging faulty construction of certain production casing which failed and resulted in loss to us. During the year ended December 31, 2010, we withdrew our claims, but certain of the other working interest owners in the affected properties filed suit against us in February 2010 in the 25th Judicial District Court of Colorado County, Texas for the recovery of their portion of the loss incurred resulting from the faulty production casing. We are vigorously defending ourselves in this matter. We are unable to estimate a range of possible losses in this matter.
In addition to the aforementioned litigation, from time to time, we are subject to legal proceedings and claims that arise in the ordinary course of business. Like other oil and natural gas producers and marketers, our operations are subject to extensive and rapidly changing federal and state environmental, health and safety and other laws and regulations governing air emissions, wastewater discharges, and solid and hazardous waste management activities. We are not currently a party to any material legal proceeding and are not aware of any material legal or governmental proceedings against us, or contemplated to be brought against us other than the aforementioned litigation described above.
15. Subsequent Events
At September 30, 2011, we had issued 96,362 shares of our common stock to officers in exchange for full-recourse promissory notes which accrued interest at 3.00% per annum. On November 14, 2011, we redeemed the balance of these notes, $9,894, including accrued interest, in exchange for 82,448 shares of our common stock held by these officers.
Effective November 14, 2011, Cima's Board of Directors authorized a reverse split of Cima's common stock at a ratio of 500 for one. As a result of the reverse split, every 500 shares of Cima common stock outstanding were combined into one share of Cima common stock. The reverse split did not affect the amount of Cima's equity nor the number of shares outstanding. Subsequent to the reverse stock split, all fractional shares were repurchased for $60,000 per share, or an aggregate amount of $1,135, and cancelled.
Effective after the Cima reverse stock split on November 14, 2011, Cima's Board of Directors authorized a forward split of Cima's common stock at a ratio of one for 500. As a result of the forward split, each share of Cima common stock outstanding was converted into 500 shares of Cima common stock. The forward split did not affect the amount of Cima's equity nor the number of shares outstanding.
Effective November 17, 2011, Cinco entered into an agreement and plan of merger with Cima, an entity affiliated through common ownership. Under the terms of the merger agreement, Cinco acquired all of Cima's outstanding shares, resulting in Cima becoming a wholly-owned subsidiary of Cinco. All of the outstanding shares of Cima common stock issued and outstanding immediately prior to the merger were converted into 1,446,546 shares of Cinco common stock. The transaction was accounted for as a reorganization of entities under common control, similar to a pooling of interests. As of the date of the merger, the net assets of Cima were recorded by Cinco at the historical carrying values of Cima. For financial statement presentation purposes, the financial position and results of operations have been presented on a combined basis, as if the merger occurred on January 1, 2010.
F-52
Cinco Resources, Inc.
Notes to Consolidated Financial Statements (Continued)
(Amounts in thousands, except shares and per-share amounts)
15. Subsequent Events (Continued)
On November 17, 2011, our Board of Directors approved the Cinco Resources, Inc. 2011 Long Term Incentive Plan (the "2011 Plan"). The 2011 Plan amended and restated the 2008 Plan and the 2010 Plan. The 2010 Plan was merged with the 2008 Plan, and each share of Cima common stock covered by a restricted stock award originally granted under the 2010 Plan was converted into a Cinco restricted stock award.
At September 30, 2011, we had 525,000 Preferred Shares outstanding. The Preferred Shares are convertible into shares of common stock at an initial conversion price of $200 per share. On November 15, 2011, all of our Preferred Shares were converted to 875,000 shares of common stock pursuant to an induced conversion offer to the holders of our Preferred Shares to convert such shares to common stock at an adjusted conversion rate of $120 per share. As a result of the induced conversion, we will record a deemed preferred dividend of $42,000 during the three months ended December 31, 2011.
On November 21, 2011, we issued 250,000 shares of our common stock to an affiliate of an existing stockholder for total cash proceeds of $30,000. This additional capital was used to fund the initial $13,500 payment on our recent acquisition of Powder River Basin acreage and to support our on-going drilling program. Additionally, immediately prior to our acquisition of Cima in November 2011, we used approximately $7,700 of cash to (i) fund the repurchase of 54,954 shares of Cima common stock and (ii) fund the purchase of fractional shares resulting from Cima's 500 for one reverse common stock split.
On November 21, 2011, we acquired mineral interests in unproved and proved properties in Niobrara County, Wyoming in the Powder River Basin for total consideration of $25,000. At closing, we paid $12,500 in cash and executed a promissory note which provides for payment on November 21, 2012 of $12,500 plus interest at a rate of 5% per annum. The note is secured by a first priority security interest and lien on the properties acquired. The purchase of this acreage resulted in a seller's bonus fee totaling $1,998 due to a third party. At closing, we paid cash consideration of $999, and the remaining balance is due November 21, 2012.
In December 2011, we amended our senior secured revolving credit facility and our second lien term loan facility. As amended, our $300,000 senior secured revolving credit facility has an initial borrowing base of $85,000, a maturity date of January 4, 2016, and financial covenants substantially similar to our previous credit facilities. We intend to use a portion of the proceeds from our initial public offering to repay all amounts under our senior secured revolving credit facility and to repay all amounts under and retire our second lien term loan facility.
On December 14, 2011, our Board of Directors approved the issuance, effective January 1, 2012, of 61,444 restricted shares of common stock to employees, which shares vest at the end of a three-year requisite service period. Our Board of Directors further approved the issuance of 53,420 restricted shares of common stock and 53,420 stock options to employees, each effective upon the closing of our initial public offering and each of which vests at the end of a three-year requisite service period.
F-53
The terms defined in this section are used throughout this prospectus:
"Basin." A large natural depression on the earth's surface in which sediments generally brought by water accumulate.
"Bbl." One stock tank barrel, of 42 U.S. gallons liquid volume, used herein in reference to crude oil, condensate or natural gas liquids.
"Bcf." One billion cubic feet of natural gas.
"Bcfe." One billion cubic feet of natural gas equivalents, determined using the ratio of six Mcf of natural gas to one Bbl of crude oil, condensate or natural gas liquids.
"BOE." Barrels of oil equivalent, determined using the ratio of one Bbl of crude oil, condensate or natural gas liquids, to six Mcf of natural gas.
"Boed." BOE per day.
"Bopd." Barrels of oil per day.
"Completion." The process of treating a drilled well followed by the installation of permanent equipment for the production of natural gas or oil, or in the case of a dry hole, the reporting of abandonment to the appropriate agency.
"Developed acreage." The number of acres that are allocated or assignable to productive wells.
"Development well." A well drilled within the proved area of an oil or natural gas reservoir to the depth of a stratigraphic horizon known to be productive.
"Dry hole." A well found to be incapable of producing hydrocarbons in sufficient quantities such that proceeds from the sale of such production exceed production expenses and taxes.
"Estimated proved reserves." The estimated quantities of oil, natural gas and natural gas liquids which geological and engineering data demonstrate with reasonable certainty to be commercially recoverable in future years from known reservoirs under existing economic and operating conditions.
"Exploratory well." A well drilled to find and produce natural gas or oil reserves not classified as proved, to find a new reservoir in a field previously found to be productive of natural gas or oil in another reservoir or to extend a known reservoir.
"Field." An area consisting of a single reservoir or multiple reservoirs all grouped on, or related to, the same individual geological structural feature or stratigraphic condition. The field name refers to the surface area, although it may refer to both the surface and the underground productive formations.
"Finding and development costs." As used herein, finding and development costs are reported on a per unit basis and represent facilities, well drilling and completion costs divided by equivalent associated proved reserve volumes.
"Formation. " A layer of rock which has distinct characteristics that differs from nearby rock.
"Gross acres or gross wells." The total acres or wells, as the case may be, in which a working interest is owned.
"Horizontal drilling." A drilling technique used in certain formations where a well is drilled vertically to a certain depth and then drilled at a right angle within a specified interval.
"MBbl." One thousand barrels of crude oil, condensate or natural gas liquids.
A-1
"Mcf." One thousand cubic feet of natural gas.
"Mcfd." Mcf per day.
"MMBbl." One million barrels of crude oil, condensate or natural gas liquids.
"MMBtu." One million British thermal units.
"MMcf." One million cubic feet of natural gas.
"MMcfe." One million cubic feet of natural gas equivalents, determined using the ratio of six Mcf of natural gas to one Bbl of crude oil, condensate or natural gas liquids.
"MMcfed." MMcfe per day.
"Natural gas liquids." Hydrocarbons found in natural gas which may be extracted as liquefied petroleum gas and natural gasoline.
"Net acres or wells." The sum of the fractional working interest owned in gross acres or wells. An owner who has 50% interest in 100 acres owns 50 net acres.
"NYMEX." The New York Mercantile Exchange.
"Potential drilling locations." Total gross resource play locations that we may be able to drill on our existing acreage. Our actual drilling activities may change depending on the availability of capital, regulatory approvals, seasonal restrictions, natural gas and oil prices, costs, drilling results and other factors.
"Prospect." A specific geographic area which, based on supporting geological, geophysical or other data and also preliminary economic analysis using reasonably anticipated prices and costs, is deemed to have potential for the discovery of commercial hydrocarbons.
"Proved developed reserves." Reserves that can be expected to be recovered through existing wells with existing equipment and operating methods.
"Proved undeveloped reserves ("PUD")." Proved reserves that are expected to be recovered from new wells on undrilled acreage or from existing wells where a relatively major expenditure is required for recompletion.
"Recompletion." The process of re-entering an existing wellbore that is either producing or not producing and completing new reservoirs in an attempt to establish or increase existing production.
"Reserve Life." A measure of the productive life of an oil and natural gas property for a group of properties, expressed in years. Reserve life is calculated by dividing proved reserve volumes at year end by production for that year.
"Reservoir." A porous and permeable underground formation containing a natural accumulation of producible oil and/or natural gas that is confined by impermeable rock or water barriers and is separate from other reservoirs.
"Spacing." The distance between wells producing from the same reservoir. Spacing is often expressed in terms of acres, e.g., 40-acre spacing, and is often established by regulatory agencies.
"Undeveloped acreage." Lease acreage on which wells have not been drilled or completed to a point that would permit the production of commercial quantities of natural gas and oil regardless of whether such acreage contains proved reserves.
"Unit." The joining of all or substantially all interests in a reservoir or field, rather than a single tract, to provide for development and operation without regard to separate property interests. Also, the area covered by a unitization agreement.
A-2
"Wellbore." The hole drilled by the bit that is equipped for natural gas production on a completed well. Also called well or borehole.
"Working interest." The right granted to the lessee of a property to explore for and to produce and own natural gas or other minerals. The working interest owners bear the exploration, development and operating costs on either a cash, penalty or carried basis.
A-3
Shares
Common Stock
PRELIMINARY PROSPECTUS
, 2012
Joint Book-Running Managers
Citigroup
Wells Fargo Securities
Until , 2012 (25 days after the date of this prospectus), all dealers that buy, sell or trade shares of our common stock, whether or not participating in this offering, may be required to deliver a prospectus. This is in addition to the dealers' obligation to deliver a prospectus when acting as underwriters and with respect to their unsold allotments or subscriptions.
Part II
INFORMATION NOT REQUIRED IN PROSPECTUS
ITEM 13. Other Expenses of Issuance and Distribution
The following table sets forth an itemized statement of the amounts of all expenses (excluding underwriting discounts and commissions) payable by us in connection with the registration of the common stock offered hereby. With the exception of the SEC registration fee, the FINRA filing fee and the NASDAQ National Market listing fee, the amounts set forth below are estimates.
SEC registration fee |
$ | 19,768.50 | ||
FINRA filing fee |
17,750.00 | |||
NASDAQ National Market listing fee |
||||
Accountants' fees and expenses |
||||
Legal fees and expenses |
||||
Printing and engraving expenses |
||||
Transfer agent and registrar fees |
||||
Miscellaneous |
||||
Total |
$ | |||
ITEM 14. Indemnification of Directors and Officers
Our amended and restated certificate of incorporation will provide that a director will not be liable to the corporation or its stockholders for monetary damages for breach of fiduciary duty as a director, except for liability (1) for any breach of the director's duty of loyalty to the corporation or its stockholders, (2) for acts or omissions not in good faith or which involved intentional misconduct or a knowing violation of the law, (3) under section 174 of the DGCL for unlawful payment of dividends or improper redemption of stock or (4) for any transaction from which the director derived an improper personal benefit. In addition, if the DGCL is amended to authorize the further elimination or limitation of the liability of directors, then the liability of a director of the corporation, in addition to the limitation on personal liability provided for in our amended and restated certificate of incorporation, will be limited to the fullest extent permitted by the amended DGCL. Our amended and restated bylaws will provide that the corporation will indemnify, and advance expenses to, any officer or director to the fullest extent authorized by the DGCL.
Section 145 of the DGCL provides that a corporation may indemnify directors and officers as well as other employees and individuals against expenses, including attorneys' fees, judgments, fines and amounts paid in settlement in connection with specified actions, suits and proceedings whether civil, criminal, administrative, or investigative, other than a derivative action by or in the right of the corporation, if they acted in good faith and in a manner they reasonably believed to be in or not opposed to the best interests of the corporation and, with respect to any criminal action or proceeding, had no reasonable cause to believe their conduct was unlawful. A similar standard is applicable in the case of derivative actions, except that indemnification extends only to expenses, including attorneys' fees, incurred in connection with the defense or settlement of such action and the statute requires court approval before there can be any indemnification where the person seeking indemnification has been found liable to the corporation. The statute provides that it is not exclusive of other indemnification that may be granted by a corporation's certificate of incorporation, bylaws, disinterested director vote, stockholder vote, agreement or otherwise.
Our amended and restated certificate of incorporation also will contain indemnification rights for our directors and our officers. Specifically, our amended and restated certificate of incorporation will provide that we shall indemnify our officers and directors to the fullest extent authorized by the
II-1
DGCL. Further, we may maintain insurance on behalf of our officers and directors against expense, liability or loss asserted incurred by them in their capacities as officers and directors.
We will obtain directors' and officers' insurance to cover our directors, officers and some of our employees for certain liabilities.
We expect to enter into written indemnification agreements with our directors and executive officers. Under these agreements, if an executive officer or director makes a claim of indemnification to us, either a majority of the independent directors or independent legal counsel selected by the independent directors must review the relevant facts and make a determination whether the officer or director has met the standards of conduct under Delaware law that would permit (under Delaware law) and require (under the indemnification agreement) us to indemnify the officer or director.
ITEM 15. Recent Sales of Unregistered Securities
In connection with the merger of Cima Resources, Inc. in November 2011, Cinco Resources, Inc. issued 1,323,960 shares of its common stock to former stockholders of Cima Resources, Inc., and 122,586 restricted shares of its common stock to its employees who held shares of Cima Resources, Inc. common stock under the Cima Resources, Inc. 2010 Stock Incentive Plan. The issuance of shares did not involve any underwriters or a public offering and was exempt from the registration requirements of the Securities Act pursuant to Rule 506 of Regulation D and Rule 701.
In November 2011, Cinco Resources, Inc. issued 250,000 shares of its common stock to Yorktown Energy Partners VIII, L.P. and Yorktown Energy Partners IX, L.P. in a private placement exempt from the registration requirements of the Securities Act pursuant to Rule 506 of Regulation D.
In December 2011, our board of directors approved grants of 114,864 restricted shares of common stock under our 2011 Long Term Incentive Plan. The issuance of these restricted shares is exempt from the registration requirements of the Securities Act pursuant to Rule 506 of Regulation D and Rule 701.
II-2
ITEM 16. Exhibits and Financial Statement Schedules
- (a)
- Exhibits
| Exhibit Number |
Description | ||
|---|---|---|---|
| *1.1 | Form of Underwriting Agreement | ||
*2.1 |
Agreement and Plan of Merger by and among Cinco Resources, Inc., Cima Resources, Inc. and Cinco Merger, Inc. dated November 17, 2011 |
||
*3.1 |
Form of Amended and Restated Certificate of Incorporation of Cinco Resources, Inc. |
||
*3.2 |
Form of Amended and Restated Bylaws of Cinco Resources, Inc. |
||
*4.1 |
Form of Common Stock Certificate |
||
*5.1 |
Opinion of Thompson & Knight LLP as to the legality of the securities being registered |
||
*10.1 |
Form of Employment Agreement by and between Cinco Resources, Inc. and Chief Executive Officer |
||
*10.2 |
Form of Employment Agreement by and between Cinco Resources, Inc. and Senior Vice President |
||
*10.3 |
Cinco Resources, Inc. 2011 Long Term Incentive Plan |
||
*10.4 |
Cinco Resources, Inc. 2012 Long Term Incentive Plan |
||
*10.5 |
Cinco Resources, Inc. Annual Incentive Compensation Plan |
||
*10.6 |
Cinco Resources, Inc. Change of Control and Severance Benefit Plan |
||
*10.7 |
Form of Stock Award Agreement under Cinco Resources, Inc. 2011 Long Term Incentive Plan |
||
*10.8 |
Form of Summary of Stock Option Grant under Cinco Resources, Inc. 2011 Long Term Incentive Plan |
||
*10.9 |
Form of Stock Award Agreement under Cinco Resources, Inc. 2012 Long Term Incentive Plan |
||
*10.10 |
Form of Summary of Stock Option Grant under Cinco Resources, Inc. 2012 Long Term Incentive Plan |
||
*10.11 |
Form of Registration Rights Agreement among Cinco Resources, Inc. and investors identified therein. |
||
*21.1 |
List of Subsidiaries of Cinco Resources, Inc. |
||
23.1 |
Consent of Hein & Associates LLP |
||
23.2 |
Consent of Netherland, Sewell & Associates, Inc. |
||
*23.3 |
Consent of Thompson & Knight LLP (contained in Exhibit 5.1) |
||
24.1 |
Power of Attorney (included on the signature page to this registration statement) |
||
99.1 |
Report of Netherland, Sewell & Associates, Inc. for reserves as of May 31, 2011 |
||
99.2 |
Report of Netherland, Sewell & Associates, Inc. for reserves as of December 31, 2010 |
||
99.3 |
Report of Netherland, Sewell & Associates, Inc. for reserves as of December 31, 2009 |
||
- *
- To be filed by amendment.
II-3
The undersigned registrant hereby undertakes to provide to the underwriters at the closing specified in the underwriting agreement certificates in such denominations and registered in such names as required by the underwriters to permit prompt delivery to each purchaser.
Insofar as indemnification for liabilities arising under the Securities Act may be permitted to directors, officers and controlling persons of the registrant pursuant to the foregoing provisions, or otherwise, the registrant has been advised that in the opinion of the Securities and Exchange Commission such indemnification is against public policy as expressed in the Securities Act and is, therefore, unenforceable. In the event that a claim for indemnification against such liabilities (other than the payment by the registrant of expenses incurred or paid by a director, officer or controlling person of the registrant in the successful defense of any action, suit or proceeding) is asserted by such director, officer or controlling person in connection with the securities being registered, the registrant will, unless in the opinion of its counsel the matter has been settled by controlling precedent, submit to a court of appropriate jurisdiction the question whether such indemnification by it is against public policy as expressed in the Securities Act and will be governed by the final adjudication of such issue.
The undersigned registrant hereby undertakes that:
(1) For purposes of determining any liability under the Securities Act, the information omitted from the form of prospectus filed as part of this registration statement in reliance upon Rule 430A and contained in a form of prospectus filed by the registrant pursuant to Rule 424(b)(1) or (4) or 497(h) under the Securities Act shall be deemed to be part of this registration statement as of the time it was declared effective.
(2) For the purpose of determining any liability under the Securities Act, each post-effective amendment that contains a form of prospectus shall be deemed to be a new registration statement relating to the securities offered therein, and the offering of such securities at that time shall be deemed to be the initial bona fide offering thereof.
II-4
Pursuant to the requirements of the Securities Act of 1933, the registrant has duly caused this registration statement to be signed on its behalf by the undersigned, thereunto duly authorized in the City of Dallas, State of Texas, on January 12, 2012.
| CINCO RESOURCES, INC. | ||||
By: |
/s/ JON L. GLASS Name: Jon L. Glass Title: President and Chief Executive Officer |
|||
KNOW ALL PERSONS BY THESE PRESENTS, that each person whose signature appears below constitutes and appoints Jon. L. Glass and Wayne B. Stoltenberg, and each of them severally, his true and lawful attorney or attorneys-in-fact and agents, with full power to act with or without the others and with full power of substitution and resubstitution, to execute in his name, place and stead, in any and all capacities, any or all amendments (including pre-effective and post-effective amendments) to this registration statement and any registration statement (including any amendments thereto) for the same offering filed pursuant to Rule 462 under the Securities Act of 1933, and to file the same, with all exhibits thereto, and other documents in connection therewith, with the Securities and Exchange Commission, granting unto said attorneys-in-fact and agents and each of them, full power and authority to do and perform in the name of on behalf of the undersigned, in any and all capacities, each and every act and thing necessary or desirable to be done in and about the premises, to all intents and purposes and as fully as they might or could do in person, hereby ratifying, approving and confirming all that said attorneys-in-fact and agents or their substitutes may lawfully do or cause to be done by virtue hereof.
Pursuant to the requirements of the Securities Act of 1933, this registration statement has been signed by the following persons in the capacities indicated on January 12, 2012. This document may be executed by the signatories hereto on any number of counterparts, all of which constitute one and the same instrument.
Signature
|
Title
|
|
|---|---|---|
| /s/ JON L. GLASS Jon L. Glass |
Chairman of the Board, President, Chief Executive Officer and Director (Principal Executive Officer) |
|
/s/ WAYNE B. STOLTENBERG Wayne B. Stoltenberg |
Chief Financial Officer and Senior Vice President (Principal Financial and Accounting Officer) |
|
/s/ ALAN D. BELL Alan D. Bell |
Director |
|
/s/ JAMES C. CRAIN James C. Crain |
Director |
II-5
Signature
|
Title
|
|
|---|---|---|
| /s/ ELLEN K. HANNAN Ellen K. Hannan |
Director | |
/s/ W. HOWARD KEENAN, JR. W. Howard Keenan, Jr. |
Director |
|
/s/ JAMES R. LATIMER, III James R. Latimer, III |
Director |
|
/s/ BRYAN H. LAWRENCE Bryan H. Lawrence |
Director |
II-6
| Exhibit Number |
Description | ||
|---|---|---|---|
| *1.1 | Form of Underwriting Agreement | ||
*2.1 |
Agreement and Plan of Merger by and among Cinco Resources, Inc., Cima Resources, Inc. and Cinco Merger, Inc. dated November 17, 2011 |
||
*3.1 |
Form of Amended and Restated Certificate of Incorporation of Cinco Resources, Inc. |
||
*3.2 |
Form of Amended and Restated Bylaws of Cinco Resources, Inc. |
||
*4.1 |
Form of Common Stock Certificate |
||
*5.1 |
Opinion of Thompson & Knight LLP as to the legality of the securities being registered |
||
*10.1 |
Form of Employment Agreement by and between Cinco Resources, Inc. and Chief Executive Officer |
||
*10.2 |
Form of Employment Agreement by and between Cinco Resources, Inc. and Senior Vice President |
||
*10.3 |
Cinco Resources, Inc. 2011 Long Term Incentive Plan |
||
*10.4 |
Cinco Resources, Inc. 2012 Long Term Incentive Plan |
||
*10.5 |
Cinco Resources, Inc. Annual Incentive Compensation Plan |
||
*10.6 |
Cinco Resources, Inc. Change of Control and Severance Benefit Plan |
||
*10.7 |
Form of Stock Award Agreement under Cinco Resources, Inc. 2011 Long Term Incentive Plan |
||
*10.8 |
Form of Summary of Stock Option Grant under Cinco Resources, Inc. 2011 Long Term Incentive Plan |
||
*10.9 |
Form of Stock Award Agreement under Cinco Resources, Inc. 2012 Long Term Incentive Plan |
||
*10.10 |
Form of Summary of Stock Option Grant under Cinco Resources, Inc. 2012 Long Term Incentive Plan |
||
*10.11 |
Form of Registration Rights Agreement among Cinco Resources, Inc. and investors identified therein. |
||
*21.1 |
List of Subsidiaries of Cinco Resources, Inc. |
||
23.1 |
Consent of Hein & Associates LLP |
||
23.2 |
Consent of Netherland, Sewell & Associates, Inc. |
||
*23.3 |
Consent of Thompson & Knight LLP (contained in Exhibit 5.1) |
||
24.1 |
Power of Attorney (included on the signature page to this registration statement) |
||
99.1 |
Report of Netherland, Sewell & Associates, Inc. for reserves as of May 31, 2011 |
||
99.2 |
Report of Netherland, Sewell & Associates, Inc. for reserves as of December 31, 2010 |
||
99.3 |
Report of Netherland, Sewell & Associates, Inc. for reserves as of December 31, 2009 |
||
- *
- To be filed by amendment.