Attached files
| file | filename |
|---|---|
| 8-K - 8-K - AGILYSYS INC | d277436d8k.htm |
 The Leading
Growth Company Focused Investment Bank for 27 Years AGILYSYS, INC.
| Clean Technologies
|
Communications
| Consumer
| Enterprise Infrastructure
|
Healthcare
|
| Industrial & Diversified Growth
|
Semiconductors & Equipment
|
Software & Services
|
The Leading Growth Company Focused Investment Bank for 27 Years
Exhibit 99.1
The Fourteenth Annual
Needham Growth Conference
January 10-12th, 2012, New York City |
 January 2012
2
Company Overview |
 3
Forward-Looking Language
Other potential risks and uncertainties that may cause actual results to be
materially different from those in forward-looking information are
described in “Risk Factors,”
which is included in Part I, Item 1A of the Company’s Annual Report for the
fiscal year ended March 31, 2011. Use of Non-GAAP Financial
Information To supplement the unaudited condensed consolidated financial
statements presented in accordance with U.S. GAAP in this presentation,
certain non-GAAP financial measures as defined by the SEC rules are
used. Management
believes
that
such
information
can
enhance
investors'
understanding
of
the
Company's
ongoing
operations.
The
non-GAAP
measures included in this presentation have been reconciled to the comparable GAAP
measures within an accompanying table, shown on the last page of this
presentation. This Quarterly Report contains certain management expectations, which may
constitute forward-looking information within the meaning of Section 27A of the Securities
Act of 1933, Section 21E of the Securities and Exchange Act of 1934, and the Private Securities Reform Act of
1995. Forward-looking information speaks only as to the date of this Quarterly Report and may be
identified by use of words such as “may,” “will,” “believes,”
“anticipates,” “plans,” “expects,” “estimates,” “projects,” “targets,” “forecasts,” “continues,” “seeks,” or the negative of those
terms or similar expressions. Many important factors could cause actual results to be materially
different from those in forward-looking information, including, without limitation,
competitive factors, disruption of supplies, changes in market conditions, pending or future claims or
litigation, or technology advances. No assurances can be provided as to the outcome of cost
reductions, expected benefits and outcomes from our recent ERP implementation, business
strategies, future financial results, unanticipated downturns to our relationships with
customers and macroeconomic demand for IT products and services, unanticipated difficulties
integrating acquisitions, new laws and government regulations, interest rate changes,
consequences related to the concentrated ownership of our outstanding shares by MAK Capital,
unanticipated deterioration in economic and financial conditions in the United States and around the world or the consequences
associated with the sale of the Company’s TSG business, and uncertainties regarding
restructuring actions and the relocation of the Company’s corporate headquarters. The
Company does not undertake to update or revise any forward-looking information, even if events
make it clear that any projected results, actions, or impact, express or implied, will not be
realized.
Forward-looking statements & non-GAAP financial
information |
 •
Leading developer and marketer of proprietary enterprise software, services
and solutions to the hospitality and retail industries
•
Two
reportable
businesses:
Hospitality
Solutions
Group
(“HSG”)
develops
and
markets
proprietary
software
for
hospitality
markets
and
Retail
Solutions
Group
(“RSG”)
is a system integrator of store front technology for retailers
Formed:
1963
Ticker symbol:
AGYS (NASDAQ)
Market capitalization:
~$200 million
Capital structure as of 9/30/11:
Debt-free
Fiscal 2011 sales
:
$201 million
Markets served as % of revenue:
94% North America
6% Asia and Europe
Employees:
800
Corporate HQ:
Solon, Ohio (relocating to Alpharetta, GA)
4
Summary
Quick Facts
1
(1) March 31
fiscal year: excludes TSG which was divested 7/31/11
st
Agilysys: overview |
 •
Hospitality customers can rely
on HSG to deliver:
•
Enterprise applications
•
Hardware enabling our complete
array of enterprise applications
•
Recurring services such as
software maintenance and
hosting or SaaS offerings
•
Implementation and training
services as well as help desk
support
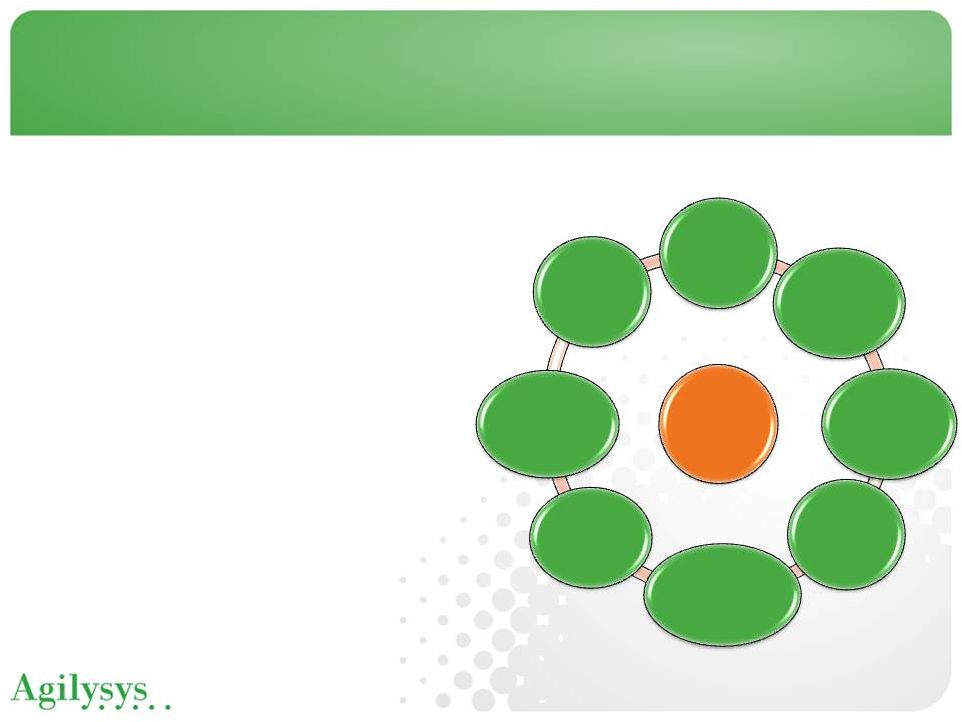
5
Agilysys
Hospitality
Solutions
Enterprise
Applications
Complementary
Offerings
Hardware
Software
Maintenance
Implementation
Hosting
(SaaS)
Training
Help Desk
Agilysys
Hospitality
Solutions |
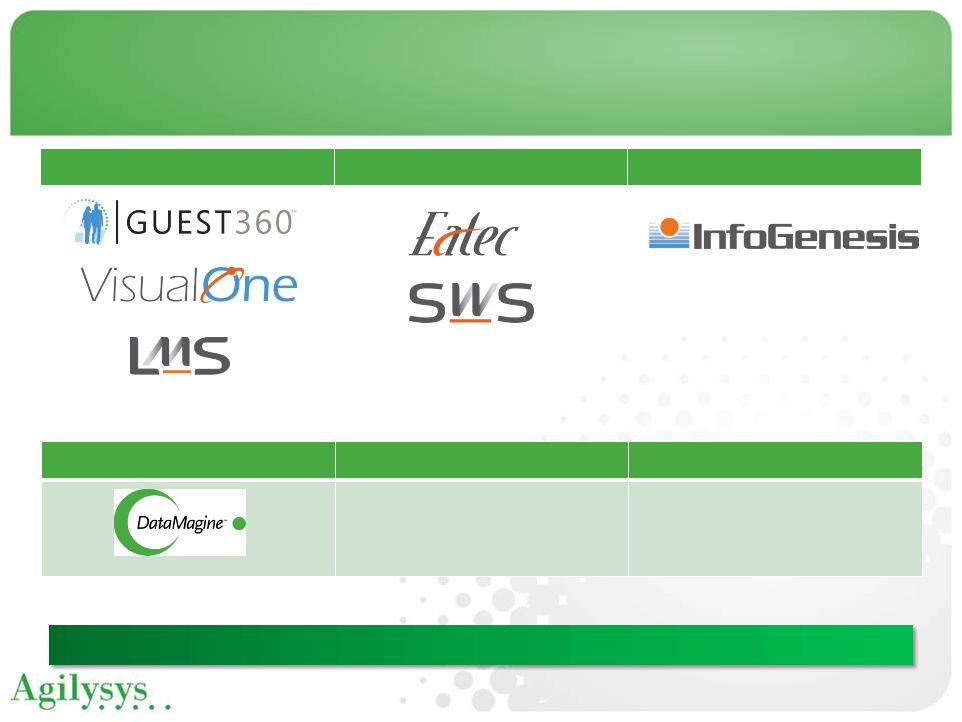 Document
Management Central Reservation
Mobility
•
G360 capabilities
•
Buy/build capabilities
•
POS (IG Roam)
•
PMS (iPad enabled)
•
RSG (mPOS)
6
Titles We Own
Best in class point solutions for the markets we service
Property Management
Inventory & Procurement
Point of Sale |
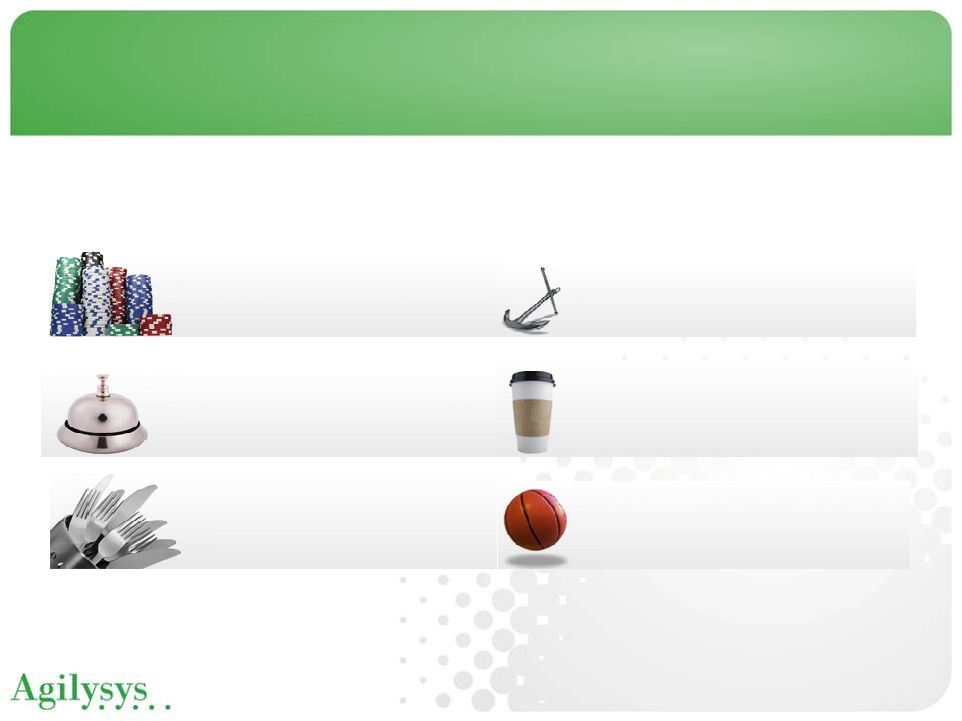 Gaming
Hotels & Resorts
Restaurants
Cruise Lines
Food Service
Stadiums & Arenas
7
HSG Markets Served |
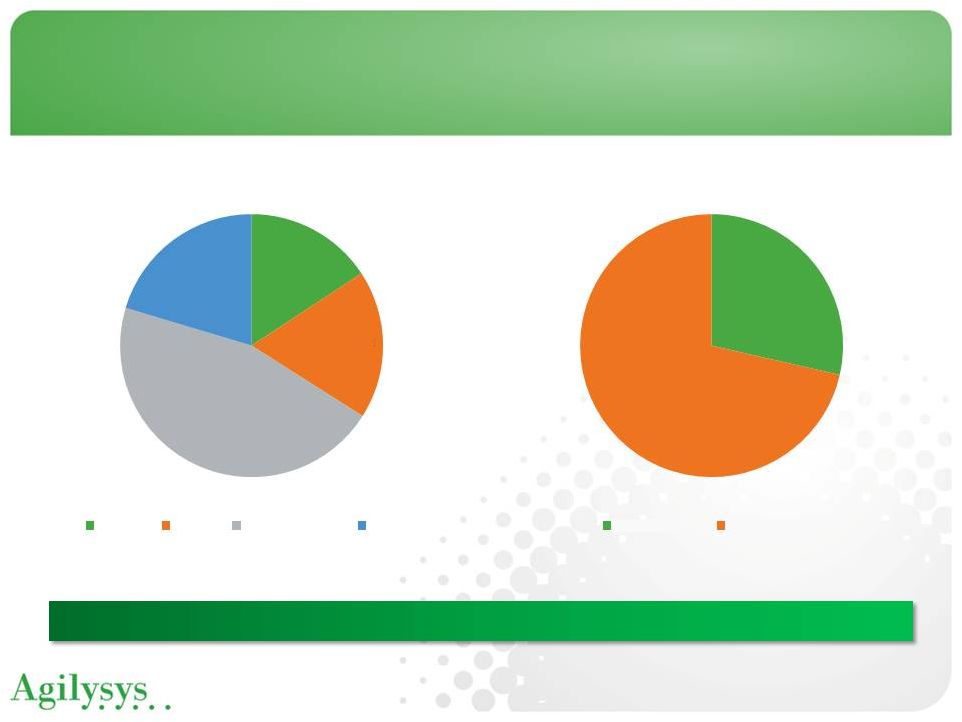 8
Balanced revenue mix driven by proprietary software
(1) Trailing Twelve Months ending 9/30/11
$14.6
16%
$16.9
18%
$42.3
46%
$18.9
20%
HSG Revenue Mix
1
-
$93
Software
Services
Recurring Support
Hardware
$16.9
29%
$42.3
71%
HSG Proprietary Services Mix
1
-
$59
Project Services
Recurring Support
HSG
Revenue
Profile |
 •
Agilysys Retail Solutions provides:
•
Integration of end-to-end in-store technology solutions
•
Unparalleled expertise in POS and Mobility solutions
•
Personnel with an average of 18 years experience in the retail market
•
Agilysys Retail Solutions is:
•
Solution partner for IBM Retail Store Solutions receiving the IBM RSS
Excellence Award for 16 consecutive years (since the award’s inception)
•
Large Motorola Enterprise Mobility Solutions Partner and also one of
Motorola’s largest Enterprise Mobility Wireless (WLAN) Partners
•
VeriFone Premier Partner
9
Agilysys Retail Solutions |
 •
Lifecycle management of
store-centric business
systems
•
Higher ROI and lower TCO
•
Servicing the needs of
smart consumers
•
Point-of-Sale
•
Customer Self-Service
•
Mobile Point-of-Service
•
Mobile Store Managers
•
Mobile Store Associates
10
Agilysys
Retail
Services
Consulting
Software
Development
Project
Management
Integration
Implementation
Equipment
Disposal
Maintenance
24x7
Help
Desk
Agilysys Retail Solutions |
 11
Grocery
Chain Drug Stores
General and Specialty Retail
Quick Serve Restaurants
Convenience Stores
RSG Markets Served |
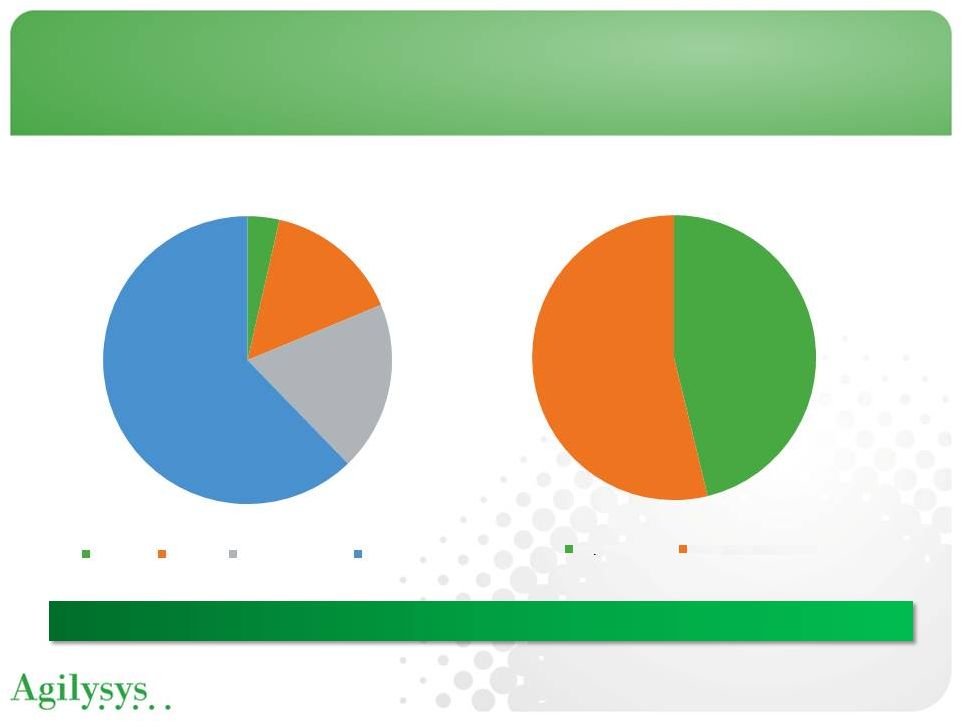 12
(1) Trailing Twelve Months ending 9/30/11
$4.3
4%
$18.3
15%
$22.9
19%
$75.2
62%
-
$120
Software
Services
Recurring Support
Hardware
$18.3
46%
$21.4
54%
RSG Proprietary Services Mix
1
-
$40
Project Services
Recurring Support
RSG Revenue Profile
Comprehensive proprietary services differentiates RSG from other system integrators
RSG Proprietary Services Mix
1 |
 •
Closed divestiture of Technology Solutions Group (TSG) business to OnX Enterprise
Solutions
on
August
1
st
•
Strategic emphasis focuses on improving business performance, making select
investments and returning capital to shareholders
•
Streamlining
operations
and
reducing
corporate
expenses,
including
facilities’
footprint
•
Relocating corporate headquarters to Alpharetta, Georgia
•
Reduce corporate costs and reposition support closer to key revenue-producing
locations •
Executing
plan
to
reduce
annual
“run-rate”
SG&A
by
$14M
to
$16M,
expected
to
be
realized
beginning in FY13
•
Estimated
restructuring
costs
are
$14M
to
$16M
—
expect
to
be
primarily
recognized
in
FY12
•
Announced repurchase up to 1.6 million (approximately 7%) of outstanding
shares 13
Focused Business Strategy |
 Business Emphasis
•
Serve large end markets that will benefit
from technology application
•
Maintain leadership in delivering best in
class products and services
•
Improve guest experience through agile
enterprise solutions
•
Market focused product development
Investor Returns
•
Market leading growth and ROIC
•
Peer leading performance metrics
•
Price leadership
•
Most efficient provider
•
Capital allocation
•
Apply capital to highest margin opportunities
•
R&D spend based on line of sight to return on
investment
•
Value creating M&A opportunities
14
14
Aligning business focus and investor returns
Deliver profitable growth, generating strong investment returns for
shareholders |
 Market Opportunities
•
Large installed base with untapped capacity to
deliver multiple point solutions
•
Increase participation in new market segments
through focused investment
•
Deliver on market demand from their
investment in guest facing business systems
•
Enhanced guest experiences leading to
increased revenue opportunities
•
Intelligent reporting for improves decision making
•
Reduce operating expenses
•
Mobility-enabled solutions
•
No clear end-to-end hospitality solution
Key Initiatives
Strengthen best in class portfolio
Increase investment in mobility enabled
solutions
Enterprise solutions through integrated
software assets
Customer and market driven technology
delivery (Above/On Premise, SaaS, Mobility)
Guest centric business intelligence & reporting
15
Software
Services
Develop/acquire higher margin solution offerings
Extend mobility initiatives
Pursue higher margin service engagements
Expand specialty retail and franchise business
Pursue highest margin revenue opportunities in markets we service
Market Opportunities and Key Initiatives |
 •
Invest in existing products and new products to increase software sales
•
Continue product development refresh to latest technologies
•
Mobility enabled solutions
•
Enterprise solutions through integrated software assets
•
Customer and market driven technology deliver (SaaS, Mobility)
•
Pursue highest margin revenue opportunities in markets we service
•
Increase
penetration
of
new
market
opportunities
in
food
service
management,
cruise,
specialty retail, franchised retailers and chain hotels
•
Partner
for
international
expansion
—
currently
we
derive
less
than
10%
of
revenue
from international customers
•
Pursue M&A opportunities in pursuit of technology and markets
•
Align current and future R&D spend with line of sight return on
investment 16
Earnings Growth Focus |
 17
Appendix
Appendix |
 18
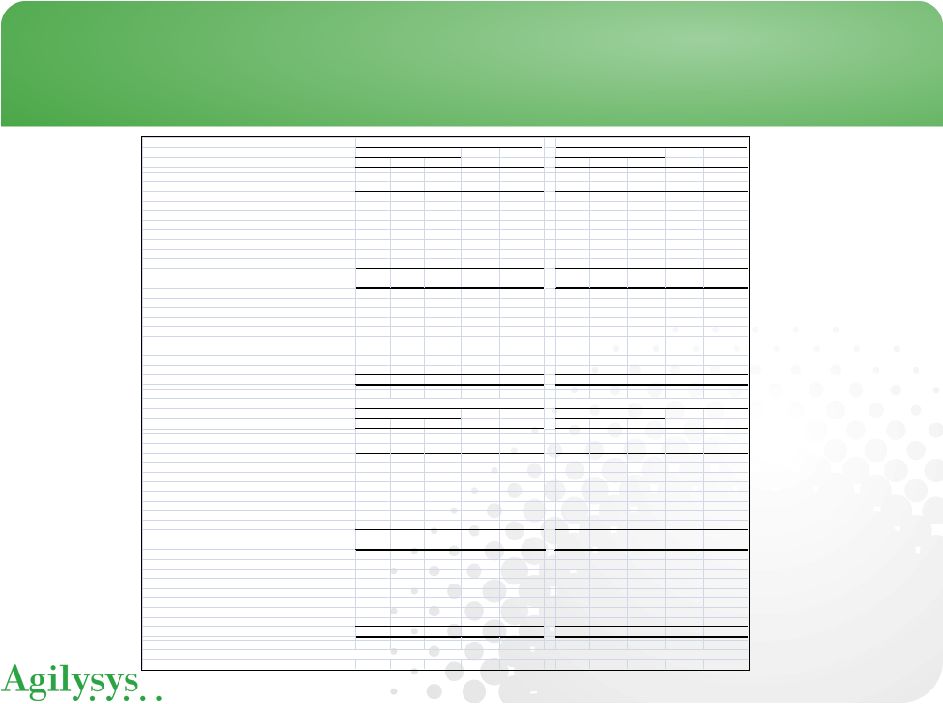
Corporate/
Corporate/
(In thousands)
HSG
RSG
TSG
Other
Consolidated
HSG
RSG
TSG
Other
Consolidated
Total revenue
$24,814
$22,015
$ 97,145
$ -
$ 143,974
$92,839
$109,147
$474,052
$ -
$ 676,038
Elimination of intersegment revenue
(26)
(171)
-
-
(197)
(92)
(476)
-
-
(568)
Revenue from external customers
$24,788
$21,844
$ 97,145
$ -
$ 143,777
$92,747
$108,671
$474,052
$ -
$ 675,470
Gross margin
$15,821
$ 3,958
$ 16,546
$ -
$ 36,325
$54,669
$ 20,970
$ 82,052
$ -
$ 157,691
Gross margin percentage
63.8%
18.1%
17.0%
25.3%
58.9%
19.3%
17.3%
23.3%
Operating income (loss)
$ 1,622
$ (520)
$(41,288)
$ (6,763)
$ (46,949)
$ 6,030
$ 3,369
$(31,736)
$(32,099)
$ (54,436)
Other income, net
-
-
-
(43)
(43)
-
-
-
(2,320)
(2,320)
Interest expense, net
-
-
-
352
352
-
-
-
1,171
1,171
Income (loss) from continuing operations before income taxes
$ 1,622
$ (520)
$(41,288)
$ (7,072)
$ (47,258)
$ 6,030
$ 3,369
$(31,736)
$(30,950)
$ (53,287)
Other information:
Capital expenditures
$ 1,249
$ 1
$ 45
$ 26
$ 1,321
$ 3,760
$ 623
$ 914
$ 1,694
$ 6,991
Other charges:
Depreciation and amortization - non-cash (1)
$ 1,091
$ 203
$ 329
$ 1,771
$ 3,394
$ 4,297
$ 449
$ 2,881
$ 5,987
$ 13,614
Asset impairment charges - non-cash
900
-
36,762
-
37,662
959
-
36,762
-
37,721
Restructuring charges
-
-
790
(1)
789
-
-
790
405
1,195
Total
$ 1,991
$ 203
$ 37,881
$ 1,770
$ 41,845
$ 5,256
$ 449
$ 40,433
$ 6,392
$ 52,530
Corporate/
Corporate/
HSG
RSG
TSG
Other
Consolidated
HSG
RSG
TSG
Other
Consolidated
Total revenue
$21,313
$25,373
$ 89,295
$ -
$ 135,981
$83,361
$110,506
$440,887
$ -
$ 634,754
Elimination of intersegment revenue
(33)
(91)
(9)
-
(133)
(206)
(155)
(73)
-
(434)
Revenue from external customers
$21,280
$25,282
$ 89,286
$ -
$ 135,848
$83,155
$110,351
$440,814
$ -
$ 634,320
Gross margin
$13,374
$ 5,840
$ 16,613
$ -
$ 35,827
$51,463
$ 23,326
$ 87,501
$ (763)
$ 161,527
Gross margin percentage
62.8%
23.1%
18.6%
26.4%
61.9%
21.1%
19.8%
25.5%
Operating income (loss)
$ 2,220
$ 737
$ (1,531)
$ (7,639)
$ (6,213)
$ 7,666
$ 5,759
$ 9,407
$(29,669)
$ (6,837)
Other income, net
-
-
-
(213)
(213)
-
-
-
(6,176)
(6,176)
Interest expense, net
-
-
-
278
278
-
-
-
939
939
Income (loss) from continuing operations before income taxes
$ 2,220
$ 737
$ (1,531)
$ (7,704)
$ (6,278)
$ 7,666
$ 5,759
$ 9,407
$(24,432)
$ (1,600)
Other information:
Capital expenditures
$ 1,041
$ -
$ 41
$ 2,552
$ 3,634
$ 4,694
$ 31
$ 103
$ 8,478
$ 13,306
Non-cash charges:
Depreciation and amortization (1)
$ 1,029
$ 55
$ 839
$ 1,266
$ 3,189
$ 4,337
$ 198
$ 6,418
$ 4,876
$ 15,829
Asset impairment charges
-
-
55
-
55
90
-
55
148
293
Restructuring charges
-
-
-
78
78
-
-
-
823
823
Total
$ 1,029
$ 55
$ 894
$ 1,344
$ 3,322
$ 4,427
$ 198
$ 6,473
$ 5,847
$ 16,945
(1) Does not include the amortization of deferred financing fees totaling $131 and $139 for the three
months ended March 31, 2011 and 2010, respectively, and $524 and $485 for the year
ended March 31, 2011 and 2010, respectively.
Year Ended March 31, 2011 (Unaudited)
Reportable Segments
Year Ended March 31, 2010
Reportable Segments
Reportable Segments
Reportable Segments
Three Months Ended March 31, 2011 (Unaudited)
Three Months Ended March 31, 2010 (Unaudited)
FY 2011 & 2010 Segment Financial Information |
 AGILYSYS, INC.
The Fourteenth Annual
Needham Growth Conference
January 10-12th, 2012, New York City
| Clean Technologies
|
Communications
| Consumer
| Enterprise Infrastructure
|
Healthcare
|
| Industrial & Diversified Growth
|
Semiconductors & Equipment
|
Software & Services
|
The Leading Growth Company Focused Investment Bank for 27 Years
|