Attached files
| file | filename |
|---|---|
| 8-K - 8-K - REGIONS FINANCIAL CORP | d259443d8k.htm |
| EX-99.1 - EX-99.1 - REGIONS FINANCIAL CORP | d259443dex991.htm |
| EX-99.3 - EX-99.3 - REGIONS FINANCIAL CORP | d259443dex993.htm |
 Regions Financial
Divestiture of Morgan Keegan
January 11, 2012
Exhibit 99.2 |
 Regions Rationale
2
›
Divestiture provides enhanced liquidity at the holding company, improvement in key
capital ratios, and reduced risk
›
Total consideration of $1.180 billion creates significant additional liquidity at
the holding company ›
After-tax
GAAP
loss
and
stockholders’
equity impact estimated at $(673) million*, primarily due to elimination of
goodwill ›
Indemnification liability estimate of $210 million established for potential
future claims and certain legal costs ›
Eliminates ongoing risk of owning a highly regulated entity
›
Improves key capital ratios
›
Creates a new low-cost source of deposits at the bank
›
Provides incremental revenue opportunities through establishing a strong
partnership with Raymond James
›
›
Strengthens focus on our core banking business
* See page 10, note 6, for disclosure related to goodwill
›
Depository, lending and processing relationships
›
Loan referrals to Regions to include: small business, marine, aviation,
automobile and construction products as well as referrals
from
Raymond
James’
Investment Banking clients
›
Ongoing depository, lending, and investment relationships
›
RMK Trust and Morgan Asset Management to be retained by Regions
Critical business relationships maintained between Regions and Morgan Keegan
|
 Transaction Highlights
3
Description
›
Raymond James Financial (NYSE: RJF) to acquire 100% of the outstanding
stock of Morgan Keegan & Company, Inc. (broker / dealer), MK Holding and
related entities
›
RMK Trust and Morgan Asset Management to be retained by Regions
Purchase Price to Regions
›
$930 million, subject to adjustment based on the closing tangible
equity of Morgan Keegan and retention of Morgan Keegan associates in the
immediate post-closing period
Anticipated Pre-Closing
Dividend
›
$250 million
Total Consideration to Regions
›
$1.180 billion
Closing Conditions
›
Customary, including regulatory approvals
Anticipated Closing
›
1Q 2012
Ongoing RF / RJF Business
Relationships
›
Depository, business services, corporate banking, and investments
Legal Indemnification
›
Regions to indemnify Raymond James Financial for all litigation matters related
to pre-closing activities
›
In addition, Regions will receive the benefit of previously established reserves
by Regions at Morgan Keegan |
 Estimated Financial Impact to Regions
3Q11 Pro Forma Selected Metrics
4
1.
Estimates after-tax impact from transaction, indemnification, goodwill
impairment and deal costs. 2.
See page 10 for disclosure related to goodwill , note 6
3.
Includes
write-off
of
goodwill,
adjustment
to
disallowed
deferred
tax
asset
for
regulatory
purposes
and
reduction
in
risk-weighted
assets
4.
Excludes
RMK
Trust
and
Morgan
Asset
Management
to
be
retained
by
Regions
5.
See appendix for reconciliation to GAAP financial measures
6.
Tier 1 Common Equivalent amount calculated as 9 basis point impact times the pro
forma risk weighted assets of $91,986 billion (with minor differences due to rounding)
7.
Tangible Common Equity Equivalent amount calculated as 13 basis points impact times
the pro forma tangible assets of $122.426 billion (with minor differences due to rounding)
After-Tax
GAAP
Loss
&
Impact
to
Stockholders’
Equity
$(673) million
Intangibles Eliminated
$725 million
Net Risk-Weighted Asset Reduction
$800 million
Tier 1 Capital Ratio Increase
13 bps
Tier
1
Common
Ratio
(non-GAAP)
5
Tier
1
Common
Basel
III
(non-GAAP)
5
8.25%
7.77%
Tier
1
Common
Equivalent
/
Basis
Points
Impact
3
(non-GAAP)
5
-
Excluding Indemnification
-
Impact of Indemnification
-
Tier
1
Common
Equivalent
Increase
(Net)
6
$293 million / 32 bps
$210 million / 23 bps
$83 million / 9 bps
Tangible
Common
Equity
Ratio
Increase
(non-GAAP)
5
-
Excluding Indemnification
-
Impact of Indemnification
-
Tangible
Common
Equity
Equivalent
Increase
(Net)
7
$284 million / 24 bps
$130 million / 11 bps
$154 million / 13 bps
YTD
Morgan
Keegan
Net
Income
4
$63 million
YTD
Fee
Income
Ratio
(Reported
/
Pro
Forma)
(non-GAAP)
5
46.5% / 37.3%
YTD
Efficiency
Ratio
(Reported
/
Pro
Forma)
(non-GAAP)
5
68.7% / 64.6%
2
1 |
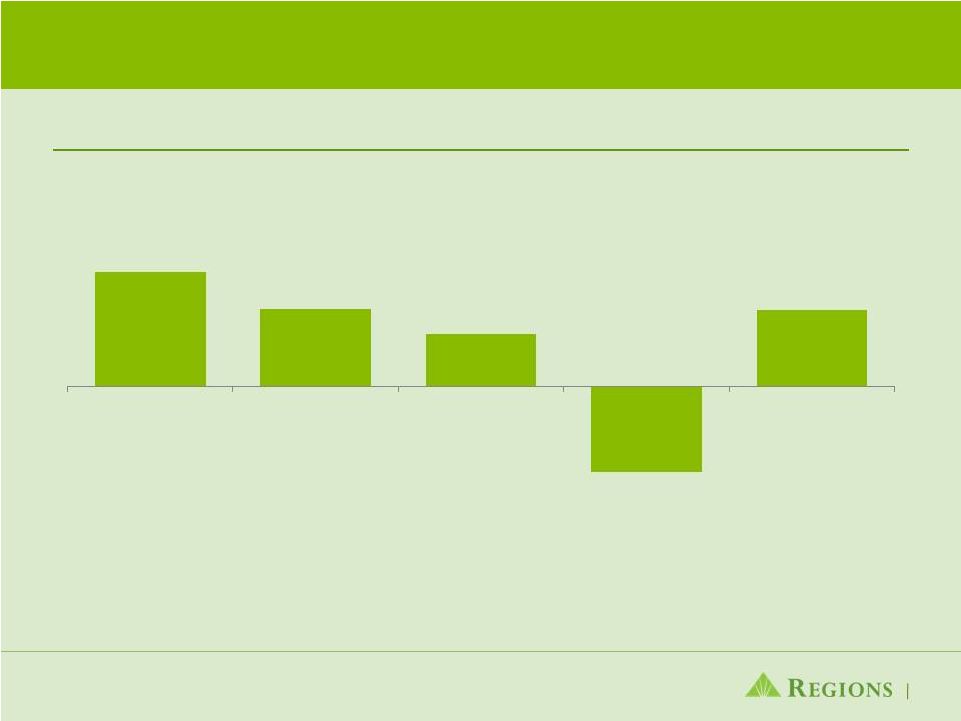 Historical Morgan Keegan Contribution
5
Morgan Keegan¹
Net Income / (Loss)
($ in millions)
²
³
$ 95
$ 64
$ 43
$(71)
2007
2008
2009
2010
2011 YTD
(through 3Q11)
$ 63
1.
Excludes RMK Trust and Morgan Asset Management to be retained by Regions 2.
Reflects impact of $125 million regulatory settlement charge 3.
Includes $27 million tax-benefit related to the regulatory settlement |
 Summary of Transaction Benefits
6
Reduces overall risk profile
Creates significant additional liquidity at the holding company
Provides a new low-cost source of deposits at the bank
Improves key capital ratios
Incremental revenue opportunities created through new strategic alliances with
Raymond James
Ongoing partnerships maintained for critical business relationships between
Regions and Morgan Keegan
Strengthens focus on our core banking business |
 Appendix
7 |
 Disclosure –
Capital
8
Unaudited pro forma financial information has been presented to give effect to and
show the pro forma impact of the transaction on certain of Regions' capital
amounts and ratios as of September 30, 2011 presented on pages 9 and
11. No assurance can be given that such transaction will be completed
on the terms assumed
for
the
purposes
of
this
presentation
of
pro
forma
financial
information
or at all.
The unaudited pro forma capital information is presented for illustrative purposes
only and does not necessarily indicate the results that would have
been
realized
had
the
transaction
been
completed
as
of
September
30,
2011.
The
pro
forma
impact
of
the
transaction
assumes
a
purchase
price
of
$930
million
and
a
dividend
to
Regions
of
$250
million
before
closing,
resulting
in
total
proceeds
of
$1.180 billion.
The
unaudited
pro
forma
capital
information
has
been
derived
from,
and
should
be
read
in
conjunction
with
Regions'
historical
unaudited
consolidated
financial
statements included
in Regions' Quarterly Report on Form 10-Q for the three and nine months ended
September 30, 2011 filed with the SEC. The
following
tables
provide
calculations
of
end
of
period
"tangible
common
stockholders'
equity
to
tangible
assets"
(non-GAAP),
"tangible common
book
value
per
share"
(non-GAAP),
and
"Tier
1
common
risk-based”
(non-GAAP)
ratios, as well as a reconciliation of stockholders' equity (GAAP) to
Tier
1
capital
(regulatory)
and
to
"Tier
1
common
equity"
(non-GAAP). Tangible common stockholders' equity ratios have become a focus of some investors
and management believes they may assist investors in analyzing the
capital position of the Company absent the effects of intangible assets and preferred
stock. Traditionally, the Federal Reserve and other banking regulatory bodies
have assessed a bank's capital adequacy based on Tier 1 capital, the
calculation of which is codified in federal banking regulations.
In connection with the Company’s Comprehensive Capital Assessment and Review
process, these regulators supplement their assessment of the capital
adequacy of a bank based on a variation of Tier 1 capital, known as Tier 1 common
equity. While not codified, analysts and banking regulators have
assessed Regions' capital adequacy using the tangible common stockholders' equity
and/or the Tier 1 common equity measure. Because tangible common
stockholders' equity and Tier 1 common equity are not formally defined by GAAP
or codified in the federal banking regulations, these measures are considered to be
non-GAAP financial measures and other entities may calculate them
differently than Regions' disclosed calculations. Since analysts and banking
regulators may assess Regions' capital adequacy using tangible common
stockholders' equity and Tier 1 common equity, we believe that it is useful to
provide investors the ability to assess Regions' capital adequacy on these
same bases. The tables also include the impact of the indemnification liability on
each of the capital ratios as well as each capital ratio excluding the
indemnification. These amounts are included to illustrate the impact of
components of the transaction on each applicable ratio. Tier 1 common equity
is often expressed as a percentage of risk-weighted assets. Under the risk-based capital framework, a company's balance sheet
assets and credit equivalent amounts of off-balance sheet items are assigned to
one of four broad risk categories. The aggregated dollar amount in each
category is then multiplied by the risk-weighted category. The resulting
weighted values from each of the four categories are added together and this sum
is the risk-weighted assets total that, as adjusted, comprises the denominator
of certain risk-based capital ratios. Tier 1 capital is then divided by this
denominator (risk-weighted assets) to determine the Tier 1 capital ratio.
Adjustments are made to Tier 1 capital to arrive at Tier 1 common equity. Tier 1
common equity is also divided by the risk-weighted assets to determine the Tier
1 common equity ratio. The amounts disclosed as risk-weighted assets
are calculated consistent with banking regulatory requirements.
|
 Estimated
Impact
of
Transaction
-
Capital
(Unaudited)
9
Note: See Footnotes on page 10
($ amounts in millions, except per share data)
As Reported
9/30/11
Goodwill Impairment-
Discontinued
Operations
Goodwill Impairment-
Continuing
Operations
Pro Forma
09/30/11
17,263
$
(428)
$
(6)
(265)
$
(6)
20
$
(1)
16,590
$
3,409
-
-
-
3,409
$
6,039
(428)
(6)
(265)
(6)
(32)
$
(2)
5,314
$
(220)
-
-
-
(220)
$
A
8,035
$
-
$
-
$
52
$
8,087
$
129,762
$
(428)
$
(265)
$
(1,549)
$
(3)
127,520
$
6,039
(428)
(265)
(32)
5,314
$
Deferred tax liability related to intangibles (GAAP)
(220)
-
-
-
(220)
$
B
123,943
$
-
$
-
$
(1,517)
$
122,426
$
C
1,259
1,259
1,259
A/B
6.48%
0.13%
6.61%
TCE/TA -
Impact of Indemnification (non-GAAP)
(0.11%)
(4)
TCE/TA -
Excluding Indemnification (non-GAAP)
0.24%
A/C
6.38
$
0.04
$
6.42
$
17,263
$
(428)
$
(6)
(265)
$
(6)
20
$
16,590
$
(92)
-
-
-
(92)
$
(5,649)
428
(6)
265
(6)
32
(4,924)
$
(506)
-
-
(38)
(544)
$
(36)
-
-
-
(36)
$
92
-
-
-
92
$
846
-
-
-
846
$
D
11,918
$
-
$
-
$
14
$
11,932
$
Tier 1 capital risk-based ratio (regulatory)
D/F
12.84%
0.13%
12.97%
Tier
1
capital
risk-based
ratio
-
Impact
of
Indemnification
(non-GAAP)
(0.23%)
(5)
Tier
1
capital
risk-based
ratio
-
Excluding
Indemnification
(non-GAAP)
0.36%
D
11,918
$
-
$
-
$
14
$
11,932
$
(92)
-
-
-
(92)
$
(846)
-
-
-
(846)
$
(3,409)
-
-
-
(3,409)
$
E
7,571
$
-
$
-
$
14
$
7,585
$
F
92,786
-
-
(800)
91,986
$
E/F
8.16%
0.09%
8.25%
Tier
1
common
risk-based
ratio
-
Impact
of
Indemnification
(non-GAAP)
(0.23%)
(5)
Tier
1
common
risk-based
ratio
-
Excluding
Indemnification
(non-GAAP)
0.32%
Tier 1 capital (regulatory)
Tier 1 common risk-based ratio (non-GAAP)
Tier 1 capital (regulatory)
Qualifying non-controlling interests
Qualifying trust preferred securities
Preferred stock
Tier 1 common equity (non-GAAP)
Risk-weighted assets (regulatory)
Accumulated other comprehensive (income) loss
Non-qualifying goodwill and intangibles
Disallowed deferred tax assets
Disallowed servicing assets
Shares outstanding--end of quarter
Tangible common stockholders' equity to tangible assets (non-GAAP)
Tangible common book value per share (non-GAAP)
TIER 1 CAPITAL AND TIER 1 COMMON RISK-BASED RATIO
Stockholders' equity (GAAP)
Less: Intangible assets (GAAP)
Stockholders' equity (GAAP)
Less: Preferred equity (GAAP)
Intangible assets (GAAP)
Deferred tax liability related to intangibles (GAAP)
Tangible common stockholders' equity (non-GAAP)
Total assets (GAAP)
Qualifying non-controlling interests
Qualifying trust preferred securities
Tangible assets (non-GAAP)
Estimated Impact
Upon Closing |
 Estimated
Impact
of
Transaction
-
Capital
(Footnotes related to page 9)
10
1.
Estimated
after-tax
impact
from
transaction,
indemnification,
goodwill
elimination
and
deal
costs
to
stockholders’
equity
2.
Estimated goodwill to be eliminated at sale date
3.
Estimated adjustment to tangible assets sold net of cash proceeds and deferred
taxes recognized from transaction 4.
Estimated $210 million indemnification (net of 38% assumed effective tax rate) as a
percentage of pro forma tangible assets 5.
Estimated $210 million indemnification as a percentage of pro forma risk weighted
assets. No tax impact included as to be disallowed for regulatory
purposes. 6.
As a result of the process of selling Morgan Keegan,
Regions
expects
to
record an impairment charge (primarily non-deductible) in the fourth
quarter
of
2011
related
to
the
$745
million
of
goodwill
included
in
its
Investment
Banking/Brokerage/Trust
segment.
Based
on
the
relative
fair
value
allocation,
portions
of
the
charge
will
be
recorded
in
the
statement
of
operations
within
both
Discontinued
Operations
and
Continuing
Operations. The
calculations
of
the
amount
of
the
charge
and
the
allocations
are not yet complete and these estimates are subject to change.
Based on currently
available
estimates,
Regions
has
assumed
a
range
of
total
fourth
quarter
2011
impairment
charge
of
$575
-
$745 million.
The goodwill impairment charge is a non-cash item which will not have a
negative impact on regulatory capital. For
purposes
of
the
attached
pro
forma
financial
information,
Regions
has
assumed
a
fourth
quarter
goodwill
impairment
charge
of
$693 million
consisting of $428 million in Discontinued Operations and $265 million in
Continuing Operations. The total amount and these allocations are not
yet complete and are subject to change.
Upon
consummation
of
the
sale
of
Morgan
Keegan,
the
remaining
goodwill
allocated
to
Discontinued
Operations
will
be
derecognized
and
included
in
the
gain/loss
on
sale.
For
purposes
of
the
attached
pro
forma
financial
information
the amount of goodwill derecognized is expected
to be approximately $32 million and the resulting gain is estimated to be
approximately $20 million. The
actual
impairment
charge
is
expected
to
be
in
the
range
listed
above
but
likely
to
vary
from
the
amounts
included
in
the
pro
forma financial
information. Actual results could also vary from the expected ranges.
The allocations between Discontinued and Continuing Operations could
also
vary
from
the
allocations
assumed
in
the
attached
pro
forma
financial information. |
 Estimated
Impact
of
Transaction
–
Capital
Basel
III
(unaudited)
11
($ amounts in millions)
As Reported
09/30/11
Goodwill Impact -
Discontinued
Operations
Goodwill Impact-
Continuing
Operations
Estimated Impact
Upon Closing
Pro Forma
09/30/11
Stockholders' equity (GAAP)
17,263
$
(428)
$
*
(265)
$
*
20
$
*
16,590
$
Non-qualifying goodwill and intangibles
(1)
(5,820)
428
*
265
*
32
*
(5,095)
$
Adjustments, including other comprehensive income related to cash flow hedges,
disallowed deferred tax assets, threshold deductions and other
adjustments (809)
-
-
(2)
(811)
$
10,634
-
-
50
10,684
Qualifying non-controlling interests
4
-
-
-
4
$
Basel III Tier 1 Capital (non-GAAP)
10,638
-
-
50
10,688
Basel III Tier 1 Capital (non-GAAP)
10,638
-
-
50
10,688
$
Preferred stock
(3,409)
-
-
-
(3,409)
$
Qualifying non-controlling interests
(4)
-
-
-
(4)
$
Basel III Tier 1 Common (non-GAAP)
7,225
$
-
$
-
$
50
$
7,275
$
Basel I risk-weighted assets (regulatory)
92,786
$
-
$
-
$
(800)
$
91,986
$
Basel III risk-weighted assets (non-GAAP)
(2)
94,389
$
-
$
-
$
(800)
$
93,589
$
Minimum
Basel III Tier 1 Capital Ratio (non-GAAP)
8.5%
11.27%
11.42%
Basel III Tier 1 Common Ratio (non-GAAP)
7.0%
7.65%
7.77%
Regions currently calculates its risk-based capital ratios under guidelines adopted by the Federal
Reserve based on the 1988 Capital Accord (“Basel I”) of the Basel Committee on
Banking Supervision (the “Basel Committee”). In December 2010, the Basel Committee released
its final framework for Basel III, which will strengthen international capital and liquidity
regulation. When implemented by U.S. bank regulatory agencies and fully phased-in, Basel III will
change capital requirements and place greater emphasis on common equity. Implementation of
Basel III will begin on January 1, 2013, and will be phased in over a multi-year period. The U.S. bank regulatory agencies have not yet finalized regulations
governing the implementation of Basel III. Accordingly, the calculations provided below are estimates,
based on Regions’ current understanding of the framework, including the Company’s
reading of the requirements, and informal feedback received through the regulatory process. Regions’ understanding of the framework is evolving and will likely change as
the regulations are finalized. Because the Basel III implementation regulations are not formally
defined by GAAP and have not yet been finalized and codified, these measures are considered to
be non-GAAP financial measures, and other entities may calculate them differently from Regions’ disclosed calculations. Since analysts and banking regulators may
assess
Regions’
capital
adequacy
using
the
Basel
III
framework,
we
believe
that
it
is
useful
to
provide
investors
the
ability
to
assess
Regions’
capital
adequacy
on
the
same
basis.
*
See related footnote explanations on the "Estimated Impact of Transaction - Capital" page
10 1.
Under Basel III, regulatory capital must be reduced by purchased credit card relationship intangible
assets. These assets are partially allowed in Basel I capital. 2.
Regions continues to develop systems and internal controls to precisely calculate risk-weighted
assets as required by Basel III. The amount included above is a reasonable approximation, based
on our understanding of the requirements. |
 Disclosure on Reconciliation to Certain non-GAAP
Financial Measures
12 |
 Reconciliation to Certain non-GAAP Financial Measures
(unaudited)
13
Note: References to Morgan Keegan on this slide exclude RMK Trust and Morgan
Asset Management. See related disclosure on page 12.
As of and for Quarter Ended
($ in millions)
3/31/11
6/30/11
9/30/11
YTD 9/30/11
Reported
Non-interest expense (GAAP)
$
1,167
$
1,198
$
1,066
$
3,431
Adjustments:
Branch consolidation and property and equipment charges
–
(77)
–
(77)
Adjusted non-interest expense (non-GAAP)
A
$
1,167
$
1,121
$
1,066
$
3,354
Net interest income, taxable-equivalent basis (GAAP)
$
872
$
872
$
866
$
2,610
Non-interest income (GAAP)
$
843
$
781
$
745
$
2,369
Adjustments:
Securities (gains) losses, net
(82)
(24)
1
(105)
Leveraged lease termination losses, net
–
–
2
2
Loss on sale of mortgage loans
3
–
–
3
Adjusted non-interest income (non-GAAP)
B
$
764
$
757
$
748
$
2,269
Adjusted total revenue (non-GAAP)
C
$
1,636
$
1,629
$
1,614
$
4,879
Fee income ratio (non-GAAP)
B / C
46.7
%
46.5
%
46.3
%
46.5
%
Efficiency ratio (non-GAAP)
A / C
71.3
68.8
66.0
68.7
Pro Forma
Adjusted non-interest expense (non-GAAP)
$
1,167
$
1,121
$
1,066
$
3,354
Morgan Keegan non-interest expense
(235)
(242)
(216)
(693)
Pro forma adjusted non-interest expense (non-GAAP)
D
$
932
$
879
$
850
$
2,661
Net interest income, taxable-equivalent basis (GAAP)
$
872
$
872
$
866
$
2,610
Morgan Keegan net interest income
(8)
(8)
(8)
(24)
Pro forma net interest income, taxable-equivalent basis (GAAP)
$
864
$
864
$
858
$
2,586
Adjusted non-interest income (non-GAAP)
$
764
$
757
$
748
$
2,269
Morgan Keegan non-interest income
(263)
(238)
(232)
(733)
Pro forma adjusted non-interest income (non-GAAP)
E
$
501
$
519
$
516
$
1,536
Pro forma adjusted total revenue (non-GAAP)
F
$
1,365
$
1,383
$
1,374
$
4,122
Pro forma fee income ratio (non-GAAP)
E / F
36.7
%
37.5
%
37.6
%
37.3
%
Pro forma efficiency ratio (non-GAAP)
D / F
68.3
63.6
61.9
64.6 |
 ›Forward-
14
This presentation and any other written or oral statements made by or on behalf of Regions Financial
Corporation (“Regions”) in connection with the matters described in this presentation
may include forward-looking statements, including, but not limited to, statements about the
projected impact on Regions of the transaction described in the presentation. The Private Securities
Litigation Reform Act of 1995 (the “Act”) provides a safe harbor for
forward-looking statements which are identified as such and are accompanied by the identification of important
factors that could cause actual results to differ materially from the forward-looking statements.
For these statements, we, together with our subsidiaries, unless the context implies otherwise,
claim the protection afforded by the safe harbor in the Act. Forward-looking statements are
not based on historical information, but rather are related to future operations, strategies, financial results or other developments.
Forward-looking statements are based on management’s expectations as well as certain
assumptions and estimates made by, and information available to, management at the time the
statements are made. Those statements are based on general assumptions and are subject to
various risks, uncertainties and other factors that may cause actual results to differ materially from the views, beliefs and
projections expressed in such statements. In addition to factors previously disclosed in Regions’
filings with the U.S. Securities and Exchange Commission, these risks, uncertainties and other
factors include, but are not limited to: the possibility that regulatory and other approvals
and conditions to the transaction are not received or satisfied on a timely basis or at all; the possibility that modifications to the
terms of the transaction may be required in order to obtain or satisfy such approvals or conditions;
changes in the anticipated timing for closing the transaction; business disruption during the
pendency of or following the transaction; diversion of management time on
transaction-related issues; reputational risks and the reaction of customers and counterparties to
the transaction and the completion of the audit and finalization of our financial statements
for fourth quarter and fiscal year 2011.
Annualized, pro forma, projected and estimated numbers are used for illustrative purposes only, are
not forecasts and may not reflect actual results. Use of non-GAAP Financial Measures
Non-GAAP financial measures have inherent limitations, are not required to be uniformly applied
and are not audited. Although these non- GAAP financial measures are frequently used by
stakeholders in the evaluation of a company, they have limitations as analytical tools, and
should not be considered in isolation, or as a substitute for analyses of results as reported under
GAAP. See slide 9 and 11 for a reconciliation of stockholders’ equity (GAAP) to tangible common book
value (non-GAAP) to Tier 1 capital (regulatory) to Tier 1 common equity (non-GAAP) and
to estimated Basel III ratios (non-GAAP). These reconciliations also present the pro
forma impact of the transaction on stockholders’ equity, tangible common stockholders’
equity, Tier 1 capital, Tier 1 common, and estimated Basel III regulatory ratios.
See slide 13 for a detail of efficiency ratios (non-GAAP) and fee ratios (non-GAAP).
Looking
Statements |
 |