Attached files
| file | filename |
|---|---|
| 8-K - PXD JAN 9, 2012 PRESENTATION 8-K - PIONEER NATURAL RESOURCES CO | pxdjan98k.htm |

Investor Presentation
January 2012
January 2012
EXHIBIT 99.1

2
Forward-Looking Statements
Except for historical information contained herein, the statements, charts and graphs in this
presentation are forward-looking statements that are made pursuant to the Safe Harbor Provisions
of the Private Securities Litigation Reform Act of 1995. Forward-looking statements and the
business prospects of Pioneer are subject to a number of risks and uncertainties that may cause
Pioneer's actual results in future periods to differ materially from the forward-looking statements.
These risks and uncertainties include, among other things, volatility of commodity prices, product
supply and demand, competition, the ability to obtain environmental and other permits and the
timing thereof, other government regulation or action, the ability to obtain approvals from third
parties and negotiate agreements with third parties on mutually acceptable terms, litigation, the
costs and results of drilling and operations, availability of equipment, services and personnel
required to complete the Company's operating activities, access to and availability of
transportation, processing and refining facilities, Pioneer's ability to replace reserves, implement
its business plans or complete its development activities as scheduled, access to and cost of capital,
the financial strength of counterparties to Pioneer's credit facility and derivative contracts and the
purchasers of Pioneer's oil, NGL and gas production, uncertainties about estimates of reserves and
resource potential and the ability to add proved reserves in the future, the assumptions underlying
production forecasts, quality of technical data, environmental and weather risks, including the
possible impacts of climate change, international operations and acts of war or terrorism. These
and other risks are described in Pioneer's 10-K and 10-Q Reports and other filings with the
Securities and Exchange Commission. In addition, Pioneer may be subject to currently unforeseen
risks that may have a materially adverse impact on it. Pioneer undertakes no duty to publicly
update these statements except as required by law.
Please see the appendix slides included in this presentation for other important information.

3
§ 2012 drilling program focused in four liquids-rich plays with
substantial resource potential
substantial resource potential
– Spraberry Vertical
– Wolfcamp Shale Horizontal
– Eagle Ford Shale
– Barnett Shale Combo
§ Forecasting 18+% compound annual production growth and ~30%
compound annual operating cash flow growth through 20141
compound annual operating cash flow growth through 20141
§ Vertical integration substantially improving returns
§ Attractive derivative positions protect margins; 85% coverage for
oil and 80% coverage for gas in 2012
oil and 80% coverage for gas in 2012
§ Strong financial position
Investment Highlights
1) Commodity prices of $90/bbl and $5/mcf
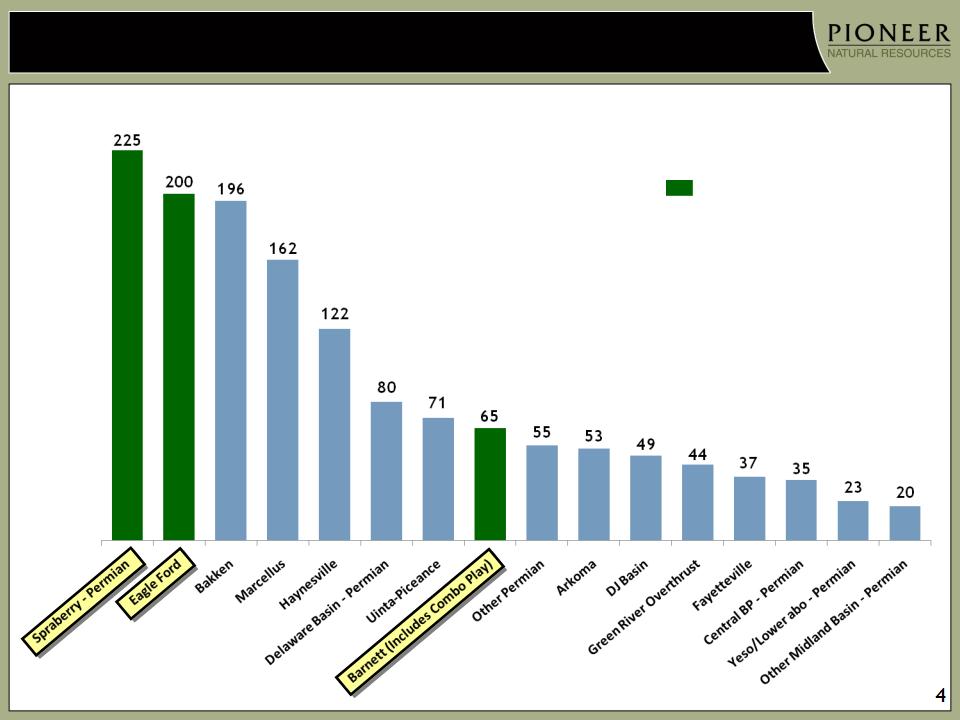
Pioneer is a Leader in the Two Most Active U.S. Plays
U.S. Rig Activity1
1) Source: ISI Group, Inc.
Pioneer Growth Areas
5
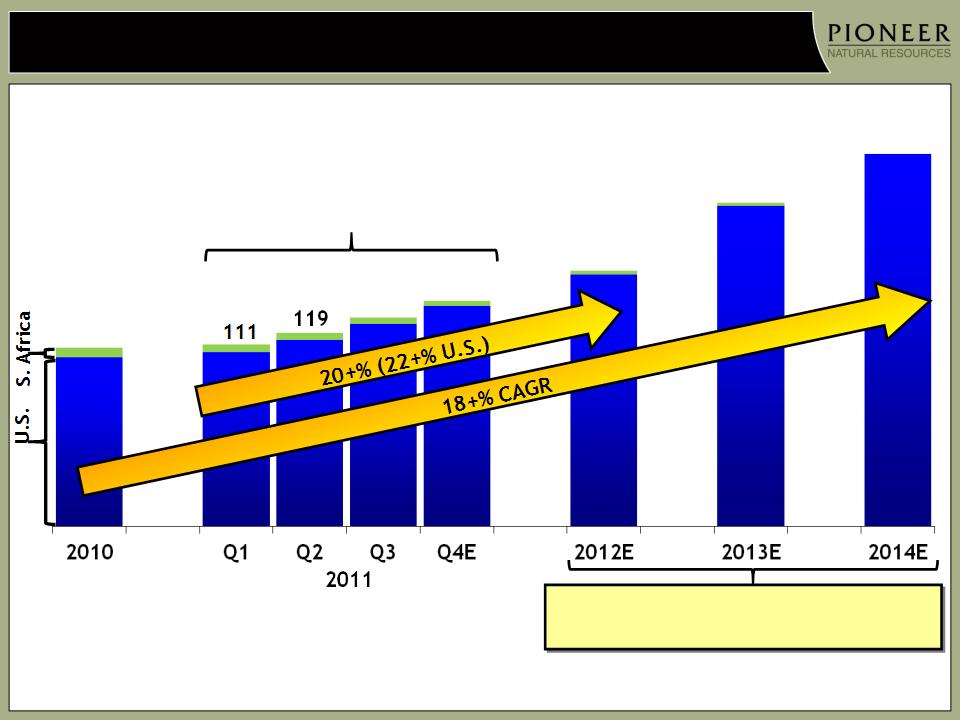
Targeting 18+% Compound Annual Production Growth For 2011 - 2014
MBOEPD
109
1) Reflects Tunisia as discontinued operations
2) 2011 annual production reduced by an estimated 3,500 BOEPD - 4,000 BOEPD due to severe weather and delayed delivery of frac fleets in Q1, Spraberry oil
transport truck shortfall in Q2, third-party water injection supply shortages in Alaska and unplanned South Africa GTL plant downtime in 2H
transport truck shortfall in Q2, third-party water injection supply shortages in Alaska and unplanned South Africa GTL plant downtime in 2H
1
1
128
136 - 141
44%
Liquids
Liquids
60%
Liquids
Liquids
52%
Liquids
Liquids
Up ~15% vs. 2010
Excludes impact from planned expansion of
horizontal Wolfcamp Shale drilling
horizontal Wolfcamp Shale drilling
2

6
|
Oil
|
2012
|
2013
|
2014
|
2015
|
|
Swaps - WTI (BPD)
|
3,000
|
3,000
|
-
|
-
|
|
NYMEX WTI Price ($/BBL)
|
$ 79.32
|
$ 81.02
|
-
|
-
|
|
Collars - (BPD)
|
2,000
|
-
|
-
|
-
|
|
NYMEX Call Price ($/BBL)
|
$ 127.00
|
-
|
-
|
-
|
|
NYMEX Put Price ($/BBL)
|
$ 90.00
|
-
|
-
|
-
|
|
Three Way Collars - (BPD)1
|
41,000
|
39,000
|
17,000
|
-
|
|
NYMEX Call Price ($/BBL)
|
$ 118.50
|
$ 118.96
|
$122.92
|
-
|
|
NYMEX Put Price ($/BBL)
|
$ 82.32
|
$ 85.08
|
$88.53
|
-
|
|
NYMEX Short Put Price ($/BBL)
|
$ 66.46
|
$ 67.00
|
$ 71.47
|
-
|
|
% Total Oil Production
|
~85%
|
~60%
|
~25%
|
-
|
|
|
|
|
|
|
|
Natural Gas Liquids
|
2012
|
2013
|
2014
|
2015
|
|
Swaps - (BPD)
|
750
|
-
|
-
|
-
|
|
Blended Index Price ($/BBL)2
|
$ 35.03
|
-
|
-
|
-
|
|
Collars - (BPD)
|
-
|
-
|
-
|
-
|
|
NYMEX Call Price ($/BBL)
|
-
|
-
|
-
|
-
|
|
NYMEX Put Price ($/BBL)
|
-
|
-
|
-
|
-
|
|
Three Way Collars - (BPD)1
|
3,000
|
-
|
-
|
-
|
|
NYMEX Call Price ($/BBL)
|
$ 79.99
|
-
|
-
|
-
|
|
NYMEX Put Price ($/BBL)
|
$ 67.70
|
-
|
-
|
-
|
|
NYMEX Short Put Price ($/BBL)
|
$ 55.76
|
-
|
-
|
-
|
|
% Total NGL Production
|
~15%
|
-
|
-
|
-
|
|
|
|
|
|
|
|
% Total Liquids
|
~65%
|
~35%
|
~15%
|
-
|
PXD Open Commodity Derivative Positions as of 1/4/2012 (includes PSE)
1) When NYMEX price is above Call price, PXD receives Call price. When NYMEX price is between Put price and Call price, PXD receives NYMEX price. When NYMEX price is between the Put price and the Short Put
price, PXD receives Put price. When NYMEX price is below the Short Put price, PXD receives NYMEX price plus the difference between the Short Put price and Put price
price, PXD receives Put price. When NYMEX price is below the Short Put price, PXD receives NYMEX price plus the difference between the Short Put price and Put price
2) Represents weighted average index price of each NGL component price per barrel

7
|
Gas
|
2012
|
2013
|
2014
|
2015
|
|
Swaps - (MMBTUPD)
|
105,000
|
67,500
|
50,000
|
-
|
|
NYMEX Price ($/MMBTU)1
|
$ 5.82
|
$ 6.11
|
$6.05
|
-
|
|
Collars - (MMBTUPD)
|
65,000
|
150,000
|
140,000
|
50,000
|
|
NYMEX Call Price ($/MMBTU)1
|
$ 6.60
|
$ 6.25
|
$ 6.44
|
$ 7.92
|
|
NYMEX Put Price ($/MMBTU)1
|
$ 5.00
|
$ 5.00
|
$ 5.00
|
$ 5.00
|
|
Three Way Collars - (MMBTUPD)1,2
|
170,000
|
45,000
|
60,000
|
30,000
|
|
NYMEX Call Price ($/MMBTU)
|
$ 7.92
|
$ 7.49
|
$ 7.80
|
$ 7.11
|
|
NYMEX Put Price ($/MMBTU)
|
$ 6.07
|
$ 6.00
|
$ 5.83
|
$ 5.00
|
|
NYMEX Short Put Price ($/MMBTU)
|
$ 4.50
|
$ 4.50
|
$ 4.42
|
$ 4.00
|
|
% U.S. Gas Production
|
~80%
|
~55%
|
~45%
|
~15%
|
PXD Open Commodity Derivative Positions as of 1/4/2012 (includes PSE)
1) Represents the NYMEX Henry Hub index price or approximate NYMEX price based on historical differentials to the index price at the time the derivative was entered into
2) When NYMEX price is above Call price, PXD receives Call price. When NYMEX price is between Put price and Call price, PXD receives NYMEX price. When NYMEX price is between
the Put price and the Short Put price, PXD receives Put price. When NYMEX price is below the Short Put price, PXD receives NYMEX price plus the difference between Short Put
price and Put price
the Put price and the Short Put price, PXD receives Put price. When NYMEX price is below the Short Put price, PXD receives NYMEX price plus the difference between Short Put
price and Put price
|
Gas Basis Swaps
|
2012
|
2013
|
2014
|
2015
|
|
Spraberry (MMBTUPD)
|
32,500
|
52,500
|
45,000
|
-
|
|
Price Differential ($/MMBTU)
|
$ (0.38)
|
$ (0.23)
|
$ (0.27)
|
-
|
|
Mid-Continent (MMBTUPD)
|
50,000
|
30,000
|
30,000
|
-
|
|
Price Differential ($/MMBTU)
|
$ (0.53)
|
$ (0.38)
|
$ (0.27)
|
-
|
|
Gulf Coast (MMBTUPD)
|
53,500
|
60,000
|
40,000
|
-
|
|
Price Differential ($/MMBTU)
|
$ (0.15)
|
$ (0.14)
|
$ (0.16)
|
-
|
8
Liquidity Position (09/30/11 Pro Forma)1
Net debt (net of cash balance of $695 MM): $1.9 B
Unsecured Senior Credit Facility availability: $1.2 B
Net Debt-to-Book Capitalization: 25%
1) Includes net proceeds from November equity offering of $484 MM; excludes $97 MM of borrowings under PSE’s $300 MM Credit Facility that matures in May 2013
2) Excludes net discounts and deferred hedge losses of ~$80 MM
3) Convertible senior notes due 2038, with first put/call in 2013
4) Excludes ~$65 MM of outstanding letters of credit on Senior Credit Facility
Maturities and Balances2
Unsecured Senior Credit Facility matures in 2016
No bond maturities until 2013
Investment Grade Rated by Standard & Poor’s
2011
2012
2016
$250 MM
7.20%
2017
$455 MM
5.875%
2028
$450 MM
6.875%
$0 MM4 of
$1.25 B Unsecured Senior Credit Facility
2018
$485 MM
6.65%
2013
$480 MM3
2.875%
$450 MM
7.50%
2020
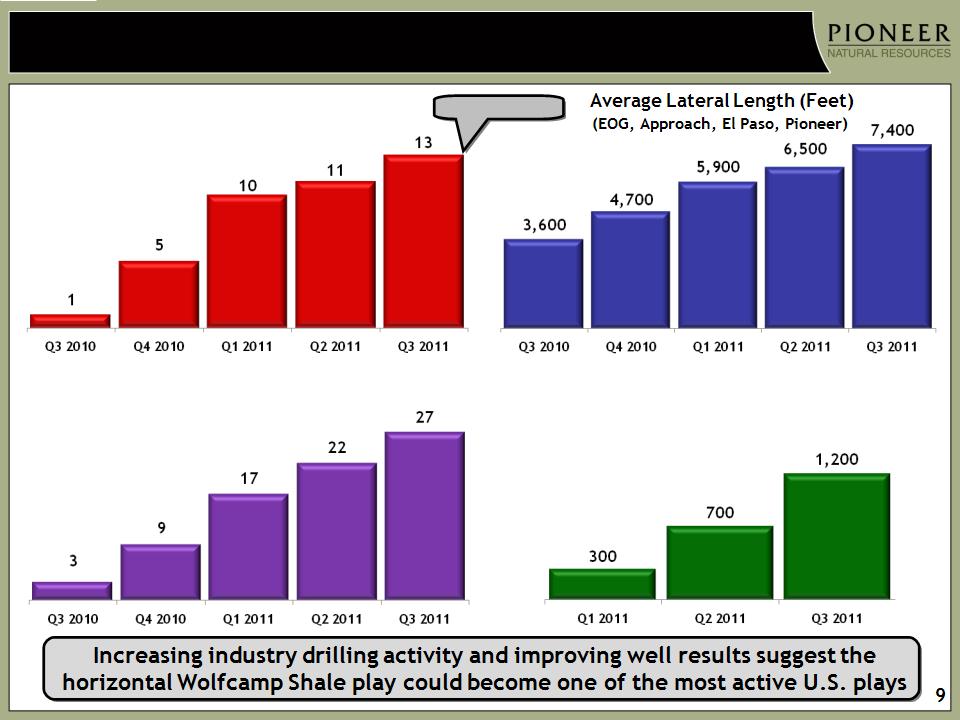
Industry Increasing Horizontal Wolfcamp Shale Activity
Average Drilling Rigs
(All Companies)
Average 24-hr Peak IPs (BOEPD)
(EOG, Approach, El Paso, Pioneer)
21 rigs currently
Horizontal Wells Drilled
(All Companies)
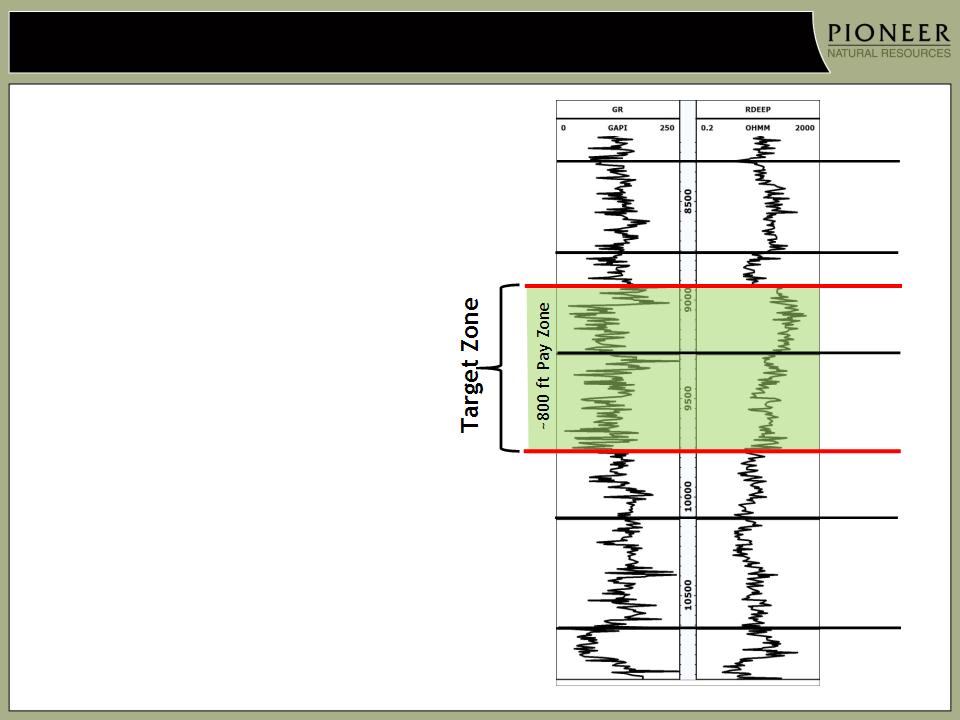
§ XBC Giddings Estate 2041H
− First horizontal Wolfcamp Shale well in Upton County
− 24-hour IP rate of 854 BOEPD1
(686 BOPD + 102 BNGLPD + 395 MCFD)
(686 BOPD + 102 BNGLPD + 395 MCFD)
− Peak 30-day average natural flow rate of 643 BOEPD1
(519 BOPD + 75 BNGLPD + 290 MCFD)
(519 BOPD + 75 BNGLPD + 290 MCFD)
− 5,800 foot lateral with 30-stage completion
− Landed lateral between Upper and Middle Wolfcamp
Shale intervals
Shale intervals
§ Microseismic analysis of XBC Giddings Estate
2041H completion showed successful
stimulation
2041H completion showed successful
stimulation
− Successfully fractured entire 800 foot thick target zone
Dean
Lower
Spraberry
Shale
Shale
Upper
Wolfcamp
Shale
Wolfcamp
Shale
Lower
Wolfcamp
Shale
Wolfcamp
Shale
Strawn
Middle
Wolfcamp
Shale
Wolfcamp
Shale
Jo Mill
PXD’s Successful Horizontal Wolfcamp Shale Well
10
1) NGL volumes estimated with an average NGL yield of 140 BBL/MMCF and 46% shrink
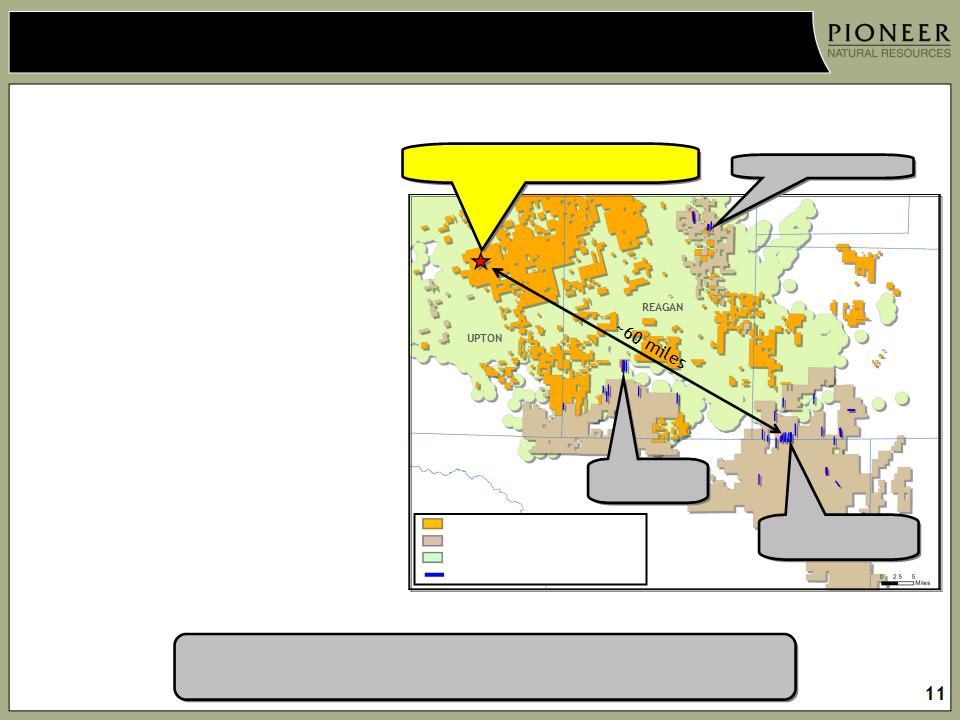
PXD’s Acreage Has Significant Horizontal Wolfcamp Shale Potential
§ PXD and industry well results
coupled with PXD geologic
interpretation suggest significant
horizontal Wolfcamp Shale
potential within PXD’s acreage
coupled with PXD geologic
interpretation suggest significant
horizontal Wolfcamp Shale
potential within PXD’s acreage
− >400,000 acres potentially prospective
for horizontal Wolfcamp Shale within
PXD’s acreage
for horizontal Wolfcamp Shale within
PXD’s acreage
− Petrophysical and core analysis shows
substantial oil in place
substantial oil in place
• 50 - 100 MMBO/section
− PXD currently focused on >200,000
acres in the southern part of the field
acres in the southern part of the field
− PXD has not been drilling vertical
Spraberry wells in this area due to
marginal returns
Spraberry wells in this area due to
marginal returns
IRION
CROCKETT
STERLING
PXD Acreage
Competitor Horizontal Acreage
Spraberry Field
Competitor Horizontal
PXD Giddings Estate 2041H: 854 BOEPD IP
Industry 700+ BOEPD IPS
Main Industry Activity
1,000+ BOEPD IPs
Recent Industry
700+ BOEPD
IPs
IPs
Expect horizontal Wolfcamp Shale to be PXD’s
4th liquids-rich, high-return growth asset in Texas
4th liquids-rich, high-return growth asset in Texas
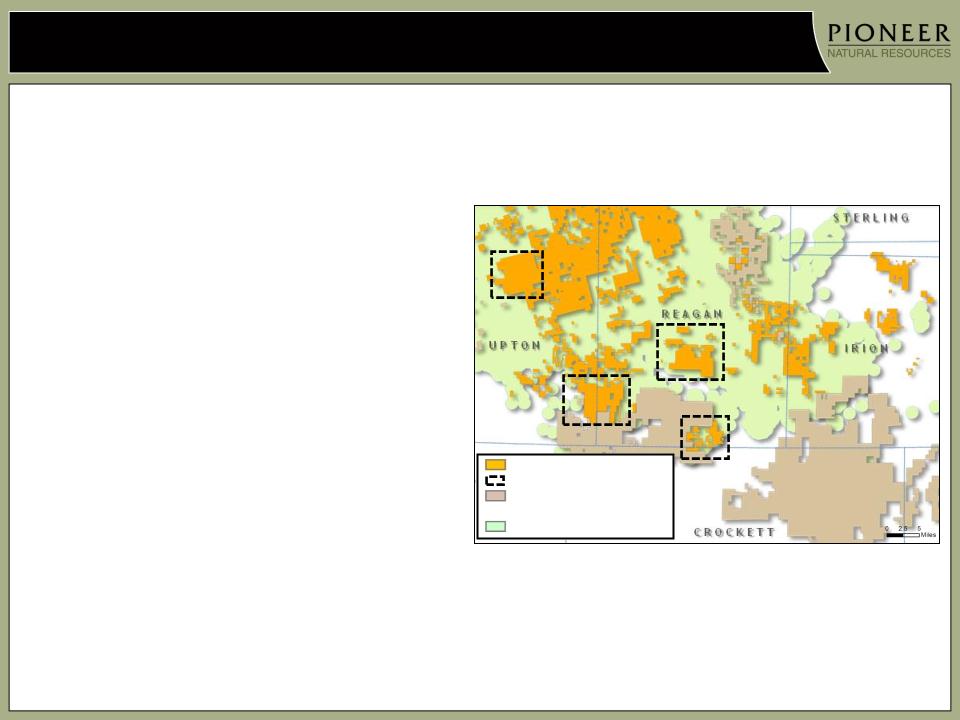
PXD’s Horizontal Wolfcamp Shale Drilling Metrics & Plan
12
Drilling Metrics
§ Total vertical well depth: 9,000 ft - 10,000 ft
§ Well design: 7,000+ ft lateral, 30+ stages
§ Wells / rig / year: 8
§ EUR per well: 350 - 500 MBOE1
§ Planned spacing: 140 acres
§ Blended well cost:
− Science well: $8 MM - $9 MM
− Development well: $6 MM - $7 MM
§ Expect IRRs similar to Spraberry vertical wells
2012 - 2013 Drilling Plan
§ Expect to drill ~80 wells by YE 2013 to hold
expiring acreage (~50,000 acres)
expiring acreage (~50,000 acres)
§ Increasing from 1 rig to 3 rigs in Q1; expect
to ramp up to 7 rigs by year end
to ramp up to 7 rigs by year end
− Currently flowing second well in Upton County
• ~6,000 foot lateral with 30-stage completion
− Third and fourth wells will test longer laterals in
southern Reagan County
southern Reagan County
§ Acquiring 260 sq. mi. 3-D seismic in Q1
PXD Acreage
PXD Initial Drilling Areas
Competitor Horizontal
Acreage
Spraberry Field
1) Pioneer and offset operator data
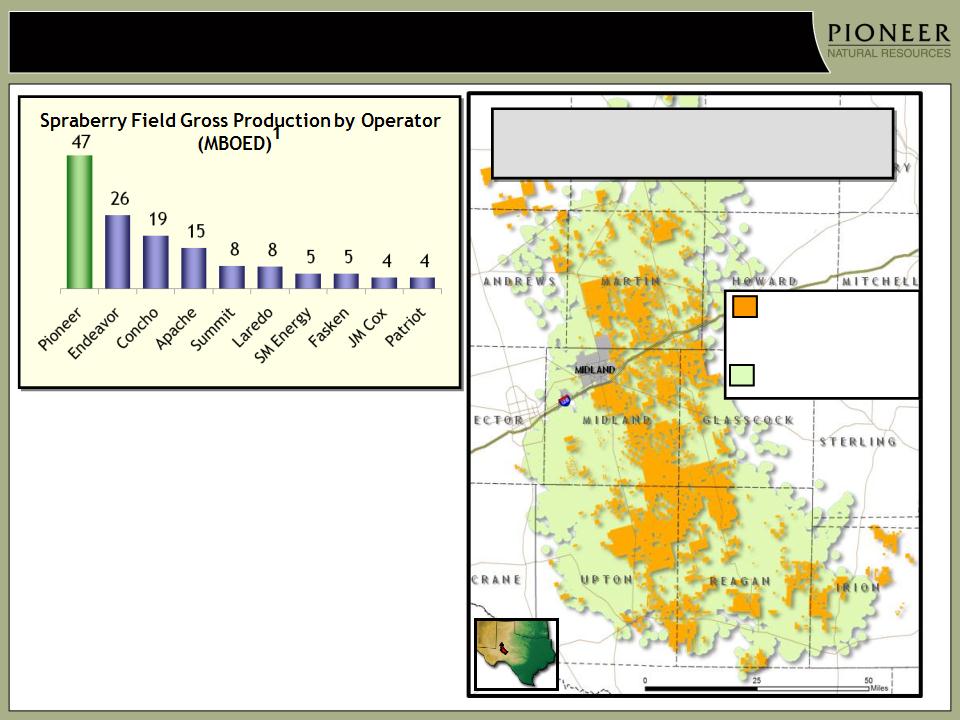
PXD - Largest Spraberry Acreage Holder, Driller and Producer
PXD Acreage
(~900,000 Acres;
~75% HBP)
~75% HBP)
>20,000 Vertical Drilling Locations
(Central and Northern Parts of Field)
13
Spraberry Field
§ 2011 average Lower Wolfcamp blended
vertical well cost: $1.5 - $1.6 MM
vertical well cost: $1.5 - $1.6 MM
§ Before tax IRR: ~40%2
− Reflects 140 MBOE type curve for 40-acre
Lower Wolfcamp vertical well
Lower Wolfcamp vertical well
− Drilling deeper to Strawn, Atoka and
Mississippian intervals enhances IRR
Mississippian intervals enhances IRR
1) Based on 2010 data from Railroad Commission of Texas
2) Commodity prices of $90/bbl and $5/mcf
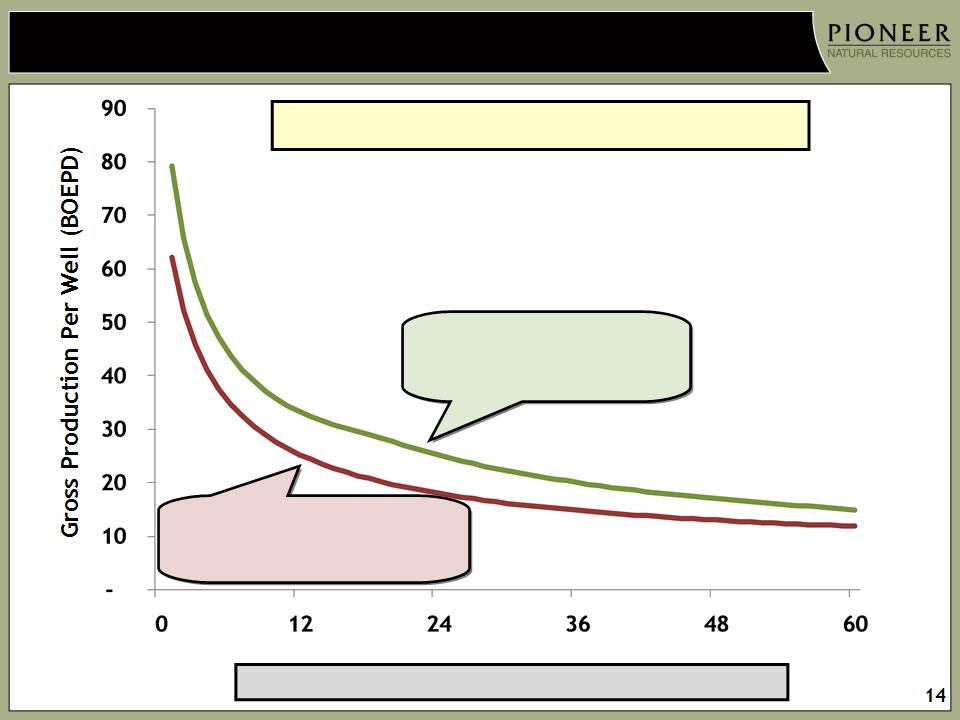
140 MBOE Spraberry 40-Acre Vertical Well Type Curve
Month
Strawn / Atoka / Mississippian Potential Not Included
140 MBOE
Spraberry/Dean/Full
Wolfcamp
Wolfcamp
(70% oil, 20% NGLs, 10% gas)
110 MBOE
Spraberry/Dean/Upper Wolfcamp
(70% oil, 20% NGLs, 10% gas)
Deeper drilling in Spraberry increasing EURs
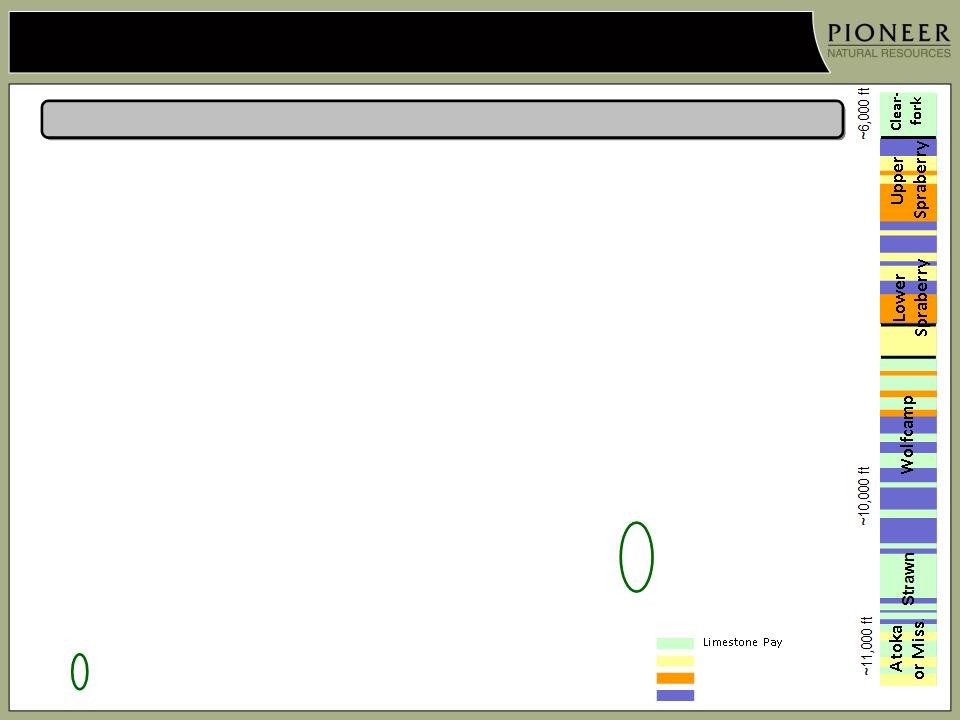
Deeper Vertical Drilling in Spraberry Increasing EURs (Intervals Below Wolfcamp)
15
Dean
Sandstone Pay
Non-Organic Shale Non-Pay
Organic Rich Shale Pay
|
|
Wells
Completed Through Q3 |
Incremental Cost
|
Single-Zone
Peak Rate |
Potential
Incremental EUR |
Prospective
PXD Acreage |
|
Strawn
|
113
|
$60 M
|
70 BOEPD
|
20 - 40 MBOE
|
40%
|
|
Atoka
|
3
|
$300 M - $350 M
|
150 BOEPD
|
50 - 70 MBOE
|
25% - 50%
|
|
Mississippian
|
2
|
$300 M - $350 M
|
105 BOEPD
|
15 - 30 MBOE
|
10% - 20%
|
Potential to add up to 110 MBOE to EUR from deeper drilling
Current Spraberry 40-acre type curve EUR including Lower Wolfcamp: 140 MBOE
Deeper Drilling Potential
|
|
Q3 2011 Results1
|
2012 Drilling Program
|
|
Strawn
|
25+% increase in cumulative production
during first 10 months compared to offset Lower Wolfcamp wells |
Complete in 25% of wells
|
|
Atoka
|
1 zonal test of 127 BOEPD
|
15% - 20% of program
|
|
Mississippian
|
1 zonal test of 92 BOEPD
|
~10% of program
|
Q3 2011 Deeper Drilling Results
1) Q4 2011 results to be discussed in Q4 earnings release
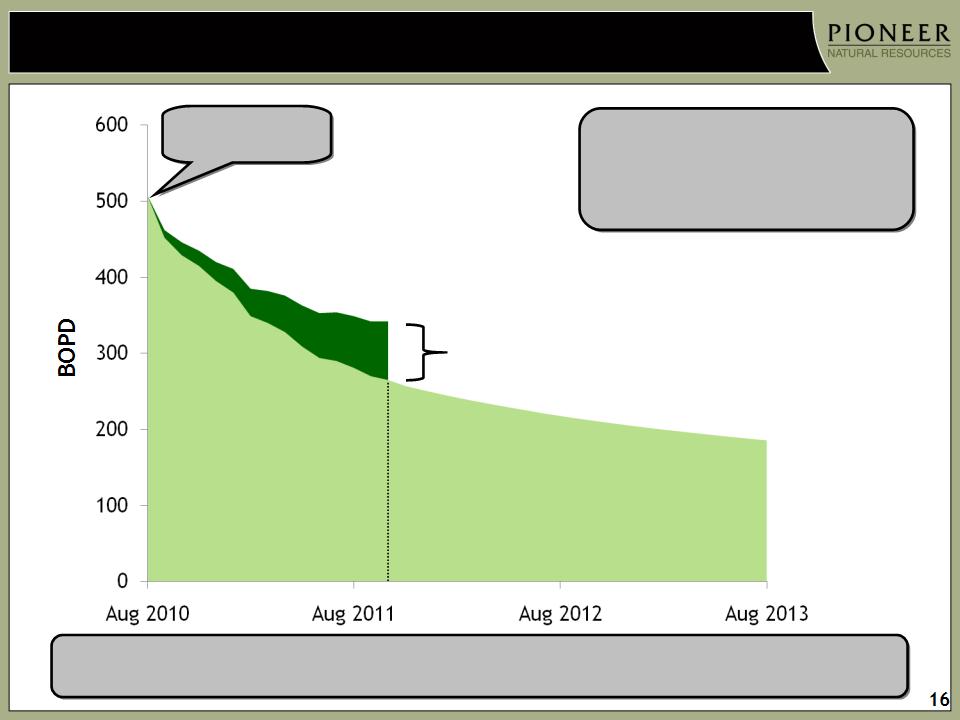
Early Results of Spraberry Waterflood Encouraging
Upper
Spraberry Base
Production
Spraberry Base
Production
(110 wells)
Upper
Spraberry Base
Production
Forecast
Spraberry Base
Production
Forecast
§ Production wedge building as
additional wells respond to waterflood
additional wells respond to waterflood
§ Early results support reserve adds
Waterflood has increased cumulative Upper Spraberry production >10% within
project area compared to base production decline; further increase expected
project area compared to base production decline; further increase expected
§ 7,000-acre project in Spraberry
§ 12 injectors and 110 producers
§ Injecting 4,100 BWPD
§ $6 - $7 MM capital cost
§ LOE savings from water handling
Water injection
begins
begins
Spraberry 20-Acre Vertical Well Update
17
20-Acre Drilling (~13,000 locations)
§ Drilled 11 wells through Q3 2011; 6 on
production
production
§ Capturing pay from Lower Wolfcamp, Strawn
and shale/silt intervals
and shale/silt intervals
§ Results to date indicate production
outperforming previous 110 MBOE type curve
for a 40-acre Spraberry/Dean well
outperforming previous 110 MBOE type curve
for a 40-acre Spraberry/Dean well
§ Targeting 30 - 50 wells in 2012
Spraberry Drilling Rig
Continuing to Successfully Grow Spraberry Production
18
Spraberry Net Production1
(MBOEPD)
(MBOEPD)
54 - 59
68 - 74
1) Includes expiration of VPP commitments (3 MBOEPD @ YE 2010 and 4 MBOEPD @ YE 2012)
47
2011E
(expect to be towards high end
of 43 - 46 MBOEPD FY guidance)
of 43 - 46 MBOEPD FY guidance)
77 - 84
51 - 53
Excludes potential contributions from deeper
intervals below Lower Wolfcamp in vertical
wells and impacts from expected expansion
of horizontal Wolfcamp Shale drilling
wells and impacts from expected expansion
of horizontal Wolfcamp Shale drilling
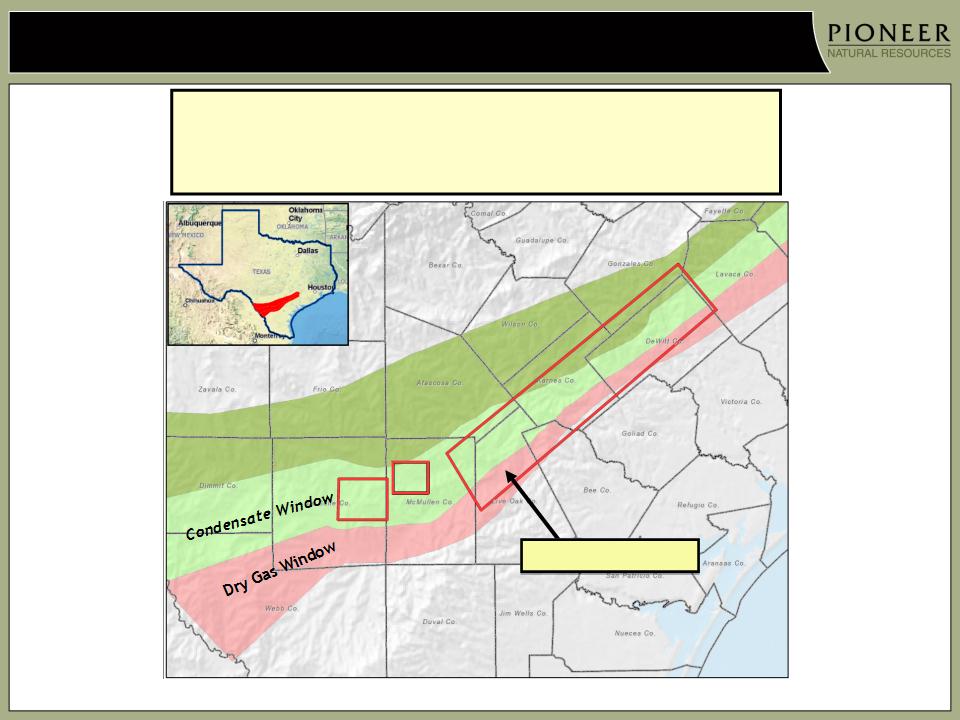
Eagle Ford Shale: A Burgeoning Liquids-Rich Shale Play
19
§ Gross resource potential of play: ~25 BBOE (~150 TCFE)1
§ Estimated Gross Production of ~3.5 MMBOEPD by 20202
§ ~200 rigs currently running in the play
Oil Window
Map source: PXD
1) Source: Tudor, Pickering, Holt & Co.
2) Source: FBR
PXD Acreage Area
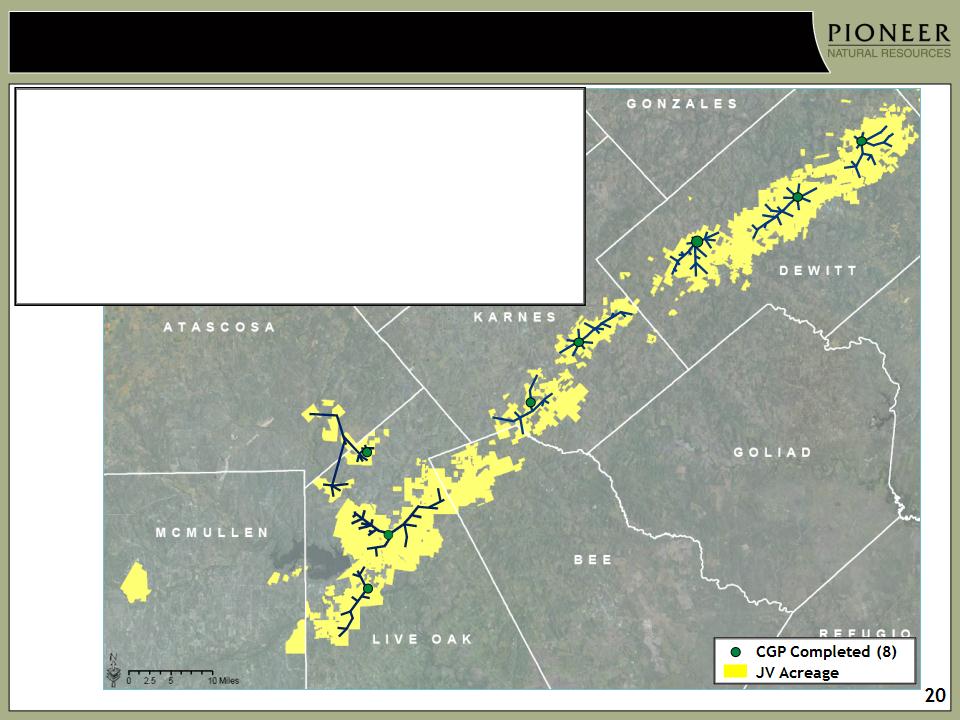
Eagle Ford Shale Operational Update
§ Running 12 rigs
− Current gross well cost: $7 MM - $8 MM
− Before tax IRRs1: ~80% for rich condensate and ~60% for lean condensate
(excludes carry benefit)
(excludes carry benefit)
§ Average lateral length ~5,500 feet with 13-stage completion
§ Using white sand proppant in shallower areas (~30% of program)
− 20 wells stimulated using white sand; early well performance similar to
direct offset ceramic-stimulated wells
direct offset ceramic-stimulated wells
− Reduces frac cost by ~$700 M
§ 8 CGPs on line; 3 additional planned for 2012
§ Oil prices improving relative to WTI
1) Commodity prices of $90/bbl and $5/mcf
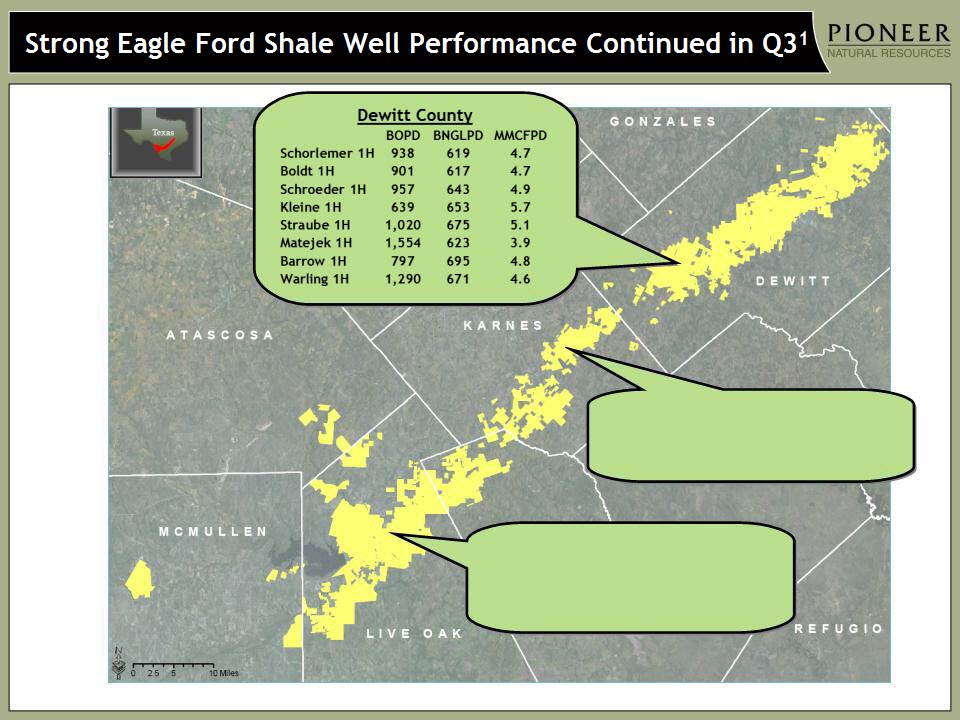
21
1) 24-hour restricted flow tests at 16/64th choke; NGL volumes estimated with an average NGL yield of 120 BBL/MMCF and 16% shrink
Karnes County
BOPD BNGLPD MMCFPD
Ridley 1H 391 571 3.6
Ridley Farms 1H 880 768 6.4
Live Oak County
BOPD BNGLPD MMCFPD
Jack Meeks 2H 785 190 1.0
HT Chapman 3H 1,011 362 2.2
Three Sisters 3H 813 332 2.1
22
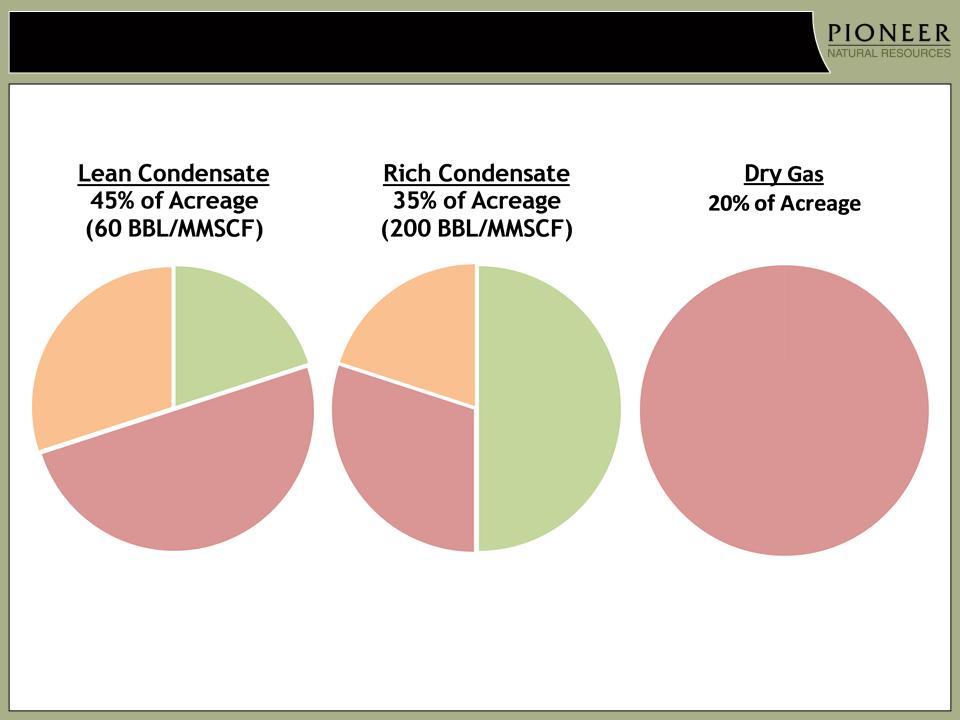
Eagle Ford Shale Resource Breakdown
30%
NGL*
NGL*
50%
Gas
Gas
20%
Condensate
20%
NGL*
NGL*
30%
Gas
Gas
100%
Gas
Gas
50%
Condensate
*NGLs are 50% ethane, 25% propane, 15% butanes and 10% heavier liquids
~
~
~
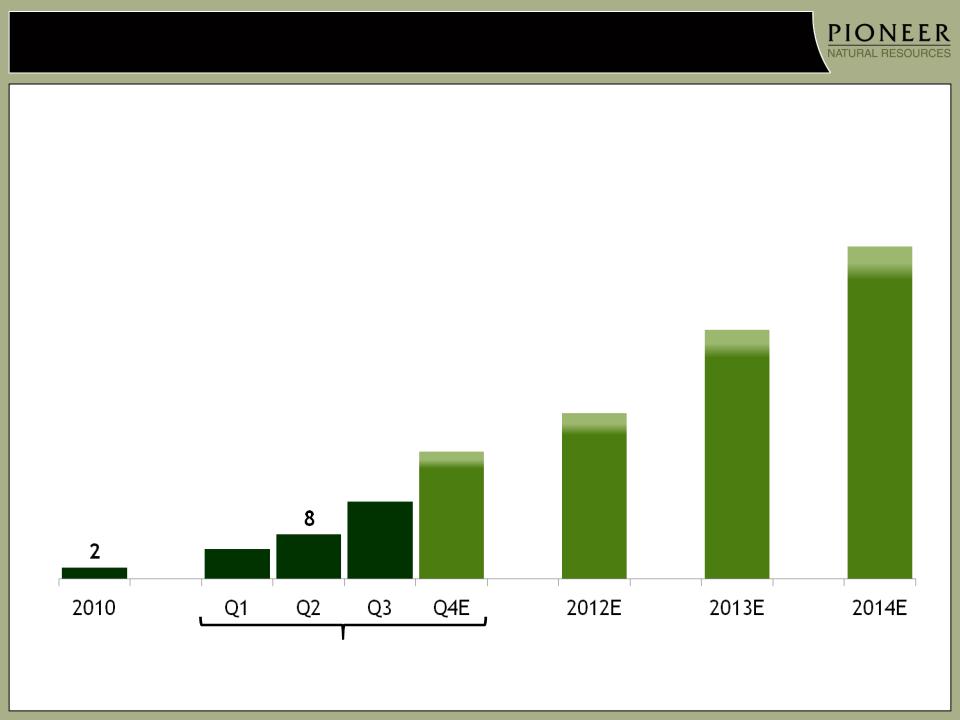
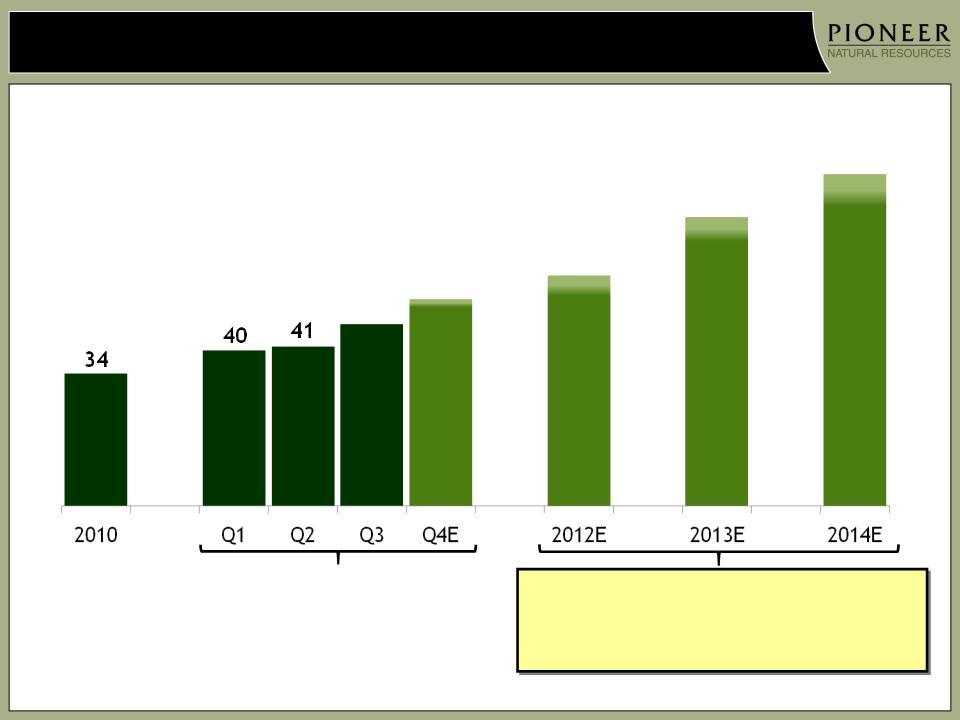
Successfully Growing Eagle Ford Shale Production
23
Eagle Ford Net Production1
(MBOEPD)
(MBOEPD)
26 - 30
40 - 45
5
14
2011E
(expect to be within 12 - 15 MBOEPD FY guidance)
54 - 60
20 - 23
1) Reflects Pioneer’s ~33% share of total gross production
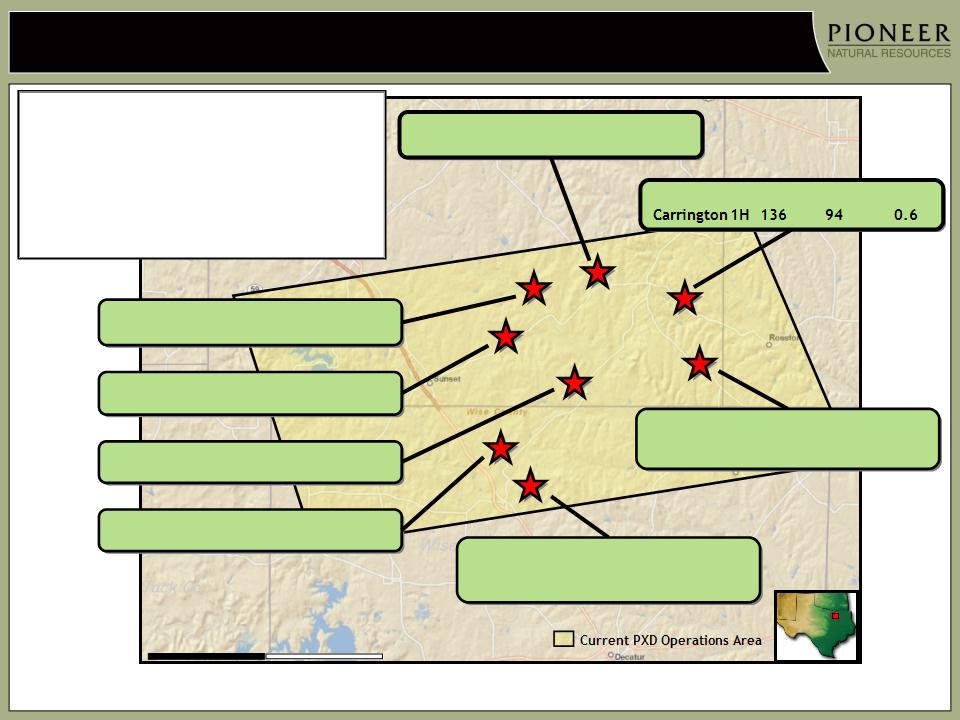
Strong Barnett Shale Combo Well Performance Continued in Q31,2
24
BOPD BNGLPD MMCFPD
BOPD BNGLPD MMCFPD
Moninger 1H 327 16 0.1
BOPD BNGLPD MMCFPD
Steadham A1H 261 122 0.8
BOPD BNGLPD MMCFPD
Morrison 2H 95 149 0.9
BOPD BNGLPD MMCFPD
Proctor 2H 318 17 0.1
1) 7-day IPs
2) NGL volumes estimated with an average NGL yield of 110 BBL/MMCF and 30% shrink
3) Commodity prices of $90/bbl and $5/mcf
§ Current acreage: ~76 M net acres
— >700 drilling locations
§ Running 2 rigs
— Gross well cost: ~$3 MM
— Gross EUR: ~320 MBOE
— Est. Resource: 42% gas, 42% NGLs, 16% oil
— Before tax IRR: ~40%3
§ Lateral length: 3,500 ft - 6,500 ft
BOPD BNGLPD MMCFPD
Greenroy 1H 289 106 1.0
Greenroy 3H 282 119 0.8
BOPD BNGLPD MMCFPD
Alvord 1H 249 109 0.7
Alvord 2H 277 66 0.4
Miles
5
10
0
BOPD BNGLPD MMCFPD
I. Lynch 3H 87 148 1.0
Montague County
Wise County
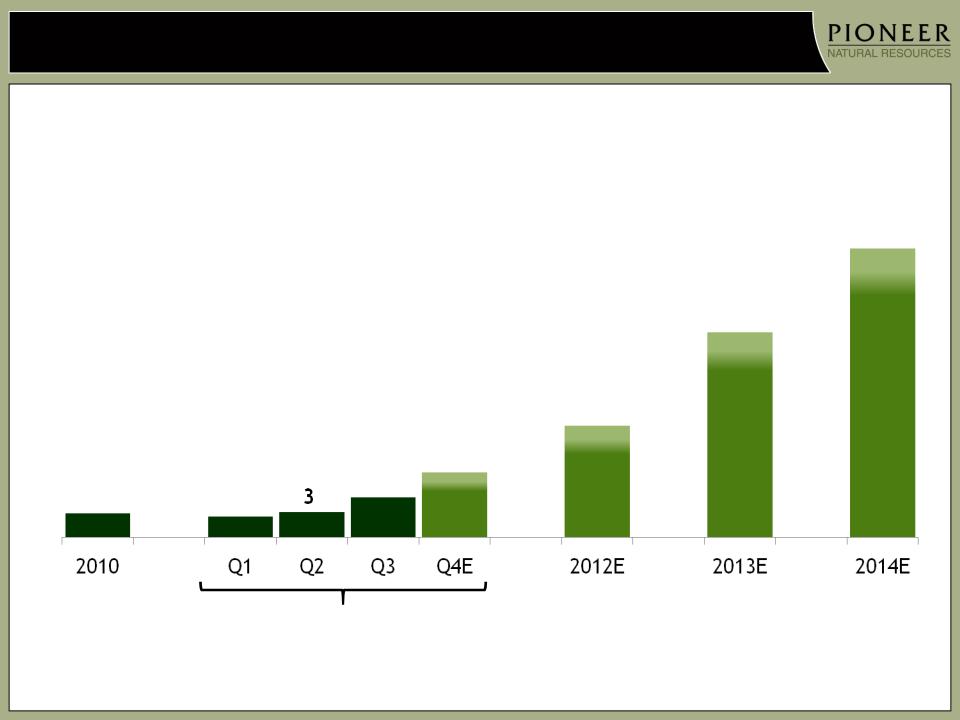
Successfully Growing Barnett Shale Combo Production
25
Barnett Shale Net Production1
(MBOEPD)
(MBOEPD)
9 - 12
18 - 22
2
2011E
(expect to be within 4 - 5
MBOEPD FY guidance)
MBOEPD FY guidance)
3
1) 2010 production reflects legacy Barnett Shale gas production; production growth in 2011 - 2014 driven by Barnett Shale Combo development
4
26 - 31
5 - 7

26
Pioneer’s Vertical Integration Improves Returns and Enhances Execution
Eagle Ford Shale
2 frac fleets
1 coiled tubing units
(adding 2nd unit Q2 2012)
Spraberry
5 frac fleets (~20,000 HP each)
(adding 70,000 HP by mid-2012)
15 drilling rigs
Other service equipment1
Year-End 2011
Total Vertical Integration Investment: $440 MM2
Total Frac Horsepower: 225 M
1) Includes pulling units, frac tanks, hot oilers, water trucks, blowout preventers, construction equipment and fishing tools
2) Includes spending in 2011 for additional frac fleets to be delivered mid-2012
Barnett Shale Combo
1 frac fleet
1 coiled tubing unit
Spraberry Eagle Ford Shale Barnett Shale Combo
Frac Fleets
Current (225,000 HP) 5 2 1
% of Total Wells Fraced ~70% ~65% ~100%
Fracs/Fleet/Year ~115 ~55 ~60
Savings Per Frac1 $0.35 MM $1.70 MM $0.75 MM
Annual Savings2,3 $200 MM $185 MM $45 MM
Rigs and Other Services4
Annual Savings1 $30 MM - -
Total Annualized Cash Savings
At Year-End 2011 Run Rate $230 MM $185 MM $45 MM
Vertical Integration Significantly Reduces Well Costs
27
1) Generally reflects current savings vs. longer-term contract rates
2) Excludes savings from frac fleets scheduled for delivery in mid-2012
3) Includes direct savings to PXD and charges to third-parties
4) Includes 15 rigs and other service equipment including pulling units, frac tanks, hot oilers, water trucks, blowout preventers, construction equipment and fishing tools
5) Includes spending in 2011 for additional frac fleets to be delivered mid-2012
Total Year-End 2011 Vertical Integration Investment: $440 MM5
Total PXD Annualized Year-End 2011 Cash Savings: $460 MM
Additional 70,000 HP frac capacity scheduled for delivery by mid-2012

28
Why Invest In PXD?
Significant Upside Potential From:
§Oil exposure with large drilling inventory
§Aggressive Spraberry & Eagle Ford Shale drilling program
§Extensive horizontal Wolfcamp Shale potential
§18+% compound annual production growth for 2011 - 2014
§~30% compound annual operating cash flow growth for 2011 - 2014
§Strong returns from vertical integration
§Margin protection from attractive derivatives
§Strong balance sheet

Appendix
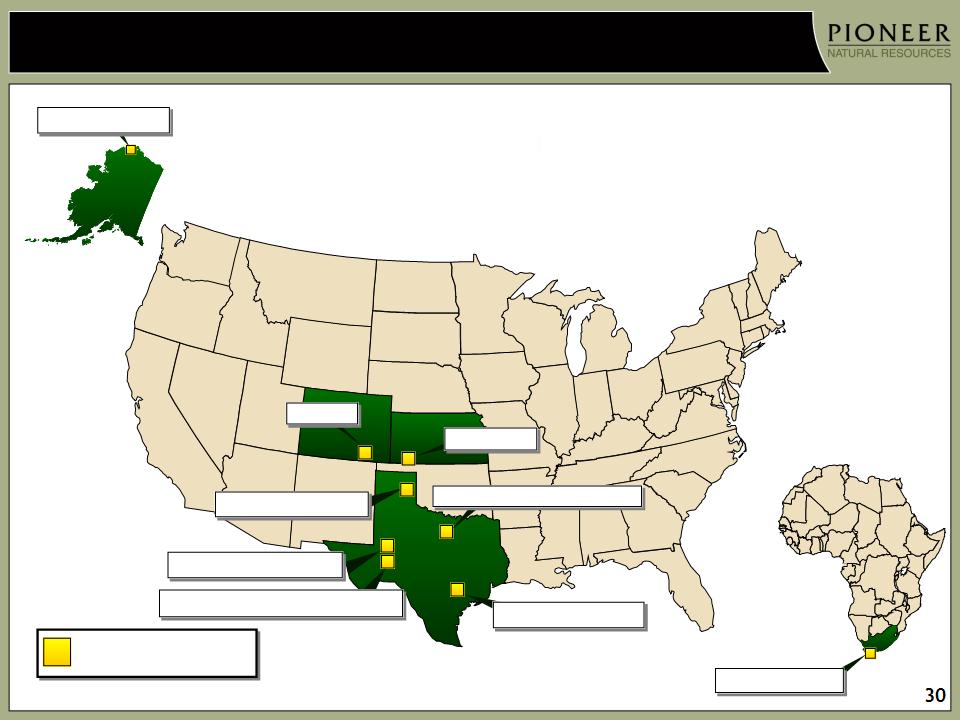
Pioneer Operations
North Slope
South Africa
Eagle Ford Shale
West Panhandle
Raton
Hugoton
Spraberry Vertical
Barnett Shale Combo
Operating Areas
Note: 2010 metrics include Tunisia assets sold Q1 2011; operating cash flow includes $0.4 B attributable to deepwater GOM refunds, insurance recoveries and Tunisia operations.
Horizontal Wolfcamp Shale

31
November Equity Offering Summary
§ PXD believes it is the largest holder of prospective acreage in the horizontal Wolfcamp
Shale play in West Texas with >400 M acres under lease (75% HBP)
Shale play in West Texas with >400 M acres under lease (75% HBP)
− Initial focus will be on >200 M acres in the southern portion of the Spraberry field
§ Equity offering of 5.5 MM shares with net proceeds of $484 MM will allow Pioneer to
expand drilling in the horizontal Wolfcamp Shale play in 2012-2013 while continuing to:
expand drilling in the horizontal Wolfcamp Shale play in 2012-2013 while continuing to:
− Actively develop its 3 high-return, liquids-rich growth assets in Texas
− Maintain its strong balance sheet
§ Expanded horizontal Wolfcamp Shale drilling program in 2012 - 2013 includes:
− Holding ~50 M strategic acres expiring over the next 2 years within >200 M acre initial
focus area (~80 wells required to hold this acreage)
focus area (~80 wells required to hold this acreage)
− Adding infrastructure and bolt-on acreage
§ Horizontal Wolfcamp Shale wells expected to deliver similar IRRs to Spraberry vertical
wells
wells
32
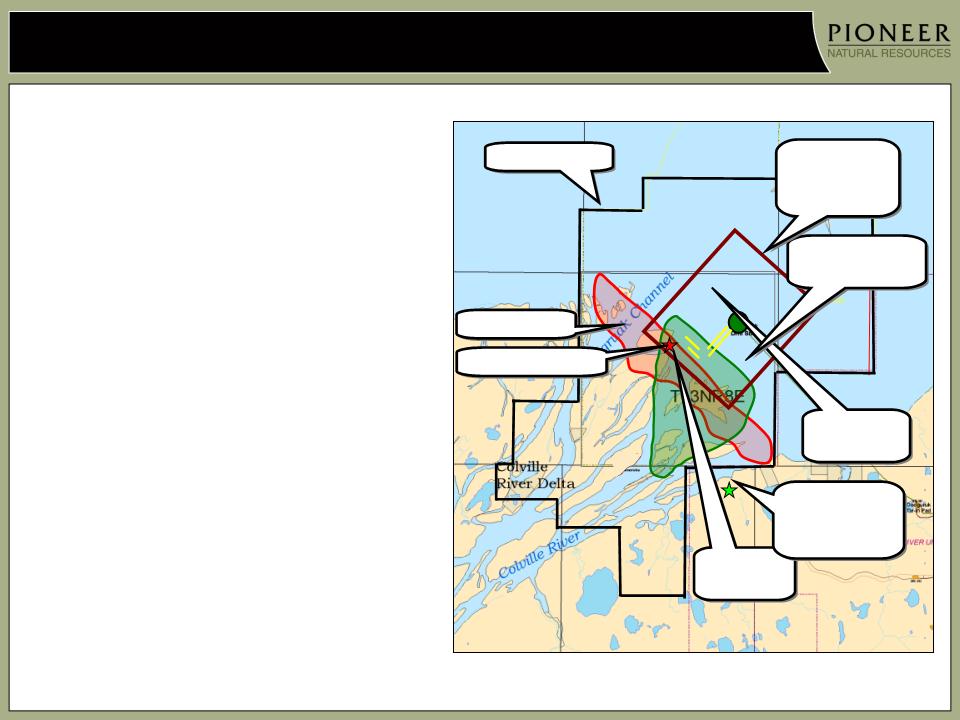
Alaska - Oooguruk
§ 1-rig drilling program continues
targeting Kuparuk and Nuiqsut
intervals
targeting Kuparuk and Nuiqsut
intervals
§ Second rig to test Torok zone and a
deeper Ivishak zone (main
producing zone in Prudhoe Bay)
during current winter drilling
season
deeper Ivishak zone (main
producing zone in Prudhoe Bay)
during current winter drilling
season
Torok
Wells
Wells
Island Drill
Site
Site
Initial
Development
Area
Development
Area
PXD Acreage
Torok
Area
Area
Torok
Onshore Drill
Site
Onshore Drill
Site
Ivishak Drill Site
Ivishak Area

33
Production (MBOEPD)1
|
|
Q3 ’10
|
Q4 ’10
|
Q1 ’11
|
Q2 ’11
|
Q3 ’11
|
|
Spraberry
|
35
|
38
|
40
|
41
|
47
|
|
Raton
|
28
|
28
|
27
|
27
|
27
|
|
Eagle Ford Shale
|
1
|
2
|
5
|
8
|
14
|
|
South Texas
|
9
|
9
|
8
|
8
|
8
|
|
Mid-Continent
|
21
|
20
|
182
|
212
|
19
|
|
Barnett
|
2
|
2
|
2
|
3
|
4
|
|
Alaska
|
7
|
6
|
5
|
5
|
4
|
|
Other U.S.
|
1
|
1
|
2
|
1
|
1
|
|
Total N. America
|
104
|
106
|
107
|
114
|
124
|
|
S. Africa
|
6
|
5
|
4
|
5
|
4
|
|
Total
|
110
|
111
|
111
|
119
|
128
|
1) All periods presented have been restated to exclude discontinued operations
2) ~1 MBPD of NGLs inventoried in Q1 due to third-party fractionator downtime and sold in Q2
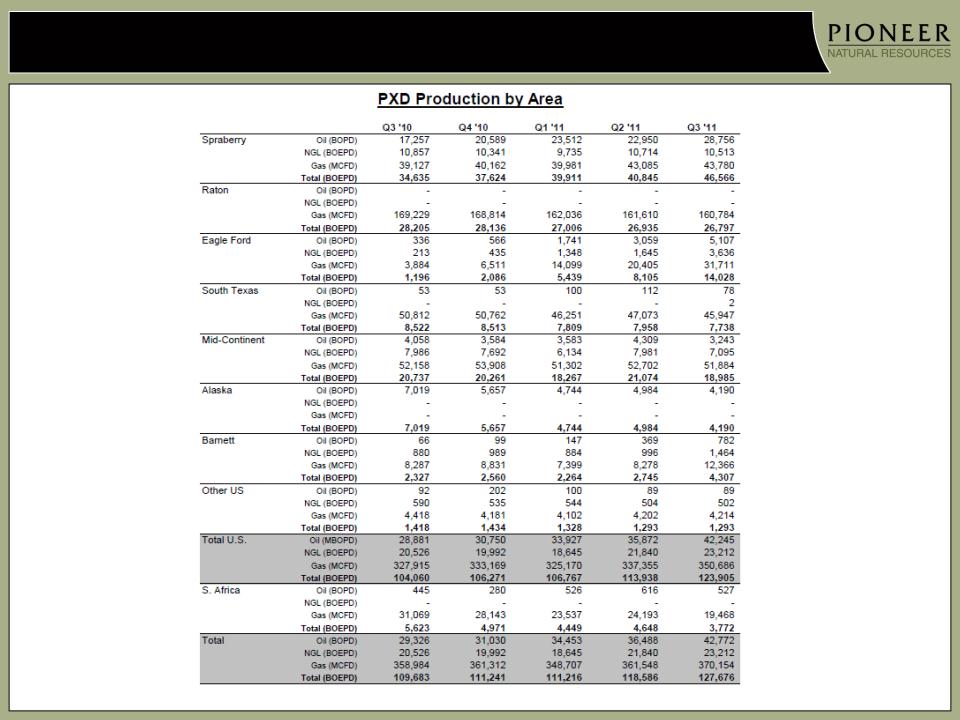
34
Production (MBOEPD)1
1) All periods presented have been restated to exclude discontinued operations
35
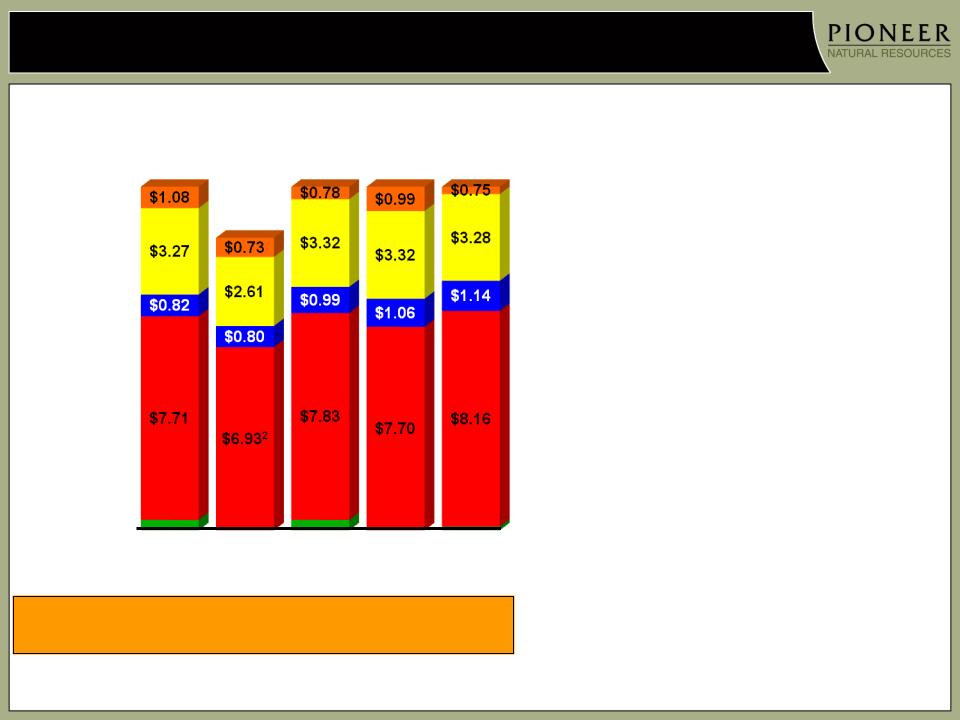
Production Costs (per BOE)1
Production &
Ad Valorem Taxes
Ad Valorem Taxes
VPP-Adjusted3
Workovers
LOE
Third Party
Transportation
Transportation
Q3 ’10
Production Cost
Q1 ’11
Q4 ’10
$12.43
Q3 ’11 vs. Q2 ’11 Comparison
§ Higher LOE primarily due to
increased labor rates and
maintenance costs
increased labor rates and
maintenance costs
§ Higher natural gas processing costs
due primarily to unplanned
downtime and takeaway limitations
at Midkiff / Benedum plants in the
Spraberry field
due primarily to unplanned
downtime and takeaway limitations
at Midkiff / Benedum plants in the
Spraberry field
Natural Gas
Processing
Processing
Q2 ’11
$12.48
1) All periods presented have been restated to exclude discontinued operations
2) Q4 LOE benefited from a non-recurring $10 MM Alaska processing fee recovery (~$1.00/BOE benefit in LOE)
3) See supplemental information slides
$10.33
$0.39
Q3 ’11
($0.13)
$12.88
$0.39
$13.08
$13.27
($0.25)
$0.14
$10.94
$13.31
$12.82
$13.47

36
VPP - Adjusted Production Costs1
Pioneer presents VPP-Adjusted Production Costs (per BOE) to assist
investors in considering the Company’s costs in relation to the total BOEs
(reported sales volumes plus VPP delivered volumes) in connection with
which those costs were incurred. VPP-Production Costs (per BOE) are
calculated as follows:
investors in considering the Company’s costs in relation to the total BOEs
(reported sales volumes plus VPP delivered volumes) in connection with
which those costs were incurred. VPP-Production Costs (per BOE) are
calculated as follows:
Q3 ’10 Q4 ’10 Q1 ’11 Q2 ’11 Q3 ’11
Production costs as reported (thousands) $ 133,757 $ 112,014 $ 133,228 $ 138,319 $ 158,151
Production (MBOE):
As reported 10,091 10,225 10,009 10,791 11,746
VPP deliveries 627 622 338 341 345
VPP-adjusted production 10,718 10,847 10,347 11,132 12,091
Production costs per BOE:
As reported $ 13.27 $ 10.94 $ 13.31 $ 12.82 $ 13.47
VPP-adjusted $ 12.48 $ 10.33 $ 12.88 $ 12.43 $ 13.08
1) All periods presented have been restated to exclude discontinued operations
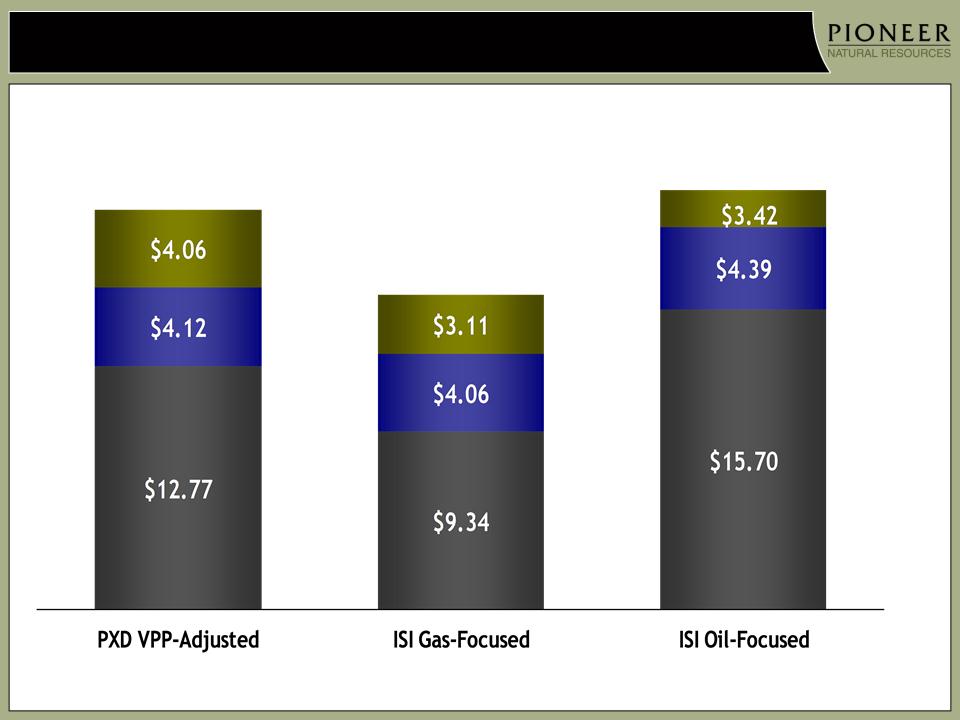
Source: ISI Group
9 Months 2011 Cash Costs ($ / BOE)1
1) Includes production costs, production taxes, G&A (excluding capitalized G&A for full-cost companies), and interest expense
2) ISI group gas-focused companies include APC, CHK, CRK, CRZO, DVN, ECA, EOG, EQT, FST, KOG, KWK, NFX, QEP, ROSE, RRC, SD , SWN & UPL
3) ISI group oil-focused companies include APA, BRY, CXO, DNR, MUR, NBL, PXD, PXP, REXX, SFY, VQ, WLL & XEC
$16.51
G&A
Interest
$20.95
Prod Costs
$23.51
2
3
PXD Cash Costs vs. Peers For First 9 Months of 2011
37

38
1) When NYMEX price is above Call price, PSE receives Call price. When NYMEX price is between Put price and Call price, PSE receives NYMEX price. When NYMEX price is between the
Put price and the Short Put price, PSE receives Put price. When NYMEX price is below the Short Put price, PSE receives NYMEX price plus the difference between the Short Put price and
Put price
2) Represents the weighted average index price of each NGL component price per Bbl
3) Approximate NYMEX price based on differentials to index prices at the date the derivative was entered into
|
Oil
|
2012
|
2013
|
2014
|
|
Swaps (BPD)
|
3,000
|
3,000
|
-
|
|
NYMEX Price ($/BBL)
|
$79.32
|
$81.02
|
-
|
|
Collars (BPD)
|
-
|
-
|
-
|
|
NYMEX Call Price ($/BBL)
|
-
|
-
|
-
|
|
NYMEX Put Price ($/BBL)
|
-
|
-
|
-
|
|
Three-Way Collars (BPD)1
|
1,000
|
1,000
|
4,000
|
|
NYMEX Call Price ($/BBL)
|
$103.50
|
$111.50
|
$124.75
|
|
NYMEX Put Price ($/BBL)
|
$80.00
|
$83.00
|
$90.00
|
|
NYMEX Short Put Price ($/BBL)
|
$65.00
|
$68.00
|
$72.50
|
|
% Oil Production
|
~80%
|
~75%
|
~70%
|
|
Natural Gas Liquids
|
|
|
|
|
Swaps (BPD)
|
750
|
-
|
-
|
|
Blended Index Price ($/BBL)2
|
$35.03
|
-
|
-
|
|
% NGLs Production
|
~45%
|
-
|
-
|
|
Gas
|
|
|
|
|
Swaps (MMBTUPD)
|
5,000
|
2,500
|
-
|
|
NYMEX Price ($/MMBTU)3
|
$6.43
|
$6.89
|
-
|
|
% Gas Production
|
~80%
|
~30%
|
-
|
|
|
|
|
|
|
% Total Production
|
~70%
|
~60%
|
~45%
|
|
|
|
|
|
|
Gas Basis Swaps
|
2012
|
2013
|
2014
|
|
Spraberry (MMBTUPD)
|
2,500
|
2,500
|
-
|
|
Price Differential ($/MMBTU)
|
(0.30)
|
(0.31)
|
-
|
PSE Derivative Position as of 1/4/2012
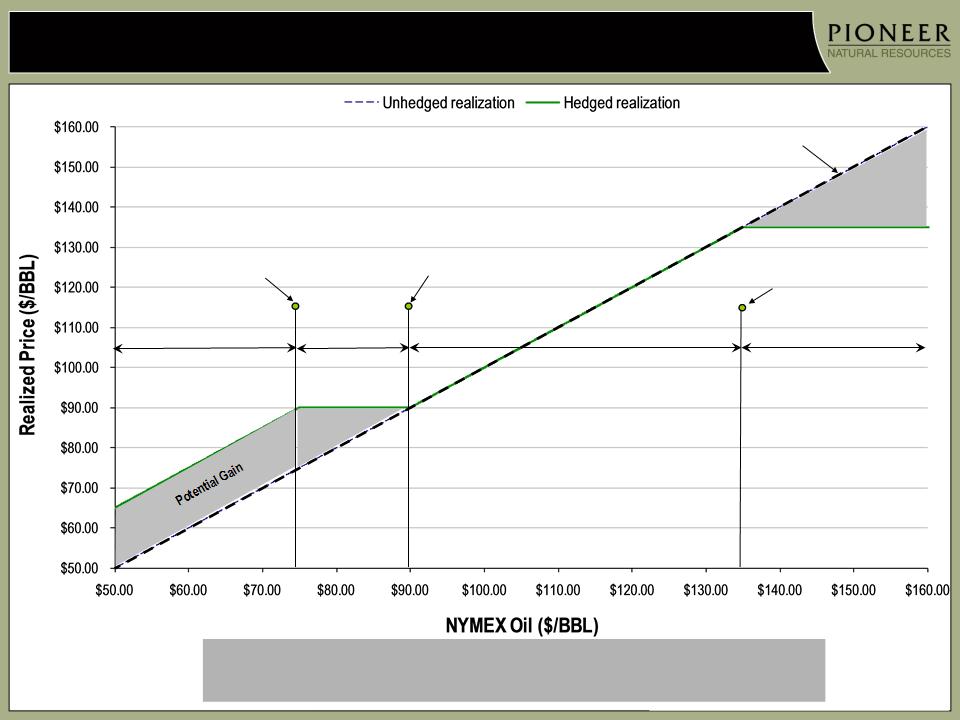
Three-Way Collars ($75 by $90 by $135 example)
Potential
Opportunity Loss
Opportunity Loss
Realize NYMEX price
plus $15/BBL
(difference between long put
and short put)
plus $15/BBL
(difference between long put
and short put)
Realize $90/BBL
Realize NYMEX price
Realize $135/BBL
Short put at $75/BBL
Long put at $90/BBL
Short call at $135/BBL
Realized Price
NYMEX Price
Three way collars protect downside while providing better
upside exposure than traditional collars or swaps
upside exposure than traditional collars or swaps
39
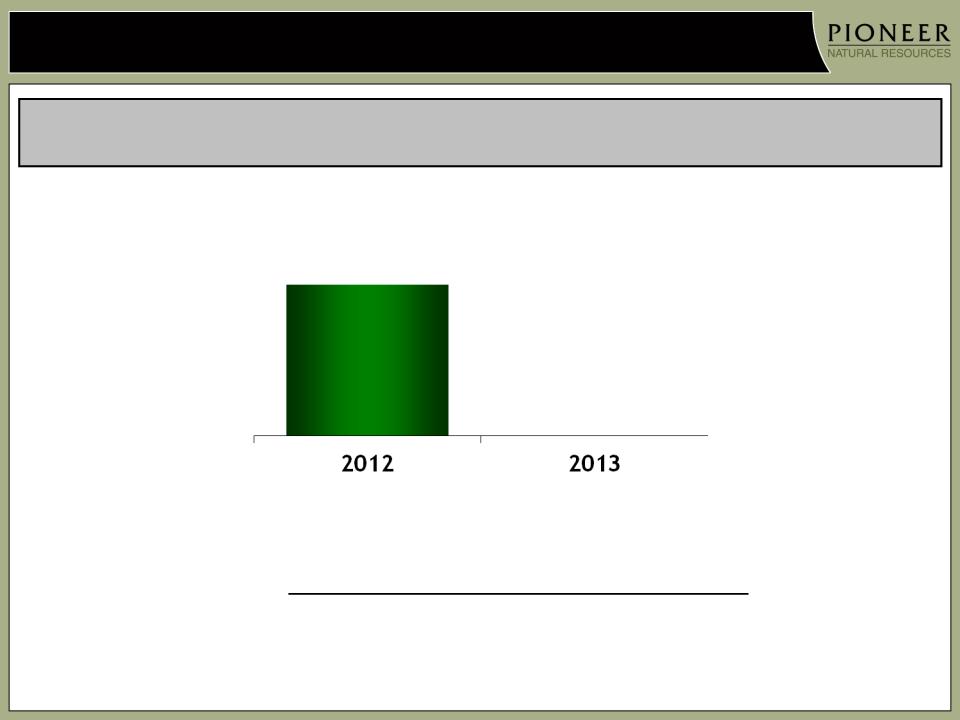
40
VPP Expirations
VPP Oil
Obligation
Obligation
4
MBOEPD
By the end of 2012, the entire VPP commitment will expire and provide
a 4 MBOEPD increase in production with no capital requirement
a 4 MBOEPD increase in production with no capital requirement
(MMBBLS) Q1 Q2 Q3 Q4 Total
2012 0.3 0.3 0.3 0.3 1.2
Schedule of Oil VPP Volumes
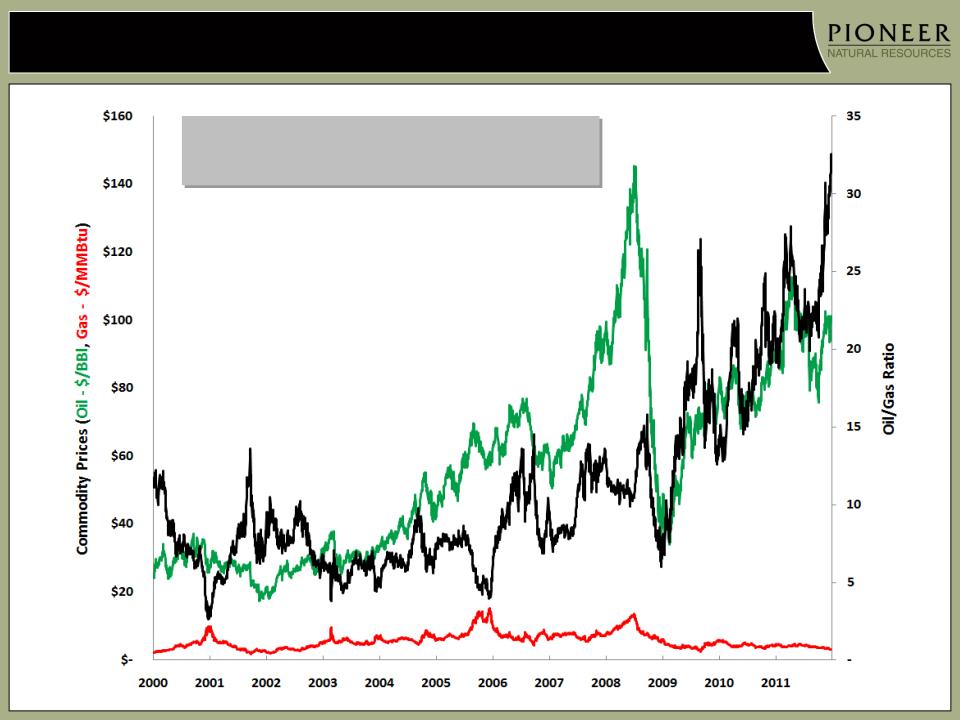
Oil/Gas Ratio Trending Up Since 2006
41
Oil Price
Gas Price
Oil/Gas Ratio
Oil/Gas ratio has increased from
5:1 in 2006 to >25:1 recently
5:1 in 2006 to >25:1 recently

42
Certain Reserve Information
Cautionary Note to U.S. Investors --The U.S. Securities and Exchange Commission (the
"SEC") prohibits oil and gas companies, in their filings with the SEC, from disclosing
estimates of oil or gas resources other than “reserves,” as that term is defined by the
SEC. In this presentation, Pioneer includes estimates of quantities of oil and gas using
certain terms, such as “resource,” “resource potential,” “EUR”, “oil in place” or other
descriptions of volumes of reserves, which terms include quantities of oil and gas that
may not meet the SEC’s definitions of proved, probable and possible reserves, and which
the SEC's guidelines strictly prohibit Pioneer from including in filings with the SEC. These
estimates are by their nature more speculative than estimates of proved reserves and
accordingly are subject to substantially greater risk of being recovered by Pioneer. U.S.
investors are urged to consider closely the disclosures in the Company’s periodic filings
with the SEC. Such filings are available from the Company at 5205 N. O'Connor Blvd.,
Suite 200, Irving, Texas 75039, Attention Investor Relations, and the Company’s website
at www.pxd.com. These filings also can be obtained from the SEC by calling 1-800-SEC-
0330.