Attached files
| file | filename |
|---|---|
| 8-K - TSO 8-K 1-5-2012 - ANDEAVOR | a1-5x2012tso8xk.htm |
| EX-99.1 - PRESS RELEASE - ANDEAVOR | exhibit991pressrelease1-5x.htm |

Deutsche Bank Refining Conference January 2012 Exhibit 99.2

Forward Looking Statements This Presentation includes forward-looking statements within the meaning of the Private Securities Litigation Reform Act of 1995. These statements relate to, among other things, Tesoro's competitive position and competitive advantages; the effects of our multi-year improvement plan; implementation of our supply and trading strategy; implementation of our marketing integration plan; refining throughput, yields and margins; the market outlook, including expectations regarding feedstock costs, differentials, spreads and imports; capital expenditures and the cost, timing and return on capital projects, including expectations regarding incremental EBITDA improvements; cash flows, including projected EBITDA, as well as debt reduction and balance sheet strengths; our growth opportunities; and value and growth opportunities to maximize Tesoro's investment in Tesoro Logistics LP. We have used the words "anticipate", "believe", "could", "estimate", "expect", "intend", "may", "plan", "predict", "project", “should”, "will" and similar terms and phrases to identify forward-looking statements in this Presentation. Although we believe the assumptions upon which these forward-looking statements are based are reasonable, any of these assumptions could prove to be inaccurate and the forward-looking statements based on these assumptions could be incorrect. Our operations involve risks and uncertainties, many of which are outside our control, and any one of which, or a combination of which, could materially affect our results of operations and whether the forward-looking statements ultimately prove to be correct. Actual results and trends in the future may differ materially from those suggested or implied by the forward- looking statements depending on a variety of factors which are described in greater detail in our filings with the SEC. All future written and oral forward-looking statements attributable to us or persons acting on our behalf are expressly qualified in their entirety by the previous statements. We undertake no obligation to update any information contained herein or to publicly release the results of any revisions to any forward-looking statements that may be made to reflect events or circumstances that occur, or that we become aware of, after the date of this Presentation. We have included various estimates of EBITDA and Free Cash Flow, a non-GAAP financial measure, throughout the presentation. These estimates include: EBITDA improvement, EBITDA estimates related to our High Return Capital Program, Tesoro Logistics LP EBITDA Expectations and EBITDA for our commercial operations. Please see Appendix for the definition and reconciliation of these EBITDA estimates. 2

• Positioned in the western United States – Seven refineries – 665,000 barrels per day capacity – Nearly 1,200 retail stations branded Tesoro®, Shell® and USA Gasoline™ – Additional 290 retail stations in 2012 and 2014 • Operate in higher margin markets • Significant refining and marketing integration in key markets • Tesoro Logistics supports integrated value chain; strong growth potential • Access to advantaged crude oil supply About Tesoro Kenai, AK Mandan, ND Salt Lake City, UT Anacortes, WA Martinez, CA Wilmington, CA Kapolei, HI 3

• Operational efficiency and effectiveness – Safety and reliability – System improvements – Cost leadership • Commercial excellence • Financial discipline • Value-driven growth Strategic Priorities 4 Delivering Strategic Priorities creates significant shareholder value

5 Key Messages • Delivered sustainable improvements in 2011; first year of a multi-year plan • Reinvesting 2012 free cash flow into high- return capital projects • Tesoro Logistics creating significant value; strategic vehicle for growth • Strengthening the balance sheet • Pursuing value driven growth opportunities Exceeded delivery of our 2011 improvement plan

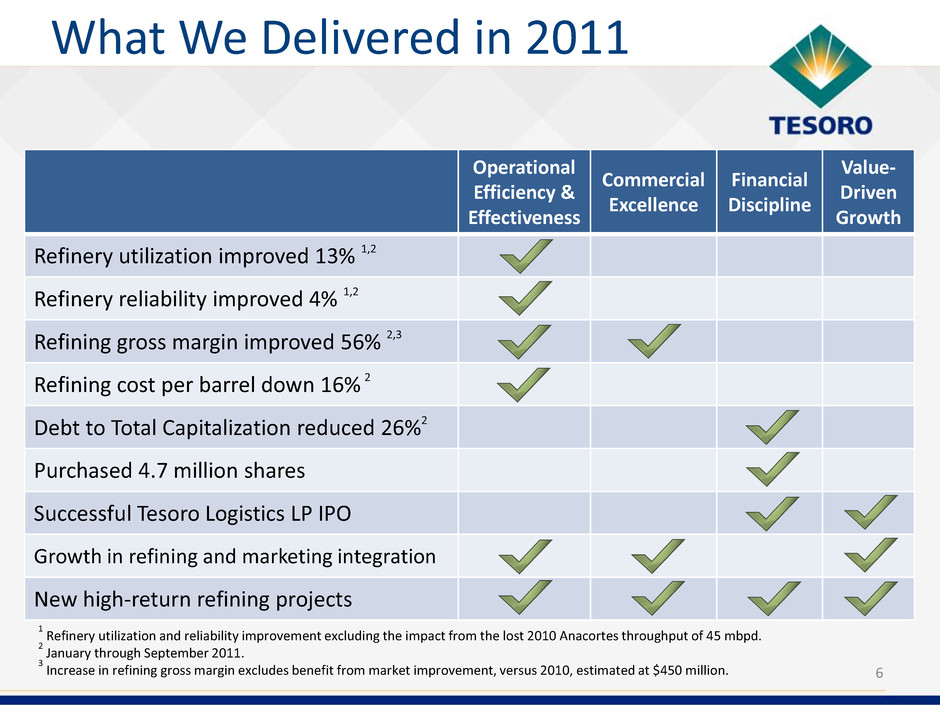
6 What We Delivered in 2011 Operational Efficiency & Effectiveness Commercial Excellence Financial Discipline Value- Driven Growth Refinery utilization improved 13% 1,2 Refinery reliability improved 4% 1,2 Refining gross margin improved 56% 2,3 Refining cost per barrel down 16% 2 Debt to Total Capitalization reduced 26%2 Purchased 4.7 million shares Successful Tesoro Logistics LP IPO Growth in refining and marketing integration New high-return refining projects 1 Refinery utilization and reliability improvement excluding the impact from the lost 2010 Anacortes throughput of 45 mbpd. 2 January through September 2011. 3 Increase in refining gross margin excludes benefit from market improvement, versus 2010, estimated at $450 million.

7 $0.5 $0.4 2009 2010 2011 • YTD Sept EBITDA up over $1.1 billion • Market improvement of $0.4 billion1 • Anacortes impact of nearly $0.2 billion2 • Remaining $0.5 billion: – Refinery utilization increased 13% – Gross margin capture per barrel improved 7% – Direct refining cost per barrel down 16% Strong execution has delivered significant improvement YTD Sept EBITDA ($ in billions) Market Strong 2011 EBITDA Growth $1.5 1 Market improvement calculated based on the year-over-year improvement in the Tesoro Index. 2 Anacortes impact calculated based on nine months ended September 2010 lost throughput of 45 mbpd and year-to-date 2011 PNW Index.

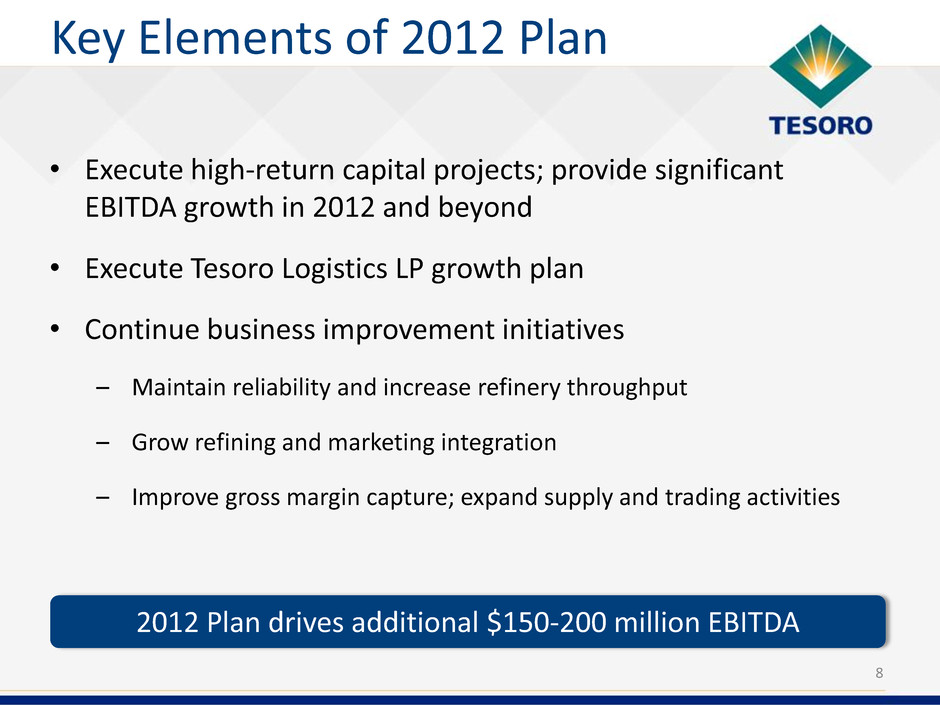
8 Key Elements of 2012 Plan • Execute high-return capital projects; provide significant EBITDA growth in 2012 and beyond • Execute Tesoro Logistics LP growth plan • Continue business improvement initiatives – Maintain reliability and increase refinery throughput – Grow refining and marketing integration – Improve gross margin capture; expand supply and trading activities 2012 Plan drives additional $150-200 million EBITDA

110 300 260 135 2011E 2012E 2013E 2014E Capital and Turnaround Summary 9 2011E 2012E 2013E 2014E Regulatory Maintenance TSO Income TLLP Income Capital Spending $ in millions 320 670 545 430 Increase in high-return growth capital to deliver significant EBITDA Turnaround Spending $ in millions

Income Capital Spend $ in millions • High-return, short payback • Significant incremental EBITDA • Internal rate of return between 20% and 60% on large projects • Sustainable improvements • Investments focused on: – Improving yields – Reducing feedstock costs – Reducing operating costs – Expanding logistics infrastructure 10 110 375 305 245 2011E 2012E 2013E 2014E Large Capital Projects Small Capital Projects Cumulative EBITDA $ in millions High-Return Capital Investments 105 195-205 420-430 485-495 2011E 2012E 2013E 2014E Capital program expected to add greater than $450 million EBITDA beyond 2014 * EBITDA estimate consistent with Tesoro market outlook.

IPO Growth 2013 Public LP Units TSO LP Units TSO GP • Unlocks value of legacy logistics assets • Allows greater capture of total refining and marketing value chain • Strategic growth vehicle with lower cost of capital • Provides diversification of TSO earnings 11 Embedded value within TSO expected to grow substantially Tesoro Logistics LP Tesoro Benefits From TLLP’s Growth TLLP LP + GP Equity Value1 $ in billions $1.4 $0.7 $0.7 $350MM $900MM 1 Expected equity value assumes current public valuation multiples and execution of the 2012 TLLP business plan.

• Driving logistics organic growth – Bakken gathering system expansion – California distribution capabilities – Unit train rail facilities • Volumetric Increases – Marketing integration – Mandan expansion project • Martinez crude oil marine terminal drop-down in 2012 • Third party acquisitions 12 IPO 2012 Growth Initiatives 2013 TLLP EBITDA Expectations, $ million $47 $100 $53 Tesoro Logistics has significant identified growth opportunities Tesoro Logistics LP Growth Opportunities

Exercising Financial Discipline 13 Strong financial position, significant free cash flow in 2013 and beyond (1) 2012 EBITDA forecast based on consensus analyst research estimates as of December 28, 2011. (2) Cumulative EBITDA related to High-Return Capital Program. Assumes 2012 consensus includes prior realization through year end 2012. (3) Cash interest and debt repayment assumes November 2012 retirement of 6 ¼ senior notes due 2012. (4) Estimated cash tax liability based on 2012 Business Plan assumptions and current known Federal and State tax policy. (5) Includes only estimated regulatory and maintenance capital expenditures. 2012E 2013E 2014E 2012 Consensus EBITDA (1) $1,475 $1,475 $1,475 High-Return Capital EBITDA (2) - 225 290 Cash Interest (3) (140) (125) (125) Cash Tax (4) (175) (380) (425) Sustaining Capital (5) (295) (240) (185) Turnaround Spending (300) (260) (135) High-Return Capital (375) (305) (245) Free Cash Flow $190 $390 $650 Debt Repayment (3) (299) - -

14 Summary Strong 2011, well positioned for growth in 2012 and beyond • Exceeding delivery of our 2011 improvement plan • Redeploying free cash flow into high-return capital projects • TLLP creating significant value; a strategic vehicle for growth • Driving fundamental and sustainable improvements in the business • Leveraging strong balance sheet to drive growth * Peer Average includes Valero, HollyFrontier and Sunoco -20% 0% 20% 40% 60% 80% Dec-10 Mar-11 Apr-11 Jun-11 Aug-11 Oct-11 Dec-11 1-Year Share Price Return TSO Peer Average* S&P 500

15 Appendix

105 195-205 420-430 485-495 2011E 2012E 2013E 2014E Base New Small Capital Mandan Los Angeles Anacortes Salt Lake City Income Capital Spend $ in millions 16 110 375 305 245 2011E 2012E 2013E 2014E Large Capital Projects Small Capital Projects Cumulative EBITDA $ in millions High-Return Capital Investments Increased capital deployed in high-return projects * EBITDA estimate consistent with Tesoro market outlook.

17 Non-GAAP Financial Measure * Income tax expense estimates calculated using the nine months ended September 30, 2011 effective tax rate of 38%. 1 When a range of estimated EBITDA has been disclosed, we have included the EBITDA reconciliation for the mid-point of the range. (In millions) Unaudited Actual Nine Months Ended September 30, First Year Estimate1 2009 2010 2011 Los Angeles Yield Improvement Bakken Crude Oil Supply to Anacortes Mandan Refinery Expansion Mandan DDU Expansion Salt Lake City Waxy Crude Project Net Earnings (Loss) $ 39 $ (32 ) $ 670 $ 13.1 $ 21.9 $ 22.5 $ 6.0 $ 58.0 Add (Less) income tax expense (benefit)* 22 (6 ) 415 8.0 13.4 13.8 3.7 35.6 Add interest and financing costs 91 112 139 - - - - - Add depreciation and amortization expense 315 314 312 1.4 2.2 1.2 1.3 6.4 EBITDA $ 467 $ 388 $ 1,536 $ 22.5 $ 37.5 $ 37.5 $ 11.0 $ 100.0 EBITDA represents earnings before interest and financing costs, interest income, income taxes, and depreciation and amortization expense. We present EBITDA because we believe some investors and analysts use EBITDA to help analyze our cash flows including our ability to satisfy principal and interest obligations with respect to our indebtedness and to use cash for other purposes, including capital expenditures. EBTIDA is also used by some investors and analysts to analyze and compare companies on the basis of operating performance and by management for internal analysis and as a component of the fixed charge coverage financial covenant in our credit agreement. EBITDA should not be considered as an alternative to net earnings, earnings before income taxes, cash flows from operating activities or any other measure of financial performance presented in accordance with accounting principles generally accepted in the United States of America. EBITDA may not be comparable to similarly titled measures used by other entities. (In millions) Unaudited High Return Capital Program - Cumulative EBITDA1 2009 2010 2011 Plan 2011 Estimate 2012 Estimate 2013 Estimate 2014 Estimate Net Earnings $ 9.7 $ 43.1 $ 73.5 $ 61.1 $ 119.0 $ 254.1 $ 293.2 Add income tax expense* 5.9 26.4 45.1 37.5 72.9 155.7 179.7 Add interest and financing costs - - - - - - Add depreciation and amortization expense 1.4 2.5 6.4 6.4 8.1 15.2 17.1 EBITDA $ 17.0 $ 72.0 $ 125.0 $ 105.0 $ 200.0 $ 425.0 $ 490.0

18 Non-GAAP Financial Measure (in millions) Unaudited Commercial EBITDA Net Earnings $ 21.7 Add income tax expense* 13.3 Add interest and financing costs - Add depreciation and amortization expense - EBITDA $ 35.0 (In millions) Unaudited TLLP EBITDA (Standalone) Expectations IPO 2012 Growth Initiatives 2013 Run-rate Net Earnings $ 41.5 $ 36.5 $ 79.0 Add interest and financing costs 9.5 5.0 13.5 Add depreciation and amortization expense 2.0 5.5 7.5 EBITDA $ 53.0 $ 47.0 $ 100.0 * Income tax expense estimates calculated using the nine months ended September 30, 2011 effective tax rate of 38%. 1 When a range of estimated EBITDA has been disclosed, we have included the EBITDA reconciliation for the mid-point of the range. (In millions) Unaudited 2012 Regional Improvements1 California Pacific Northwest Mid-Continent Hawaii Total Net Earnings $ 40.5 $ 10.7 $ 27.7 $ 5.9 $ 84.8 Add income tax expense* 24.8 6.5 16.9 3.6 51.8 Add interest and financing costs - - - - - Add depreciation and amortization expense 4.7 2.8 5.4 0.5 13.4 EBITDA $ 70.0 $ 20.0 $ 50.0 $ 10.0 $ 150.0

19 Non-GAAP Financial Measure (In millions) Unaudited Free Cash Flow Reconciliation 2012E 2013E 2014E Net Cash Flow from Operating Activities $ 860 $ 935 $ 1,080 Less Sustaining Capital 295 240 185 Less High Return Capital 375 305 245 Free Cash Flow $ 190 $ 390 $ 650
