Attached files
| file | filename |
|---|---|
| 8-K - FORM 8-K - HollyFrontier Corp | c26476e8vk.htm |
Exhibit 99.1
| HollyFrontier CorporationDeutsche Bank Refining Conference BostonJanuary 2012 |
| 2 HollyFrontier Corporation Disclosure Statement Statements made during the course of this presentation that are not historical facts are "forward- looking statements" within the meaning of the U.S. Private Securities Litigation Reform Act of 1995. Forward-looking statements are inherently uncertain and necessarily involve risks that may affect the business prospects and performance of HollyFrontier Corporation and/or Holly Energy Partners, L.P., and actual results may differ materially from those discussed during the presentation. Such risks and uncertainties include but are not limited to risks and uncertainties with respect to the actions of actual or potential competitive suppliers and transporters of refined petroleum products in HollyFrontier's and Holly Energy Partners' markets, the demand for and supply of crude oil and refined products, the spread between market prices for refined products and market prices for crude oil, the possibility of constraints on the transportation of refined products, the possibility of inefficiencies or shutdowns in refinery operations or pipelines, effects of governmental regulations and policies, the availability and cost of financing to HollyFrontier and Holly Energy Partners, the effectiveness of HollyFrontier's and Holly Energy Partners' capital investments and marketing and acquisition strategies, the possibility of terrorist attacks and the consequences of any such attacks, general economic conditions, and our ability to successfully integrate the business of Holly Corporation and Frontier Oil Corporation and to realize partially or fully the anticipated benefits of our merger of equals with Frontier. Additional information on risks and uncertainties that could affect the business prospects and performance of Holly Frontier and Holly Energy Partners is provided in the most recent reports of HollyFrontier and Holly Energy Partners filed with the Securities and Exchange Commission. All forward-looking statements included in this presentation are expressly qualified in their entirety by the foregoing cautionary statements. HollyFrontier and Holly Energy Partners undertake no obligation to publicly update or revise any forward-looking statements, whether as a result of new information, future events or otherwise. |
| 3 HollyFrontier Corporation |
| Presentation Topics HFC Company OverviewFinancial Performance and CompetitivenessFocused Growth / Improvement OrientationSummaryAppendix 4 |
| The $7 billion strategic combination of Holly and Frontier created the most profitable independent refiner on a per barrel basis(using past 5-year average) in the U.S. with over 440,000 bpd of crude capacity across five complex refineriesExpanded asset footprint increases exposure to high-growth, high-demand Mid-Continent, Rocky Mountain and Southwest refining marketsRefineries are well-positioned for exposure to the growing supply of lower cost domestic and Canadian crude oilAnnual synergies of at least $30 million are expected through reduced SG&A expenses and increased operational efficienciesThe combination provides enhanced financial strength and flexibilitySignificant exposure to best refining margins in the U.S. - WTI based crude economicsCombined balance sheet creates the possibility for cost-of-capital synergies and a stronger corporate credit profileCollaboration with Holly Energy Partners, L.P. provides strategic growth opportunities in logistics and marketing operations Strategic Combination of Most Profitable Refiners 5 |
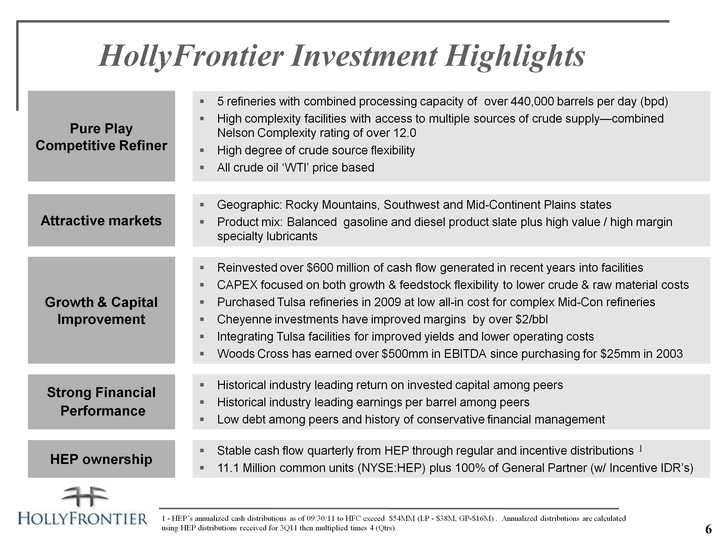
| HollyFrontier Investment Highlights HollyFrontier Investment Highlights 6 1 - HEP's annualized cash distributions as of 09/30/11 to HFC exceed $54MM (LP - $38M, GP-$16M) . Annualized distributions are calculated using HEP distributions received for 3Q11 then multiplied times 4 (Qtrs). 1 |
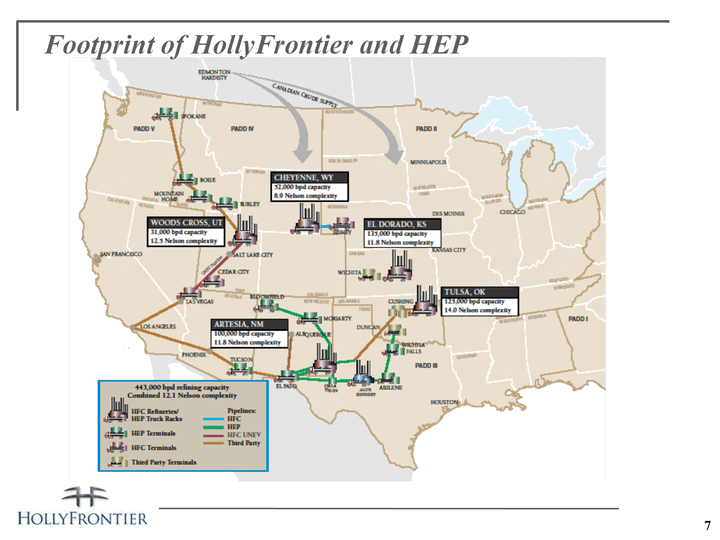
| Footprint of HollyFrontier and HEP 7 |
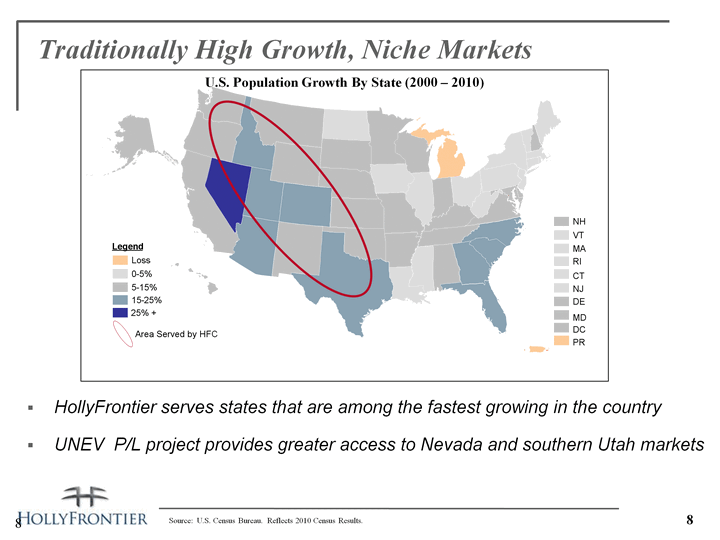
| U.S. Population Growth By State (2000 - 2010) Traditionally High Growth, Niche Markets HollyFrontier serves states that are among the fastest growing in the countryUNEV P/L project provides greater access to Nevada and southern Utah markets Source: U.S. Census Bureau. Reflects 2010 Census Results. 8 8 RI DC Loss 0 - 5% 5 - 15% 15 - 25% 25% + NH VT MA CT NJ DE MD PR Legend Area Served by HFC RI DC Loss 0 - 5% 5 - 15% 15 - 25% 25% + NH VT MA CT NJ DE MD PR Legend Area Served by H |
| Presentation Topics HFC Company OverviewFinancial Performance and CompetitivenessFocused Growth / Improvement OrientationSummaryAppendix 9 |
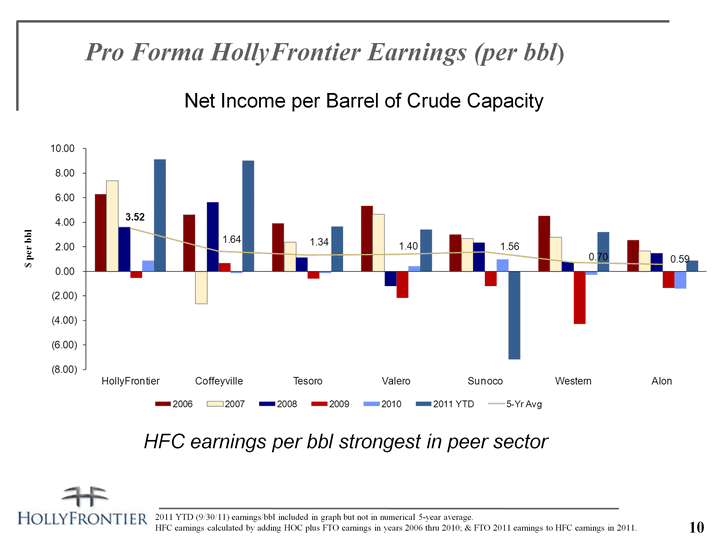
| Pro Forma HollyFrontier Earnings (per bbl) 10 Net Income per Barrel of Crude Capacity $ per bbl HFC earnings per bbl strongest in peer sector 2011 YTD (9/30/11) earnings/bbl included in graph but not in numerical 5-year average.HFC earnings calculated by adding HOC plus FTO earnings in years 2006 thru 2010; & FTO 2011 earnings to HFC earnings in 2011. |
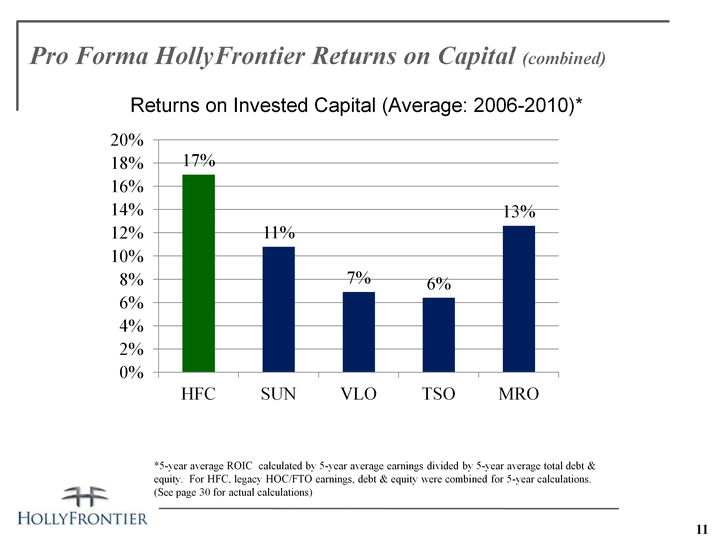
| 11 *5-year average ROIC calculated by 5-year average earnings divided by 5-year average total debt & equity. For HFC, legacy HOC/FTO earnings, debt & equity were combined for 5-year calculations. (See page 30 for actual calculations) 3 4 Pro Forma HollyFrontier Returns on Capital (combined) (CHART) Returns on Invested Capital (Average: 2006-2010)* |
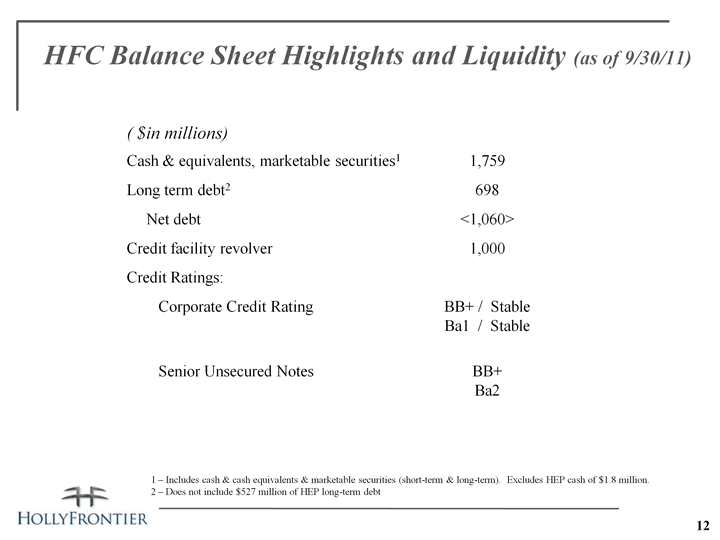
| HFC Balance Sheet Highlights and Liquidity (as of 9/30/11) 1 - Includes cash & cash equivalents & marketable securities (short-term & long-term). Excludes HEP cash of $1.8 million.2 - Does not include $527 million of HEP long-term debt 12 ( $in millions) Cash & equivalents, marketable securities1 1,759 Long term debt2 698 Net debt <1,060> Credit facility revolver 1,000 Credit Ratings: Corporate Credit Rating BB+ / StableBa1 / Stable Senior Unsecured Notes BB+ Ba2 |
| Presentation Topics HFC Company OverviewFinancial Performance and CompetitivenessFocused Growth / Improvement OrientationSummaryAppendix 13 |
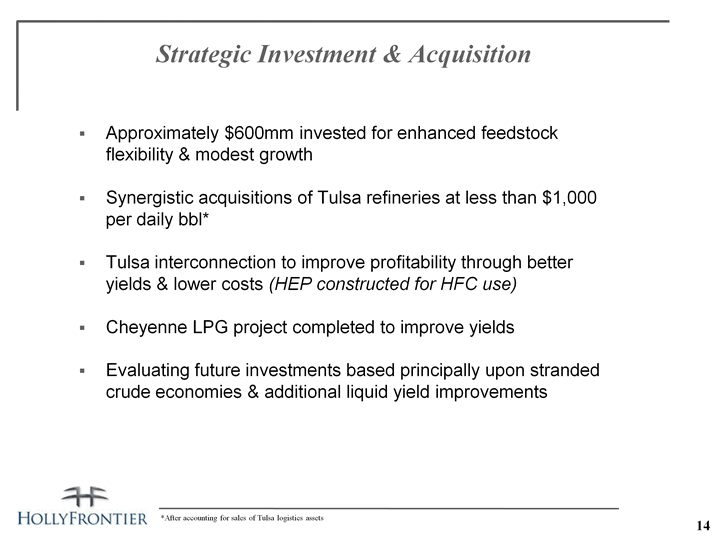
| Strategic Investment & Acquisition Approximately $600mm invested for enhanced feedstock flexibility & modest growthSynergistic acquisitions of Tulsa refineries at less than $1,000 per daily bbl*Tulsa interconnection to improve profitability through better yields & lower costs (HEP constructed for HFC use)Cheyenne LPG project completed to improve yieldsEvaluating future investments based principally upon stranded crude economies & additional liquid yield improvements *After accounting for sales of Tulsa logistics assets 14 |
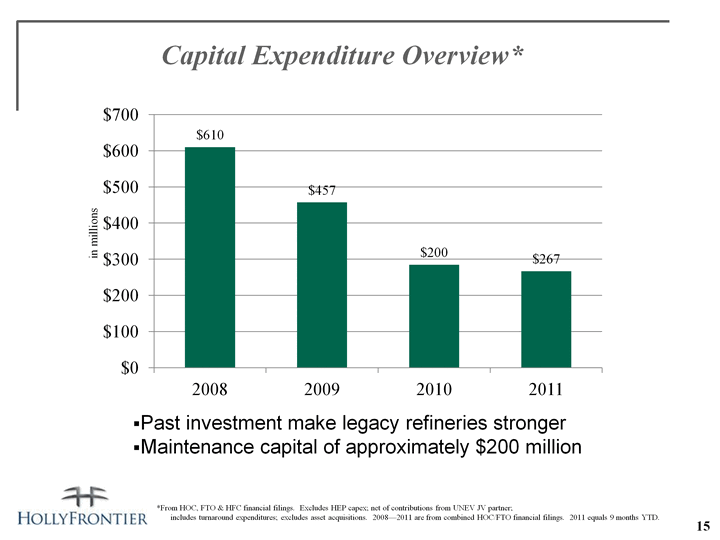
| 15 Capital Expenditure Overview* *From HOC, FTO & HFC financial filings. Excludes HEP capex; net of contributions from UNEV JV partner; includes turnaround expenditures; excludes asset acquisitions. 2008-2011 are from combined HOC/FTO financial filings. 2011 equals 9 months YTD. (CHART) Past investment make legacy refineries strongerMaintenance capital of approximately $200 million in millions |
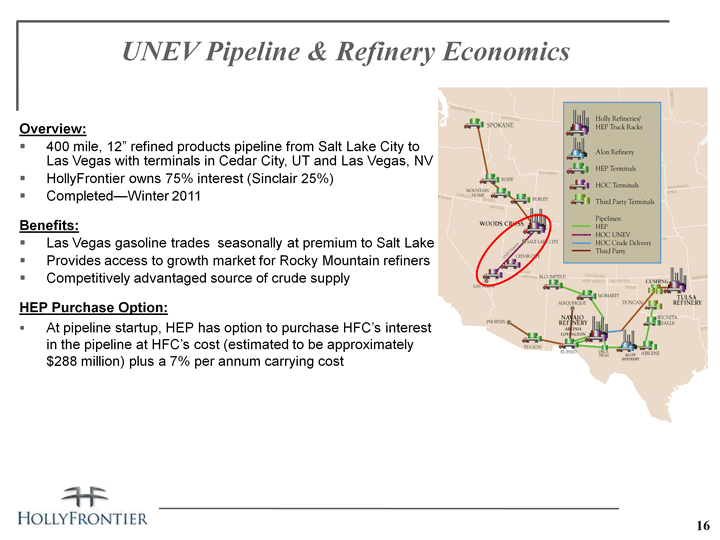
| UNEV Pipeline & Refinery Economics Overview: 400 mile, 12" refined products pipeline from Salt Lake City to Las Vegas with terminals in Cedar City, UT and Las Vegas, NVHollyFrontier owns 75% interest (Sinclair 25%)Completed-Winter 2011Benefits:Las Vegas gasoline trades seasonally at premium to Salt Lake Provides access to growth market for Rocky Mountain refinersCompetitively advantaged source of crude supplyHEP Purchase Option:At pipeline startup, HEP has option to purchase HFC's interest in the pipeline at HFC's cost (estimated to be approximately $288 million) plus a 7% per annum carrying cost 16 |
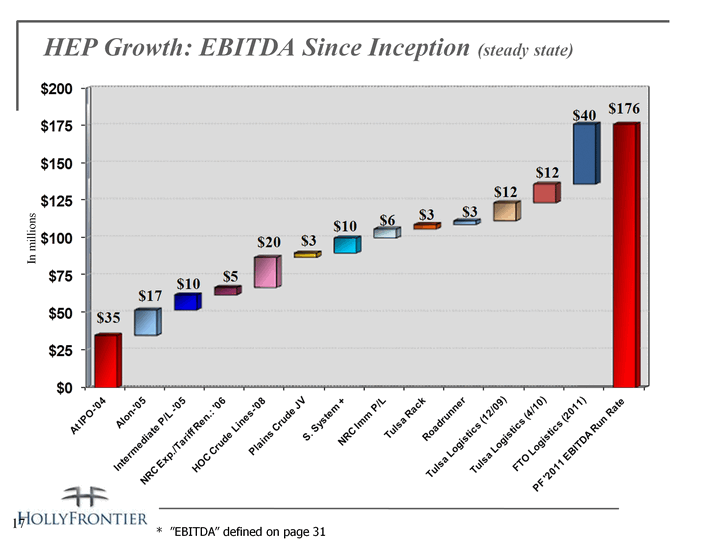
| HEP Growth: EBITDA Since Inception (steady state) 17 * "EBITDA" defined on page 31 In millions |
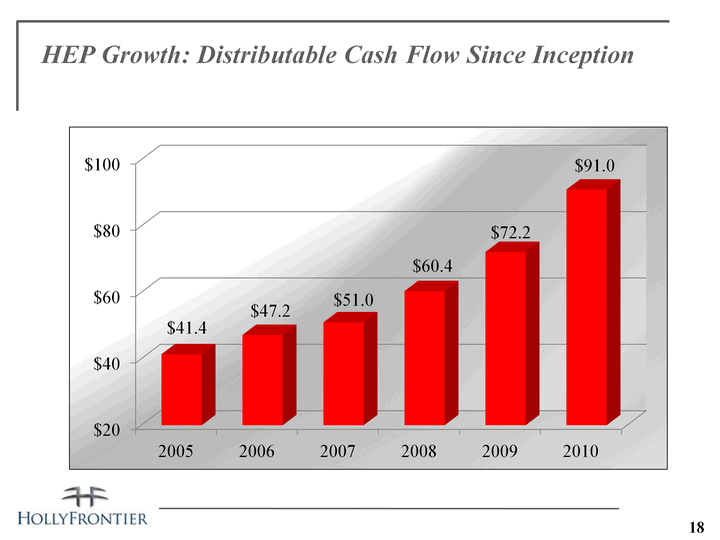
| 18 (CHART) HEP Growth: Distributable Cash Flow Since Inception |
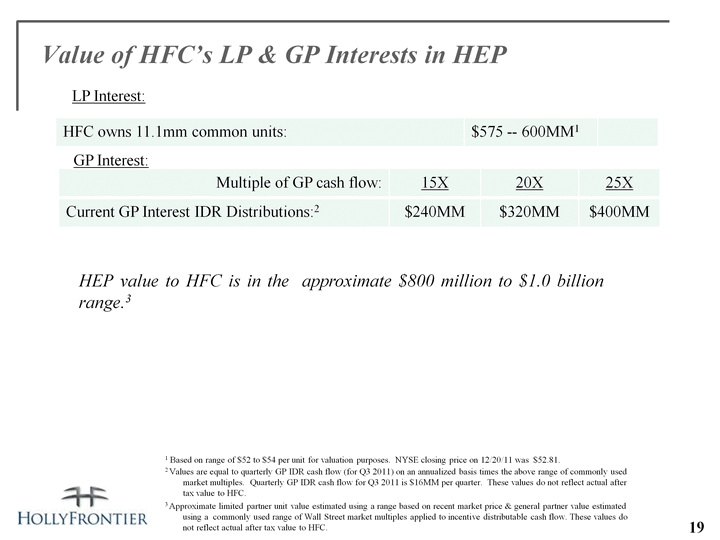
| 19 Value of HFC's LP & GP Interests in HEP HFC owns 11.1mm common units: $575 -- 600MM1 Multiple of GP cash flow: 15X 20X 25X Current GP Interest IDR Distributions:2 $240MM $320MM $400MM HEP value to HFC is in the approximate $800 million to $1.0 billion range.3 1 Based on range of $52 to $54 per unit for valuation purposes. NYSE closing price on 12/20/11 was $52.81.2 Values are equal to quarterly GP IDR cash flow (for Q3 2011) on an annualized basis times the above range of commonly used market multiples. Quarterly GP IDR cash flow for Q3 2011 is $16MM per quarter. These values do not reflect actual after tax value to HFC.3 Approximate limited partner unit value estimated using a range based on recent market price & general partner value estimated using a commonly used range of Wall Street market multiples applied to incentive distributable cash flow. These values do not reflect actual after tax value to HFC. LP Interest: GP Interest: |
| Presentation Topics HFC Company OverviewFinancial Performance and CompetitivenessFocused Growth / Improvement OrientationSummaryAppendix 20 |
| HollyFrontier Key Investment Highlights 21 'Pure Play' Independent RefinerAttractive 'High Margin' MarketsFocused on Continuous Improvement Strong Financial Metrics vs. PeersAdvantaged Logistics via HEP (MLP) |
| HollyFrontier Corporation (NYSE: HFC)2828 N. Harwood, Suite 1300Dallas, Texas 75201(214) 871-3555Neale Hickerson, Vice President, Investor RelationsNeale.hickerson@hollyfrontier.com214-871-3572www.hollyfrontier.com 22 |
| 23 Appendix |
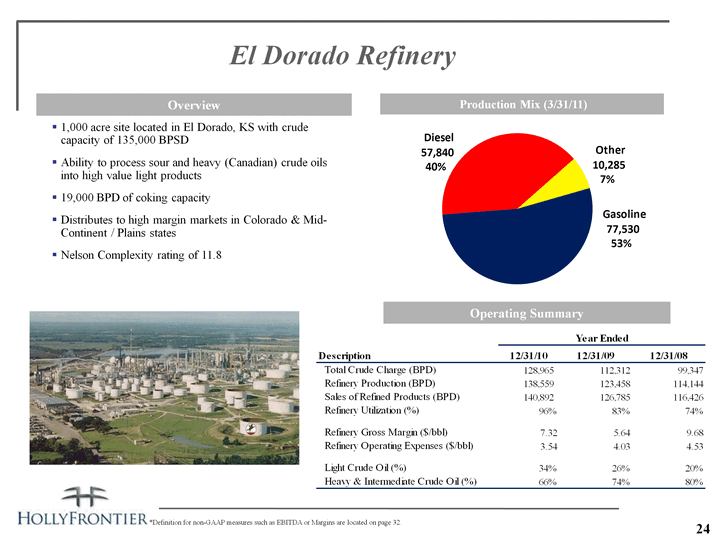
| 24 El Dorado Refinery Production Mix (3/31/11) Overview Operating Summary 1,000 acre site located in El Dorado, KS with crude capacity of 135,000 BPSD Ability to process sour and heavy (Canadian) crude oils into high value light products 19,000 BPD of coking capacityDistributes to high margin markets in Colorado & Mid- Continent / Plains statesNelson Complexity rating of 11.8 *Definition for non-GAAP measures such as EBITDA or Margins are located on page 32. |
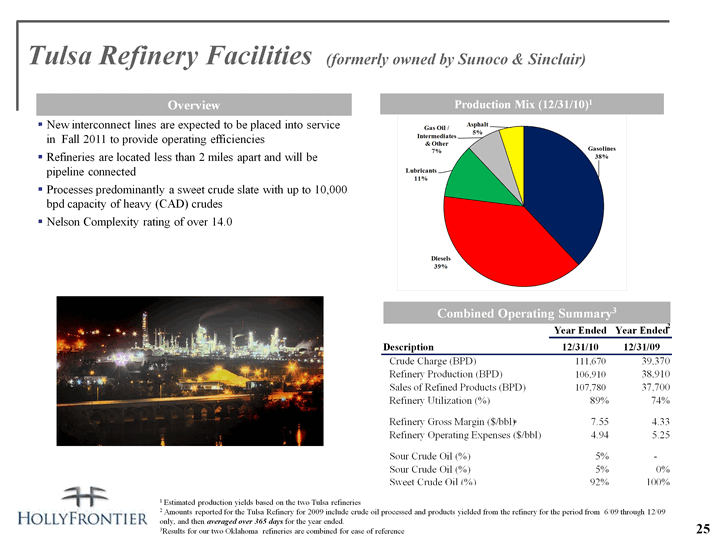
| 25 Tulsa Refinery Facilities (formerly owned by Sunoco & Sinclair) Production Mix (12/31/10)1 Overview New interconnect lines are expected to be placed into service in Fall 2011 to provide operating efficienciesRefineries are located less than 2 miles apart and will be pipeline connectedProcesses predominantly a sweet crude slate with up to 10,000 bpd capacity of heavy (CAD) crudesNelson Complexity rating of over 14.0 Combined Operating Summary3 * 2 1 Estimated production yields based on the two Tulsa refineries2 Amounts reported for the Tulsa Refinery for 2009 include crude oil processed and products yielded from the refinery for the period from 6/09 through 12/09 only, and then averaged over 365 days for the year ended.3Results for our two Oklahoma refineries are combined for ease of reference *Definition for non-GAAP measures such as EBITDA or Margins are located on page 32. |
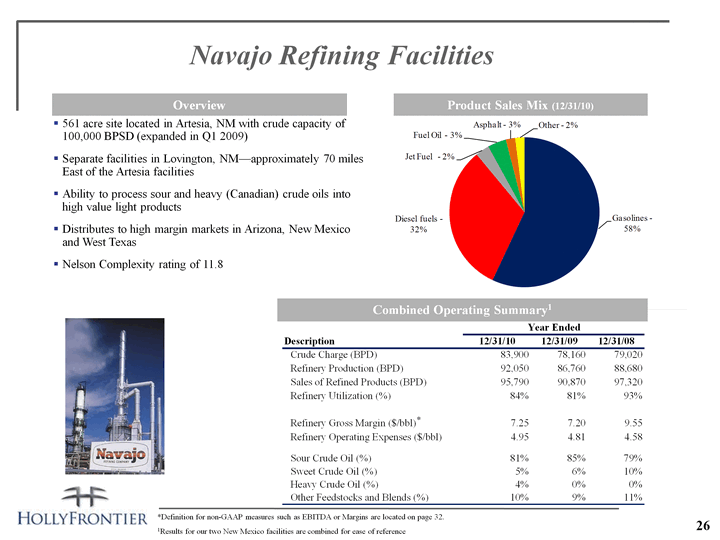
| Navajo Refining Facilities Product Sales Mix (12/31/10) Overview 561 acre site located in Artesia, NM with crude capacity of 100,000 BPSD (expanded in Q1 2009)Separate facilities in Lovington, NM-approximately 70 miles East of the Artesia facilitiesAbility to process sour and heavy (Canadian) crude oils into high value light products Distributes to high margin markets in Arizona, New Mexico and West TexasNelson Complexity rating of 11.8 Combined Operating Summary1 *Definition for non-GAAP measures such as EBITDA or Margins are located on page 32.1Results for our two New Mexico facilities are combined for ease of reference * 26 |
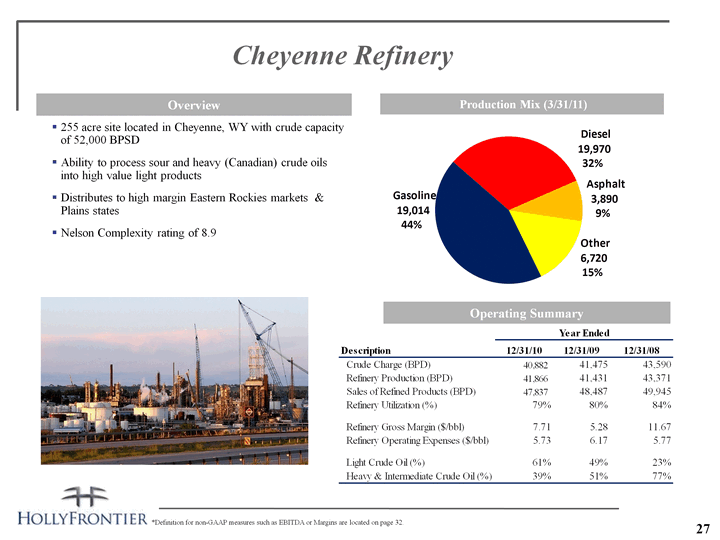
| 27 Cheyenne Refinery Production Mix (3/31/11) Overview Operating Summary 255 acre site located in Cheyenne, WY with crude capacity of 52,000 BPSD Ability to process sour and heavy (Canadian) crude oils into high value light products Distributes to high margin Eastern Rockies markets & Plains statesNelson Complexity rating of 8.9 *Definition for non-GAAP measures such as EBITDA or Margins are located on page 32. |
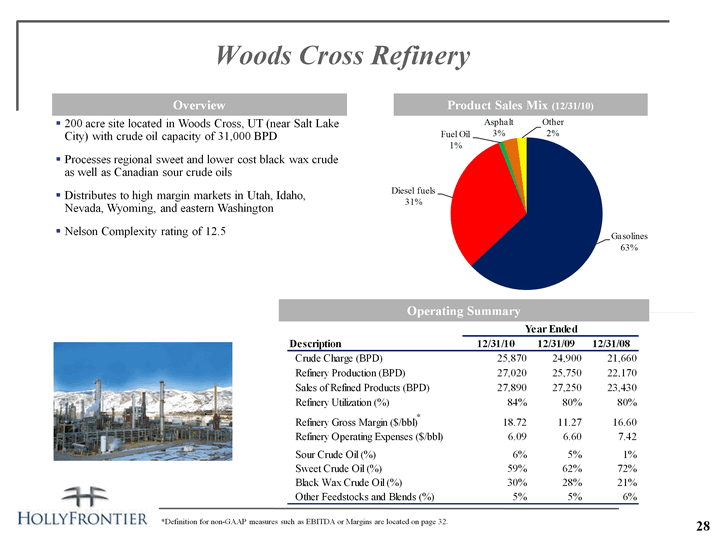
| Woods Cross Refinery Product Sales Mix (12/31/10) Overview 200 acre site located in Woods Cross, UT (near Salt Lake City) with crude oil capacity of 31,000 BPDProcesses regional sweet and lower cost black wax crude as well as Canadian sour crude oils Distributes to high margin markets in Utah, Idaho, Nevada, Wyoming, and eastern WashingtonNelson Complexity rating of 12.5 Operating Summary * *Definition for non-GAAP measures such as EBITDA or Margins are located on page 32. 28 |
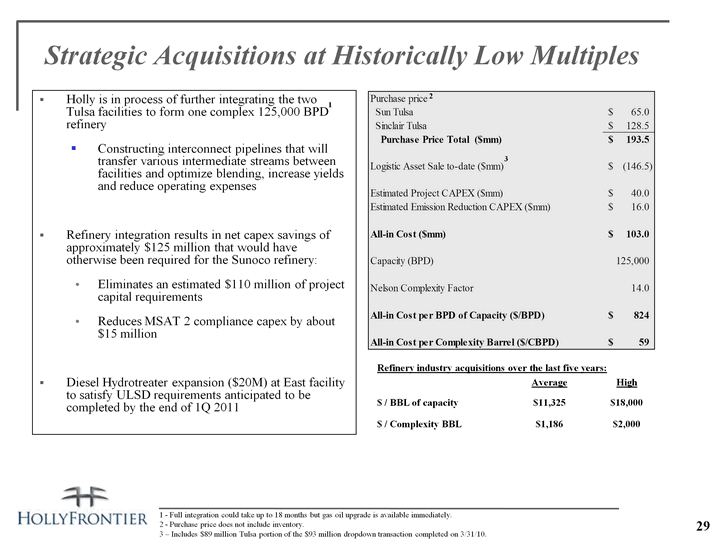
| 29 Holly is in process of further integrating the two Tulsa facilities to form one complex 125,000 BPD refineryConstructing interconnect pipelines that will transfer various intermediate streams between facilities and optimize blending, increase yields and reduce operating expensesRefinery integration results in net capex savings of approximately $125 million that would have otherwise been required for the Sunoco refinery:Eliminates an estimated $110 million of project capital requirementsReduces MSAT 2 compliance capex by about $15 millionDiesel Hydrotreater expansion ($20M) at East facility to satisfy ULSD requirements anticipated to be completed by the end of 1Q 2011 Strategic Acquisitions at Historically Low Multiples 1 - Full integration could take up to 18 months but gas oil upgrade is available immediately.2 - Purchase price does not include inventory.3 - Includes $89 million Tulsa portion of the $93 million dropdown transaction completed on 3/31/10. $2,000 $1,186 $ / Complexity BBL $18,000 $11,325 $ / BBL of capacity High Average Refinery industry acquisitions over the last five years: 2 3 1 |
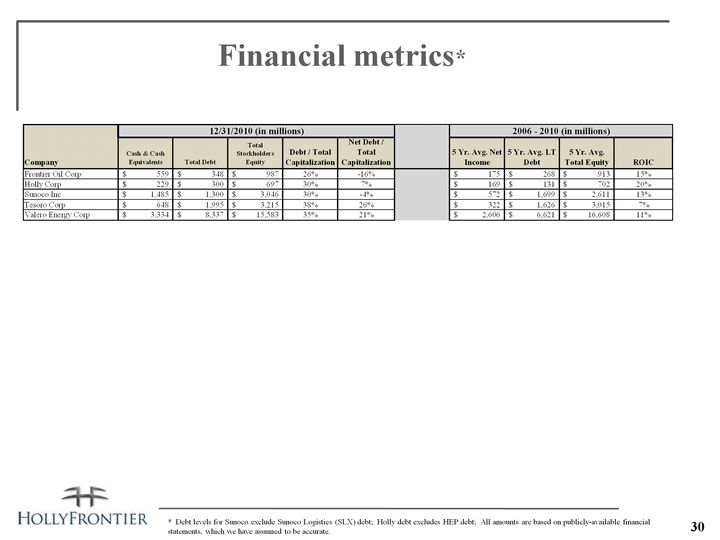
| Financial metrics* 30 * Debt levels for Sunoco exclude Sunoco Logistics (SLX) debt; Holly debt excludes HEP debt; All amounts are based on publicly-available financial statements, which we have assumed to be accurate. |
| 31 Definitions Non GAPP measurements: We report certain financial measures that are not prescribed or authorized by U. S. generally accepted accounting principles ("GAAP"). We discuss management's reasons for reporting these non-GAAP measures below. Although management evaluates and presents these non-GAAP measures for the reasons described below, please be aware that these non-GAAP measures are not alternatives to revenue, operating income, income from continuing operations, net income, or any other comparable operating measure prescribed by GAAP. In addition, these non-GAAP financial measures may be calculated and/or presented differently than measures with the same or similar names that are reported by other companies, and as a result, the non-GAAP measures we report may not be comparable to those reported by others.Refining gross margin or refinery gross margin: the difference between average net sales price and average costs of products per barrel of produced refined products. This does not include the associated depreciation, depletion and amortization costs. Refining gross margin or refinery gross margin is a non-GAAP performance measure that is used by our management and others to compare our refining performance to that of other companies in our industry. This margin does not include the effect of depreciation, depletion and amortization. Other companies in our industry may not calculate this performance measure in the same manner. Our historical refining gross margin or refinery gross margin is reconciled to net income under "Reconciliation to Amounts Reported Under Generally Accepted Accounting Principles" of Holly Corporation's 2009 10-K filed February 26, 2010.Net Operating Margin: Net operating margin is a non-GAAP performance measure that is used by our management and others to compare our refining performance to that of other companies in our industry. This margin does not include the effect of depreciation, depletion and amortization. Other companies in our industry may not calculate this performance measure in the same manner. Our historical net operating margin is reconciled to net income under "Reconciliation to Amounts Reported Under Generally Accepted Accounting Principles" of Holly Corporation's 2009 10-K filed February 26, 2010.EBITDA: Earnings before interest, taxes, depreciation and amortization, which we refer to as EBITDA, is calculated as net income plus (i) interest expense net of interest income, (ii) income tax provision, and (iii) depreciation, depletion and amortization. EBITDA is not a calculation provided for under accounting principles generally accepted in the United States; however, the amounts included in the EBITDA calculation are derived from amounts included in our consolidated financial statements. EBITDA should not be considered as an alternative to net income or operating income as an indication of our operating performance or as an alternative to operating cash flow as a measure of liquidity. EBITDA is not necessarily comparable to similarly titled measures of other companies. EBITDA is presented here because it is a widely used financial indicator used by investors and analysts to measure performance. EBITDA is also used by our management for internal analysis and as a basis for financial covenants. Our historical EBITDA is reconciled to net income under "Reconciliation to Amounts Reported Under Generally Accepted Accounting Principles" of Holly Corporation's 2010 10-K filed February 25, 2011.Debt-To-Capital: A measurement of a company's financial leverage, calculated as the company's long term debt divided by its total capital. Debt includes all long-term obligations. Total capital includes the company's debt and shareholders' equity. 5 Year Return on Invested Capital: A measurement which for our purposes is calculated using the 5 year average Net Income divided by the sum of the 5 year average of Total Equity and Long Term Debt. We consider ROIC to be a meaningful indicator of our financial performance, and we evaluate this metric because it measures how effectively we use the money invested in our operations.IDR: Incentive Distribution RightsBPD: the number of barrels per calendar day of crude oil or petroleum products.BPSD: the number of barrels per stream day of crude oil or petroleum products.MMSCFD: million standard cubic feet per day.Gas Oil Hydrocracker: a refinery unit which uses catalyst at high pressure and temperature and in the presence of hydrogen to convert high boiling point hydrocarbons to light transportation fuels and low sulfur FCC feedstock.Solvent deasphalter / residuum oil supercritical extraction ("ROSE"): a refinery unit that uses a light hydrocarbon like propane or butane to extract non asphaltene heavy oils from asphalt or atmospheric reduced crude. These deasphalted oils are then further converted to gasoline and diesel in the FCC process. The remaining asphaltenes are either sold, blended to fuel oil or blended with other asphalt as a hardener.. |
