Attached files
| file | filename |
|---|---|
| 8-K - FORM 8-K - PATHEON INC | d269997d8k.htm |
| EX-99.1 - PRESS RELEASE - PATHEON INC | d269997dex991.htm |
 December
2011 Exhibit 99.2
Patheon Fiscal 2011 Results |
 2
This
presentation
contains
forward-looking
statements
or
information
which
reflect
our
expectations
regarding
possible
events,
conditions, our future growth, results of operations, performance, and business prospects and
opportunities. All statements, other than statements of historical fact, are
forward-looking statements. Forward-looking statements necessarily involve
significant known and unknown risks, assumptions and uncertainties that may cause our
actual results in future periods to differ materially from those expressed or implied
by such forward-looking statements. These risks are described in our Registration Statement on
Form 10, as amended, and our other filings with the U.S. Securities and Exchange Commission
and with the Canadian Securities Administrators. Accordingly, you are cautioned not to
place undue reliance on forward-looking statements. These forward-looking
statements are made as of the date hereof, and except as required by law, we assume no
obligation to update or revise them to reflect new events or circumstances.
Use of Non-GAAP Financial Measures
References “Adjusted EBITDA”
are to income (loss) before discontinued operations before repositioning expenses, interest
expense, foreign exchange losses reclassified from other comprehensive income,
refinancing expenses, gains and losses on sale of fixed assets, gain on extinguishment
of debt, income taxes, asset impairment charge, depreciation and amortization and other
income and expenses. Since Adjusted EBITDA is a non-GAAP measure that does not have
a standardized meaning, it may not be comparable to similar measures presented by other
issuers. Readers are cautioned that these non-GAAP measures should not be
construed as alternatives to net income (loss) determined in accordance with GAAP as
indicators of performance. Adjusted
EBITDA is used by management as an internal measure of profitability.
The company has included these measures because it
believes that this information is used by certain investors to assess its financial
performance, before non-cash charges and certain costs that the company does not
believe are reflective of its underlying business. An Adjusted EBITDA reconciliation of
these amounts to the closest Canadian GAAP measure is included in the
appendix.
Forward-Looking Statements |
    3
3
•
2011 Financial Results
•
Transformation Results
•
Q&A
Agenda |
 4
Fiscal 2011 Results |
 5
Fiscal 2011 Results
Full Year 2011 Summary
•Revenues
for fiscal 2011 for Commercial Manufacturing were $572.6m up from
$545.3m for fiscal 2010. Adjusted EBITDA for
Commercial Manufacturing segment was $80.0m
up from $72.3m for fiscal 2010.
•Revenues
for fiscal 2011 for Pharmaceutical Development Services were $127.4m up from
$125.9m for fiscal 2010. Adjusted EBITDA for
the PDS segment was $29.9m vs. $46.8m for
fiscal 2010.
4
th
Quarter
Summary
•
Revenues for Q4 for Commercial
Manufacturing were $146.8m up from
$144.8m in the same period last year. Adjusted
EBITDA for Commercial Manufacturing segment
was $15.9m down from $26.6m in the same
period last year.
•Revenues
for Q4 in Pharmaceutical Development Services were $34.8m up from $33.0m in the
same period last year. Adjusted EBITDA for the
PDS segment was $9.9m vs. $11.0m in the same
period last year.
•
SG&A for Q4 was $35.9m up from $28.5m for
same period last year due primarily to higher
consulting fees for strategic initiatives. |
 6
Select Financial Data
This includes $32.9 M in 1Q11 and $17.5 M in 2Q11 related to deferred revenue and a reservation
fee from an amended manufacturing supply agreement in the UK
Quarterly results for fiscal 2011
Q1 2011
Q2 2011
Q3 2011
Q4 2011
2011
(in millions of U.S. dollars)
$
$
$
$
$
Revenues
175.7
170.0
172.7
181.6
700.0
Cost of goods sold
132.7
138.0
145.3
145.9
561.9
Gross profit
43.0
32.0
27.4
35.7
138.1
Selling, general and administrative expenses
27.8
24.8
31.7
35.9
120.2
Operating income (loss)
14.3
6.5
(6.2)
(3.7)
10.9
Income (loss) before discontinued operations
0.7
(11.1)
(0.5)
(5.3)
(16.2)
Adjusted EBITDA
29.5
14.3
11.9
17.3
73.0
|
 7
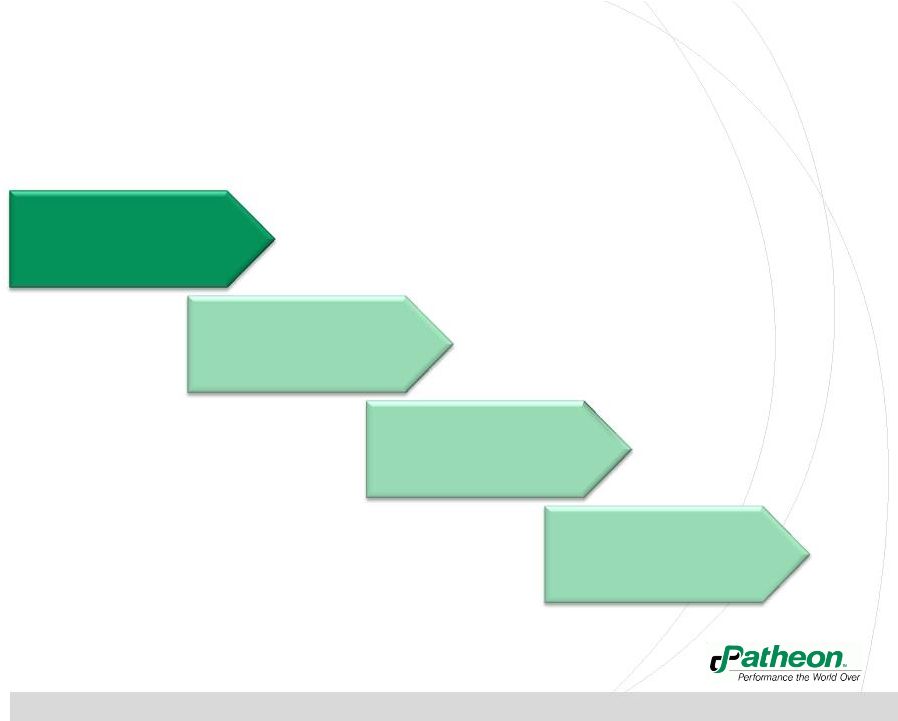
Our strategy will be executed across four elements
Our strategy is executed across four elements
Element I
Strengthen core
operations
Element II
Sell business
differently
Element III
Enter adjacencies
Element IV
Drive industry
consolidation |
 8
Operating
System
Mindsets,
Capabilities
& Behaviors
Management
Infrastructure
The formal
structures, processes
and systems through
which the operating
system is managed
to deliver the
business objectives
The way
physical assets
and resources
are configured
and optimized to
create value and
minimize losses
The way people think, feel and
conduct themselves in the
workplace, both individually and
collectively
Strengthen our core operations |
 9
•Right First Time (Reduced
Overtime)
•Operational Flow Efficiencies
& Output per Employee (ex.
lab testing)
•Improved Planning Process
•Decreased Labor Costs
•Increased Capacity (de-
creased bottlenecks)
•Increased throughput due
to labor efficiencies
•Develop Strategic Client
Relationships
•Improved Right First Time
•Reduce Inventory Write Offs
•Reduce Working Capital
Strengthen our Core: Operational Effectiveness
Increased
Margins
& Improved
Adjusted
EBITDA
“Rigorous
Transformation
Efforts focused on
expanding Revenue
Opportunities,
Increasing Operating
Margins, and
Improving Quality”
Wave 1
Diag.
Wave 1
Diag.
Diag.
Adjacent Areas
Wave 1
Diag.
Adjacent Areas
Wave 1
Diag.
Adjacent Areas
Wave 1
Rest of Sites
Italy
Cincinnati
Puerto Rico
Canada
Adjacent Areas
2Q11
3Q11
4Q11
1Q12
2Q12
Adjacent Areas |
 10
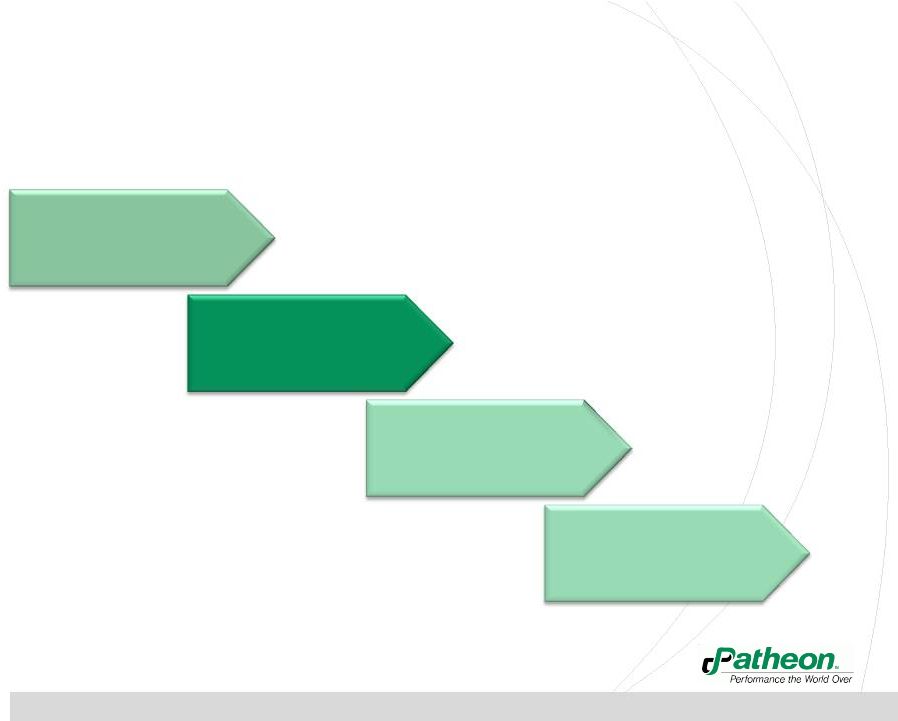
Our strategy is executed across four elements
Element I
Strengthen core
operations
Element II
Sell business
differently
Element III
Enter adjacencies
Element IV
Drive industry
consolidation |
 11
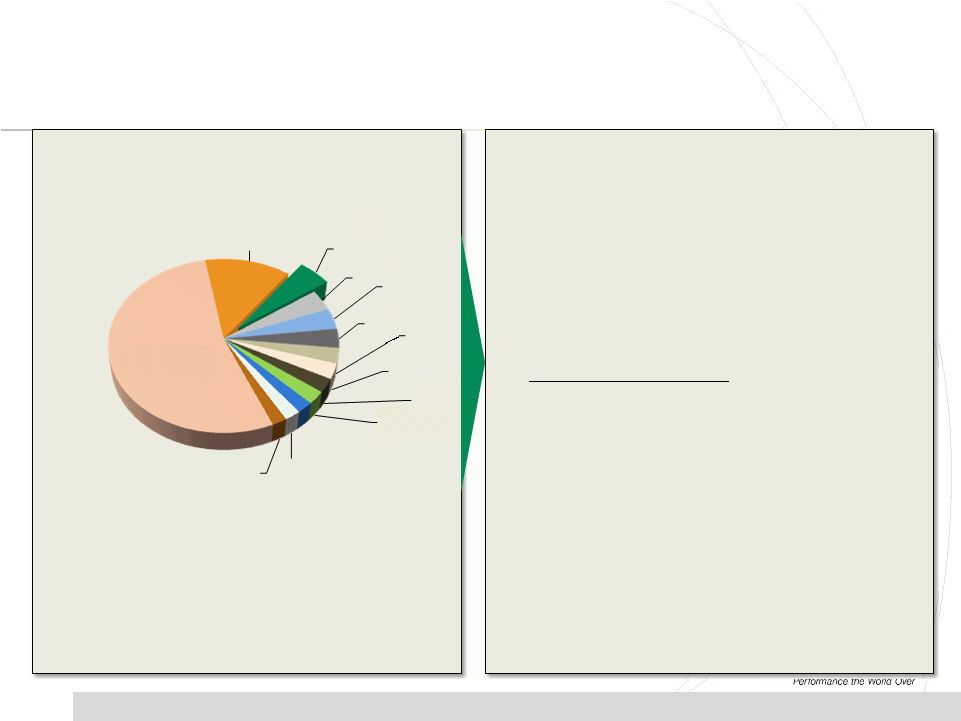
Source: PharmSource (2011)
CMO Market Trends and Implications
Competitive Landscape Trends
•
Highly fragmented market, and industry consolidation
is progressing slowly
•
3% to 5% annual growth forecasted (2011 –
2015)
•
CMOs continue to add capabilities/capacity despite
indication of oversupply
•
Fragmentation has led to low margins/pricing pressure
Implications for Patheon
•
Opportunity to better manage capacity and operational
efficiencies to deliver cost-effective manufacturing
solutions (i.e., lower cost of goods)
•
Potential for preferred provider model as pharma looks
to reduce sourcing costs
•
Opportunity to deliver higher-value offerings
(e.g.,
drug delivery technologies; solubility technologies)
Catalent
13%
Patheon
5%
Vetter
4%
Baxter
4%
Famar
3%
Aenova
3%
Fareva
3%
Haupt
3%
DPT
2%
Recipharm
2%
Nextpharma
2%
Hospira
2%
400+ Others
54%
CMO Market = $11.7 B. |
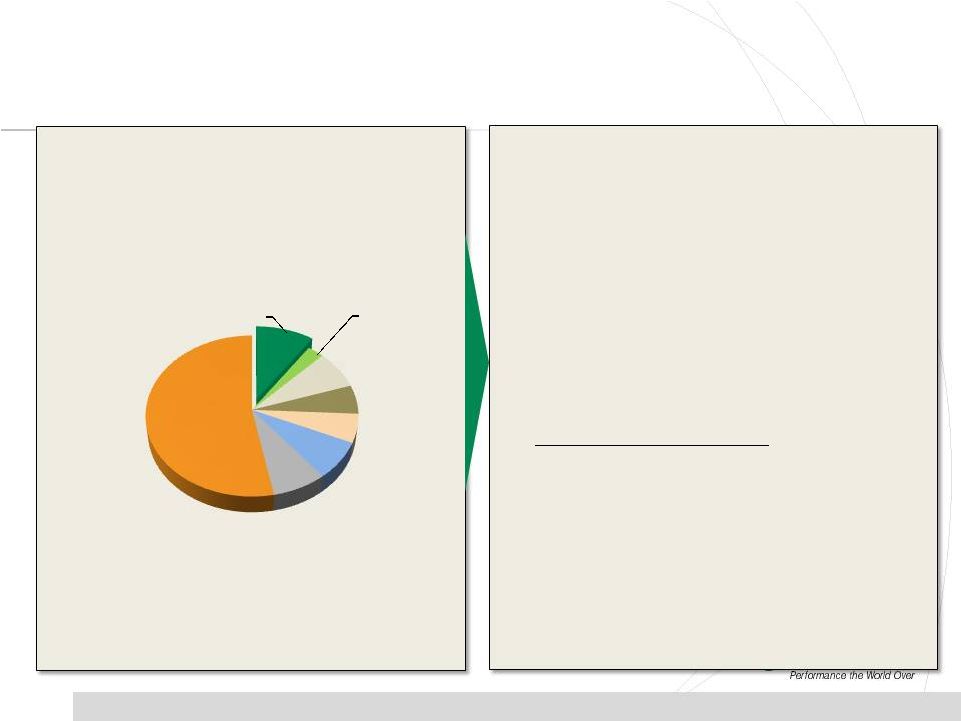 •
Competition intensifies as new competitor
types (e.g., CROs) have broadened their
service offerings, expanding towards the PDS
space
•
Reduced funding for emerging pharmas’
early
development projects, and shrinking R&D
efforts within big pharma, are forcing smaller
CDOs to restructure/downsize
•
Market growth rates projected to approach 3%
annually (2011 through 2015)
Implications for Patheon
•
Opportunity to capitalize on CDO industry
restructuring through acquisitions/partnerships
or capture of weak players’
market share
•
Opportunity to provide “integrated early
development”
offering to combat new entrants
•
Key capabilities could differentiate offerings:
Technologies (solubility-enhancing; highly
potent)
PDS Market Trends and Implications
Competitive Landscape Trends
*Market estimate includes clinical dose manufacturing, analytical services, and dose
formulation services. Source: PharmSource (2011)
Patheon,
$126
Catalent,
$35
Labs,
$100
Aptuit,
$75
AAI, $75
Almac,
$100
PPD,
$100
100+
Others,
$690
12
PDS Market Size = $1.3 B*
Lancaster |
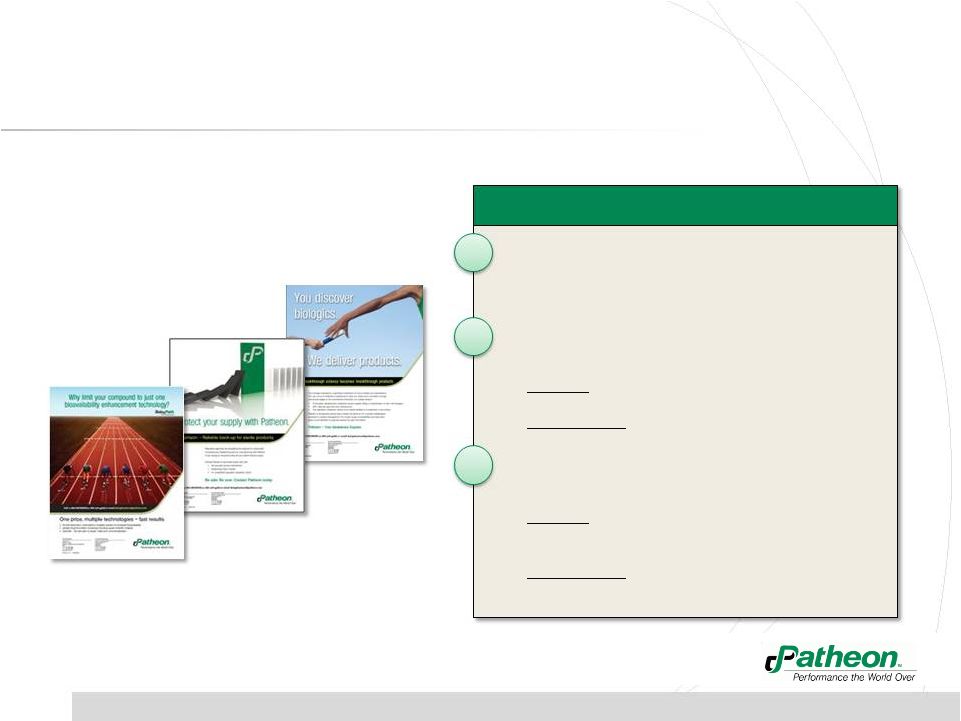 Biopharm
Sell business differently
Solution Based offerings that drive customer value
Sterile
Backup Supply
SoluPath™
Lessons Learned
•
Campaign messaging developed around
solutions to our customers’
problems rather
than our own existing capabilities
•
Fits a specific customer need which is
currently not well met by CDMOs…
•
SoluPath: “unbiased multi-technology assessment”
•
Sterile backup: “no volume commitment required”
•
…
and for which Patheon has legitimate
strengths compared to competitors
•
SoluPath: “Patheon understands what it will take
to scale up all the way to commercial supply”
•
Sterile backup: “stellar regulatory compliance and
efficient tech transfer management”
1
1
2
2
3
3
13 |
 14
Sell the business differently –
early results
Sell the business differently –
early results |
 15
Principles of our Strategy
We will provide the industry’s leading customer experience. At all levels, places, and
times our customers will have a predictably outstanding experience.
Our factories must be the highest quality, most flexible, and most efficient producers
in the world.
Our Pharmaceutical Development Services will provide best technical and scientific
solutions to solve difficult development problems and enhance product value.
We will create a culture of engagement, ownership and a shared commitment to
excellence in all that we do.
We will operate our business in a disciplined, responsible, and ethical fashion such that
our shareholders will appreciate superior returns over time.
2
2
3
3
4
4
5
5
1
1 |
 16
16
Q&A |
 17
Appendix
Adjusted EBITDA Bridges
Q1 2011
Q2 2011
Q3 2011
Q4 2011
2011
(in millions of U.S. dollars)
$
$
$
$
$
Adjusted EBITDA
29.5
14.3
11.9
17.3
73.0
Depreciation and amortization
(14.9)
(13.5)
(12.6)
(12.4)
(53.4)
Repositioning expenses
(0.9)
(0.7)
(1.9)
(3.5)
(7.0)
Interest expense, net
(6.3)
(6.3)
(6.3)
(6.5)
(25.4)
(Provision for) benefit from income taxes
(6.6)
(4.7)
2.7
1.3
(7.3)
Other
(0.1)
5.7
(1.5)
3.9
Income (loss) before discontinued operations
0.7
(11.1)
(0.5)
(5.3)
(16.2)
(0.2)
2011
2010
2011
2010
(in millions of U.S. dollars)
$
$
$
$
Adjusted EBITDA
17.3
28.6
73.0
91.7
Depreciation and amortization
(12.4)
(16.3)
(53.4)
(55.8)
Repositioning expenses
(3.5)
(1.0)
(7.0)
(6.8)
Interest expense, net
(6.5)
(6.3)
(25.4)
(19.5)
Impairment charge
-
(0.2)
-
(3.6)
Refinancing expenses
-
(0.2)
-
(12.2)
Benefit from (provision for) income taxes
1.3
(5.4)
(7.3)
3.0
Other
(1.5)
(0.1)
3.9
(0.1)
Loss before discontinued operations
(5.3)
(0.9)
(16.2)
(3.3)
Three months ended October 31,
Year ended October 31, |
