Attached files
| file | filename |
|---|---|
| EX-10.42 - EX-10.42 - NETWORK ENGINES INC | a2206665zex-10_42.htm |
| EX-10.19 - EX-10.19 - NETWORK ENGINES INC | a2206665zex-10_19.htm |
| EX-10.20 - EX-10.20 - NETWORK ENGINES INC | a2206665zex-10_20.htm |
| EX-32.1 - EX-32.1 - NETWORK ENGINES INC | a2206665zex-32_1.htm |
| EX-31.1 - EX-31.1 - NETWORK ENGINES INC | a2206665zex-31_1.htm |
| EX-21.1 - EX-21.1 - NETWORK ENGINES INC | a2206665zex-21_1.htm |
| EX-32.2 - EX-32.2 - NETWORK ENGINES INC | a2206665zex-32_2.htm |
| EX-23.1 - EX-23.1 - NETWORK ENGINES INC | a2206665zex-23_1.htm |
| EX-31.2 - EX-31.2 - NETWORK ENGINES INC | a2206665zex-31_2.htm |
| EXCEL - IDEA: XBRL DOCUMENT - NETWORK ENGINES INC | Financial_Report.xls |
UNITED STATES
SECURITIES AND EXCHANGE COMMISSION
Washington, D.C. 20549
FORM 10-K
| (Mark One) | ||
ý |
ANNUAL REPORT PURSUANT TO SECTION 13 OR 15(d) OF THE SECURITIES EXCHANGE ACT OF 1934 |
|
For the fiscal year ended September 30, 2011 |
||
OR |
||
o |
TRANSITION REPORT PURSUANT TO SECTION 13 OR 15(d) OF THE SECURITIES EXCHANGE ACT OF 1934 |
|
For the transition period from to |
||
Commission file number: 000-30863
![]()
NETWORK ENGINES, INC.
(Exact name of registrant as specified in its charter)
| Delaware (State or other jurisdiction of incorporation) |
04-3064173 (I.R.S. Employer Identification No.) |
|
25 Dan Road, Canton, MA (Address of principal executive offices) |
02021 (Zip Code) |
Registrant's telephone number, including area code (781) 332-1000
Securities registered pursuant to Section 12 (b) of the Act:
| Title of Each Class | Name of Exchange on which Registered | |
|---|---|---|
| Common Stock, par value $0.01 | NASDAQ Global Market |
Securities registered pursuant to Section 12 (g) of the Act: None
Indicate by check mark if the registrant is a well-known seasoned issuer, as defined in Rule 405 of the Securities Act. Yes o No ý
Indicate by check mark if the registrant is not required to file reports pursuant to Section 13 or Section 15(d) of the Act. Yes o No ý
Indicate by check mark whether the registrant: (1) has filed all reports required to be filed by Section 13 or 15(d) of the Securities Exchange Act of 1934 during the preceding 12 months (or for such shorter period than the Registrant was required to file such reports), and (2) has been subject to such filing requirements for the past 90 days. Yes ý No o
Indicate by check mark whether the registrant has submitted electronically and posted on its corporate Web site, if any, every Interactive Data File required to be submitted and posted pursuant to Rule 405 of Regulation S-T (§ 232.405 of this chapter) during the preceding 12 months (or for such shorter period that the registrant was required to submit and post such files). Yes ý No o
Indicate by check mark if disclosure of delinquent filers pursuant to Item 405 of Regulation S-K (§ 229.405 of this chapter) is not contained herein, and will not be contained, to the best of the registrant's knowledge, in definitive proxy or information statement incorporated by reference in Part III of this Form 10-K or any amendment to this Form 10-K. ý
Indicate by check mark whether the registrant is a large accelerated filer, an accelerated filer, a non-accelerated filer, or a smaller reporting company. See definitions of "large accelerated filer", "accelerated filer" and "smaller reporting company" in Rule 12b-2 of the Exchange Act (check one):
| Large accelerated filer o | Accelerated filer ý | Non-accelerated filer o (Do not check if a smaller reporting company) |
Smaller reporting company o |
Indicate by check mark whether the registrant is a shell company (as defined in Rule 12b-2 of the Act). Yes o No ý
The aggregate market value of the voting Common Stock held by nonaffiliates of the registrant on March 31, 2011 was approximately $73,961,000.
The number of shares outstanding of the registrant's Common Stock as of December 8, 2011 was 42,430,734 shares.
DOCUMENTS INCORPORATED BY REFERENCE
Portions of our proxy statement relating to the 2012 Annual Meeting of Shareholders, to be filed with the Securities and Exchange Commission no later than 120 days after the end of our fiscal year, are incorporated by reference into Part III of this Form 10-K.
NETWORK ENGINES, INC.
ANNUAL REPORT ON FORM 10-K
For the Fiscal Year Ended September 30, 2011
TABLE OF CONTENTS
This Form 10-K contains forward-looking statements within the meaning of Section 21E of the Securities Exchange Act of 1934, as amended, that involve risks and uncertainties. All statements other than statements of historical information provided herein are forward-looking statements and may contain projections relating to financial results, economic conditions, trends and known uncertainties. Our actual results could differ materially from those discussed in the forward-looking statements as a result of a number of factors, including the factors discussed in "Part I, Item 1A.—Risk Factors" and elsewhere in this report and the risks discussed in our other filings with the Securities and Exchange Commission. Readers are cautioned not to place undue reliance on these forward-looking statements, which reflect management's analysis, judgment, belief or expectation only as of the date hereof. We undertake no obligation to publicly reissue these forward-looking statements to reflect events or circumstances that arise after the date hereof.
References in this Annual Report on Form 10-K to "Network Engines", "NEI", "the Company", "we", "us" or "our" are to Network Engines, Inc., a Delaware corporation, and its subsidiaries.
Overview
Headquartered in Canton, Massachusetts, NEI is a system integrator. NEI designs and manufactures application platforms and appliance solutions on which software applications are applied for both enterprise and telephony information technology ("IT") networks. Application platforms are pre-configured server-based network infrastructure devices, sometimes referred to as appliances, engineered to deliver application-specific functionality, ease deployment challenges, improve integration and manageability, accelerate time to market and increase the security of that software application in an end user's network. An application platform is also intended to reduce the total cost of ownership associated with the deployment and ongoing maintenance of software applications when applied to a customer's IT infrastructure. To date, a large portion of our revenues has been derived from the sale of physical application platform solutions to customers serving the data storage, network security and communications markets. We also provide platform management software tools and support services related to solution design, systems integration, application management, global logistics, and support and maintenance programs.
We market our application platform solutions and services to original equipment manufacturers, or OEMs, and independent software vendors, or ISVs, that then deliver their software applications in the form of a network-ready hardware platform. We assemble and brand these platforms for our customers, who subsequently resell and support these platforms to organizations and enterprises. Our customers include, but are not limited to: AVST, Inc., Bomgar, Inc., Bradford Networks, EMC Corporation, Sepaton, Inc., Sophos, Plc., Symantec Corporation, Endace Measurement Systems, Ltd., Mavenir Systems, and Tektronix, Inc.
By virtue of our ability to offer a wide range of engineering, manufacturing, supply-chain, logistics, and support services, we believe we are well positioned to be the application platform solution and service experts of choice among OEMs and ISVs looking to more efficiently deploy their applications and service offerings.
Industry Background
Traditionally, networking solutions were built using custom-designed hardware and proprietary operating systems. Networking solution vendors typically used custom components and systems in an effort to meet the high-performance demands of their customers, such as increasing networking speeds, packet processing requirements and internal storage capabilities. While these highly integrated systems were designed to address the performance demands of the customer, they were expensive due to the
1
cost of research, development, and testing related to requisite customization. Networking solution vendors generally employed internal research, engineering, manufacturing and integration experts in both hardware and software, as both were critical aspects of a networking solution and viewed as essential to maintaining a competitive advantage.
Over time, the networking solutions market has evolved toward the manufacture and use of open systems, built using commercially available standard components and industry standard operating systems. At the same time, the speed and processing power of standard microprocessors reached performance levels that adequately met the demands of most networking applications. Popular operating system ("OS") platforms, such as Windows and Linux, also increased in sophistication and capability and were increasingly used as the 'embedded' operating system environment for networking applications.
The evolution of server-based appliances and telecommunication platforms, built with commercially available standard components, has allowed OEMs and ISVs to focus their development efforts and resources more on their application software and less on the system integration challenges of their business. Software application vendors now recognize that custom hardware, in many cases, is no longer critical in meeting their customers' performance requirements. Such systems are being integrated into standardized hardware platforms and, therefore, hardware alone no longer differentiates a system in the marketplace. Based on the fact that most application platforms can now be built using standard, commodity hardware and operating systems, vendors recognize that these aspects of their solution do not represent competitive differentiation points and are hence candidates for outsourcing. As a result, we believe that OEMs and ISVs will increasingly use application platforms and appliances and outsource more elements of their solution design, integration control, evaluation, test, manufacturing and global logistics to providers like NEI that specialize in these skills.
While there are many markets in which an application platform may serve, adoption of our core integration and service capabilities is most prevalent in the data storage, network security, and communications markets. The network security applications that we believe are most prone to benefit from deployment in the form of an application platform solution include network security gateways, user identification and authentication, email security and archiving, web content filtering, network intrusion (detection and prevention) and event monitoring, device relationship management, digital rights management, and web services security management. The data storage applications that we believe are most prone to benefit from deployment in the form of an application platform solution include storage security, backup and recovery, virtual tape and disc libraries, storage resource management and data migration, archival systems, de-duplication and logging. The communications markets that we believe are most prone to benefit from deployment in the form of an application platform solution include carrier-grade communications applications, mobile-to-IP network connectivity for the increasing number of smartphones, as well as mobile number portability.
The storage, security and communications needs of businesses continue to grow and, given the limited resources of many businesses, we believe vendors must provide turnkey solutions that are cost-effective, easy to install and deploy, and require minimal human maintenance and management resources. Additionally, businesses are increasingly deploying management applications both in data centers and at departmental and remote office locations. As a result, there is an increased need for applications that can be deployed quickly and efficiently without the need for extensive internal IT resources. Furthermore, remote management tools and automated system updates have become critical aspects of managing the IT network of an enterprise.
Server virtualization and various cloud computing technologies are beginning to encroach the security, storage and communications markets. We believe these technologies will become a greater portion of the IT and platform mix as enterprises seek greater network efficiencies and performance. Finally, consumer demand for seamless, converged communications is driving carriers to use more
2
highly integrated solutions. These market pressures, combined with increased competition, are accelerating the need for standards-based solutions purposely and affordably built for deploying next generation applications.
Business Strategy
Our objective is to become the industry's leading provider of application platform solutions and services. The key elements of our strategy include:
Strengthen existing relationships and engage with new OEMs and ISVs to sell application platform solutions and services. We believe that offering customers a comprehensive platform solution supported by an extensive suite of services, including solution design, systems integration, application management software tools, global logistics and post-sales support and maintenance plans, enables them to accelerate their deployment and improve the integration of their software while achieving a low total cost of ownership over the long term. This allows customers to focus on their core competency: developing their software application. We believe that our application lifecycle management expertise and modular platform management software tools provide us with a competitive advantage in the marketplace that we intend to leverage to attract new OEMs and ISVs, as well as pursue additional opportunities within our existing customer base. Over the next year we will be focused on cultivating new customers and opportunities in order to generate additional revenues, winning competitive bids, and continuing to engage with new customers on a more complete solution-based level. We also continue to pursue larger opportunities which we expect to have a more significant impact on our net revenues and profitability. These opportunities typically utilize standard off-the-shelf platforms, which result in gross margins as a percentage of revenues that are lower than historical levels. However, we believe that such opportunities can be leveraged over our existing infrastructure and production capabilities without requiring us to incur significant additional operating costs. We currently target OEMs and ISVs whose technology aligns with the benefits of deployment in the form of an application platform, and who have adequate sales and marketing resources to bring such platforms to market. These customers are in the data storage, network security and communications markets, where adoption of application platform solutions has been most prevalent.
Create and market value-added services that customers and prospective customers require in order to accelerate their time to market and reduce total cost of ownership. We believe that our services are a key competitive differentiation point and an important element of the total solution we provide. These services are offered to ease the integration of applications into an end-user's network, improve application integrity and security, ensure longer application uptimes, automate the management of deployed applications, and potentially create new customer revenue streams. As a business strategy, these services are considered to help improve customer loyalty and the rate at which customers purchase support and maintenance programs along with our application platform solutions.
Develop and integrate technologies that improve the functionality, security, manageability and deployment of application platform solutions. We intend to continue to enhance our service offerings and, where appropriate, integrate other third-party technologies and standard components that deliver the promise of highly managed application platform solutions. Our Element Manager software technology enables the remote management of such platforms through a secure, web-based management suite. We believe Element Manager enhances our ability to deliver complete appliance lifecycle management. Historically Element Manager was only deployed on Windows and rPath Linux-based platforms. However, in support of our lifecycle management offering, we have developed Element Manager for commercially available versions of Linux as well.
3
Our application platform solutions and services are described in more detail below:
Solution Design
The core of our business is designing comprehensive application platform solutions and acting as partners (in conjunction with our OEM and ISV customers) to bring successful products to market. We strive to engage with our customers at all levels of their organization, particularly with engineering and product management, to optimize the solution by focusing on the convergence of the hardware, operating system, utilities and application software. We make use of standard third-party solutions as well as custom platform designs, depending on the customer's configuration, application and volume requirements. Our application platform hardware engineering team is well versed in purpose-built design technologies, generally utilizing standard off-the-shelf components and sub-systems. The development of application platform hardware requires significant design, packaging, regulatory and thermal profiling skills. Our embedded software design team also performs low-level hardware driver development as well as BIOS modifications and tuning. We leverage these skills in order to deliver custom solutions to our customers. We have developed a highly structured platform deployment and lifecycle process, which involves all major aspects of a proposed application design, from performance requirements to branding, packaging and quality assurance. We define the customer engagement and ultimate delivery of the product in stages and identify the mutual development responsibilities for both the customer and ourselves. This model is designed to ensure that the engagement with our customer is well managed and executed in order to anticipate and implement all aspects and requirements of the solution development. The key phases of this process consist of the following:
- •
- Definition: NEI and our customer establish co-managed project teams and develop all product requirements.
- •
- Development: Engineering teams from NEI and our customer work together to define and produce evaluation units and
prototypes.
- •
- Prototype: Engineering teams develop, build and test evaluation units and the prototype.
- •
- Pilot Manufacturing: NEI's manufacturing engineering team releases the product to manufacturing to build the first pilot
units.
- •
- First Article: Both parties approve the first pilot unit(s) and NEI finalizes all manufacturing, fulfillment, and
post-sale support processes.
- •
- General Availability: The final product is released to NEI manufacturing for production and for sale by the customer.
Our OS Hardening and Packaging services remove unnecessary and/or obscure code and features in the underlying operating system to reduce the footprint, improve performance and reduce the vulnerability exposure of our customer's platforms and appliances. NEI is capable of managing and administering automated updates when and if patches and updates become available for commercially available operating systems. As a result, we are able to build a more robust operating system for our customers and better develop their application platform solutions using efficiently minimized Windows or Linux environments. We undertake all Windows and Linux compatibility and performance testing to ensure seamless interoperability, reliability and consistency.
We brand the application platform for our OEM and ISV customers. Branding is applied to the platform bezel or chassis itself as well as to all accompanying documentation, including quick set-up guides, manuals, shipping cartons, shipping labels and paperwork. We provide in-house graphic arts services to facilitate production of branding designs and we work with third-party production agencies that are highly experienced in equipment packaging and strategic branding techniques. We also employ
4
full-time mechanical engineers who build customized bezels, LCD front panels, light-pipes, and other distinctive features to provide a custom look and feel for our customers' application platforms.
We have significant experience in developing application platform and appliance solutions and, as such, we believe that our approach provides substantial benefits to our customers, including improving the chances for a successful solution and speeding the process of the customer bringing a product to market.
System Integration
We maintain sophisticated manufacturing facilities at our locations in Canton, Massachusetts, Plano, Texas and Galway, Ireland. These facilities allow us to scale our production capabilities to meet various levels of production and supply requirements. This allows us to provide our customers with the in-territory manufacturing resources and skill sets needed to best meet the volume requirements of a global marketplace. All manufacturing facilities are ISO 9001:2008 and TL 9000 Rev. 5.0 certified. In full compliance with ISO 9001:2008 and TL 9000 Rev. 5.0, we provide high-quality internal manufacturing and test services for our customers. All manufacturing facilities are also ISO 14001:2004 certified, which specifies requirements for an organization's environmental management system. Our advanced integration control processes, comprehensive systems, and manufacturing test suites are designed to ensure quality and traceability at every key step of the manufacturing process. We believe our core strengths include our ability to react quickly to accommodate changes in customer demands, including increasing order volumes, engineering changes to existing products and new product introductions. Our hardware engineering expertise also enables us to internally develop certain components or systems in the event that off-the-shelf technology does not meet our customers' needs. Our customers' products undergo a complete system test and burn-in period prior to final inspection, racking, packaging, and shipping.
Global Logistics
Many of our customers sell globally and require specialty logistics services. We extend to these customers a variety of compliance services associated with license management, regulatory approvals, global shipping, material handling, returns, refurbishment, and full inventory control that customers themselves would otherwise be required to accommodate. These services are intended to help customers consolidate and streamline their business logistics operations and reduce the associated expenses.
We provide global logistics support and order fulfillment services by delivering the final product to either our customer or, at their request, directly to their end user customers all over the world. Drop-shipping products to end users can result in lower freight fees, reduce the costs associated with receiving and turning over inventory, improve just-in-time delivery and lower the risk of lost or damaged goods. For customers with production schedule forecasts, we offer management and distribution services that eliminate the customer's need to stock and handle finished goods. We can maintain finished goods in Canton, Massachusetts, Plano, Texas and Galway, Ireland.
In order to streamline the sharing of information related to these services, we provide customers with access to a secure, self-service web portal. This portal allows customers to view product manufacturing, inventory and consignment status as well as other operational events. Customers can also request additional information and use a link to automatically receive notification of shipments and inventory levels.
Application Management
ISVs and OEMs also require application platform management software tools and services. We apply a suite of modular software tools used to simplify platform and application management and
5
enable more remote and automated lifecycle control. These Element Manager tools allow customers to better monitor, measure, maintain, and manage application platforms and deploy secure solutions. NEI's customers may use Element Manager to manage multiple platform deployments, monitor system health, automate OS updates, deploy software patches, upgrade applications, schedule back-ups and restore field-deployed units. Our application Update Service may be used to automate the process and management of delivering software upgrades and other OS, application and configuration updates. This tool serves as a secure medium for delivering encrypted updates to field-deployed applications. NEI's Health Manager may be used to monitor specific platform and application performance characteristics and report behavioral problems in real time. These and other Application Management Services may be used collectively to solve the security, reliability and management problems that ISVs otherwise experience when attempting to update, monitor, track and backup appliances in the field.
Support and Maintenance
We operate in a technology environment in which platforms, operating systems, components and software applications are constantly evolving. We monitor and analyze emerging technologies in order to improve the operation of our customer's application(s) and reduce technology transition challenges. We adapt our application platform solutions to meet emerging requirements and capabilities of our customers' software or their service offerings. To better enable our customers to overcome these challenges, we offer customers a variety of standard maintenance, support and service programs to extend product lifespan and maximize uptime. These programs help ensure high availability, rapid response, effective troubleshooting, fast parts replacement and 24-hour support. We offer a variety of warranty services that support the products we sell. The standard warranty generally provides for us to repair or replace any defective product within predetermined timeframes and generally spans periods between 12 and 36 months after initial product shipment, depending on the product and our contractual relationships with certain customers. We offer a range of additional post-sales support services, including advanced replacement of defective units, warranty coverage for extended periods, and global on-site support and repair. Some of our customers use advanced server replacement services for fast substitution in the event of field unit damage or malfunction. Other support and service programs, such as anytime on-site service, are offered to give customers even more comprehensive coverage and support when uptime and availability are considered mission critical.
Customers
Our customers are typically OEMs and ISVs that sell software application platform and appliance solutions to their enterprise customers. During the most recent fiscal quarter, we sold products and/or services to over 60 customers, including: AVST, Inc., Bomgar, Inc., Bradford Networks, EMC Corporation, Sepaton, Inc., Sophos Plc., Symantec Corporation, Endace Measurement Systems, Ltd., Mavenir Systems, and Tektronix, Inc. EMC and Tektronix were our only customers that represented individually more than 10% of total net revenues for the years ended September 30, 2011, 2010 and 2009, during which our sales to EMC were $162 million, $112 million and $52 million and our sales to Tektronix were $29 million, $45 million and $19 million, respectively. Sales to EMC represented 59%, 51% and 35% of total net revenues in the years ended September 30, 2011, 2010 and 2009, respectively. Sales to Tektronix represented 11%, 20% and 13% of total net revenues in the years ended September 30, 2011, 2010 and 2009, respectively.
6
Sales and Marketing
Sales
Our sales team is focused on forming relationships with OEMs and ISVs seeking to deploy their application on a purpose-built platform. We have a business development team that is focused on identifying and qualifying prospective customers and new projects. When an account is won, our business development and account management teams begin to work on appropriate design and deployment strategies. We then involve other employees from hardware and software engineering, quality and program management to analyze the prospective customer's requirements and design a platform solution. Our account management team then takes over the account upon general availability and manages the customer relationship.
Marketing
Our marketing organization is divided into two key functions: product management and marketing communications. Our product management team is responsible for managing the technical relationship with our hardware platform, operating systems and components suppliers. The technical product management team researches the market to anticipate trends and understand and evaluate new technologies that we can leverage in the design and integration of application platform solutions. They work closely with our sales and engineering team and our OEM and ISV customers to define product and next generation technology requirements.
Our marketing communications team is responsible for building market awareness, brand nurturing, communicating key market and product messages, producing web and print collateral, target market and lead development, customer testimonials and loyalty programs, corporate events and the general acceptance of NEI and our application platform services. These and other marketing programs are executed in close cooperation with our field sales teams.
Manufacturing
We provide manufacturing, test and fulfillment services for application platform solutions at our manufacturing facility located at our headquarters in Canton, Massachusetts, and at our manufacturing facilities located in Plano, Texas and Galway, Ireland. All locations are ISO 9001:2008, ISO 14001:2004 and TL 9000 Rev. 5.0 certified. We operate multiple manufacturing lines to scale the production capabilities to provide our customers with the appropriate type of manufacturing resources, business continuities and skill sets to best meet the volume, cost and quality requirements of a particular product. In addition, our customized lines allow us to provide customers with rapid manufacturing turn around time, which provides a significant time to market advantage for new products.
We also provide rack-mount system design and integration, in which varying combinations of interdependent appliances, computer sub-systems, telephony cards and storage servers are configured, tested and shipped in chassis and data center racks for large-scale deployments.
Our manufacturing and fulfillment services depend on our ability to effectively manage inventory and procurement levels. Although we do have contracts with certain customers, these contracts do not include any volume or minimum purchase commitments. As such, we rely on customer forecasts and our supply chain experience to procure materials to be used in production. We also use an automated manufacturing resources planning system to ensure that we are efficiently procuring materials in line with customer demand. We have consignment arrangements for certain key components where we manage vendor consigned material on our premises and take custody on a just-in-time basis. We do rely on certain vendors for sole and limited source materials, including standard processors, main logic boards, telephony boards, disk drives, hardware platforms and power supplies. In the past, we have experienced some shortages for certain components, however, these shortages have not had a material
7
impact on our results of operations to date. We currently are experiencing an industry-wide shortage of hard drives as a result of the recent flooding in Thailand. We are working closely with our vendors and customers to manage this shortage effectively. For additional information regarding this shortage, see the Risk Factors in Item 1A.
As a system integrator for ISVs and OEMs, we operate under an indirect sales model. As such, we rely on our customers to provide accurate forecasts to determine future demand. Although we do have contracts with certain customers, these contracts do not include volume or minimum purchase commitments. As such, we must purchase material to meet our customers' forecast. Our purchase obligations can fluctuate from period-to-period and can materially impact our future operating asset and liability balances, and our future working capital requirements. We intend to use our existing cash balances, together with anticipated cash flows from operations and our line of credit facility to fund our existing and future contractual obligations.
Engineering and Development
We believe that much of our future success depends on our ability to use standard hardware and OS technologies to design application platform solutions utilizing commercially available components and sub-systems acquired from third-party suppliers. We offer several standard third-party hardware and OS platforms on which customers can deploy or modify applications to meet exact requirements. Any customization work typically involves hardware and software modifications adapted to enhance and accelerate the development and deployment of application platforms. We employ teams of experienced engineers, contractors and suppliers with significant industry experience in high-density packaging, application platform design, system software, quality assurance, testing and technical documentation. We also employ a team of sales application engineers who interact with customers to assess specific hardware and software requirements, detect and diagnose problems, engineer break-fix solutions and increase overall platform solution performance.
We also employ a team of software engineers who are devoted to developing our Application Management suite of software products, including our Element Manager software. To date, we have incurred internal expenses associated with the development of our software products, which resulted in total operating expenses of $1,206,000, $705,000 and $858,000 in the years ended September 30, 2011, 2010 and 2009, respectively.
Employees
As of September 30, 2011, we had 237 employees, of whom 114 were engaged in manufacturing, 9 were engaged in customer support, 34 were engaged in sales and marketing, 40 were engaged in engineering and 40 were engaged in general and administrative functions. We also utilize contract labor, and as of September 30, 2011, we had 34 contract employees, predominantly in our manufacturing operations.
Backlog
Our backlog includes orders confirmed with a purchase order for products scheduled to be shipped within 180 days to customers with approved credit status. Certain of our customers place large orders with us to be delivered over time. In addition, we have an inventory consignment agreement with our largest customer whereby shipments of certain products to the customer are held at its locations until the customer requires the products for its production process. Although we have contracts with certain of our customers, these contracts do not include any expected volume of purchases from customers, nor do the contracts require any minimum purchase commitments. As such, we rely on purchase orders received from our customers as the basis of determining the timing and volume of shipments. However, our customers may reschedule or cancel these orders at any time. As a result of these factors, we do
8
not consider our backlog to be firm nor do we believe that our backlog, as of any particular date, is necessarily indicative of actual net revenues for any future period.
Competition
Our markets are highly competitive, and we expect this competition to persist and intensify in the future. We compete with major distributor integrators, such as Arrow Electronics, Inc. and Avnet, Inc. that offer component channel distribution services as well as customized integration services to their customers. Our competitors also include general-purpose server manufacturers that provide solutions for network equipment providers, communications equipment manufacturers and ISVs and build servers for the OEM marketplace. These competitors include Dell, Hewlett-Packard, IBM and Oracle. We may compete with contract manufacturers, such as Flextronics International, Ltd., and Sanmina-SCI Corp. as we continue to pursue high volume opportunities. We may also compete with certain communication application integrators, including Emerson Electric Co., and Kontron AG. In addition, we compete with other smaller competitors that specialize in building server products and providing some level of integration services.
Intellectual Property
We claim trademark rights for the use of the Network Engines and NEI names and related logos. We believe these rights provide us with limited control over the use of these names and descriptions. We enter into confidentiality or license agreements with our employees, consultants and corporate partners, and control access to and distribution of our Element Manager software, documentation and other proprietary information. We also have nine patents that primarily pertain to our historical business and will remain in effect until 2020 or later. In addition, we have five pending applications for patents relating to our current business, in particular, certain modules of our Element Manager Suite, including our Health and Alarm Manager modules.
Despite our efforts to protect our proprietary rights, our competitors might independently develop similar technology and unauthorized parties may attempt to copy or otherwise obtain and use our technology. Monitoring unauthorized use of our proprietary technology is difficult, and we cannot be certain that the steps we have taken will prevent misappropriation of our technology. Due to rapid technological changes in our market, we believe the various legal protections available for our intellectual property are of limited value. In addition to our own intellectual property, we seek to establish and maintain an extensive knowledge of leading technologies and to incorporate these technologies into our application platform solutions by leveraging the technological knowledge and creative skills of our personnel.
Financial Information About Geographic Areas
See Note 16 to our Consolidated Financial Statements, entitled "Geographic Data", for financial information about geographic areas. The Notes to our Consolidated Financial Statements are contained herein in Item 8.
Access to Our Securities and Exchange Commission Reports and Other Information
We are subject to the information reporting requirements of the Securities Exchange Act of 1934 and are required to file annual, quarterly and current reports, proxy statements and other information with the Securities and Exchange Commission (the "SEC"). These reports are publicly available on the SEC's website at www.sec.gov. Alternatively, the public may read and copy any materials we file with the SEC at the SEC's Public Reference Room at 100 F Street, NE, Washington, DC 20549. Please call the SEC at 1-800-SEC-0330 for more information on the operation of the Public Reference Room.
9
The public may also access these materials through our website, www.nei.com, free of charge, as soon as reasonably practicable after these reports are filed electronically with, or furnished to, the SEC. Additionally, we have posted a copy of our code of business conduct and ethics on our website, and we intend to disclose on our website any amendments to, or waivers from, our code of business conduct and ethics that are required to be publicly disclosed pursuant to the rules of the SEC or NASDAQ Global Market. We are not including the information contained on our website as part of, or incorporating it by reference, in this Annual Report on Form 10-K.
Executive Officers of the Company
Name
|
Age | Position | |||
|---|---|---|---|---|---|
| Gregory A. Shortell | 67 | President, Chief Executive Officer and Director | |||
| Douglas G. Bryant | 54 | Chief Financial Officer, Treasurer and Secretary | |||
| Charles N. Cone, III | 55 | Senior Vice President of Sales and Marketing | |||
| Richard P. Graber | 51 | Senior Vice President of Engineering and Operations | |||
Gregory A. Shortell
Gregory A. Shortell joined NEI in January 2006 as President and Chief Executive Officer and as a Director. Prior to joining NEI, Mr. Shortell was, from February 1998 to January 2006, Senior Vice President Global Sales and Marketing for Nokia Corporation, a multinational technology corporation. Prior to Nokia, Mr. Shortell served, from June 1997 to February 1998, as Managing Director of International Operations for Ipsilon, a provider of network communications equipment and, from March 1992 to June 1997 as Vice President, International at Xyplex Corporation, a provider of networking equipment.
Douglas G. Bryant
Douglas G. Bryant has served as Secretary since March 2000, Treasurer since January 1998 and Chief Financial Officer since September 1997. He was also Vice President of Finance and Administration between March 2000 and December 2006. Prior to joining NEI, Mr. Bryant served as Chief Financial Officer of CrossComm Corporation, a manufacturer of internetworking products, including routers and switches, from July 1996 to June 1997, and as Corporate Controller from September 1989 to June 1996.
Charles N. Cone, III
Charles N. Cone, III joined Alliance Systems in January 1999 as President. He became our Senior Vice President of Operations in October 2007 upon our acquisition of Alliance Systems. In August 2008, he became our Senior Vice President of Sales and Marketing. Previously, he served as Vice President of M&S Systems, a consumer electronics manufacturer. In addition, he held management positions at Texas Instruments and Marlow Industries, a winner of the 1991 Malcolm Baldrige National Quality Award.
Richard P. Graber
Richard P. Graber joined NEI in October 2003 as Vice President of Engineering and Operations, and later became our Senior Vice President of Engineering and Operations in August 2008. Prior to joining NEI, Mr. Graber was the Vice President of Engineering and Operations at Jedai Broadband Networks, Inc., a developer of access technology for broadband providers. Prior to Jedai Broadband Networks, Mr. Graber was Vice President of Engineering for ViaGate Technologies, Inc. from November 2000 to August 2001. Prior to joining ViaGate Technologies, Mr. Graber held senior engineering positions at Dialogic, an Intel company, from June 1988 to October 2000.
10
The risks and uncertainties described below are not the only ones we are faced with. Additional risks and uncertainties not presently known to us, or that are currently deemed immaterial, may also impair our business operations. If any of the following risks actually occur, our financial condition and operating results could be materially adversely affected.
Risks of dependence on customers who represent more than 10% of net revenues.
We derive a significant portion of our revenues from sales of application platform solutions directly to EMC and Tektronix and our revenues may decline significantly if these customers reduce, cancel or delay purchases of our application platform services, or terminate or curtail their relationships with us.
For the years ended September 30, 2011, 2010 and 2009, sales to EMC, our largest customer, accounted for 59%, 51% and 35%, of our total net revenues, respectively. These sales are primarily attributable to a limited number of products pursuant to non-exclusive contracts. In fiscal year 2009, we won new business to provide additional products to EMC. Gross margins as a percentage of net revenues associated with EMC decreased as this new business ramped up. To the extent that our sales associated with EMC increase as a percentage of our total net revenues, our overall gross margin percentage may decrease.
For the years ended September 30, 2011, 2010 and 2009, sales to Tektronix, our second largest customer, accounted for 11%, 20% and 13%, of our total net revenues, respectively. These sales are primarily attributable to a limited number of products pursuant to a non-exclusive contract. The nature of the products we sell to Tektronix is largely project driven; thus, our sales to Tektronix are subject to volatility from period to period. Upon completion of their projects, there is no assurance we will sell products to Tektronix for any new projects. We have limited visibility into their future projects.
If EMC or Tektronix do not require our application platform solutions and services for their future projects, our sales to these customers would decline and our operating results would be harmed. Accordingly, the success of our business will depend, to some degree, on these customers' willingness to continue to utilize our application platform solutions in their existing and future products.
Our financial success is dependent upon the future success of the application platform solutions we sell to these customers and the continued growth of these customers, whose industries have a history of rapid technological change, short product lifecycles, consolidation and pricing and margin pressures. These customers have the right to enter into agreements with alternative suppliers for the application platform solutions we provide or for portions of those solutions or for similar products, are not obligated to purchase any minimum quantity of products from us and may choose to stop purchasing from us at any time, with or without cause. For example, during the quarter ended September 30, 2011, EMC began dual sourcing the integration of one of their product lines. Our sales associated with the portion of the EMC product being sourced away from us had an annualized run rate of approximately $40 million at the time of the dual-sourcing transition.
A significant reduction in sales to these customers, or significant pricing and additional margin pressures exerted on us by these customers, would have a material adverse effect on our results of operations. In addition, if these customers delay or cancel purchases of our application platform solutions, as a result of dissatisfaction or otherwise, our operating results would be harmed and we may be unable to accurately predict revenues, profitability and cash flows.
11
Risks related to business strategy.
Our future success is dependent upon our ability to generate significant revenues from application platform solution relationships.
Our sales are derived under an indirect sales model. We work with our customers to design an application platform branded with their name. The customers then perform all of the selling and marketing efforts related to sales of their branded appliance. There are multiple risks associated with our strategy including:
- •
- our reliance on our customers to perform all of the selling and marketing efforts associated with further sales of the
application platform solution we develop with them;
- •
- a significant reliance on our customers' application software products, which could be technologically inferior to
competitive products and result in limitations on our application platform sales, causing our revenues and operating results to suffer;
- •
- our customers will most likely continue selling their software products as separate products in addition to selling them
in the form of an application platform, which will require us to effectively communicate the benefits of delivering their software in the form of an application platform;
- •
- continued consolidation within the data storage, network security and communications industries that results in existing
customers being acquired by other companies;
- •
- our ability to leverage strategic relationships to obtain new sales leads;
- •
- our ability to provide our customers with high quality application platform solutions at competitive prices;
- •
- there is no guarantee that design wins will result in actual orders or sales. A "design win" occurs when a new customer or
a separate division within an existing customer notifies us that we have been selected to integrate the customer's application. There can be delays of several months or more between the design win and
when a customer initiates actual orders. The design win may never result in actual orders or sales. Further, if the customer's plans change, we may commit significant resources to design wins that do
not result in actual orders; and
- •
- the expenditure of significant product design and engineering costs, which if not recovered through application platform sales could negatively affect our operating results.
We believe that our future success will depend on our ability to establish relationships with new customers while expanding sales within our existing customer base. We have begun to pursue (and in some cases won) large opportunities which we expect to have a more significant impact on our net revenues. We expect that these larger opportunities can be leveraged over our existing infrastructure without requiring us to incur significant additional operating costs.
If we are unsuccessful in winning larger opportunities we may have to pursue smaller opportunities. These smaller opportunities will have less of an impact on our revenue growth and may not be leveraged as effectively over our existing infrastructure, which could require us to increase our infrastructure and associated operating costs, which would negatively impact our operating results.
Our future success is dependent on our ability to effectively create and market value-added services for our customers.
We believe our success will depend on our ability to create and market value-added services for current and prospective customers. We believe that our services are a key competitive differentiation point and an important element of the total solution we offer. These services are offered to ease the
12
integration of applications into an end-user's network, improve application integrity and security, ensure longer application uptimes, automate the management of deployed applications, and potentially create new customer revenue streams. If our current and prospective customers do not find the current services we offer to be of value to them or their end users, they may decide to perform these services in-house or we may lose their business to competitors. We believe that we must continue to effectively identify and create new service offerings to remain competitive, as well as effectively market any new service offerings to current and prospective customers. If we are unsuccessful in identifying, developing and marketing any new services that our current and prospective customers perceive to be of value to them or their end users, they may decide to perform these services in-house or we may lose their business to competitors If this were to occur, our revenues and operating results would be adversely impacted.
Our business could be harmed if we fail to adequately integrate new technologies into our application platform solutions and services or if we invest in technologies that do not result in the desired effects on our current and/or future product offerings.
As part of our strategy, we review opportunities to incorporate products and technologies that could be required in order to add new customers, retain existing customers, expand the breadth of product offerings or enhance our technical capabilities. Investing in new technologies presents numerous risks, including:
- •
- we may experience difficulties integrating new technologies into our current or future application platform solutions;
- •
- our new application platform solutions may be delayed because selected new technologies themselves are delayed or have
defects and/or performance limitations;
- •
- we may incorporate technologies that do not result in the desired improvements to our current and/or future application
platform solutions and services;
- •
- we may incorporate new technologies that either may not be desired by our customers or may not be compatible with our
customers' existing technology;
- •
- new technologies are unproven and could contain latent defects, which could result in high product failure rates; and
- •
- we could find that the new application platform solutions and/or technologies that we choose to incorporate into our application platform solutions are technologically inferior to those utilized by our competitors.
If we are unable to adequately integrate new technologies into our application platform solutions and services or if we invest in technologies that do not result in the desired effects on our current and/or future application platform solutions and services, our business could be harmed and operating results could suffer.
Risks related to the application platform markets.
If application platforms are not increasingly adopted as a solution to meet a significant portion of companies' software application needs, the market for application platform solutions may not grow, which could negatively impact our revenues.
We expect that all of our future revenues will come from sales of application platform solutions and related services. As a result, we are substantially dependent on the growing use of application platforms to meet businesses' software application needs. Our revenues may not grow and the market price of our common stock could decline if the application platform market does not grow as rapidly as we expect.
13
Our expectations for the growth of the application platform market may not be fulfilled if end users continue to use general-purpose servers or proprietary platforms. The role of our application platform solutions could, for example, be limited if general-purpose servers or proprietary platforms out-perform application platforms, provide more capabilities and/or flexibility than application platforms or are offered at a lower cost. This could force us to lower the prices of our application platform solutions or could result in fewer sales of these products, which would negatively impact our revenues and decrease our gross margins.
To an extent, the application platform market is trending towards virtual application platforms and services and cloud computing. A virtual application platform is a software solution, comprised of one or more virtual machines that is packaged, maintained, updated, and managed as a unit. Cloud computing is a web-based concept, whereby vendors provide customers with a virtual (i.e. web-based) network appliance infrastructure, reducing the customer's need to purchase appliance hardware. While we currently provide a limited number of virtual application platform solutions, our revenues and operating results may be negatively impacted if current and prospective customers move toward using virtual or cloud-based platforms provided by other vendors.
The application platform solutions and services that we sell are subject to rapid technological change and our sales will suffer if these solutions are rendered obsolete by new technologies.
The markets we serve are characterized by rapid technological change, frequent new product introductions and enhancements, potentially short product lifecycles, changes in customer demands and evolving industry standards. In the application platform market, we attempt to mitigate these risks by utilizing standards-based hardware platforms and by maintaining an adequate knowledge base of available technologies. However, the application platform solutions that we sell could be rendered obsolete if products based on new technologies are introduced or new industry standards emerge and we are not able to incorporate these technological changes into our application platform solutions. In addition, we depend on third parties for the base hardware of our application platforms and we are at risk if these third parties do not integrate new technologies. Releasing new products and services prematurely may result in quality problems, and delays may result in loss of customer confidence and market share. We may be unable to design new application platform solutions and services or achieve and maintain market acceptance of them once they have come to market. Furthermore, when we do release new or enhanced products and services, we may be unable to manage the transition from the older products and services to minimize disruption in customer ordering patterns, avoid excessive inventories of older products and deliver enough new products and services to meet customer demand.
To remain competitive in the application platform market, we must successfully identify new product opportunities and partners and develop and bring new products to market in a timely and cost-effective manner. Our failure to select the appropriate partners and keep pace with rapid industry, technology or market changes could have a material adverse effect on our business, results of operations or financial condition.
Risks related to financial results.
We have a history of losses and may continue to experience losses in the future, which could cause the market price of our common stock to decline.
In the past, we have incurred significant net losses and could incur net losses in the future. At September 30, 2011 and September 30, 2010, our accumulated deficit was $103 million and $139 million, respectively. Although we have been profitable for the past two fiscal years, this profitability was primarily the result of our increased revenues while we controlled spending. This increase in our revenues in fiscal years 2010 and 2011 was significantly impacted by our increased sales volumes with EMC and Tektronix. These customers are not obligated to purchase any minimum
14
quantity of application platform services from us and may choose to stop purchasing from us at any time, with or without cause. If either of these customers were to significantly reduce purchases of our application platforms solutions or terminate their relationships with us our revenues and operating results would be harmed and our profitability may deteriorate or we may no longer be profitable. If we do not maintain or grow profitability, the market price for our common stock may decline. Even if we maintain or grow profitability there can be no guarantee that our stock price will increase.
If the application platform solutions and services that we sell become more commoditized and competition in the data storage, network security, and communications markets continues to increase, then our gross margin as a percentage of net revenues may decrease and our operating results may suffer.
Products and services in the data storage, network security, and communications markets may be subject to further commoditization as these industries continue to mature and other businesses introduce additional competing products and services. Our gross margin as a percentage of revenues for our application platform solutions and services may decrease in response to changes in our product mix, competitive pricing pressures, or new product introductions into these markets. If we are unable to offset decreases in our gross margins as a percentage of revenues by increasing our sales volumes, or by decreasing our product costs, operating results will decline. We expect that our high volume, low margin products will continue to grow relative to our low volume, high margin products. This change in the mix of sales of our application platform solutions would adversely affect our gross margin as a percentage of new revenues. To maintain our gross margins, we also must continue to reduce the manufacturing cost of our application platform solutions. Our efforts to produce higher margin application platform solutions, continue to improve our application platform solutions and produce new application platform solutions may make it difficult to reduce our manufacturing cost per product. If we fail to respond adequately to pricing pressures, to competitive application platform solutions with improved performance or to developments with respect to the other factors on which we compete, we could lose customers or orders and may lose new customer opportunities. If we are unable to offset decreases in the prices we are able to charge our customers and/or our gross margin percentage with increased sales volumes, our business will suffer.
Our quarterly revenues and operating results may also fluctuate for various reasons, which could cause our operating results to fall below expectations and thus impact the market price of our common stock.
Our quarterly revenues and operating results are difficult to predict and may fluctuate significantly from quarter to quarter. We base our expected quarterly revenues on forecasts received from our customers, however, none of our customers are obligated to purchase any quantity of our application platform solutions in the future nor are they obligated to meet forecasts of their product needs. Our operating expense levels are based in part on expectations of future revenues and gross margins, which are partially dependent on our customers' ability to accurately forecast and communicate their future product needs. If revenues or gross margins in a particular quarter do not meet expectations, operating results could suffer and the market price of our common stock could decline. Factors affecting quarterly operating results include:
- •
- the availability and/or price of products from suppliers;
- •
- the degree to which our customers are successful in reselling application platform solutions to their end customers;
- •
- our customers' consumption of their existing inventories of our application platform solutions;
- •
- the variability of orders we receive from customers who have project-based businesses, especially in the communications market;
15
- •
- the loss of key suppliers or customers;
- •
- the product mix of our sales;
- •
- the timing of new product introductions by our customers;
- •
- price competition;
- •
- the timing of engineering projects; and
- •
- changes in foreign currency exchange rates.
We may not be able to borrow funds under our credit facility or secure future financing if there is a material adverse change in our business.
In October 2007, we entered into an agreement with Silicon Valley Bank to provide for a line of credit. We view this line of credit as a source of available liquidity to fund fluctuations in our working capital requirements. This facility contains various conditions, covenants and representations with which we must be in compliance in order to borrow funds. However, if we wish to borrow under this facility in the future, there can be no assurance that we will be in compliance with these conditions, covenants and representations. As a result of the industry-wide hard drive supply shortage, we have accelerated our purchasing of materials in an effort to meet future demand; however, this may impact our working capital requirements which may require us to draw on our line of credit facility to maintain our liquidity. In addition, this line of credit facility with Silicon Valley Bank expires on March 31, 2012. After that, we may need to secure new financing to continue funding fluctuations in our working capital requirements. However, we may not be able to secure new financing, or financing on favorable terms, if we experience an adverse change in our business. As of the date of issuance of these financial statements, we had $10 million in available credit on this facility as a result of the outstanding $8 million letter of credit.
If our estimates or judgments relating to our critical accounting policies are based on assumptions that change or prove to be incorrect, our operating results could fall below expectations of securities analysts and investors, resulting in a decline in our stock price.
Our discussion and analysis of financial condition and results of operations is based on our consolidated financial statements, which have been prepared in accordance with accounting principles generally accepted in the United States of America. The preparation of financial statements in conformity with generally accepted accounting principles requires management to make estimates and assumptions that affect the amounts reported in the consolidated financial statements and accompanying notes. On an ongoing basis, we evaluate significant estimates used in preparing our consolidated financial statements, including those related to:
- •
- collectibility of accounts receivable;
- •
- inventory write-downs;
- •
- stock-based compensation;
- •
- valuation of intangible assets;
- •
- warranty reserves;
- •
- our ability to realize deferred tax assets; and
- •
- accruals for loss contingencies.
16
We base our estimates on historical experience and on various other assumptions that we believe to be reasonable under the circumstances, as provided in our discussion and analysis of financial condition and results of operations, the results of which form the basis for making judgments about the carrying values of assets and liabilities that are not readily apparent from other sources. Actual results may differ from these and other estimates if our assumptions change or if actual circumstances differ from those in our assumptions, which could cause our operating results to fall below the expectations of securities analysts and investors, resulting in a decline in our stock price.
An intangible asset represents a portion of our assets, and any impairment of the intangible asset would adversely impact our operating results.
At September 30, 2011, the carrying value of our intangible asset, which consists of customer relationships associated with an acquisition we completed in fiscal year 2008, was approximately $5.2 million, net of accumulated amortization. We will continue to incur non-cash charges relating to the amortization of our intangible asset over its remaining useful life. Future determinations of significant write-offs of the intangible asset resulting from an impairment test or any accelerated amortization of the intangible asset could have a significant impact on our operating results and affect our ability to achieve or maintain profitability. Although we do not believe that any impairment of the intangible asset exists at this time, in the event that any indicators of possible impairment exist, we may record charges which could have a material adverse effect on our results of operations. Such indicators include, but are not limited to, a worsening in customer attrition rates compared to historical attrition rates, or lower than initially anticipated cash flows associated with customer relationships.
Risks related to competition.
Competition in the application platform market is significant and if we fail to compete effectively, our financial results will suffer.
In the application platform market, we face significant competition from a number of different types of companies. Our competitors include companies who market general-purpose servers, server virtualization software, specific-purpose servers and application platforms as well as companies that sell custom integration services utilizing hardware produced by other companies. Many of these companies are larger than we are and have greater financial resources and name recognition than we do, as well as significant distribution capabilities and larger, more established service organizations to support their products. Our larger competitors may be able to leverage their existing resources, including their extensive distribution capabilities and service organizations, to provide a wider offering of products and services and higher levels of support on a more cost-effective basis than we can. We expect competition in the application platform market to increase significantly as more companies enter the market and as our existing competitors continue to improve the performance of their current application platform solutions and to introduce new application platform solutions and technologies. Such increased competition could adversely affect sales of our current and future products. In addition, competing companies may be able to undertake more extensive promotional activities, adopt more aggressive pricing policies and offer more attractive terms to customers than we can. If our competitors provide lower cost products with greater functionality or support than our application platform solutions, or if some of their products are comparable to ours and are offered as part of a range of products that is broader than ours, our application platform solutions could become undesirable.
Even if the functionality of competing products is equivalent to ours, we face a risk that a significant number of customers would elect to pay a premium for similar functionality from a larger vendor rather than purchase products from us. We attempt to differentiate ourselves from our competition by offering a wide variety of software integration, branding, supply-chain management, engineering, support, logistics and fulfillment services. If we are unable to effectively differentiate ourselves from our competition, we may be forced to offer price reductions to maintain certain
17
customers. As a result, our revenues may not increase and may decline, and our gross margins may decline. Furthermore, increased competition could lead to higher selling expenses which would negatively affect our business and future operating results.
We may begin to compete directly with our technology partners as we continue to pursue higher volume opportunities. If we fail to differentiate ourselves from, and compete with our technology partners effectively, our growth may be limited.
We believe our future success will depend on our ability to win new business with larger customers. Historically, we pursued primarily small to medium-sized companies which may not have had the design, integration, and logistics capabilities that we offer to our customers. The competition for these customers was primarily limited to integrators similar in size and resources to us. As we pursue larger opportunities, we will be competing with companies larger than us and that have more resources. Additionally, as we continue to pursue high volume opportunities, future customers may not require the additional services that we offer and may opt to purchase their platforms directly from our technology partners. In some cases, we may begin to compete with some of our larger technology partners who also perform integration services. These larger technology partners typically have lower costs of materials, which would enable them to provide a buyer with a lower cost alternative than we would be able to offer. If we fail to provide buyers with competitive solutions to those offered by our technology partners or effectively market our service offerings to these larger prospective customers, our growth may be limited.
Risks related to marketing and sales efforts and customer service.
We need to effectively manage our sales and marketing operations to increase market awareness and sales of our application platform solutions and to promote our brand recognition. If we fail to do so, our growth will be limited.
Although we currently have a relatively small sales and marketing organization, we must continue to increase market awareness and sales of our application platform solutions and services and promote our brand in the marketplace. We believe that to compete successfully we will need OEMs and ISVs to recognize us as a top-tier provider of application platform solutions and services. If we are unable to increase market awareness and promote ourselves as a leading provider of application platform solutions with our available resources, we may be unable to develop new customer relationships or expand our application platform solution and service offerings at existing customers.
If we are unable to effectively manage our customer service and support activities, we may not be able to retain our existing customers or attract new customers.
We need to effectively manage our customer support operations to ensure that we maintain good relationships with our customers. We believe that providing a level of high quality customer support will be a key differentiator for our product offerings and may require more technically qualified staff which could be more costly. If we are unable to provide this higher level of service we may be unable to successfully attract and retain customers.
If our customer support organization is unsuccessful in maintaining good customer relationships, we may lose customers to our competitors and our reputation in the market could be damaged. As a result, we may lose revenues and our business could suffer. Furthermore, the costs of providing this service could be higher than we expect, which could adversely affect our operating results.
18
Risks related to product manufacturing.
Our revenues and operating results could be harmed as a result of the recent flooding in Thailand if we are unsuccessful in meeting customer demand due to hard drive supply chain interruptions.
We are experiencing industry-wide disruptions to the hard drive supply chain as a result of the recent flooding in Thailand. Although we are working closely with our hard drive suppliers to mitigate the impact on our customers' forecasts, we may not be successful in finding availability to meet all our customers' future demand, which may impact our results of operations in the near term. If we are successful in purchasing the required amount of hard drives, we expect that there will be a short-term impact on our cash balance as we increase our inventory levels. To the extent that hard drive prices increase as a result of the increased supply pressures, we expect to recover these increased costs from our customers; however, we may be unsuccessful in recovering these costs from our customers, which would have an adverse affect on our product margins and results of operations in the near term. Although we believe we have secured sufficient quantities of material to meet most of our customers demand for the first quarter of fiscal year 2012, we are anticipating more significant shortages in the second quarter of fiscal year 2012 as the supply chain will more than likely run short of industry demand. As such, our results of operations in the second quarter of fiscal year 2012 may be impacted as a result of this supply chain shortage; however, we view this as a short term interruption as we expect any unfulfilled demand will more than likely carry into future periods.
Our dependence on sole source and limited source suppliers for key application platform components makes us susceptible to supply shortages and potential quality issues that could prevent us from shipping customer orders on time, or at all, and could result in lost sales and customers.
We depend upon single source and limited source suppliers for our industry standard processors, main logic boards, telephony boards, disk drives, hardware platforms and power supplies as well as certain of our chassis and sheet metal parts. Additionally, we depend on limited sources to supply certain other industry standard and customized components. We have in the past experienced, and may in the future experience, shortages of or difficulties in acquiring components in the quantities and of the quality needed to produce our application platform solutions.
Shortages in supply or quality issues related to these key components for an extended time would cause delays in the production of our application platform solutions, prevent us from satisfying our contractual obligations and meeting customer expectations, and result in lost sales and customers. If we are unable to buy components in the quantities and of the quality that we need on a timely basis or at acceptable prices, we will not be able to manufacture and deliver our application platform solutions on a timely or cost effective basis to our customers, and our competitive position, reputation, business, financial condition and results of operations could be seriously harmed. If we are able to secure other sources of supply for such components, our costs to purchase such components could increase, which would negatively impact our gross margins.
Tighter management of inventories across global supply chains may lead to longer lead times for our purchases of certain inventory components. If we are unable to manage our supply chain and maintain sufficient inventories to meet customer demand, this could result in lost sales and customers.
Due largely to the continued economic downturn, we have experienced tighter management of inventories across our supply chain, resulting in longer lead times to obtain inventory components from our vendors. To a significant degree, we plan our purchasing of inventory components based on forecasts of future demand from our customers. If actual order volumes from our customers exceed those forecasts, we may experience supply depletions or shortages. In some cases, this may lead to delays in our deliveries of products to our customers due to the long lead times required to obtain new supplies of certain inventory components. In other cases, this may cause our customers to cancel their
19
orders with us. These factors could adversely impact our relationships with our customers and could cause certain customers to seek other sources of product supply. Also, we may purchase larger quantities of certain inventory components in order to mitigate the risks described above. Such inventory may later become excess or obsolete, which would result in higher than expected costs to write down inventory to its net realizable value.
If we do not accurately forecast our application platform materials requirements, our business and operating results could be adversely affected.
We use rolling forecasts based on anticipated product orders to determine our application platform component requirements. Lead times for materials and components that we order may change significantly depending on variables such as specific supplier requirements, contract terms and current market demand for those components. In addition, a variety of factors, including the timing of product releases, potential delays or cancellations of orders, the timing of large orders and the unproven acceptance of new products in the market make it difficult to predict product orders. As a result, our materials requirement forecasts may not be accurate. If we overestimate our materials requirements, we may have excess inventory, which would increase costs and negatively impact our cash position. Our agreements with certain customers provide us with protections related to inventory purchased in accordance with the terms of these agreements; however, these protections may not be sufficient to prevent certain losses as a result of excess or obsolete inventory. If we underestimate our materials requirements, we may have inadequate inventory which could interrupt our manufacturing and delay delivery of our application platform solutions to customers, resulting in a loss of sales or customers. Any of these occurrences would negatively impact our business and operating results.
If our application platform solutions fail to perform properly and conform to specifications, our customers may demand refunds, assert claims for damages or terminate existing relationships with us, and our reputation and operating results may suffer materially.
As application platform solutions are complex, they may contain errors that can be detected at any point in a product's lifecycle. If flaws in design, production, assembly or testing of our application platform solutions (by us or our suppliers) were to occur, we could experience a rate of failure in our application platform solutions that could result in substantial repair, replacement or service costs and potential damage to our reputation. In addition, because our solutions are combined with products from other vendors, should problems occur, it might be difficult to identify the source of the problem.
Continued improvement in manufacturing capabilities, control of material and manufacturing quality and costs, and product testing are critical factors in our future growth. There can be no assurance that our efforts to monitor, develop, modify and implement appropriate test and manufacturing processes for our application platform solutions will be sufficient to permit us to avoid a rate of failure in our application platform solutions that results in substantial delays in shipment, significant repair or replacement costs or potential damage to our reputation, any of which could have a material adverse effect on our business, results of operations or financial condition.
In the past, we have discovered errors in some of our application platform solutions and have experienced delays in the shipment of our application platform solutions during the period required to correct these errors or we have had to replace defective products that were already shipped. Errors in our application platform solutions may be found in the future and any of these errors could be significant. Significant errors, including those discussed above, may result in:
- •
- the loss of or delay in market acceptance and sales of our application platform solutions;
- •
- diversion of engineering resources;
- •
- increased manufacturing costs;
20
- •
- the loss of customers;
- •
- injury to our reputation and other customer relations problems; and
- •
- increased maintenance and warranty costs.
Any of these problems could harm our business and future operating results. Product errors or delays could be material, including any product errors or delays associated with the introduction of new products or versions of existing products. If our application platform solutions fail to conform to warranted specifications, customers could demand a refund for the purchase price and assert claims for damages.
Moreover, because our application platform solutions may be used in connection with critical computing systems services, including providing security to protect valuable information, we may receive significant liability claims if they do not work properly. While our agreements with customers typically contain provisions intended to limit our exposure to liability claims, these limitations do not preclude all potential claims. Liability claims could exceed our insurance coverage and require us to spend significant time and money in litigation or to pay significant damages. Any claims for damages, even if unsuccessful, could seriously damage our reputation and business.
Other risks related to our business.
If the market price of our common stock is not quoted on a national exchange, our ability to raise future capital may be hindered and the market price of our common stock may be negatively impacted.
At certain times in the past, the market price of our common stock has been less than $1.00 per share. Recently our stock price has been trading at market prices around $1.00. If we are unable to meet the stock price listing requirements of NASDAQ, our common stock could be de-listed from the NASDAQ Global Market. If our common stock were de-listed from the NASDAQ Global Market, among other things, this could result in a number of negative implications, including reduced liquidity in our common stock as a result of the loss of market efficiencies associated with NASDAQ and the loss of federal preemption of state securities laws, as well as the potential loss of confidence by suppliers, customers and employees, the loss of institutional investor interest, fewer business development opportunities and greater difficulty in obtaining financing. As of the date of issuance of these financial statements, we were in compliance with all applicable requirements for continued listing on the NASDAQ Global Market.
Our operating results would suffer if we, our customers, or other third-party technology providers from whom we license or purchase products from, were subject to an infringement claim that resulted in protracted litigation, the award of significant damages against us or the payment of substantial ongoing royalties.
Substantial litigation regarding intellectual property rights exists in the technology industry. Application platform solutions may be subject to third-party infringement claims as the number of competitors in the industry segment grows and the functionality of products in different industry segments overlap. In the past we have received claims from third parties that our application platform solutions infringed their intellectual property rights. We do not believe that our application platform solutions employ technology that infringes the proprietary rights of any third parties. We are also not aware of any claims made against any of our customers related to their infringement of the proprietary rights of other parties in relation to products that include our application platform solutions. Other parties may make claims against us or our customers that, with or without merit, could:
- •
- be time consuming for us to address;
- •
- require us to enter into royalty or licensing agreements;
21
- •
- result in costly litigation, including potential liability for damages;
- •
- divert our management's attention and resources; and
- •
- cause product shipment delays.
In addition, other parties may make claims against our customers related to products that are incorporated into our application platform solutions. Our business could be adversely affected if such claims resulted in the inability of our customers to continue providing the infringing product.
If we fail to retain and attract appropriate levels of qualified employees and members of senior management, we may not be able to successfully execute our business strategy.
Our success depends in large part on our ability to retain and attract highly skilled engineering, sales, marketing, customer service and managerial personnel. If we are unable to attract a sufficient number of qualified personnel, we may not be able to meet key objectives such as developing, upgrading, or enhancing our application platform solutions and services in a timely manner, which could negatively impact our business and could hinder any future growth.
If any of our manufacturing locations were to experience a significant disruption in its operations, it could have a material adverse effect on our financial condition and results of our operations.
Our manufacturing facilities and headquarters are concentrated primarily in three locations. If the operations in any one facility were disrupted as a result of a natural disaster, fire, power or other utility outage, work stoppage or other similar event, our business could be seriously harmed for a period of at least one quarter as a result of interruptions or delays in our manufacturing, engineering, or post-sales support operations.
If we fail to maintain an effective system of internal controls, we may not be able to accurately report our financial results. As a result, current and potential stockholders could lose confidence in our financial reporting, which could have a negative market reaction.
Section 404 of the Sarbanes-Oxley Act of 2002 requires our management to report on, and our independent registered public accounting firm to attest to, the effectiveness of our internal control over financial reporting. We have an ongoing program to perform the system and process evaluation and testing necessary to comply with these requirements. As a result, we have incurred expenses and have devoted additional management resources to Section 404 compliance. Effective internal controls are necessary for us to provide reliable financial reports. If we cannot provide reliable financial reports, our business and operating results could be harmed.
The market price for our common stock may be particularly volatile, and our stockholders may be unable to resell their shares at a profit.
The market price of our common stock has been subject to significant fluctuations and may continue to fluctuate or decline. During the year ended September 30, 2011, the closing price of our common stock ranged from a low of $0.97 to a high of $2.33 and during fiscal year ended September 30, 2010, the closing price of our common stock ranged from a low of $1.07 to a high of $3.45. The market for technology and micro-cap stocks has been extremely volatile and frequently reaches levels that bear no relationship to the past or present operating performance of those companies. General economic conditions, such as recession or interest rate or currency rate fluctuations in the United States or abroad, could negatively affect the market price of our common stock. In addition, our operating results may be below the expectations of securities analysts and investors. If this were to occur, the market price of our common stock may decrease significantly. In the past, following periods of volatility in the market price of a company's securities, securities class action litigation has often been instituted against such companies. Such litigation could result in substantial cost and a diversion of management's attention and resources.
22
Any decline in the market price of our common stock or negative market conditions could adversely affect our ability to raise additional capital, to complete future acquisitions of or investments in other businesses and to attract and retain qualified technical and sales and marketing personnel.
We have anti-takeover defenses that could delay or prevent an acquisition and could adversely affect the market price of our common stock.
Our Board of Directors has the authority to issue up to 5,000,000 shares of preferred stock and, without any further vote or action on the part of the stockholders, to determine the price, rights, preferences, privileges and restrictions of the preferred stock. This preferred stock, if issued, might have preference over the rights of the holders of common stock and could adversely affect the market price of our common stock. The issuance of this preferred stock may make it more difficult for a third party to acquire us or to acquire a majority of our outstanding voting stock. We currently have no plans to issue preferred stock.
In addition, provisions of our second amended and restated certificate of incorporation and our second amended and restated by-laws may deter an unsolicited offer to purchase us. These provisions, coupled with the provisions of the Delaware General Corporation Law, may delay or impede a merger, tender offer or proxy contest involving us. For example, our Board of Directors is divided into three classes, only one of which is elected at each annual meeting. These factors may further delay or prevent a change of control of our business.
Class action lawsuits have been filed against us, our board of directors, our former chairman and certain of our executive officers and other lawsuits may be instituted against us from time to time.
In December 2001, a class action lawsuit relating to our initial public offering was filed against us, our chairman, one of our executive officers and the underwriters of our initial public offering. For more information on lawsuits, see "Part I, Item 3—Legal Proceedings." We are currently attempting to settle the lawsuit filed against us related to our initial public offering. We are unable to predict the effects on our financial condition or business of the lawsuit related to our initial public offering or other lawsuits that may arise from time to time. While we maintain certain insurance coverage, there can be no assurance that claims against us will not result in substantial monetary damages in excess of such insurance coverage. This class action lawsuit, or any future lawsuits, could cause our director and officer insurance premiums to increase and could affect our ability to obtain director and officer insurance coverage, which would negatively affect our business. In addition, we have expended, and may in the future expend, significant resources to defend such claims. This class action lawsuit, or other similar lawsuits that may arise from time to time, could negatively impact both our financial condition and the market price of our common stock and could result in management devoting a substantial portion of their time to these lawsuits, which could adversely affect the operation of our business.
ITEM 1B. UNRESOLVED STAFF COMMENTS
None.
Our principal business operations are conducted in our corporate headquarters in Canton, Massachusetts where we lease approximately 52,000 square feet of manufacturing and office space, in our Plano, Texas location where we lease approximately 83,000 square feet of manufacturing and office space and in our Galway, Ireland location where we lease approximately 20,000 square feet of manufacturing and office space. We believe that our Canton, Plano and Galway facilities will be adequate to meet our requirements for the foreseeable future.
23
Initial Public Offering Lawsuit
A putative class action lawsuit was filed on December 3, 2001 in the United States District Court for the Southern District of New York against us and several underwriters of our July 2000 initial public offering ("IPO"), alleging that the defendants violated federal securities laws by issuing and selling securities pursuant to our IPO without disclosing to investors that the underwriter defendants had solicited and received excessive and undisclosed commissions from certain investors. The suit seeks damages and certification of a plaintiff class consisting of all persons who acquired shares of our common stock between July 13, 2000 and December 6, 2000. On July 9, 2003, a Special Committee of our Board of Directors authorized us to negotiate a settlement of the pending claims substantially consistent with a memorandum of understanding negotiated among the class plaintiffs, all issuer defendants and their insurers. The parties have negotiated the settlement, which provides, among other things, for a release of us and the individual defendants for the conduct alleged in the amended complaint to be wrongful. We would agree to undertake other responsibilities under the settlement, including agreeing to assign, or not assert, certain potential claims that we may have against the underwriters. Any direct financial impact of the proposed settlement is expected to be borne by the our insurers. Any such settlement would be subject to various contingencies, including approval by the court overseeing the litigation. On February 15, 2005, the District Court issued an Opinion and Order preliminarily approving the settlement, provided that the defendants and plaintiffs agree to a modification narrowing the scope of the bar order set forth in the original settlement agreement. The parties agreed to a modification narrowing the scope of the bar order, and on August 31, 2005, the District Court issued an order preliminarily approving the settlement and setting a public hearing on its fairness, which took place on April 24, 2006. On December 5, 2006, the United States Court of Appeals for the Second Circuit overturned the District Court's certification of the class of plaintiffs who are pursuing the claims that would be settled in the settlement against the underwriter defendants. Thereafter, the District Court ordered a stay of all proceedings in all of the lawsuits pending the outcome of plaintiffs' petition to the Second Circuit for rehearing en banc and resolution of the class certification issue. On April 6, 2007, the Second Circuit denied plaintiffs' petition for rehearing, but clarified that the plaintiffs may seek to certify a more limited class in the District Court. On June 25, 2007, the District Court signed an order terminating the settlement. On October 5, 2009, the District Court issued an opinion granting plaintiffs' motion for final approval of a proposed settlement, approval of the plan of distribution of the settlement fund, and certification of the settlement classes. An Order and Final Judgment was entered on December 30, 2009. Various notices of appeal of the District Court's October 5, 2009 order were filed. On October 7, 2010, all but two parties who had filed a notice of appeal filed a stipulation with the District Court withdrawing their appeals with prejudice, and the two remaining objectors filed briefs in support of their appeals. On December 8, 2010, plaintiffs moved to dismiss with prejudice the appeal filed by one of the two appellants based on alleged violations of the Second Circuit's rules, including failure to serve, falsifying proofs of service, and failure to include citations to the record. On May 17, 2011, the Second Circuit dismissed one of the appeals and remanded the one remaining appeal to the District Court for further proceedings to determine whether the remaining objector has standing. On August 25, 2011, the District Court concluded that the remaining objector lacks standing to object to the settlement because he was not a class member. On September 23, 2011, the remaining objector filed a Notice of Appeal of the District Court's August 25, 2011 Order. That appeal remains pending. We are unable to predict the outcome of this suit and as a result, no amounts have been accrued as of September 30, 2011.
24
ITEM 5. MARKET FOR REGISTRANT'S COMMON EQUITY, RELATED STOCKHOLDER MATTERS AND ISSUER PURCHASES OF EQUITY SECURITIES
(a) Market Information
NEI's common stock began trading on the NASDAQ Global Market on July 13, 2000 under the symbol "NENG". Prior to that time there had been no market for our common stock. Effective October 1, 2010, NEI's common stock began trading on the NASDAQ Global Market under the symbol "NEI". The following table sets forth the high and low closing sales prices per share for our common stock on the NASDAQ Global Market for the periods indicated:
| |
2011 | 2010 | |||||||||||
|---|---|---|---|---|---|---|---|---|---|---|---|---|---|
Fiscal Year Ended September 30:
|
High | Low | High | Low | |||||||||
First Quarter |
$ | 1.76 | $ | 1.42 | $ | 1.66 | $ | 1.07 | |||||
Second Quarter |
2.33 | 1.67 | 2.19 | 1.38 | |||||||||
Third Quarter |
2.15 | 0.97 | 3.45 | 2.00 | |||||||||
Fourth Quarter |
1.39 | 1.10 | 3.23 | 1.33 | |||||||||
(b) Holders of record
As of December 8, 2011, there were approximately 204 holders of record of our common stock. Because many of such shares are held by brokers and other institutions on behalf of stockholders, we are unable to estimate the total number of stockholders represented by these record holders.
(c) Dividends
We have never paid or declared any cash dividends on our common stock. We currently intend to retain any earnings for future growth and, therefore, do not expect to pay cash dividends in the foreseeable future.
(d) Securities Authorized for Issuance under Equity Compensation Plans
The information required by this item is included under the caption "Equity Compensation Plan Information" in our Proxy Statement related to the 2012 Annual Meeting of Shareholders to be filed with the Securities and Exchange Commission no later than 120 days after the end of our fiscal year and is incorporated herein by reference.
(e) Performance Graph
The following graph compares the cumulative total return to holders of our common stock for the period from September 30, 2006 through September 30, 2011 with the cumulative total return over such period of the NASDAQ Stock Market (U.S.) Index, and the NASDAQ Computer Index.
The graph assumes the investment of $100 in our common stock and in each of such indices (and the reinvestment of all dividends). Measurement points are the last trading days of each of the years ended September 30, 2006, 2007, 2008, 2009, 2010 and 2011. The performance shown is not necessarily indicative of future performance.
The information included under the heading "Performance Graph" in Item 5 of this Annual Report on Form 10-K is "furnished" and not "filed" and shall not be deemed to be "soliciting material" or subject to Regulation 14A, shall not be deemed "filed" for purposes of Section 18 of the Securities Exchange Act of 1934, as amended, or otherwise subject to the liabilities of that section, nor shall it be deemed incorporated by reference in any filing under the Securities Act of 1933, as amended, or the Exchange Act.
25
COMPARISON OF 5 YEAR CUMULATIVE TOTAL RETURN*
Among Network Engines, Inc., The NASDAQ Composite Index,
And the NASDAQ Computer Index
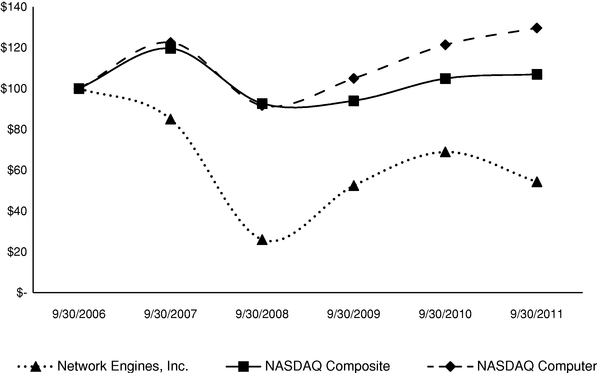
- *
- $100
invested on 9/30/06 in stock or index, including reinvestment of dividends.
Fiscal year ending September 30.
(f) Stock Repurchase Program
The following is a summary of stock repurchases for each month during the fourth quarter of the year ended September 30, 2011:
Month
|
Total Number of Shares Purchased(1) |
Average Price Paid Per Share |
Total Number of Shares Purchased as Part of a Publicly Announced Program |
Maximum Approximate Dollar Value that May Yet Be Used for Purchases Under the Program |
|||||||||
|---|---|---|---|---|---|---|---|---|---|---|---|---|---|
July 2011 |
228,800 | $ | 1.18 | 228,800 | $ | 1,730,000 | |||||||
August 2011 |
215,942 | 1.19 | 215,942 | 1,472,000 | |||||||||
September 2011 |
81,600 | 1.21 | 81,600 | 1,373,000 | |||||||||
Total |
526,342 | $ | 1.19 | 526,342 | $ | 1,373,000 | |||||||
- (1)
- All of the shares of common stock set forth in this table were purchased pursuant to the program publicly announced on June 13, 2011. On this date, we announced that our Board of Directors had authorized the continuation of the repurchase program for up to $2 million of common stock through a share repurchase program. The program does not have an expiration date. All repurchases described in the table above were effected pursuant to a written Rule 10b5-1 trading plan. From the program's inception through September 30, 2011, including previous repurchase programs, we repurchased 3,107,888 shares at an average cost of $0.90 per share.
26
ITEM 6. SELECTED FINANCIAL DATA
The following selected financial data are derived from the financial statements of Network Engines, Inc. The historical results presented are not necessarily indicative of future results. The consolidated statements of operations data for the years ended September 30, 2011, 2010 and 2009 and the consolidated balance sheet data as of September 30, 2011 and 2010 have been derived from our consolidated financial statements included in Item 8 of this Annual Report on Form 10-K. The selected consolidated statements of operations data for the year ended September 30, 2008 and 2007 and the selected consolidated balance sheet data as of September 30, 2008 and 2007 are derived from our audited consolidated financial statements not included in this Annual Report on Form 10-K. The selected consolidated financial data set forth below should be read in conjunction with "Management's Discussion and Analysis of Financial Condition and Results of Operations" and "Financial Statements and Supplementary Data" and the related Notes included elsewhere in this Annual Report on Form 10-K.
On October 11, 2007, we acquired Alliance Systems, Inc. The results for the year ended September 30, 2008 only include activity from this acquisition since October 12, 2007. As such, the presentation of historical financial information and any discussion regarding the comparison of historical financial information to financial information for the year ended September 30, 2008, does not include any financial information for Alliance Systems prior to October 12, 2007, unless otherwise indicated.
Selected Financial Data
(in thousands, except per share data)
| |
Year Ended September 30, | |||||||||||||||
|---|---|---|---|---|---|---|---|---|---|---|---|---|---|---|---|---|
| |
2011 | 2010 | 2009 | 2008 | 2007 | |||||||||||
Net revenues |
$ | 272,468 | $ | 221,620 | $ | 148,722 | $ | 197,495 | $ | 119,627 | ||||||
Gross margin(a) |
30,932 | 25,472 | 22,521 | 32,343 | 23,252 | |||||||||||
Operating expenses(b)(c) |
24,548 | 23,931 | 25,795 | 41,056 | 22,584 | |||||||||||
Income (loss) from operations |
6,384 | 1,541 | (3,274 | ) | (8,713 | ) | 668 | |||||||||
Net income (loss)(d) |
36,701 | 1,529 | (3,198 | ) | (8,477 | ) | 2,502 | |||||||||
Net income (loss) per common share—basic |
$ | 0.86 | $ | 0.04 | $ | (0.07 | ) | $ | (0.19 | ) | $ | 0.06 | ||||
Net income (loss) per common share—diluted |
$ | 0.84 | $ | 0.03 | $ | (0.07 | ) | $ | (0.19 | ) | $ | 0.06 | ||||
Weighted average shares outstanding—basic |
42,843 | 42,367 | 42,817 | 43,856 | 40,637 | |||||||||||
Weighted average shares outstanding—diluted |
43,886 | 44,038 | 42,817 | 43,856 | 41,256 | |||||||||||
| |
September 30, | |||||||||||||||
|---|---|---|---|---|---|---|---|---|---|---|---|---|---|---|---|---|
Balance Sheet Data:
|
2011 | 2010 | 2009 | 2008 | 2007 | |||||||||||
Cash, cash equivalents, short-term investments and restricted cash |
$ | 19,852 | $ | 15,323 | $ | 21,039 | $ | 10,050 | $ | 44,650 | ||||||
Working capital |
72,516 | 49,771 | 44,163 | 40,960 | 55,384 | |||||||||||
Total assets |
131,391 | 84,111 | 76,670 | 78,065 | 74,822 | |||||||||||
Total stockholders' equity |
92,220 | 55,152 | 51,570 | 54,352 | 55,508 | |||||||||||
- (a)
- Includes
$0.1 million, $0.2 million, $0.1 million, $0.2 million, and $0.2 million related to stock compensation charges
in fiscal year 2011, 2010, 2009, 2008, and 2007, respectively.
- (b)
- Includes
$0.5 million and $8.7 million related to goodwill impairment charges in 2011 and 2008, respectively.
- (c)
- Includes
$0.8 million, $0.9 million, $1.2 million, $1.8 million, and $2.3 million related to stock compensation charges,
in fiscal year 2011, 2010, 2009, 2008, and 2007, respectively.
- (d)
- Includes $30.9 million related to a change in the deferred tax asset valuation allowance in 2011.
27
ITEM 7. MANAGEMENT'S DISCUSSION AND ANALYSIS OF FINANCIAL CONDITION AND RESULTS OF OPERATIONS
Overview
As a system integrator, we design and manufacture application platforms and appliance solutions on which software applications are applied to both enterprise and communications networks. We market our application platform solutions and services to original equipment manufacturers, or OEMs, and independent software vendors, or ISVs, that then deliver their software applications in the form of a network-ready hardware platform. We brand these platforms for our customers, who subsequently resell and support these platforms to organizations and enterprises. Application platforms are pre-configured server-based network infrastructure devices, engineered to deliver specific software application functionality, ease deployment challenges, improve integration and manageability, accelerate time-to-market and increase the security of that software application in an end user's network. We also provide platform management software tools and support services related to solution design, integration control, global logistics, and support and maintenance programs.
We are currently focused on the following key factors in evaluating our financial condition and operating results:
- •
- Revenue growth: We have focused our sales and marketing efforts on pursuing new revenue opportunities with large
customers. As we seek to increase our net revenues and operating income, winning new business from large customers, whether new or existing, is expected to have a more significant impact on our
revenues and profitability than pursuing opportunities from smaller prospects. Also, standard platform designs have become more sophisticated in recent years, reducing the need for platform
customization. Therefore, the larger revenue opportunities that we have pursued (and in some cases have won) are increasingly likely to have their needs met by standard platforms, which yield lower
gross margins than customized platforms. However, we believe that pursuing and winning such opportunities will enhance our operating income despite possibly causing our gross margins as a percentage
of revenue to decline as compared to historical levels.
- •
- Managing operating expenses: Because our gross margin as a percentage of net revenues is relatively low (11.4% for the
year ended September 30, 2011), we view effective management of our operating expenses as critical to maximizing our net income. We regularly review and scrutinize our headcount and
expenditures to ensure that we are spending in accordance with our established budget and that we are receiving commensurate value from our expenditures, while ensuring that we maintain our ability to
meet our customers' needs. We believe that by leveraging our existing operating infrastructure, we can support significant growth in net revenues without incurring significant incremental operating
expenses.
- •
- Increasing service revenues: Our service revenues have historically amounted to less than 5% of our total net revenues.
One of our objectives is to increase the proportion of customers that purchase services from us (our "attach rate") in order to enhance our net revenues, gross margin, and operating income. However,
the larger customer opportunities which we have been pursuing tend to have lower attach rates, as they are more likely than smaller companies to utilize existing in-house service
capabilities instead of purchasing services from their system integrator vendors.
- •
- Customer service: Because most application platforms can be built using standard, commodity hardware and operating systems, we believe that a key point of differentiation for providers of application platforms is the ability to provide technical expertise and excellent customer service. We believe that offering a range of support services which many of our customers perceive as valuable enhances our ability to attract and retain customers.
28
- •
- Managing working capital: We regularly monitor our working capital to ensure that we maintain sufficient liquidity to fund our operating and investing needs. The key components of our working capital management include timely collection of accounts receivable to shorten the cycle of converting our sales to cash, and effective purchasing of inventory to ensure that we obtain materials on a timely basis to fulfill our customers' needs, while minimizing excess and obsolete inventory and maximizing the annualized rate at which we turn over our inventory.
We are also focused on the key risks and challenges that we currently face, including the following:
- •
- Dependence on key customers: During the year ended September 30, 2011, our top two customers accounted for 70% of
our total net revenues. We have a contractual agreement with one of these customers, and we rely solely on purchase orders from our other key customer. In both circumstances, these customers are not
obligated to purchase any minimum quantity of products from us and they can use alternative suppliers for any portion of these solutions we provide to them. For example, EMC Corporation ("EMC") began
dual sourcing the integration of one of its product lines during the quarter ended September 30, 2011. Our sales associated with the portion of the EMC product being sourced away from us had an
annualized run rate of approximately $40 million at the time of the dual-sourcing transition. One of the expected benefits of our strategy of pursuing larger revenue opportunities
is to decrease our dependence on two customers for such a large percentage of our revenues.
- •
- Sole and limited source suppliers: As a result of the recent flooding in Thailand, we and many others are experiencing
hard drive availability issues. We are working closely with our hard drive suppliers to maximize the amount of inventory we can procure to satisfy our customers' forecasts. Where possible, we are
increasing our inventory levels to mitigate any future impact and ensure we have adequate hard drive supplies to meet customer needs. This increase in our inventory levels will have a
short-term impact on our cash levels.
- •
- Technology trends: Computer hardware and software technologies can change dramatically and rapidly, which can present
risks to providers in these markets. We regularly monitor developments in our target markets and formulate strategies to ensure we are prepared to respond to such developments, and to the possibility
that our customers' needs may change as a result, in a timely manner. For example, the introduction of next-generation components by key technology developers requires us to manage
transitions from one generation to the next and ensure that new technologies are interoperable with our customers' applications. Recently, virtualization and "cloud computing" have emerged as trends
which are expected to impact our target markets, perhaps significantly, in the coming years. We have begun efforts to increase our participation in these areas and enhance our ability to offer
customers the deployment of their applications in whatever form or forms they desire, including virtual appliances.
- •
- Variability of net revenues: Many of our customers, especially those in the communications market, have project-oriented businesses. When a given significant project is in process, the volume of our sales to such customers tends to increase. After such a project is completed, our sales to such customers may decline for varying periods of time, depending on the timing and magnitude of other projects which may be in process. As a result, the revenues that we generate from sales to such customers can vary significantly from quarter to quarter and, possibly, from year to year. We obtain forecasts from our customers, generally on a monthly or quarterly basis, in order to enhance our ability to anticipate these revenue trends and plan for the resulting fluctuations in our customers' needs.
Critical Accounting Policies and Estimates
Our discussion and analysis of financial condition and results of operations are based upon our consolidated financial statements, which have been prepared in accordance with accounting principles
29
generally accepted in the United States of America. In preparing these financial statements, we have made estimates and judgments in determining certain amounts included in the financial statements. We base our estimates and judgments on historical experience and other various assumptions that we believe to be reasonable under the circumstances. Actual results may differ from these estimates under different assumptions or conditions. We believe the following critical accounting policies affect our more significant judgments and estimates used in the preparation of our financial statements.
Revenue Recognition
Revenues from products are generally recognized upon delivery to customers if persuasive evidence of an arrangement exists, the fee is fixed or determinable, collectibility is reasonably assured and title and risk of loss have passed to the customer. In the event we have unfulfilled future obligations, revenue and related costs are deferred until those future obligations are met. We have an inventory consignment agreement with our largest customer related to certain application platforms. This customer notifies us when it utilizes inventory and we recognize revenues from sales to this customer based upon these notifications.
Maintenance revenues are derived from customer support agreements generally entered into in connection with the initial application platform sales and subsequent renewals. Maintenance fees are typically for one to three year renewable periods and include the right to hardware repairs, 24-hour customer support, on-site support, advanced replacement of application platforms, and unspecified software updates when and if available for certain agreements. Maintenance revenues are recognized ratably over the term of the maintenance period. Payments for maintenance fees are generally made in advance and are included in deferred revenue. The associated costs of maintenance are expensed in the same period as incurred.
Contracts and/or customer purchase orders generally serve as the evidence of an arrangement. Shipping documents and consignment usage notifications are used to verify shipment or transfer of ownership, as applicable. We assess whether the sales price is fixed or determinable based on the payment terms associated with the transaction and whether the sales price is subject to refund or adjustment. We assess collectibility based primarily on the creditworthiness of the customer as determined by credit checks and analysis, as well as the customer's payment history.
In October 2009, the Financial Accounting Standards Board ("FASB") amended the authoritative guidance related to revenue recognition for arrangements with multiple deliverables and arrangements that include software elements. We elected to early adopt this guidance on a prospective basis for applicable transactions originating or materially modified on or after January 1, 2010, the start of the second fiscal quarter of our fiscal year 2010.
Under previous authoritative guidance, for revenue arrangements that contained multiple elements, such as the sale of both the product and post-sales support and/or extended warranty and related services element, in which software was not incidental to the product as a whole, we were required to determine the fair value of the undelivered elements based upon vendor-specific objective evidence ("VSOE") of fair value. VSOE was established through contractual post-sales support renewal rates. We used the residual fair value method to allocate the arrangement consideration to the product. For revenue arrangements that contained software elements that were not incidental to the product as a whole, and VSOE was not available for the undelivered elements, we deferred all revenue associated with the arrangement and recognized the revenue over the related service period.
Under the amended authoritative guidance for arrangements with multiple deliverables and arrangements that include software elements, we are required to determine if the software elements function together with the tangible product to deliver the tangible product's essential functionality. We determined that our software elements provide additional functionality but are not necessary to deliver the tangible product's essential functionality; as such, we are required to allocate the arrangement
30
consideration to the hardware and software elements based upon the relative selling price of the hardware and software deliverables. In such circumstances, we use a hierarchy to determine the selling price to be used for allocating revenue to deliverables: (i) VSOE, (ii) third-party evidence of selling price ("TPE") and (iii) best estimate of the selling price ("BESP"). VSOE generally exists only when we sell the deliverable separately and is the price actually charged by us for that deliverable. BESPs reflect our best estimates of what the selling prices of elements would be if they were sold regularly on a stand-alone basis.
Our software elements consist of software and software maintenance. Revenue associated with the software is recognized upon delivery, when VSOE is available for the undelivered software maintenance. Revenue associated with the software maintenance is recognized over the term of the maintenance period, which is generally one year. When VSOE is not available for the undelivered software maintenance, revenue associated with the software elements is deferred and recognized over the software maintenance period.
Our hardware elements generally consist of an application platform and post-sales support and/or an extended warranty. Revenue associated with the application platform is recognized upon delivery. We allocate revenue associated with the post-sales support and/or extended warranty based upon separately priced contractual rates for these elements. Revenue associated with the post-sales support and/or extended warranty is deferred and recognized over the support period, generally one to three years.
Inventories
We value inventory at the lower of cost or estimated market value, and determine cost on a first-in, first-out basis. We regularly review inventory quantities on hand and record a write-down for excess or obsolete inventory based primarily on our estimated forecast of product demand and anticipated production requirements in the near future. Any rapid technological changes and future product development could result in an increase in the amount of obsolete inventory quantities on hand. Agreements with certain of our customers include inventory protection provisions; however, these provisions may not provide us with complete protection from loss due to excess or obsolete inventory.
Product Warranty Obligations
We offer a standard warranty on our application platform solutions that generally provides for us to repair or replace any defective products for a period of up to 36 months after shipment. We reserve for the estimated costs to fulfill customer warranty obligations upon the recognition of the related revenue and record warranty expense as a component of cost of revenues.
Costs included in our standard warranty obligation include shipping, internal and external labor, and travel. Significant judgment and estimates are involved in estimating our warranty reserve. Although our application platform solutions primarily use standards-based technologies, certain of our application platform solutions incorporate proprietary technologies, which may increase our risks related to product warranty obligations. In the past we have experienced unexpected component failures in certain of our application platform solutions, which have required us to increase our product warranty accruals. At the time any unexpected component failure arises, we assess the costs to repair any defects and record what we believe to be an appropriate warranty obligation based on the information available. To the extent we may experience increased warranty claim activity, increased costs associated with servicing those claims, or use estimates that prove to be materially different from actual claims, our product warranty obligations may need to be increased, resulting in decreased gross margins.
31
Stock-Based Compensation
We measure stock-based compensation cost at the grant date, based on the fair value of the award, and recognize that cost as an expense over the employee's requisite service period (generally the vesting period of the equity award).
We determine the fair value of stock options on the grant date using an option pricing model. Such an option pricing model requires us to make judgments for certain assumptions used, in particular, the expected term of the option and the expected volatility over that term. We have determined the expected term based on analysis of our historical exercise and post-vesting cancellation behavior. We have determined the expected volatility based on a weighted average of the historical volatility of the market price of our common stock. In determining the amount of expense to be recorded, judgment is also required to estimate forfeitures of the awards based on the probability of employees completing the required service periods. Historical forfeitures are used as a starting point for developing our estimate of future forfeitures.
Goodwill and Intangible Assets
We review long-lived assets, including definite-lived intangible assets, to determine if any adverse conditions exist that would indicate impairment. Factors that could lead to an impairment of acquired customer relationships include a worsening in customer attrition rates compared to historical attrition rates, or lower than initially anticipated cash flows associated with customer relationships. We assess the recoverability of long-lived assets based on the projected undiscounted future cash flows estimated to be generated over the asset's remaining life. The amount of impairment, if any, is measured based on the excess of the carrying value over fair value. Fair value is generally calculated as the present value of estimated future cash flows using a risk-adjusted discount rate, which requires significant management judgment with respect to revenue and expense growth rates, and the selection and use of an appropriate discount rate.
Goodwill represents the excess purchase price over the fair value of the net tangible and intangible assets acquired. We review goodwill and long-lived assets, including definite-lived intangible assets, to determine if any adverse conditions exist that would indicate impairment. We review goodwill for impairment annually as of the fiscal year end date, and more frequently if certain indicators are present. Prior to performing the two step process in accordance with authoritative guidance, we review qualitative factors in accordance with recently issued authoritative guidance which we early adopted, to determine the likelihood of whether the fair value of the reporting unit was less than its carrying amount. These qualitative factors include, but are not limited to, changes in macroeconomic and industry conditions, deterioration of our financial performance and a sustained decrease in our stock price. If it is determined that it is more likely than not that the fair value of a reporting unit is greater than its carrying amount, we would not be required to perform the two-step goodwill impairment test for that reporting unit. If it is determined that the two-step process is necessary, we perform the first step of the impairment test by segregating our net assets into reporting units and comparing the carrying amounts of the assets to their fair values. If the carrying amount of a reporting unit exceeds its fair value, the second step of the goodwill impairment test is performed to measure the amount of impairment loss, if any. The second step compares the implied fair value of a reporting unit's goodwill with the carrying amount of that goodwill. If the carrying amount of a reporting unit's goodwill exceeds the implied fair value of that goodwill, an impairment loss is recognized in an amount equal to that excess.
32
Income Tax Asset Valuation
We record deferred tax assets and liabilities based on the net tax effects of tax credits, operating loss carryforwards and temporary differences between the carrying amounts of assets and liabilities for financial reporting purposes and the amounts used for income tax purposes. We then assess the likelihood that our deferred tax assets will be recovered from future taxable income and, to the extent we believe that recovery is not likely, we establish a valuation allowance. The valuation allowance is based on our estimate of future taxable income and the period over which our deferred tax assets will be recoverable. At September 30, 2011, we expected that the deferred tax assets will be recovered due to cumulative profits over the past three years, as well as our projection of future profitability. As such, we fully reduced the valuation allowance, which was recorded as a tax benefit in the year ended September 30, 2011.
Allowance for Doubtful Accounts
Management judgment is required in assessing the collectability of accounts receivable, for which we do not require collateral. We maintain allowances for doubtful accounts for estimated losses resulting from the inability of our customers to make required payments. In determining the adequacy of the allowance for doubtful accounts, management specifically analyzes individual accounts receivable, historical bad debt write-offs, customer concentrations, customer creditworthiness, current economic conditions, accounts receivable aging trends and the payment terms we extend to our customers. If the financial condition of our customers were to deteriorate, we may have to record additional allowances. The allowance for bad debts can vary depending on the level and timing of quarterly revenues as well as the timing of the resolution of specifically reserved doubtful accounts receivable, either through collection or write-off.
Discussion of Fiscal Years 2011 and 2010
The following data summarizes the results of our operations for the past two fiscal years, in thousands and as a percentage of net revenues.
| |
Year Ended September 30, | ||||||||||||||||||
|---|---|---|---|---|---|---|---|---|---|---|---|---|---|---|---|---|---|---|---|
| |
2011 | 2010 | Increase (Decrease) | ||||||||||||||||
| |
Dollars | % of Net Revenues |
Dollars | % of Net Revenues |
Dollars | Percentage | |||||||||||||
Net revenues |
$ | 272,468 | 100.0 | % | $ | 221,620 | 100.0 | % | $ | 50,848 | 22.9 | % | |||||||
Gross margin(a) |
30,932 | 11.4 | % | 25,472 | 11.5 | % | 5,460 | 21.4 | % | ||||||||||
Operating expenses(b)(c) |
24,548 | 9.0 | % | 23,931 | 10.8 | % | 617 | 2.6 | % | ||||||||||
Income from operations |
6,384 | 2.3 | % | 1,541 | 0.7 | % | 4,843 | 314.3 | % | ||||||||||
Net income(d) |
36,701 | 13.5 | % | 1,529 | 0.7 | % | 35,172 | 2300.3 | % | ||||||||||
- (a)
- Includes
approximately $0.1 million and $0.2 million related to stock-based compensation in 2011 and 2010, respectively.
- (b)
- Includes
approximately $0.8 million and $0.9 million related to stock-based compensation in 2011 and 2010, respectively.
- (c)
- Includes
$0.5 million related to a goodwill impairment charge in fiscal year 2011.
- (d)
- Includes approximately $30.9 million related to a change in deferred tax asset valuation allowance in 2011.
33
Net Revenues
The increase in net revenues during the year ended September 30, 2011 as compared to the year ended September 30, 2010 was primarily due to increased sales volumes with EMC, which increased by $49.5 million during the year ended September 30, 2011. This increase in sales to EMC was primarily the result of increased sales volumes as a result of our high volume business. Revenues from all other customers, excluding EMC and Tektronix, increased by $16.9 million during the year ended September 30, 2011, as compared to the year ended September 30, 2010, of which $10.6 million was attributable to revenues from new customers and $6.3 million was attributable to revenues from existing customers. These increases were partially offset by a $15.6 million decrease in sales to Tektronix. This decrease was due to their completion of a communications project during fiscal year 2010. Our sales to Tektronix are largely project-driven and are therefore volatile from period to period.
Gross Margin
Gross margin increased in the year ended September 30, 2011 as compared to the year ended September 30, 2010, primarily due to increased sales volumes to EMC. This increase in sales to EMC resulted in a decrease in gross margin as a percentage of net revenues as compared to the year ended September 30, 2010, as our high volume business with EMC carries a lower gross margin than our historical levels. However, our gross margin as a percentage of net revenues increased from 10.5% in the first quarter of fiscal year 2011 to 11.6% in the fourth quarter of fiscal year 2011. The increase in the gross margin percentages throughout fiscal year 2011 were partially associated with our high volume business having fixed integration fees, which were applied to lower average selling prices during year ended September 30, 2011 as compared to the year ended September 30, 2010, as well as improved gross margin percentages as a result of our leveraging of our manufacturing facilities.
To the extent that our high volume business with EMC increases as a percentage of our net revenues, our gross margin as a percentage of net revenues may decrease. We have pursued such opportunities in order to increase revenues and leverage those revenues over our existing infrastructure to improve operating margins.
Operating Expenses
The most significant components of our operating expenses are engineering and development, selling and marketing, and general and administrative expenses. The following table presents operating expenses during the periods indicated, in thousands and as a percentage of net revenues:
| |
Year Ended September 30, | |
|
||||||||||||||||
|---|---|---|---|---|---|---|---|---|---|---|---|---|---|---|---|---|---|---|---|
| |
2011 | 2010 | |
|
|||||||||||||||
| |
Increase (Decrease) | ||||||||||||||||||
| |
|
% of Net Revenues |
|
% of Net Revenues |
|||||||||||||||
| |
Dollars | Dollars | Dollars | Percentage | |||||||||||||||
Operating expenses: |
|||||||||||||||||||
Engineering and development |
$ | 6,385 | 2.3 | % | $ | 6,657 | 3.0 | % | $ | (272 | ) | (4.1 | )% | ||||||
Selling and marketing |
7,563 | 2.8 | % | 7,433 | 3.4 | % | 130 | 1.7 | % | ||||||||||
General and administrative |
8,766 | 3.2 | % | 8,286 | 3.7 | % | 480 | 5.8 | % | ||||||||||
Amortization of intangible asset |
1,329 | 0.5 | % | 1,555 | 0.7 | % | (226 | ) | (14.5 | )% | |||||||||
Impairment of goodwill |
505 | 0.2 | % | — | — | 505 | 100.0 | % | |||||||||||
Total operating expenses |
$ | 24,548 | 9.0 | % | $ | 23,931 | 10.8 | % | $ | 617 | 2.6 | % | |||||||
Engineering and Development
Engineering and development expenses consist primarily of salaries and related expenses for personnel engaged in engineering and development, fees paid to consultants and outside service
34
providers, material costs for prototype and test units and other expenses related to the design, development, testing and enhancements of our application platform solutions. We expense all of our engineering and development costs as they are incurred. The following table summarizes the most significant components of engineering and development expense for the periods indicated, in thousands and as a percentage of total engineering and development expense, and provides the changes in thousands and percentages:
| |
Year Ended September 30, | |
|
||||||||||||||||
|---|---|---|---|---|---|---|---|---|---|---|---|---|---|---|---|---|---|---|---|
| |
2011 | 2010 | |
|
|||||||||||||||
| |
Increase (Decrease) | ||||||||||||||||||
| |
|
% of Expense Category |
|
% of Expense Category |
|||||||||||||||
| |
Dollars | Dollars | Dollars | Percentage | |||||||||||||||
Engineering and development: |
|||||||||||||||||||
Compensation and related expenses |
$ | 4,743 | 74.3 | % | $ | 4,602 | 69.1 | % | $ | 141 | 3.1 | % | |||||||
Stock-based compensation |
112 | 1.8 | % | 168 | 2.5 | % | (56 | ) | (33.3 | )% | |||||||||
Prototype |
426 | 6.7 | % | 1,026 | 15.4 | % | (600 | ) | (58.5 | )% | |||||||||
Consulting and professional services |
556 | 8.7 | % | 504 | 7.6 | % | 52 | 10.3 | % | ||||||||||
Other |
548 | 8.5 | % | 357 | 5.4 | % | 191 | 53.5 | % | ||||||||||
Total engineering and development |
$ | 6,385 | 100.0 | % | $ | 6,657 | 100.0 | % | $ | (272 | ) | (4.1 | )% | ||||||
Engineering and development expenses decreased in the year ended September 30, 2011, as compared to the year ended September 30, 2010, primarily due to decreases in prototype expenses and stock-based compensation, partially offset against an increase in compensation and related expenses. Prototype and consulting and professional services expenses tend to fluctuate based on the status of our development projects which are in process at any given time. We expect that prototype and consulting and professional services costs will continue to be variable and could fluctuate depending on the timing and magnitude of our development projects. The decrease in stock-based compensation was primarily due to the fact that certain stock options granted in prior periods reached the end of their vesting periods during the year ended September 30, 2011. Compensation and related expenses increased partially due to an increase in salaries and wages, which was the result of planned salary increases that took effect during the fourth quarter of fiscal 2010, as well as an increase in variable compensation, which was directly related to the improved results of operations.
Selling and Marketing
Selling and marketing expenses consist primarily of salaries and commissions for personnel engaged in sales and marketing, and costs associated with our marketing programs, which include costs associated with our attendance at trade shows, public relations, product literature costs, web site enhancements, and travel. The following table summarizes the most significant components of selling
35
and marketing expense for the periods indicated, in thousands and as a percentage of total selling and marketing expense, and provides the changes in thousands and percentages:
| |
Year Ended September 30, | |
|
||||||||||||||||
|---|---|---|---|---|---|---|---|---|---|---|---|---|---|---|---|---|---|---|---|
| |
2011 | 2010 | |
|
|||||||||||||||
| |
Increase (Decrease) | ||||||||||||||||||
| |
|
% of Expense Category |
|
% of Expense Category |
|||||||||||||||
| |
Dollars | Dollars | Dollars | Percentage | |||||||||||||||
Selling and marketing: |
|||||||||||||||||||
Compensation and related expenses |
$ | 5,721 | 75.6 | % | $ | 5,577 | 75.0 | % | $ | 144 | 2.6 | % | |||||||
Stock-based compensation |
306 | 4.1 | % | 325 | 4.4 | % | (19 | ) | (5.8 | )% | |||||||||
Marketing programs |
403 | 5.3 | % | 392 | 5.3 | % | 11 | 2.8 | % | ||||||||||
Travel |
332 | 4.4 | % | 351 | 4.7 | % | (19 | ) | (5.4 | )% | |||||||||
Other |
801 | 10.6 | % | 788 | 10.6 | % | 13 | 1.6 | % | ||||||||||
Total selling and marketing |
$ | 7,563 | 100.0 | % | $ | 7,433 | 100.0 | % | $ | 130 | 1.7 | % | |||||||
Selling and marketing expenses increased in the year ended September 30, 2011, as compared to the year ended September 30, 2010, primarily due to increases in compensation and related expenses, partially offset by decreases in stock-based compensation and travel expenses. The increase in compensation and related expenses was primarily attributed to an increase in variable compensation in the year ended September 30, 2011, which was directly related to the improved results of operations. The decrease in stock-based compensation was primarily due to the fact that certain stock options granted in prior periods reached the end of their vesting periods during the year ended September 30, 2011. The decrease in travel expenses was primarily attributable to us realigning of our sales team to focus on our core markets, which has reduced our travel requirements.
General and Administrative
General and administrative expenses consist primarily of salaries and other related costs for executive, finance, information technology and human resources personnel; professional services, which include legal, accounting, audit and tax fees; and director and officer insurance. The following table summarizes the most significant components of general and administrative expense for the periods indicated, in thousands and as a percentage of total general and administrative expense, and provides the changes in thousands and percentages:
| |
Year Ended September 30, | |
|
||||||||||||||||
|---|---|---|---|---|---|---|---|---|---|---|---|---|---|---|---|---|---|---|---|
| |
2011 | 2010 | |
|
|||||||||||||||
| |
Increase (Decrease) | ||||||||||||||||||
| |
|
% of Expense Category |
|
% of Expense Category |
|||||||||||||||
| |
Dollars | Dollars | Dollars | Percentage | |||||||||||||||
General and administrative: |
|||||||||||||||||||
Compensation and related expenses |
$ | 4,954 | 56.5 | % | $ | 4,715 | 57.0 | % | $ | 239 | 5.1 | % | |||||||
Stock-based compensation |
340 | 3.9 | % | 435 | 5.2 | % | (95 | ) | (21.8 | )% | |||||||||
Consulting and professional services |
2,137 | 24.4 | % | 1,820 | 22.0 | % | 317 | 17.4 | % | ||||||||||
Other |
1,335 | 15.2 | % | 1,316 | 15.8 | % | 19 | 1.4 | % | ||||||||||
Total general and administrative |
$ | 8,766 | 100.0 | % | $ | 8,286 | 100.0 | % | $ | 480 | 5.8 | % | |||||||
General and administrative increased in the year ended September 30, 2011, as compared to the year ended September 30, 2010, primarily due to increases in compensation and related expenses and consulting and professional services, partially offset by decreases in stock-based compensation. The increase in compensation and related expenses was primarily due to an increase in variable compensation, which was directly related to the improved results of operations as well as an increase in
36
salaries, which was the result of planned salary increases that took effect during the fourth quarter of fiscal 2010. The increase in consulting and professional services was primarily attributable to an increase in professional service expenses associated with the acquisition and integration of our acquired operations in Ireland (see Note 3 in the notes to the consolidated financial statements for details regarding the acquisition) as well as certain ongoing professional expenses attributable to our operations in Ireland. The decrease in stock-based compensation was primarily due to the fact that certain stock options granted in prior periods reached the end of their vesting periods during the year ended September 30, 2011.
Amortization of Intangible Asset
Amortization of the intangible asset decreased to $1.3 million for the year ended September 30, 2011, as compared to $1.6 million for the year ended September 30, 2010. Amortization expense for the intangible asset decreases annually over its useful life to reflect the fact that the economic benefit expected to be received from the intangible asset declines over time.
Impairment of Goodwill
During the year ended September 30, 2011, we performed our annual impairment review, which required us to determine the fair value of the reporting unit to which goodwill was allocated. We estimated the fair value of the reporting unit utilizing industry accepted valuation techniques that included the present value of estimated future cash flows using a risk-adjusted discount rate, and a market multiple approach, which considered our market capitalization adjusted for a control premium. Step one of this assessment resulted in the carrying value of the reporting unit exceeding the fair value. This difference between the carrying value of the reporting unit and the fair value was primarily attributable to our reduction of our deferred income tax valuation allowance as of September 30, 2011, which increased the carrying value by approximately $30.9 million. In step two of the impairment analysis, we compared the implied fair value of goodwill to its carrying value. After measuring the fair value of the reporting unit's assets and liabilities, the implied fair value of goodwill was determined to be zero. Consequently, we determined that goodwill was fully impaired; resulting in an impairment charge of $505,000 for the year ended September 30, 2011.
Although we impaired the goodwill associated with our acquisition of the integration operations of Multis Limited, we have realized and continue to realize the benefits of the acquisition, which has resulted in lower costs of manufacturing compared to historically using a contract manufacturer.
Interest and Other Income (Expense), net
Interest and other income (expense), net, totaled $(296,000) of expense for the year ended September 30, 2011, compared to $(23,000) of expense for the year ended September 30, 2010. This change was primarily due to foreign currency exchange losses of $(223,000) recorded during the year ended September 30, 2011 as compared to $(10,000) recorded during the year ended September 30, 2010. These losses primarily related to value-added tax ("VAT") refunds receivable. The refundable VAT amounts, which we pay on products and services purchased from our vendors in the European Union ("EU"), are denominated in Euros. While these VAT amounts are refundable to us, we are exposed to foreign currency exchange gains and losses between the time at which we pay the VAT on certain purchases and the time at which we receive the VAT refund from foreign tax authorities. The foreign currency losses recorded during the year ended September 30, 2011 increased primarily as a result of fluctuations in the foreign currency exchange markets, specifically the Euro. Additionally, we have increased our purchasing of materials from vendors within the EU as a result of our acquisition (see Note 3 in the notes to the consolidated financial statements for details regarding the acquisition), which has resulted in higher VAT receivable amounts that are subject to foreign currency changes.
37
Income tax expense (benefit)
The benefit from income taxes for the year ended September 30, 2011 was $(30,613,000) as compared to a benefit of $(11,000) recorded for the year ended September 30, 2010. The benefit from income taxes recorded for the year ended September 30, 2011 was primarily the result of the reversal of our deferred income tax valuation allowance. In accordance with authoritative guidance related to income taxes, we evaluated the positive and negative evidence of the realizability of our deferred income taxes, which are comprised primarily of federal net operating loss ("NOL") carryforwards. Prior to September 30, 2011 we had a full valuation allowance recorded on our deferred income taxes as we did not expect to realize the benefits of our deferred income taxes. As of September 30, 2011, we expected to realize the benefits of our NOL carryforwards in future periods based upon our cumulative profits over the past three years as well as our projected future earnings. As such, we removed our deferred tax asset valuation allowance as of September 30, 2011. The benefit from income taxes recorded for the year ended September 30, 2010 was primarily related to estimated tax refunds associated with federal alternative minimum tax payments made in previous fiscal years.
Although we have significant net operating loss carryforwards which can be used to offset taxable income, we are still subject to state taxes in various jurisdictions where we do not have net operating loss carryforwards or where states have suspended the use of net operating loss carryforwards to offset taxable income.
Discussion of Fiscal Years 2010 and 2009
The following data summarizes the results of our operations for fiscal 2010 and fiscal 2009, in thousands and as a percentage of net revenues.
| |
Year Ended September 30, | ||||||||||||||||||
|---|---|---|---|---|---|---|---|---|---|---|---|---|---|---|---|---|---|---|---|
| |
2010 | 2009 | |
|
|||||||||||||||
| |
Increase (Decrease) | ||||||||||||||||||
| |
|
% of Net Revenues |
|
% of Net Revenues |
|||||||||||||||
| |
Dollars | Dollars | Dollars | Percentage | |||||||||||||||
Net revenues |
$ | 221,620 | 100.0 | % | $ | 148,722 | 100.0 | % | $ | 72,898 | 49.0 | % | |||||||
Gross margin(a) |
25,472 | 11.5 | % | 22,521 | 15.1 | % | 2,951 | 13.1 | % | ||||||||||
Operating expenses(b) |
23,931 | 10.8 | % | 25,795 | 17.3 | % | (1,864 | ) | (7.2 | )% | |||||||||
Income (loss) from operations |
1,541 | 0.7 | % | (3,274 | ) | (2.2 | )% | 4,815 | 147.1 | % | |||||||||
Net income (loss) |
1,529 | 0.7 | % | (3,198 | ) | (2.2 | )% | 4,727 | 147.8 | % | |||||||||
- (a)
- Includes
approximately $0.2 million and $0.1 million related to stock-based compensation in 2010 and 2009, respectively.
- (b)
- Includes approximately $0.9 million and $1.2 million related to stock-based compensation in 2010 and 2009, respectively.
Net Revenues
The $72.9 million increase in net revenues during the year ended September 30, 2010 as compared to the year ended September 30, 2009 was primarily the result of increased sales volume to our largest customers, in particular with EMC, combined with lower overall sales volumes in the year ended September 30, 2009 due to the global economic downturn. Our sales to EMC increased $60.8 million in the year ended September 30, 2010 as compared to the year ended September 30, 2009, which was primarily the result of our 2009 design win, which began in the year ended September 30, 2010. Our sales to Tektronix increased by $25.5 million in the year ended September 30, 2010, which was primarily the result of a large telecommunications project that Tektronix was completing during the year ended September 30, 2010. The increase in revenues from EMC and Tektronix was partially offset by a decrease of $9.0 million in revenues from other customers and an additional decrease of $4.4 million in
38
non-strategic, transactional revenues which we transitioned away from during the year ended September 30, 2010.
Gross Margin
Gross margin increased in the year ended September 30, 2010 as compared to the year ended September 30, 2009, primarily due to increased sales volumes to EMC and Tektronix.
Gross margin as a percentage of net revenues decreased for the year ended September 30, 2010, as compared to the year ended September 30, 2009. The decrease from the prior year was primarily due to changes in customer and product mix, which were impacted by our high volume business with EMC. The first shipments of product related to this business occurred (and the related revenues were recognized) during the three months ended December 31, 2009 and continued to ramp up during the year ended September 30, 2010. In addition, certain planned price decreases with EMC on certain legacy products took effect during the year ended September 30, 2010.
Operating Expenses
The following table presents operating expenses during the periods indicated, in thousands and as a percentage of net revenues:
| |
Year Ended September 30, | |
|
||||||||||||||||
|---|---|---|---|---|---|---|---|---|---|---|---|---|---|---|---|---|---|---|---|
| |
2010 | 2009 | |
|
|||||||||||||||
| |
Increase (Decrease) | ||||||||||||||||||
| |
|
% of Net Revenues |
|
% of Net Revenues |
|||||||||||||||
| |
Dollars | Dollars | Dollars | Percentage | |||||||||||||||
Operating expenses: |
|||||||||||||||||||
Engineering and development |
$ | 6,657 | 3.0 | % | $ | 6,345 | 4.2 | % | $ | 312 | 4.9 | % | |||||||
Selling and marketing |
7,433 | 3.4 | % | 8,213 | 5.5 | % | (780 | ) | (9.5 | )% | |||||||||
General and administrative |
8,286 | 3.7 | % | 9,088 | 6.1 | % | (802 | ) | (8.8 | )% | |||||||||
Amortization of intangible asset |
1,555 | 0.7 | % | 1,756 | 1.2 | % | (201 | ) | (11.4 | )% | |||||||||
Settlement of acquisition dispute |
— | — | 393 | 0.3 | % | (393 | ) | (100.0 | )% | ||||||||||
Total operating expenses |
$ | 23,931 | 10.8 | % | $ | 25,795 | 17.3 | % | $ | (1,864 | ) | (7.2 | )% | ||||||
Engineering and Development
The following table summarizes the most significant components of engineering and development expense for the periods indicated, in thousands and as a percentage of total engineering and development expense, and provides the changes in thousands and percentages:
| |
Year Ended September 30, | |
|
||||||||||||||||
|---|---|---|---|---|---|---|---|---|---|---|---|---|---|---|---|---|---|---|---|
| |
2010 | 2009 | |
|
|||||||||||||||
| |
Increase (Decrease) | ||||||||||||||||||
| |
|
% of Expense Category |
|
% of Expense Category |
|||||||||||||||
| |
Dollars | Dollars | Dollars | Percentage | |||||||||||||||
Engineering and development: |
|||||||||||||||||||
Compensation and related expenses |
$ | 4,602 | 69.1 | % | $ | 4,040 | 63.6 | % | $ | 562 | 13.9 | % | |||||||
Stock-based compensation |
168 | 2.5 | % | 246 | 3.9 | % | (78 | ) | (31.7 | )% | |||||||||
Prototype |
1,026 | 15.4 | % | 977 | 15.4 | % | 49 | 5.0 | % | ||||||||||
Consulting and professional services |
504 | 7.6 | % | 569 | 9.0 | % | (65 | ) | (11.4 | )% | |||||||||
Other |
357 | 5.4 | % | 513 | 8.1 | % | (156 | ) | (30.4 | )% | |||||||||
Total engineering and development |
$ | 6,657 | 100.0 | % | $ | 6,345 | 100.0 | % | $ | 312 | 4.9 | % | |||||||
39
Engineering and development expenses increased in the year ended September 30, 2010, as compared to the year ended September 30, 2009, primarily due to increases in compensation and related expenses and prototype expenses, partially offset by decreases in consulting and professional services, stock-based compensation and other expenses. Compensation and related expenses increased primarily due to an increase in headcount from 37 at September 30, 2009 to 40 at September 30, 2010 and an increase in variable compensation, which was directly related to the results of operations. Prototype and consulting and professional services expenses tend to fluctuate based on the status of our development projects which are in process at any given time. Stock-based compensation expense decreased primarily due to variations in the timing and fair values of stock options awarded in the current year and prior years, and the periods over which the expenses related to those awards have been recognized.
Selling and Marketing
The following table summarizes the most significant components of selling and marketing expense for the periods indicated, in thousands and as a percentage of total selling and marketing expense, and provides the changes in thousands and percentages:
| |
Year Ended September 30, | |
|
||||||||||||||||
|---|---|---|---|---|---|---|---|---|---|---|---|---|---|---|---|---|---|---|---|
| |
2010 | 2009 | |
|
|||||||||||||||
| |
Increase (Decrease) | ||||||||||||||||||
| |
|
% of Expense Category |
|
% of Expense Category |
|||||||||||||||
| |
Dollars | Dollars | Dollars | Percentage | |||||||||||||||
Selling and marketing: |
|||||||||||||||||||
Compensation and related expenses |
$ | 5,577 | 75.0 | % | $ | 6,171 | 75.1 | % | $ | (594 | ) | (9.6 | )% | ||||||
Stock-based compensation |
325 | 4.4 | % | 291 | 3.5 | % | 34 | 11.7 | % | ||||||||||
Marketing programs |
392 | 5.3 | % | 574 | 7.0 | % | (182 | ) | (31.7 | )% | |||||||||
Travel |
351 | 4.7 | % | 344 | 4.2 | % | 7 | 2.0 | % | ||||||||||
Other |
788 | 10.6 | % | 833 | 10.2 | % | (45 | ) | (5.4 | )% | |||||||||
Total selling and marketing |
$ | 7,433 | 100.0 | % | $ | 8,213 | 100.0 | % | $ | (780 | ) | (9.5 | )% | ||||||
Selling and marketing expenses decreased in the year ended September 30, 2010, as compared to the year ended September 30, 2009, primarily due to decreases in compensation and related expenses and marketing program expenses. The decrease in compensation and related expenses was primarily attributed to a decrease in commission expense, as well as a decrease in headcount from 43 at September 30, 2009 to 37 at September 30, 2010. The decrease in commission expense was primarily due to changes in the metrics and targets we use to determine commission payouts, as well as the decrease in headcount. The decrease in marketing programs was primarily attributed to decreases in market research, public relations, and trade show related expenses incurred during the year ended September 30, 2010 as compared to the year ended September 30, 2009, in an effort to manage operating expenses.
40
General and Administrative
The following table summarizes the most significant components of general and administrative expense for the periods indicated, in thousands and as a percentage of total general and administrative expense, and provides the changes in thousands and percentages:
| |
Year Ended September 30, | |
|
||||||||||||||||
|---|---|---|---|---|---|---|---|---|---|---|---|---|---|---|---|---|---|---|---|
| |
2010 | 2009 | |
|
|||||||||||||||
| |
Increase (Decrease) | ||||||||||||||||||
| |
|
% of Expense Category |
|
% of Expense Category |
|||||||||||||||
| |
Dollars | Dollars | Dollars | Percentage | |||||||||||||||
General and administrative: |
|||||||||||||||||||
Compensation and related expenses |
$ | 4,715 | 57.0 | % | $ | 4,384 | 48.2 | % | $ | 331 | 7.6 | % | |||||||
Stock-based compensation |
435 | 5.2 | % | 630 | 6.9 | % | (195 | ) | (31.0 | )% | |||||||||
Consulting and professional services |
1,820 | 22.0 | % | 2,488 | 27.4 | % | (668 | ) | (26.8 | )% | |||||||||
Director and officer insurance |
153 | 1.8 | % | 208 | 2.3 | % | (55 | ) | (26.4 | )% | |||||||||
Other |
1,163 | 14.0 | % | 1,378 | 15.2 | % | (215 | ) | (15.6 | )% | |||||||||
Total general and administrative |
$ | 8,286 | 100.0 | % | $ | 9,088 | 100.0 | % | $ | (802 | ) | (8.8 | )% | ||||||
General and administrative expenses decreased in the year ended September 30, 2010, as compared to the year ended September 30, 2009, primarily due to decreases in consulting and professional services, stock-based compensation expenses and other expenses, partially offset by an increase in compensation and related expenses. The decrease in consulting and professional services was primarily attributed to a decrease in legal expenses incurred during the year ended September 30, 2010 as compared to the year ended September 30, 2009. The decrease in legal expenses was primarily due to costs incurred during the year ended September 30, 2009 related to the acquisition dispute and arbitration associated with the acquisition of Alliance Systems. The decrease in stock-based compensation was primarily due to the fact that certain stock options granted in prior periods reached the end of their vesting periods during the year ended September 30, 2010. The decrease in other expenses was primarily due to a decrease in bad debt expense during the year ended September 30, 2010 as compared to the year ended September 30, 2009. Compensation and related expenses increased primarily due to an increase in variable compensation, which was directly related to the results of operations.
Amortization of Intangible Asset
Amortization of the intangible asset decreased to $1.6 million for the year ended September 30, 2010, as compared to $1.8 million for the year ended September 30, 2009. Amortization expense for the intangible asset decreases annually over its useful life to reflect the fact that the economic benefit expected to be received from the intangible asset declines over time.
Settlement of Acquisition Dispute
The acquisition of Alliance Systems was structured to include an adjustment to decrease the purchase price based on the net working capital of Alliance Systems as of October 11, 2007, as defined in the merger agreement, and therefore approximately $4.0 million of the cash paid was contingently returnable to us and therefore previously recorded as contingently returnable acquisition consideration. The former Alliance Systems shareholders disputed the amounts claimed by us under this provision of the merger agreement. In September 2009, we engaged in arbitration with the former Alliance Systems shareholders to resolve the disputed claims as provided for in the merger agreement. In October 2009, the arbitrator's decision was rendered. As a result, approximately $3.6 million of the contingently returnable consideration was returned to us from escrow funds on November 3, 2009; as such, this amount was recorded as refundable acquisition consideration in our consolidated balance sheet as of
41
September 30, 2009. The $393,000 not returned to us was recorded as settlement of acquisition dispute in the fiscal year 2009 statement of operations.
Interest and Other Income (Expense), net
Interest and other income (expense), net totaled $(23,000) of expense for the year ended September 30, 2010 as compared to $76,000 of income for the year ended September 30, 2009. The change was primarily due to a decrease of $150,000 in interest income, primarily attributable to lower cash balances and lower interest rates on the cash balances held by us during the year ended September 30, 2010 as compared to the year ended September 30, 2009. The decrease in interest income was partially offset by a $55,000 decrease in the foreign currency exchange loss incurred during the year ended September 30, 2010, as compared to the year ended September 30, 2009. These gains and losses relate primarily to VAT refunds receivable.
Income tax expense (benefit)
The benefit from income taxes recorded for the year ended September 30, 2010 of $(11,000) was primarily related to estimated tax refunds associated with federal alternative minimum tax ("AMT") payments made in previous fiscal years. The benefit of $125,000 was partially offset by a provision for income taxes of $114,000 recorded for the year ended September 30, 2010 for estimated state income tax liabilities. There was no provision for income taxes for the year ended September 30, 2009 because we generated a taxable loss for the year.
Liquidity and Capital Resources
The following table summarizes cash flow activities for the periods indicated (in thousands):
| |
Year Ended September 30, | |||||||||
|---|---|---|---|---|---|---|---|---|---|---|
| |
2011 | 2010 | 2009 | |||||||
Net income (loss) |
$ | 36,701 | $ | 1,529 | $ | (3,198 | ) | |||
Non-cash adjustments to net income (loss) |
(27,071 | ) | 3,539 | 4,477 | ||||||
Changes in working capital |
(2,322 | ) | (14,441 | ) | 11,587 | |||||
Net cash provided by (used in) operating activities |
7,308 |
(9,373 |
) |
12,866 |
||||||
Net cash (used in) provided by investing activities |
(2,278 |
) |
2,727 |
(938 |
) |
|||||
Net cash (used in) provided by financing activities |
(501 | ) | 930 | (892 | ) | |||||
Net increase (decrease) in cash and cash equivalents |
4,529 |
(5,716 |
) |
11,036 |
||||||
Cash and cash equivalents at beginning of year |
15,323 | 21,039 | 10,003 | |||||||
Cash and cash equivalents at end of year |
$ |
19,852 |
$ |
15,323 |
$ |
21,039 |
||||
Operating Activities
Cash provided by operating activities of $7.3 million during the year ended September 30, 2011 was primarily the result of the net income for the period and the impact of non-cash adjustments to net income, partially offset by the net impact of changes in working capital. Non-cash adjustments to net income consisted primarily of the change in the valuation allowance for deferred tax assets of $30.9 million, impairment of goodwill of $505,000, depreciation and amortization expense of $2.3 million and stock-based compensation of $890,000. Of the $2.3 million net changes in working capital, $9.2 million was the result of an increase in accounts receivable, $3.0 million was due to an increase in VAT receivable and $1.2 million was due to an increase in inventories, which were partially offset by a $6.9 million increase in accounts payable, $1.1 million increase in accrued expenses as well as a $2.0 million increase in deferred revenue. The increase in the VAT receivable balance was primarily related to an increase in purchasing during the year ended September 30, 2011 from vendors that are located within the EU in support of our new manufacturing facility in Galway, Ireland. Changes in working capital in all periods are also impacted by variations in the timing and magnitude of cash receipts, cash disbursements, inventory receipts and invoicing to customers.
42
Cash used in operating activities of $9.4 million during the year ended September 30, 2010 was primarily the result of net cash used in changes in working capital partially offset by net income for the period and the impact of non-cash adjustments to net income. Non-cash adjustments to net income consisted primarily of depreciation and amortization expense of $2.5 million and stock-based compensation of $1.1 million. Of the $14.4 million net changes in working capital, $10.1 million was due to an increase in inventories and $6.9 million was the result of an increase in accounts receivable, which were partially offset by a $2.2 million increase in accounts payable and a $1.3 million increase in deferred revenue. The increases in inventories and accounts receivable were primarily related to increasing net revenues during the year ended September 30, 2010, in particular the ramping up of our high volume business with EMC.
Cash provided by operating activities of $12.9 million during the year ended September 30, 2009 was the result of net cash provided by changes in working capital and the impact of non-cash adjustments to net loss, partially offset by the net loss for the period. Non-cash adjustments to net loss consisted primarily of depreciation and amortization expense of $2.7 million and stock-based compensation of $1.3 million. Of the $11.6 million net changes in working capital, $8.3 million resulted from a decrease in inventories. The change in inventories was related to the depletion of inventories on hand and lower purchases during the year ended September 30, 2009, resulting from the downward trend in revenues, and efforts we undertook to minimize inventory quantities on hand. Changes in working capital during the year ended September 30, 2009 also included the receipt of $2.5 million of income tax refunds related to taxes paid by Alliance Systems in prior years.
Investing Activities
Cash used in investing activities during the year ended September 30, 2011 was due to the use of $1.8 million of cash for purchases of property and equipment, which was partially related to the reconfiguration of our Canton, Massachusetts and Plano, Texas facilities as well as the use of $505,000 related to our acquisition of the integration operations of Multis Limited (see Note 3 in the notes to the consolidated financial statements for details regarding the acquisition).
Cash provided by investing activities during the year ended September 30, 2010 was primarily the result of the receipt of the $3.6 million in refundable acquisition consideration, which was a return of cash we originally paid in connection with our acquisition of Alliance Systems (see Note 3 in the notes to the consolidated financial statements for details regarding the acquisition). This increase in cash was partially offset by the use of $0.9 million of cash for purchases of property and equipment.
Cash used in investing activities during the year ended September 30, 2009 consisted of the use of approximately $0.9 million of cash for purchases of property and equipment.
Financing Activities
Cash provided by financing activities during the year ended September 30, 2011 consisted primarily of the use of $0.6 million to repurchase shares of our common stock, partially offset by the receipt of $0.1 million as the result of employee stock option exercises.
Cash provided by financing activities during the year ended September 30, 2010 consisted primarily of the receipt of $1.1 million as the result of employee stock option exercises, partially offset by $0.2 million used to repurchase shares of our common stock.
Cash used in financing activities during the year ended September 30, 2009 consisted primarily of $1.1 million used to repurchase shares of our common stock, partially offset by the receipt of $0.2 million as the result of stock option exercises and purchases under the Employee Stock Purchase Plan.
43
On June 12, 2008, our Board of Directors authorized the repurchase of up to $5 million of our common stock through a share repurchase program. As authorized by the program, shares may be purchased in the open market or through privately negotiated transactions, in a manner consistent with applicable securities laws and regulations. This stock repurchase program does not obligate us to acquire any specific number of shares, does not have an expiration date, and may be terminated at any time by our Board of Directors. All repurchases are expected to be funded from our current cash balances or from cash generated from operations. To facilitate repurchases of shares under this program, we have established Rule 10b5-1 plans intended to comply with the requirements of Rule 10b5-1 and Rule 10b-18 under the Securities Exchange Act of 1934. A Rule 10b5-1 plan permits the repurchase of shares by a company at times when it otherwise might be prevented from doing so under insider trading laws or because of company blackout periods, provided that the plan is adopted when the company is not aware of material non-public information. Pursuant to the plan, a broker designated by us has the authority to repurchase shares, in accordance with the terms of the plan, without further direction from us. The amount and timing of specific repurchases are subject to the terms of the plan and market conditions. Upon the expiration of the first 10b5-1 plan on November 7, 2008, we suspended repurchases of our common stock. We resumed the stock repurchase program on March 16, 2009 under a new 10b5-1 plan, as authorized by the Board of Directors. As a result of the increase in the price of our common stock, we suspended our repurchase program in November 2010. Between March 2009 and November 2010, we repurchased a total of 2,581,546 shares of our common stock at an average cost of $0.84 per share.
On June 13, 2011 our Board of Directors authorized the continuation of the repurchase program for up to $2 million of our common stock from time to time on the open market or in non-solicited privately negotiated transactions. During the three months and year ended September 30, 2011, we repurchased 526,342 shares of our common stock at an average cost of $1.19 per share. From the inception of the share repurchase program through September 30, 2011, we have repurchased 3,107,888 shares of our common stock at an average cost of $0.90 per share. As of September 30, 2011, the maximum dollar value that may yet be used for purchases under the program was $1,373,000; however the repurchase program has been suspended as a result of the current hard drive supply interruptions due to the flooding in Thailand as we expect to be utilizing our cash for advanced purchases of inventory during this time.
Line of Credit
On October 11, 2007, we entered into a Loan and Security Agreement (the "Loan Agreement") with Silicon Valley Bank (the "Bank") to establish a line of credit from which we could borrow. On August 5, 2008, we entered into the First Loan Modification Agreement (the "First Modification "). The First Modification amended the Loan Agreement to extend its term to August 5, 2010, and to change the amount of the revolving loan facility to $10 million.
On February 5, 2010, we entered into an Amended and Restated Loan and Security Agreement. This agreement amended the Loan Agreement to extend its term to February 4, 2012, and to change the interest rate on the line to one half of a point (0.50%) above the Prime Rate with interest payable monthly. The Prime Rate is the rate announced from time to time by the Bank.
As a result of the industry-wide hard drive supply shortage, we have accelerated our purchasing of materials in an effort to meet future demand. As a result, on October 26, 2011 we issued a letter of credit for $8 million to one of our largest suppliers to supplement our credit limit with this supplier. This letter of credit expires on January 25, 2012 and reduces the amount available under our existing line of credit. Because we will continue to purchase inventory on an accelerated schedule to meet expected demand for our second fiscal quarter, our working capital requirements may require us to draw on our line of credit facility. As a result, on December 13, 2011, we entered into an amendment to increase our existing line of credit facility with SVB from $10 million to $18 million and to extend its
44
term to March 31, 2012. Amounts borrowed under the Line of Credit will bear interest at a rate equal to the greater of the floating Prime Rate or 3.25%, payable monthly. The "Prime Rate" is the rate announced from time to time by the Wall Street Journal as its "prime rate." We are also subject to an unused line of credit fee of 0.30% per annum, payable monthly, and to certain financial covenants relating to liquidity and minimum operating cash flows per quarter. As of the date of issuance of these financial statements, we had $10 million in available credit on this facility as a result of the outstanding $8 million letter of credit.
Contractual Obligations and Commitments
On March 31, 2011, we entered into an Eighth Amendment to the Lease Agreement (the "Amendment") with Great Point Investors, LLC that replaces and extends our previous lease for 52,000 square feet of manufacturing and office space located at 25 Dan Road, Canton, Massachusetts 02021.
The Amendment has an initial term of 78 months, with two available extension options of five years, each at our election. The cumulative base rent under the initial term of the Amendment totals $2,590,000, with rent payable monthly. Under the terms of the Amendment, we are responsible for the payment of additional rent items, which include property taxes and operating costs, payable monthly.
As part of the acquisition of the integration business of Multis Limited (see Note 3 in the notes to the consolidated financial statements for details regarding the acquisition), we entered into a lease agreement with Multis on January 18, 2011 to lease approximately 20,000 square feet of manufacturing and warehousing space in Galway, Ireland for an initial term of 59 months. Under the terms of the lease agreement, we have the option to terminate the lease agreement on January 18, 2014, the third anniversary of the agreement. The cumulative base rent under the initial term under the lease agreement totals $1,666,000, with rent payable quarterly.
The following table sets forth certain information concerning our obligations and commitments to make certain payments, as of September 30, 2011 (in thousands):
| |
Payments Due by Period | |||||||||||||||
|---|---|---|---|---|---|---|---|---|---|---|---|---|---|---|---|---|
| |
Less than 1 Year |
1-3 Years | 4-5 Years | After 5 Years |
Total | |||||||||||
Operating leases |
$ | 1,242 | $ | 2,509 | $ | 2,187 | $ | 1,009 | $ | 6,947 | ||||||
Capital lease obligation |
21 | 7 | — | — | 28 | |||||||||||
Total |
$ | 1,263 | $ | 2,516 | $ | 2,187 | $ | 1,009 | $ | 6,975 | ||||||
Our future liquidity and capital requirements will depend upon numerous factors, including:
- •
- the timing and size of orders from our customers;
- •
- the timeliness of receipts of payments from our customers;
- •
- the timing and size of our purchase of inventories;
- •
- our ability to enter into partnerships with OEMs and ISVs;
- •
- the level of success of our customers in selling systems that include our application platform solutions;
- •
- the costs and timing of product engineering efforts and the success of these efforts; and
- •
- market developments.
We believe that our available cash resources, cash that we expect to generate from sales of our application platform solutions and services, and cash available through the Silicon Valley Bank line of
45
credit will be sufficient to meet our operating and capital requirements through at least the next twelve months. Although our line of credit with Silicon Valley Bank expires in March 2012, we expect that we will renew or replace our line of credit with a similar credit facility.
In the event that our available cash resources and the Silicon Valley Bank line of credit are not sufficient, or if an event of default occurs, such as failure to achieve certain financial covenants, that limits our ability to borrow under the line of credit, we may need to raise additional funds. We may in the future seek to raise additional funds through borrowings, public or private equity financings or from other sources. On April 28, 2010, we filed a Shelf Registration Statement on Form S-3 (the "Shelf Registration Statement"), pursuant to which we may sell, from time to time, any combination of securities under the prospectus included in the Shelf Registration Statement, for an aggregate offering price of up to $40,000,000. Under the Shelf Registration Statement, we may offer, from time to time, common stock, preferred stock, debt securities, depository shares, purchase contracts, purchase units, warrants, or any combination of the above securities.
There can be no assurance that additional financing will be available at all or, if available, will be on terms acceptable to us. Additional equity financings could result in dilution to our shareholders. If additional financing is needed and is not available on acceptable terms, we may need to reduce our operating expenses and scale back our operations.
Off-Balance Sheet Arrangements
We have not created, and are not party to, any special-purpose or off balance sheet entities for the purpose of raising capital, incurring debt or operating parts of our business that are not consolidated into our financial statements. We have not entered into any transactions with unconsolidated entities whereby we have subordinated retained interests, derivative instruments or other contingent arrangements that expose us to material continuing risks, contingent liabilities, or any other obligation under a variable interest in an unconsolidated entity that provides financing, liquidity, market risk or credit risk support to us.
Related Party Transactions
Robert M. Wadsworth, one of our directors, is a managing director of the limited liability corporation that controls HarbourVest Partners (and its affiliates, collectively, "HarbourVest"), one of our significant stockholders. HarbourVest is also a stockholder in Sepaton, Inc. ("Sepaton"). During the years ended September 30, 2011, 2010 and 2009, we recorded revenues of $2.2 million, $3.7 million and $2.0 million related to sales of application platform solutions and services to Sepaton, respectively. We had $0.1 million and $1.4 million in accounts receivable outstanding from Sepaton at September 30, 2011 and 2010, respectively.
John A. Blaeser, Chairman of the Board of Directors, also serves as a director of Imprivata, Inc. ("Imprivata"). During the years ended September 30, 2011, 2010 and 2009, we recorded revenues of $709,000, $752,000 and $861,000 respectively, related to sales of application platform solutions and services to Imprivata. We had $89,000 and $115,000 in accounts receivable outstanding from Imprivata at September 30, 2011 and 2010, respectively.
Charles A. Foley, one of our directors, also serves as the Chief Executive Officer of TimeSight Systems ("TimeSight", formerly known as Digital Ocular Networks). We did not record any revenue related to sales to TimeSight during the year ended September 30, 2011. During the years ended September 30, 2010 and 2009, we recorded revenues of $1,000 and $106,000, respectively, related to sales of application platform solutions to TimeSight. We had no amounts outstanding in accounts receivable from TimeSight at September 30, 2011 or September 30, 2010.
46
Recent Accounting Pronouncements
In September 2011, the Financial Accounting Standards Board ("FASB") issued authoritative guidance related to testing goodwill for impairment. This update simplifies the goodwill impairment assessment by allowing a company to first review qualitative factors to determine the likelihood of whether the fair value of a reporting unit is less than its carrying amount before applying the two-step goodwill impairment test. If it is determined that it is more likely than not that the fair value of a reporting unit is greater than its carrying amount, the company would not be required to perform the two-step goodwill impairment test for that reporting unit. This update is effective for interim and annual goodwill impairment tests performed for fiscal years beginning after December 15, 2011 with early adoption permitted. We adopted this authoritative guidance during the quarter ended September 30, 2011, which resulted in us determining that we needed to perform the two-step goodwill impairment test.
ITEM 7A. QUANTITATIVE AND QUALITATIVE DISCLOSURES ABOUT MARKET RISK
We engage in certain transactions which are denominated in currencies other than the U.S. dollar (primarily the Euro). These transactions may subject us to exchange rate risk based on fluctuations in currency exchange rates, which occur between the time such a transaction is recognized in our financial statements and the time that the transaction is settled. Historically, our exchange rate risk was not material; however, as a result of the acquisition of our manufacturing facility in Galway, Ireland, our purchasing from vendors located within the EU has increased. The refundable VAT amounts, which we pay on products and services purchased from our vendors in the EU, are denominated in Euros. While these VAT amounts are refundable to us, we are exposed to foreign currency exchange gains and losses between the time at which we pay the VAT on certain purchases and the time at which we receive the VAT refund from foreign tax authorities. To date we have not engaged in any foreign currency hedging transactions. However, as these transactions become more significant we may employ foreign currency hedges to mitigate our risk.
47
ITEM 8. FINANCIAL STATEMENTS AND SUPPLEMENTARY DATA
INDEX TO CONSOLIDATED FINANCIAL STATEMENTS
48
Report of Independent Registered Public Accounting Firm
To
the Board of Directors and Stockholders
of Network Engines, Inc.:
In our opinion, the consolidated financial statements listed in the index appearing under Item 15(a)(1) present fairly, in all material respects, the financial position of Network Engines, Inc. and its subsidiaries at September 30, 2011 and September 30, 2010, and the results of their operations and their cash flows for each of the three years in the period ended September 30, 2011 in conformity with accounting principles generally accepted in the United States of America. In addition, in our opinion, the financial statement schedule listed in the accompanying index appearing under Item 15(a)(2) presents fairly, in all material respects, the information set forth therein when read in conjunction with the related consolidated financial statements. Also in our opinion, the Company maintained, in all material respects, effective internal control over financial reporting as of September 30, 2011, based on criteria established in Internal Control—Integrated Framework issued by the Committee of Sponsoring Organizations of the Treadway Commission (COSO). The Company's management is responsible for these financial statements and financial statement schedule, for maintaining effective internal control over financial reporting and for its assessment of the effectiveness of internal control over financial reporting, included in Management's Annual Report on Internal Control Over Financial Reporting appearing under Item 9A. Our responsibility is to express opinions on these financial statements, on the financial statement schedule, and on the Company's internal control over financial reporting based on our integrated audits. We conducted our audits in accordance with the standards of the Public Company Accounting Oversight Board (United States). Those standards require that we plan and perform the audits to obtain reasonable assurance about whether the financial statements are free of material misstatement and whether effective internal control over financial reporting was maintained in all material respects. Our audits of the financial statements included examining, on a test basis, evidence supporting the amounts and disclosures in the financial statements, assessing the accounting principles used and significant estimates made by management, and evaluating the overall financial statement presentation. Our audit of internal control over financial reporting included obtaining an understanding of internal control over financial reporting, assessing the risk that a material weakness exists, and testing and evaluating the design and operating effectiveness of internal control based on the assessed risk. Our audits also included performing such other procedures as we considered necessary in the circumstances. We believe that our audits provide a reasonable basis for our opinions.
A company's internal control over financial reporting is a process designed to provide reasonable assurance regarding the reliability of financial reporting and the preparation of financial statements for external purposes in accordance with generally accepted accounting principles. A company's internal control over financial reporting includes those policies and procedures that (i) pertain to the maintenance of records that, in reasonable detail, accurately and fairly reflect the transactions and dispositions of the assets of the company; (ii) provide reasonable assurance that transactions are recorded as necessary to permit preparation of financial statements in accordance with generally accepted accounting principles, and that receipts and expenditures of the company are being made only in accordance with authorizations of management and directors of the company; and (iii) provide reasonable assurance regarding prevention or timely detection of unauthorized acquisition, use, or disposition of the company's assets that could have a material effect on the financial statements.
Because of its inherent limitations, internal control over financial reporting may not prevent or detect misstatements. Also, projections of any evaluation of effectiveness to future periods are subject to the risk that controls may become inadequate because of changes in conditions, or that the degree of compliance with the policies or procedures may deteriorate.
/s/ PricewaterhouseCoopers LLP
Boston,
Massachusetts
December 14, 2011
49
NETWORK ENGINES, INC.
CONSOLIDATED BALANCE SHEETS
(in thousands, except share and per share data)
| |
September 30, | ||||||
|---|---|---|---|---|---|---|---|
| |
2011 | 2010 | |||||
ASSETS |
|||||||
Current assets: |
|||||||
Cash and cash equivalents |
$ | 19,852 | $ | 15,323 | |||
Accounts receivable, net of allowances of $110 and $63 at September 30, 2011 and 2010, respectively |
43,522 | 34,377 | |||||
Inventories |
24,331 | 23,161 | |||||
Deferred income taxes |
15,001 | — | |||||
Prepaid expenses and other current assets |
4,886 | 2,871 | |||||
Total current assets |
107,592 | 75,732 | |||||
Property and equipment, net |
2,569 | 1,570 | |||||
Intangible asset, net |
5,244 | 6,574 | |||||
Deferred income taxes |
15,855 | — | |||||
Other assets |
131 | 235 | |||||
Total assets |
$ | 131,391 | $ | 84,111 | |||
LIABILITIES AND STOCKHOLDERS' EQUITY |
|||||||
Current liabilities: |
|||||||
Accounts payable |
$ | 23,360 | $ | 16,447 | |||
Accrued compensation and other related benefits |
2,119 | 1,829 | |||||
Other accrued expenses |
3,630 | 2,584 | |||||
Deferred revenue |
5,967 | 5,101 | |||||
Total current liabilities |
35,076 | 25,961 | |||||
Deferred revenue, net of current portion |
4,095 | 2,998 | |||||
Total liabilities |
39,171 | 28,959 | |||||
Commitments and contingencies (Note 12) |
|||||||
Stockholders' equity: |
|||||||
Preferred stock, $.01 par value, 5,000,000 shares authorized, and no shares issued and outstanding |
— | — | |||||
Common stock, $.01 par value, 100,000,000 shares authorized; 48,128,063 and 47,991,049 shares issued; 42,458,317 and 42,847,645 shares outstanding at September 30, 2011 and 2010, respectively |
481 | 480 | |||||
Additional paid-in capital |
199,926 | 198,932 | |||||
Accumulated deficit |
(102,541 | ) | (139,241 | ) | |||
Treasury stock, at cost, 5,669,746 and 5,143,404 shares at September 30, 2011 and 2010, respectively |
(5,646 | ) | (5,019 | ) | |||
Total stockholders' equity |
92,220 | 55,152 | |||||
Total liabilities and stockholders' equity |
$ | 131,391 | $ | 84,111 | |||
The accompanying notes are an integral part of the consolidated financial statements.
50
NETWORK ENGINES, INC.
CONSOLIDATED STATEMENTS OF OPERATIONS
(in thousands, except per share data)
| |
Year Ended September 30, | |||||||||
|---|---|---|---|---|---|---|---|---|---|---|
| |
2011 | 2010 | 2009 | |||||||
Net revenues |
$ | 272,468 | $ | 221,620 | $ | 148,722 | ||||
Cost of revenues |
241,536 | 196,148 | 126,201 | |||||||
Gross margin |
30,932 | 25,472 | 22,521 | |||||||
Operating expenses: |
||||||||||
Engineering and development |
6,385 | 6,657 | 6,345 | |||||||
Selling and marketing |
7,563 | 7,433 | 8,213 | |||||||
General and administrative |
8,766 | 8,286 | 9,088 | |||||||
Amortization of intangible asset |
1,329 | 1,555 | 1,756 | |||||||
Settlement of acquisition dispute |
— | — | 393 | |||||||
Impairment of goodwill |
505 | — | — | |||||||
Total operating expenses |
24,548 | 23,931 | 25,795 | |||||||
Income (loss) from operations |
6,384 | 1,541 | (3,274 | ) | ||||||
Interest and other (expense) income, net |
(296 | ) | (23 | ) | 76 | |||||
Income (loss) before income taxes |
6,088 | 1,518 | (3,198 | ) | ||||||
Income tax expense (benefit) |
(30,613 | ) | (11 | ) | — | |||||
Net income (loss) |
$ | 36,701 | $ | 1,529 | $ | (3,198 | ) | |||
Net income (loss) per share—basic |
$ | 0.86 | $ | 0.04 | $ | (0.07 | ) | |||
Net income (loss) per share—diluted |
$ | 0.84 | $ | 0.03 | $ | (0.07 | ) | |||
Shares used in computing basic net income (loss) per share |
42,843 | 42,367 | 42,817 | |||||||
Shares used in computing diluted net income (loss) per share |
43,886 | 44,038 | 42,817 | |||||||
The accompanying notes are an integral part of the consolidated financial statements.
51
NETWORK ENGINES, INC.
CONSOLIDATED STATEMENTS OF STOCKHOLDERS' EQUITY AND
COMPREHENSIVE INCOME (LOSS)
(in thousands, except share data)
| |
Shares of Common Stock |
|
|
|
|
|
|
||||||||||||||||||
|---|---|---|---|---|---|---|---|---|---|---|---|---|---|---|---|---|---|---|---|---|---|---|---|---|---|
| |
Common Stock Par value |
Additional Paid-in Capital |
Accumulated Deficit |
Treasury Stock |
Total Stockholders' Equity |
Comprehensive Income (Loss) |
|||||||||||||||||||
| |
Issued | In Treasury | |||||||||||||||||||||||
Balance, September 30, 2008 |
46,753,826 | (3,468,659 | ) | $ | 468 | $ | 195,228 | $ | (137,572 | ) | $ | (3,772 | ) | $ | 54,352 | ||||||||||
Issuance of common stock upon stock option exercises |
14,642 |
— |
11 |
11 |
|||||||||||||||||||||
Issuance of common stock under employee stock purchase plan |
364,072 | 3 | 164 | 167 | |||||||||||||||||||||
Stock compensation related to grants of stock options to employees |
1,308 | 1,308 | |||||||||||||||||||||||
Purchase of treasury stock |
(1,516,545 | ) | (1,070 | ) | (1,070 | ) | |||||||||||||||||||
Net loss |
(3,198 | ) | (3,198 | ) | $ | (3,198 | ) | ||||||||||||||||||
|
$ | (3,198 | ) | ||||||||||||||||||||||
Balance, September 30, 2009 |
47,132,540 | (4,985,204 | ) | $ | 471 | $ | 196,711 | $ | (140,770 | ) | $ | (4,842 | ) | $ | 51,570 | ||||||||||
Issuance of common stock upon stock option exercises |
858,509 | 9 | 1,137 | 1,146 | |||||||||||||||||||||
Stock compensation related to grants of stock options to employees |
1,084 | 1,084 | |||||||||||||||||||||||
Purchase of treasury stock |
(158,200 | ) | (177 | ) | (177 | ) | |||||||||||||||||||
Net Income |
1,529 | 1,529 | $ | 1,529 | |||||||||||||||||||||
|
$ | 1,529 | |||||||||||||||||||||||
Balance, September 30, 2010 |
47,991,049 | (5,143,404 | ) | $ | 480 | $ | 198,932 | $ | (139,241 | ) | $ | (5,019 | ) | $ | 55,152 | ||||||||||
Issuance of common stock upon stock option exercises |
137,014 | 1 | 110 | 111 | |||||||||||||||||||||
Stock compensation related to grants of stock options to employees |
884 | 884 | |||||||||||||||||||||||
Purchase of treasury stock |
(526,342 | ) | (627 | ) | (627 | ) | |||||||||||||||||||
Net Income |
36,701 | 36,701 | $ | 36,701 | |||||||||||||||||||||
|
$ | 36,701 | |||||||||||||||||||||||
Balance, September 30, 2011 |
48,128,063 | (5,669,746 | ) | $ | 481 | $ | 199,926 | $ | (102,541 | ) | $ | (5,646 | ) | $ | 92,220 | ||||||||||
The accompanying notes are an integral part of the consolidated financial statements.
52
NETWORK ENGINES, INC.
CONSOLIDATED STATEMENTS OF CASH FLOWS
(in thousands)
| |
Year Ended September 30, | |||||||||
|---|---|---|---|---|---|---|---|---|---|---|
| |
2011 | 2010 | 2009 | |||||||
Cash flows from operating activities: |
||||||||||
Net income (loss) |
$ | 36,701 | $ | 1,529 | $ | (3,198 | ) | |||
Adjustments to reconcile net income (loss) to net cash provided by (used in) operating activities: |
||||||||||
Depreciation and amortization |
2,332 | 2,491 | 2,667 | |||||||
Stock-based compensation |
890 | 1,079 | 1,312 | |||||||
Provision for doubtful accounts |
54 | (32 | ) | 83 | ||||||
Settlement of acquisition dispute |
— | — | 393 | |||||||
Change in deferred income taxes |
(30,856 | ) | — | — | ||||||
Impairment of goodwill |
505 | — | — | |||||||
Loss on disposal of fixed assets |
4 | 1 | 22 | |||||||
Changes in operating assets and liabilities: |
||||||||||
Accounts receivable |
(9,201 | ) | (6,866 | ) | (1,159 | ) | ||||
Income taxes receivable |
125 | (108 | ) | 2,568 | ||||||
Inventories |
(1,174 | ) | (10,078 | ) | 8,298 | |||||
Prepaid expenses and other assets |
(2,035 | ) | (1,266 | ) | 559 | |||||
Accounts payable |
6,913 | 2,247 | 2,455 | |||||||
Accrued expenses |
1,087 | 282 | (465 | ) | ||||||
Deferred revenue |
1,963 | 1,348 | (669 | ) | ||||||
Net cash provided by (used in) operating activities |
7,308 | (9,373 | ) | 12,866 | ||||||
Cash flows from investing activities: |
||||||||||
Acquisition |
(505 | ) | — | — | ||||||
Refundable acquisition consideration |
— | 3,629 | — | |||||||
Purchases of property and equipment |
(1,773 | ) | (902 | ) | (938 | ) | ||||
Net cash (used in) provided by investing activities |
(2,278 | ) | 2,727 | (938 | ) | |||||
Cash flows from financing activities: |
||||||||||
Purchases of treasury stock |
(582 | ) | (177 | ) | (1,070 | ) | ||||
Proceeds from issuance of common stock |
111 | 1,145 | 178 | |||||||
Payment of bank line of credit fees |
(30 | ) | (38 | ) | — | |||||
Net cash (used in) provided by financing activities |
(501 | ) | 930 | (892 | ) | |||||
Net increase (decrease) in cash and cash equivalents |
4,529 | (5,716 | ) | 11,036 | ||||||
Cash and cash equivalents, beginning of year |
15,323 | 21,039 | 10,003 | |||||||
Cash and cash equivalents, end of year |
$ | 19,852 | $ | 15,323 | $ | 21,039 | ||||
Supplemental cash flow information: |
||||||||||
Cash paid for income taxes |
$ | (8 | ) | $ | — | $ | 63 | |||
Supplemental disclosure of non-cash investing and financing activities: |
||||||||||
Assets acquired under capital lease |
$ | — | $ | — | $ | 67 | ||||
The accompanying notes are an integral part of the consolidated financial statements.
53
NETWORK ENGINES, INC.
NOTES TO CONSOLIDATED FINANCIAL STATEMENTS
1. Nature of Business
As a system integrator, Network Engines, Inc. ("Network Engines", "NEI", or the "Company") designs and manufactures application platforms and appliance solutions on which software applications are applied to both enterprise and communications networks. The Company markets its application platform solutions and services to original equipment manufacturers, or OEMs, and independent software vendors, or ISVs, that then deliver their software applications in the form of a network-ready hardware or software platform. The Company brands these platforms for its customers, who subsequently resell and support these platforms to organizations and enterprises. Application platforms are pre-configured server-based network infrastructure devices, engineered to deliver specific software application functionality, ease deployment challenges, improve integration and manageability, accelerate time-to-market and increase the security of that software application in an end user's network. The Company also provides platform management software tools and support services related to solution design, systems integration, application management, global logistics, and support and maintenance programs.
The Company operates as one segment, which reflects the way that management views the Company's operations.
2. Summary of Significant Accounting Policies
Basis of Presentation
The accompanying consolidated financial statements include the accounts of the Company and its wholly owned subsidiaries. All intercompany transactions and balances have been eliminated.
Use of Estimates
The preparation of financial statements in conformity with accounting principles generally accepted in the United States of America requires management to make estimates and assumptions that affect the reported amounts of assets and liabilities and disclosures of contingent assets and liabilities at the date of the financial statements and the reported amounts of revenue and expenses during the period. Actual results could differ from those estimates.
Cash and Cash Equivalents
Cash equivalents consist principally of money market funds and other marketable securities purchased with an original maturity of three months or less. Cash equivalents are stated at fair value.
Concentrations of Risk
Credit
Financial instruments that potentially subject the Company to concentrations of credit risk consist principally of cash, cash equivalents and accounts receivable. When the Company decides to invest excess cash, it invests primarily in municipal bonds, money market funds of major financial institutions, and government agency securities. There are no significant concentrations in any one issuer of securities. The Company provides credit to customers in the normal course of business and does not require collateral from its customers, but routinely assesses their financial strength. The Company maintains reserves for potential credit losses, based on analysis of individual accounts receivable, historical bad debt write-offs, customer concentrations, customer creditworthiness, current economic
54
NETWORK ENGINES, INC.
NOTES TO CONSOLIDATED FINANCIAL STATEMENTS (Continued)
2. Summary of Significant Accounting Policies (Continued)
conditions, accounts receivable aging trends and the payment terms the Company extends to its customers. Such losses have been within management's expectations.
Customers
The following table summarizes those customers who accounted for greater than 10% of the Company's net revenues or accounts receivable:
| |
Net Revenues for the Year Ended September 30, |
|||||||||
|---|---|---|---|---|---|---|---|---|---|---|
| |
2011 | 2010 | 2009 | |||||||
EMC Corporation(1) |
59 | % | 51 | % | 35 | % | ||||
Tektronix, Inc. |
11 | % | 20 | % | 13 | % | ||||
| |
Accounts Receivable at | ||||||
|---|---|---|---|---|---|---|---|
| |
September 30, 2011 |
September 30, 2010 |
|||||
EMC Corporation(1) |
53 | % | 51 | % | |||
Tektronix, Inc. |
11 | % | 16 | % | |||
- (1)
- On April 1, 2011, EMC Corporation acquired Netwitness Corporation ("Netwitness"), which was also previously one of the Company's customers. As a result, the Company has included revenues from sales to Netwitness after April 1, 2011 in determining net revenues from EMC Corporation. The Company has also included accounts receivable from Netwitness in determining EMC Corporation's receivable balance as of September 30, 2011.
Fair Value of Financial Instruments
Financial instruments, including cash equivalents, accounts receivable, and accounts payable, are carried in the financial statements at amounts that approximate their fair value, due to the short term nature of the accounts, as of September 30, 2011 and 2010.
Inventories
Inventories are valued at the lower of cost or market value, with cost determined using the first-in, first-out method. The Company regularly reviews inventory quantities on hand and records a write-down for excess and obsolete inventory based primarily on its estimated forecast of product demand and anticipated production requirements in the near future.
Property and Equipment
Property and equipment are recorded at cost and depreciated using the straight-line method over their estimated useful lives. Leasehold improvements are amortized over the shorter of the useful life of the improvement or the remaining term of the lease. Upon retirement or sale, the cost of the assets disposed of and the related accumulated depreciation are removed from the accounts and any resulting
55
NETWORK ENGINES, INC.
NOTES TO CONSOLIDATED FINANCIAL STATEMENTS (Continued)
2. Summary of Significant Accounting Policies (Continued)
gain or loss is included in the determination of net income or loss. Repairs and maintenance are charged to expense as incurred.
Stock-Based Compensation
The Company recognizes the fair value of stock-based awards as stock-based compensation expense, net of an estimated forfeiture rate, over the employee's requisite service period (generally the vesting period of the equity award). The Company uses the Black-Scholes valuation model for estimating the fair value of the stock options granted.
Goodwill, Other Intangible Assets and Long-lived Assets
Goodwill represents the excess of the purchase price over the fair value of the net tangible and intangible assets acquired. On January 18, 2011, the Company entered into an agreement with Multis Limited ("Multis") to acquire the integration business of Multis in exchange for a cash payment of approximately $505,000 (see Note 3). The only asset acquired was an assembled workforce, which does not represent an intangible asset under the authoritative guidance for business combinations and there were no acquired liabilities. As such, the entire purchase price was allocated to goodwill.
The Company reviews goodwill for impairment annually as of the fiscal year end date, and more frequently if certain indicators are present, using a qualitative approach followed by a two-step process, if necessary, in accordance with authoritative guidance related to goodwill and intangible assets. In the first step, an entity's net assets are segregated into reporting units and compared to their fair values. If the carrying amount of a reporting unit exceeds its fair value, the second step of the goodwill impairment test is performed to measure the amount of impairment loss, if any. The second step compares the implied fair value of a reporting unit's goodwill with the carrying amount of that goodwill. If the carrying amount of a reporting unit's goodwill exceeds the implied fair value of that goodwill, an impairment loss is recognized in an amount equal to that excess. The Company has one reporting unit and estimates the fair value of the reporting unit using widely accepted valuation techniques, including the present value of estimated future cash flows using a risk-adjusted discount rate, and market multiple analyses. These types of analyses require significant judgments by management. During the year ended September 30, 2011, the Company recorded a goodwill impairment charge of $505,000 (see Note 4).
Other intangible and long-lived assets primarily consist of property and equipment and an intangible asset with a definite life. Guidance provided by the FASB requires impairment losses to be recorded on long-lived assets used in operations when indicators of impairment are present and the projected undiscounted cash flows estimated to be generated by those assets are less than the assets' carrying value. The amount of impairment, if any, is measured based on the excess of the carrying value over fair value. Fair value is generally calculated as the present value of estimated future cash flows using a risk-adjusted discount rate, which requires significant management judgment with respect to revenue and expense growth rates, and the selection and use of an appropriate discount rate.
Factors that could lead to an impairment of the intangible asset (acquired customer relationships) include, but are not limited to, a worsening in customer attrition rates compared to historical attrition rates, or lower than initially anticipated cash flows associated with customer relationships.
56
NETWORK ENGINES, INC.
NOTES TO CONSOLIDATED FINANCIAL STATEMENTS (Continued)
2. Summary of Significant Accounting Policies (Continued)
Foreign Currencies
The functional currency for the Company's foreign subsidiary is the U.S. dollar. Net foreign currency transaction gains (losses) are included in the determination of net income (loss). For the years ended September 30, 2011, 2010, and 2009, gains (losses) from transactions in foreign currencies were $(223,000), $(10,000), and $(65,000), respectively.
Revenue Recognition
Revenues from products are generally recognized upon delivery to customers if persuasive evidence of an arrangement exists, the fee is fixed or determinable, collectibility is reasonably assured and title and risk of loss have passed to the customer. In the event the Company has unfulfilled future obligations, revenue and related costs are deferred until those future obligations are met. The Company has an inventory consignment agreement with its largest customer related to certain application platforms. This customer notifies the Company when it utilizes inventory and the Company recognizes revenues from sales to this customer based upon these notifications.
Maintenance revenues are derived from customer support agreements generally entered into in connection with the initial application platform sales and subsequent renewals. Maintenance fees are typically for one to three year renewable periods and include the right to hardware repairs, 24-hour customer support, on-site support, advanced replacement of application platforms, and unspecified software updates when and if available for certain agreements. Maintenance revenues are recognized ratably over the term of the maintenance period. Payments for maintenance fees are generally made in advance and are included in deferred revenue. The associated costs of maintenance are expensed in the same period as incurred.
Contracts and/or customer purchase orders generally serve as the evidence of an arrangement. Shipping documents and consignment usage notifications are used to verify shipment or transfer of ownership, as applicable. The Company assesses whether the sales price is fixed or determinable based on the payment terms associated with the transaction and whether the sales price is subject to refund or adjustment. The Company assesses collectibility based primarily on the creditworthiness of the customer as determined by credit checks and analysis, as well as the customer's payment history.
Under previous authoritative guidance, for revenue arrangements that contained multiple elements, such as the sale of both the product and post-sales support and/or extended warranty and related services element, in which software was not incidental to the product as a whole, the Company was required to determine the fair value of the undelivered elements based upon vendor-specific objective evidence ("VSOE") of fair value. VSOE was established through contractual post-sales support renewal rates. The Company used the residual fair value method to allocate the arrangement consideration to the product. For revenue arrangements that contained software elements that were not incidental to the product as a whole, and VSOE was not available for the undelivered elements, the Company deferred all revenue associated with the arrangement and recognized the revenue over the related service period.
In October 2009, the FASB amended the authoritative guidance related to revenue recognition for arrangements with multiple deliverables and arrangements that include software elements. The Company elected to early adopt this guidance on a prospective basis for applicable transactions
57
NETWORK ENGINES, INC.
NOTES TO CONSOLIDATED FINANCIAL STATEMENTS (Continued)
2. Summary of Significant Accounting Policies (Continued)
originating or materially modified on or after January 1, 2010, the start of the second fiscal quarter of the Company's fiscal year 2010.
Under the amended authoritative guidance for arrangements with multiple deliverables and arrangements that include software elements, the Company is required to determine if the software elements function together with the tangible product to deliver the tangible product's essential functionality. The Company determined that its software elements provide additional functionality but are not necessary to deliver the tangible product's essential functionality; as such, the Company is required to allocate the arrangement consideration to the hardware and software elements based upon the relative selling price of the hardware and software deliverables. In such circumstances, the Company uses a hierarchy to determine the selling price to be used for allocating revenue to deliverables: (i) VSOE, (ii) third-party evidence of selling price ("TPE") and (iii) best estimate of the selling price ("BESP"). VSOE generally exists only when the Company sells the deliverable separately and is the price actually charged by the Company for that deliverable. BESPs reflect the Company's best estimates of what the selling prices of elements would be if they were sold regularly on a stand-alone basis.
The Company's software elements consist of software and software maintenance. Revenue associated with the software is recognized upon delivery, when VSOE is available for the undelivered software maintenance. Revenue associated with the software maintenance is recognized over the term of the maintenance period, which is generally one year. When VSOE is not available for the undelivered software maintenance, revenue associated with the software elements is deferred and recognized over the software maintenance period.
The Company's hardware elements generally consist of an application platform and post-sales support and/or an extended warranty. Revenue associated with the application platform is recognized upon delivery. The Company allocates revenue associated with the post-sales support and/or extended warranty based upon separately priced contractual rates for these elements. Revenue associated with the post-sales support and/or extended warranty is deferred and recognized over the support period, generally one to three years.
The following table presents the effect that the adoption of the authoritative guidance would have had on the Company's Condensed Consolidated Statement of Operations for the three months ended
58
NETWORK ENGINES, INC.
NOTES TO CONSOLIDATED FINANCIAL STATEMENTS (Continued)
2. Summary of Significant Accounting Policies (Continued)
December 31, 2009, assuming the Company had adopted the authoritative guidance on October 1, 2009:
| |
Three months ended December 31, 2009 | |||||||||
|---|---|---|---|---|---|---|---|---|---|---|
| |
As Reported | Adjustments | As Amended | |||||||
Net revenues |
$ | 43,878 | $ | 175 | $ | 44,053 | ||||
Cost of revenues |
37,882 | 116 | 37,998 | |||||||
Gross margin |
5,996 | 59 | 6,055 | |||||||
Operating expenses |
5,851 | — | 5,851 | |||||||
Income from operations |
145 | 59 | 204 | |||||||
Interest and other income, net |
18 | — | 18 | |||||||
Income before income taxes |
163 | 59 | 222 | |||||||
Provision for income taxes |
24 | — | 24 | |||||||
Net income |
$ | 139 | $ | 59 | $ | 198 | ||||
Net income per share—basic and diluted |
$ | 0.00 | $ | 0.00 | $ | 0.00 | ||||
Shares used in computing basic net income per share |
42,027 |
42,027 |
42,027 |
|||||||
Shares used in computing diluted net income per share |
42,833 | 42,833 | 42,833 | |||||||
The Company's Consolidated Statement of Operations for the year ended September 30, 2010 includes the impact of the adjustments above. The Company's Consolidated Statement of Operations for the year ended September 30, 2011 include the effect of the adoption of the authoritative guidance.
Product Warranties
The Company offers a standard warranty on products sold to its customers, which generally provides for repair or replacement of any defective products for a period of up to 36 months after shipment. Based upon historical experience and expectations of future conditions, for the standard warranty, the Company accrues for the estimated costs to fulfill customer warranty obligations upon the recognition of the related product revenue. Warranty expense is recorded as a component of cost of revenues. The Company also offers extended warranties on certain of its products. Revenues from sales of these extended warranties are recognized over the terms of the related warranty periods, which begin upon the expiration of the standard warranty. Costs incurred to fulfill claims under extended warranties are expensed as incurred.
Advertising Costs
Advertising costs are expensed as incurred. Advertising expenses for the years ended September 30, 2011, 2010, and 2009 were $74,000, $101,000, and $76,000, respectively.
59
NETWORK ENGINES, INC.
NOTES TO CONSOLIDATED FINANCIAL STATEMENTS (Continued)
2. Summary of Significant Accounting Policies (Continued)
Engineering and Development
Engineering and development costs consist primarily of salaries and benefits for personnel engaged in engineering and development, fees paid to consultants and outside service providers, material costs for prototype and test units, and facility related costs. Engineering and development costs are expensed as incurred.
Income Taxes
Deferred tax assets and liabilities are determined based on the difference between the financial statement and the tax bases of assets and liabilities using enacted tax rates in effect in the years in which the differences are expected to reverse. A valuation allowance against deferred tax assets is recorded if, based upon the weight of available evidence, it is more likely than not that some or all of the deferred tax assets will not be realized.
The Company accounts for uncertainties in income taxes using a two-step process in accordance with authoritative guidance provided by the FASB. Under this guidance, the Company first must determine if it is more likely than not that, based upon the technical merits of the tax position, that the tax position will be sustained upon examination. If the Company determines that the tax position will be sustained upon examination, the Company then measures the tax position to determine the amount of benefit to be recognized in the financial statements. The amount recognized is the largest amount of benefit that is greater than fifty percent likely of being realized upon settlement.
Comprehensive Income (Loss)
Comprehensive income (loss) is comprised of two components: net income (loss) and other comprehensive income (loss). During the years ended September 30, 2011, 2010, and 2009, comprehensive income (loss) was equal to net income (loss).
Net Income (Loss) per Share
Basic net income (loss) per share is computed by dividing net income (loss) by the weighted average number of common shares outstanding during the period. Diluted net income (loss) per share is computed using the weighted average number of common and dilutive common equivalent shares outstanding during the period. Common equivalent shares consist of options to purchase common stock. For years in which the Company incurs a net loss, diluted net loss per share is the same as basic net loss per share because the inclusion of these common stock equivalents would be anti-dilutive.
60
NETWORK ENGINES, INC.
NOTES TO CONSOLIDATED FINANCIAL STATEMENTS (Continued)
2. Summary of Significant Accounting Policies (Continued)
The following table sets forth the computation of basic and diluted net income (loss) per share as well as the weighted average potential common stock excluded from the calculation of net income (loss) per share because their inclusion would be anti-dilutive (in thousands, except per share data):
| |
Year Ended September 30, | |||||||||
|---|---|---|---|---|---|---|---|---|---|---|
| |
2011 | 2010 | 2009 | |||||||
Numerator: |
||||||||||
Net income (loss) |
$ | 36,701 | $ | 1,529 | $ | (3,198 | ) | |||
Denominator: |
||||||||||
Shares used in computing basic net income (loss) per share |
42,843 | 42,367 | 42,817 | |||||||
Common stock equivalents from employee stock options |
1,043 | 1,671 | — | |||||||
Shares used in computing diluted net income (loss) per share |
43,886 | 44,038 | 42,817 | |||||||
Net income (loss) per share: |
||||||||||
Basic |
$ | 0.86 | $ | 0.04 | $ | (0.07 | ) | |||
Diluted |
$ | 0.84 | $ | 0.03 | $ | (0.07 | ) | |||
Anti-dilutive potential common stock equivalents excluded from the calculation of net income (loss) per share: |
||||||||||
Options to purchase common stock |
4,720 | 3,727 | 6,971 | |||||||
Recent Accounting Pronouncements
In September 2011, the Financial Accounting Standards Board ("FASB") issued authoritative guidance related to testing goodwill for impairment. This update simplifies the goodwill impairment assessment by allowing a company to first review qualitative factors to determine the likelihood of whether the fair value of a reporting unit is less than its carrying amount before applying the two-step goodwill impairment test. If it is determined that it is more likely than not that the fair value of a reporting unit is greater than its carrying amount, the company would not be required to perform the two-step goodwill impairment test for that reporting unit. This update is effective for interim and annual goodwill impairment tests performed for fiscal years beginning after December 15, 2011 with early adoption permitted. The Company adopted this authoritative guidance during the quarter ended September 30, 2011, which resulted in the Company determining that it needed to perform the two-step goodwill impairment test. As a result of this test, the Company determined that the goodwill was impaired as of September 30, 2011.
3. Business Combinations
Alliance Systems, Inc.
On October 11, 2007, the Company acquired all of the equity of Alliance Systems, Inc. ("Alliance Systems"), a privately held corporation located in Plano, Texas, which provided application platforms and related equipment supporting telecommunications solutions. The initial aggregate purchase price of approximately $40,947,000 was funded through a cash payment of $32,820,000 and the issuance of 2.9 million shares of the Company's common stock valued at approximately $5,994,000, which was based on the average market price of the Company's common stock over the period of two days before and after the terms of the acquisition were announced.
61
NETWORK ENGINES, INC.
NOTES TO CONSOLIDATED FINANCIAL STATEMENTS (Continued)
3. Business Combinations (Continued)
The acquisition was structured to include an adjustment to decrease the purchase price based on the net working capital of Alliance Systems as of October 11, 2007, as defined in the merger agreement, and therefore approximately $4.0 million of the cash paid was contingently returnable to the Company and this was recorded as contingently returnable acquisition consideration. The former Alliance Systems shareholders disputed the amounts claimed by the Company under this provision of the merger agreement. In September 2009, the Company engaged in arbitration with the former Alliance Systems shareholders to resolve the disputed claims as provided for in the merger agreement. In October 2009, the arbitrator's decision was rendered. As a result, approximately $3.6 million of the contingently returnable consideration was returned to the Company from escrow funds on November 3, 2009; as such this amount was recorded as refundable acquisition consideration in the Company's consolidated balance sheet as of September 30, 2009. The $393,000 not returned to the Company was recorded as settlement of acquisition dispute in the fiscal year 2009 statement of operations.
Multis Limited
On January 18, 2011, the Company entered into a Purchase and Sales Agreement (the "P&S Agreement") with Multis Limited ("Multis") to acquire the integration business of Multis in exchange for a cash payment of approximately $505,000. Multis is a contract manufacturer, and its integration business had been manufacturing certain of the Company's products since fiscal year 2006. This acquisition was accounted for as a business combination under Accounting Standards Codification ("ASC") 805. As such, the purchase price was allocated to the fair value of the acquired assets and liabilities. Because the Company was the only customer of Multis' integration business, there were no acquired customer relationships. The only asset acquired was an assembled workforce, which does not represent an intangible asset under ASC 805 and there were no acquired liabilities. As such, the entire purchase price was allocated to goodwill. The goodwill recorded was not deductible for tax purposes. Goodwill was fully impaired as of September 30, 2011 (see Note 4 for additional details regarding the impairment).This acquisition enabled the Company to have a turn-key ability to meet its growing international requirements, as well as eliminate the time and expenses associated with trans-Atlantic shipments. Additionally, this acquisition provided the Company with a cost effective alternative to establishing a similar operation independently.
The Company also entered into a lease agreement (the "Lease Agreement") with Multis on January 18, 2011 to lease approximately 20,000 square feet of manufacturing and warehousing space in Galway, Ireland. The payments due to Multis under the Lease Agreement are at current market rates for similar properties near Galway, Ireland. As such, these payments are not additional cash consideration paid in connection with this acquisition. Both the P&S Agreement and the Lease Agreement were effected through the Company's newly created and wholly owned Irish subsidiary, NEI Ireland.
4. Goodwill and Intangible Assets
The Company recorded goodwill as a result of the acquisition of the integration operations of Multis Limited. Because the Company operates as a single reporting unit, the goodwill balance as of the date of acquisition was allocated to the Company as a whole. The Company reviews goodwill and long-lived assets, including definite-lived intangible assets, to determine if any adverse conditions exist that would indicate impairment. The Company reviews goodwill for impairment annually as of the fiscal year end date, and more frequently if certain indicators are present.
62
NETWORK ENGINES, INC.
NOTES TO CONSOLIDATED FINANCIAL STATEMENTS (Continued)
4. Goodwill and Intangible Assets (Continued)
As of September 30, 2011, the Company performed its annual impairment review in accordance with authoritative guidance. Prior to performing the two step process, the Company reviewed qualitative factors to determine the likelihood of whether the fair value of the reporting unit was less than its carrying amount. Qualitative factors such as the decline in the price of the Company's common stock and an increase in the reporting unit's carrying value during the quarter led the Company to perform the two-step goodwill impairment test. The first step required the Company to determine the fair value of the reporting unit to which goodwill was allocated. The Company estimated the fair value of the reporting unit utilizing industry accepted valuation techniques that included the present value of estimated future cash flows using a risk-adjusted discount rate, and a market multiple approach, which considered the Company's market capitalization adjusted for a control premium. These valuation techniques required significant judgments by management, including estimates and assumptions about the Company's projected future operating results, discount rates, and long-term growth rates. The Company's forecasts of future revenue were based on expected future growth from new as well as existing customers, and historical trends. In addition, the Company considered the expected gross margins attainable in the future and the required level of operating expenses needed to conduct its business. Step one of this assessment resulted in the carrying value of the reporting unit exceeding the fair value. In step two of the impairment analysis, the Company compared the implied fair value of goodwill to the carrying value. After measuring the fair value of the reporting unit's assets and liabilities, the implied fair value of goodwill was determined to be zero. Consequently, the Company determined that goodwill was fully impaired, resulting in an impairment charge of $505,000 for the year ended September 30, 2011.
The Company recorded an intangible asset as the result of its acquisition of Alliance Systems. The acquired intangible asset is customer relationships, which is being amortized over 17 years, which is the estimated period of economic benefit expected to be received, resulting in a weighted average amortization period of 4.97 years. The following table presents the intangible asset balances as of September 30, 2011 and September 30, 2010 (in thousands):
| |
September 30, 2011 | September 30, 2010 | |||||||||||||||||
|---|---|---|---|---|---|---|---|---|---|---|---|---|---|---|---|---|---|---|---|
| |
Gross Carrying Amount |
Accumulated Amortization |
Net Book Value |
Gross Carrying Amount |
Accumulated Amortization |
Net Book Value |
|||||||||||||
Customer relationships |
$ | 11,775 | $ | 6,531 | $ | 5,244 | $ | 11,775 | $ | 5,201 | $ | 6,574 | |||||||
Amortization expense was $1,329,000 for the year ended September 30, 2011. The estimated future amortization expense for the intangible asset as of September 30, 2011 by fiscal year is $1,119,000 for 2012, $868,000 for 2013, $678,000 for 2014, and $537,000 for 2015, $434,000 for 2016, and $1,608,000 thereafter.
The Company reviews long-lived assets, including definite-lived intangible assets, to determine if any adverse conditions exist that would indicate impairment. Factors that could lead to an impairment of acquired customer relationships include a worsening in customer attrition rates compared to historical attrition rates, lower than initially anticipated cash flows associated with customer relationships, or goodwill impairment. Due to the goodwill impairment recorded during the year ended September 30, 2011, the Company assessed the recoverability of its intangible asset, based upon projected undiscounted future cash flows estimated to be generated by the intangible asset over its remaining useful life. Based upon this assessment, the Company determined that the carrying value of the intangible asset was recoverable, and therefore no impairment charge was recorded.
63
NETWORK ENGINES, INC.
NOTES TO CONSOLIDATED FINANCIAL STATEMENTS (Continued)
5. Cash and Cash Equivalents
Cash and cash equivalents consisted of the following (in thousands):
| |
September 30, | ||||||
|---|---|---|---|---|---|---|---|
| |
2011 | 2010 | |||||
Cash |
$ | 13,848 | $ | 15,323 | |||
Money market fund |
6,004 | — | |||||
Total cash and cash equivalents |
$ | 19,852 | $ | 15,323 | |||
6. Fair Value Measurements
The Company records its financial assets and liabilities at fair value, which is defined as the price that would be received to sell an asset or paid to transfer a liability (an "exit price"), in the principal or most advantageous market for the asset or liability, in an orderly transaction between market participants at the measurement date. Valuation techniques used to measure fair value include observable and unobservable inputs. Observable or market inputs reflect market data obtained from independent sources, while unobservable inputs reflect the Company's assumptions about market participant assumptions based on best information available.
Observable inputs are the preferred source of fair values. These two types of inputs create the following fair value hierarchy:
- •
- Level 1—Valuations are based on unadjusted quoted prices in active markets that are accessible at the
measurement date for identical assets or liabilities.
- •
- Level 2—Valuations are based on quoted prices for similar assets or liabilities in active markets, or
quoted prices for identical or similar assets or liabilities in markets that are not active for which significant inputs are observable, either directly or indirectly.
- •
- Level 3—Valuations are based on prices or valuation techniques that require inputs that are both unobservable and significant to the overall fair value measurement. Inputs reflect management's best estimates regarding the assumptions that market participants would use in valuing the asset or liability at the measurement date.
As of September 30, 2011, the Company held certain assets that are required to be measured at fair value on a recurring basis, consisting of money market funds, which are classified as cash equivalents. The Company did not hold any money market funds as of September 30, 2010. The following table presents the fair value hierarchy for the Company's financial assets measured at fair value on a recurring basis as of September 30, 2011 (in thousands):
| |
Fair Value Measurements at September 30, 2011 Using: |
|||||||||
|---|---|---|---|---|---|---|---|---|---|---|
| |
Level 1 Inputs | Level 2 Inputs | Level 3 Inputs | |||||||
Assets: |
||||||||||
Money market fund |
$ | 6,004 | $ | — | $ | — | ||||
64
NETWORK ENGINES, INC.
NOTES TO CONSOLIDATED FINANCIAL STATEMENTS (Continued)
6. Fair Value Measurements (Continued)
The net asset amount recorded in the balance sheet (carrying amount) and the estimated fair values of financial instruments at September 30, 2011 consisted of the following:
| |
Carrying Amount | Fair Value | |||||
|---|---|---|---|---|---|---|---|
Assets: |
|||||||
Money market fund |
$ | 6,004 | $ | 6,004 | |||
The fair values of the money market fund were based on the quoted market prices on securities exchanges.
7. Inventories
Inventories consisted of the following (in thousands):
| |
September 30, | ||||||
|---|---|---|---|---|---|---|---|
| |
2011 | 2010 | |||||
Raw materials |
$ | 10,020 | $ | 8,128 | |||
Work in process |
870 | 985 | |||||
Finished goods |
13,441 | 14,048 | |||||
Total inventories |
$ | 24,331 | $ | 23,161 | |||
8. Property and Equipment
Property and equipment consisted of the following (in thousands):
| |
|
September 30, | |||||||
|---|---|---|---|---|---|---|---|---|---|
| |
Useful Life | 2011 | 2010 | ||||||
Office furniture and equipment |
5 years | $ | 1,067 | $ | 1,028 | ||||
Engineering and production equipment |
3 years | 2,771 | 2,306 | ||||||
Computer equipment and software |
3 years | 6,681 | 5,944 | ||||||
Leasehold improvements |
Shorter of lease term or useful life of asset | 3,370 | 2,799 | ||||||
|
13,889 | 12,077 | |||||||
Less: accumulated depreciation and amortization |
(11,320 | ) | (10,507 | ) | |||||
|
$ | 2,569 | $ | 1,570 | |||||
Depreciation and amortization expense related to property and equipment was approximately $1,003,000, $936,000, and $911,000 for the years ended September 30, 2011, 2010, and 2009, respectively.
65
NETWORK ENGINES, INC.
NOTES TO CONSOLIDATED FINANCIAL STATEMENTS (Continued)
9. Stockholders' Equity
Preferred Stock
The Company has authorized up to 5,000,000 shares of preferred stock, $0.01 par value per share for issuance. The preferred stock will have such rights, preferences, privileges and restrictions, including voting rights, dividend rights, conversion rights, redemption privileges, and liquidation preferences, as shall be determined by the Company's Board of Directors upon its issuance.
Common Stock Repurchase Program
On June 12, 2008, the Board of Directors of the Company authorized the repurchase of up to $5 million of its common stock through a share repurchase program. As authorized by the program, shares may be purchased in the open market or through privately negotiated transactions, in a manner consistent with applicable securities laws and regulations. This stock repurchase program does not obligate the Company to acquire any specific number of shares, does not have an expiration date, and may be terminated at any time by the Company's Board of Directors. All repurchases are expected to be funded from the Company's current cash balances or from cash generated from operations. To facilitate repurchases of shares under this program, the Company has established Rule 10b5-1 plans intended to comply with the requirements of Rule 10b5-1 and Rule 10b-18 under the Securities Exchange Act of 1934. A Rule 10b5-1 plan permits the repurchase of shares by a company at times when it otherwise might be prevented from doing so under insider trading laws or because of company blackout periods, provided that the plan is adopted when the company is not aware of material non-public information. Pursuant to the plan, a broker designated by the Company has the authority to repurchase shares, in accordance with the terms of the plan, without further direction from the Company. The amount and timing of specific repurchases are subject to the terms of the plan and market conditions.
On June 13, 2011 the Company's Board of Directors authorized the continuation of the repurchase program for up to $2 million of its common stock from time to time on the open market or in non-solicited privately negotiated transactions. During the three months and year ended September 30, 2011, the Company repurchased 526,342 shares of its common stock at an average cost of $1.19 per share. From the inception of the share repurchase program through September 30, 2011, the Company has repurchased 3,107,888 shares of its common stock at an average cost of $0.90 per share. As of September 30, 2011, the maximum dollar value that may yet be used for purchases under the program was $1,373,000; however the repurchase program has been suspended as a result of the current hard drive supply interruptions due to the flooding in Thailand as the Company expects to be utilizing its cash for advanced purchases of inventory during this time.
10. Related Party Transactions
Robert M. Wadsworth, one of the Company's directors, is a managing director of the limited liability corporation that controls HarbourVest Partners (and its affiliates, collectively, "HarbourVest"), one of the Company's significant stockholders. HarbourVest is also a stockholder in Sepaton, Inc. ("Sepaton"). During the years ended September 30, 2011, 2010, and 2009, of the Company recorded revenues of $2.2 million, $3.7 million and $2.0 million related to sales of application platform solutions and services to Sepaton, respectively. The Company had $0.1 million and $1.4 million in accounts receivable outstanding from Sepaton at September 30, 2011 and 2010, respectively.
66
NETWORK ENGINES, INC.
NOTES TO CONSOLIDATED FINANCIAL STATEMENTS (Continued)
10. Related Party Transactions (Continued)
John A. Blaeser, the Company's Chairman of the Board of Directors, also serves as a director of Imprivata, Inc. ("Imprivata"). During the years ended September 30, 2011, 2010, and 2009, the Company recorded revenues of $709,000, $752,000, and $861,000, respectively, related to sales of application platform solutions and services to Imprivata. The Company had $89,000 and $115,000 in accounts receivable outstanding from Imprivata at September 30, 2011 and 2010, respectively.
Charles A. Foley, one of the Company's directors, also serves as the Chief Executive Officer of TimeSight Systems ("TimeSight", formerly known as Digital Ocular Networks). The Company did not record any revenue related to sales to TimeSight during the year ended September 30, 2011. During the years ended September 30, 2010, and 2009, the Company recorded revenues of $1,000, and $106,000, respectively, related to sales of application platform solutions to TimeSight. The Company had no amounts outstanding in accounts receivable from TimeSight at September 30, 2011 or 2010.
11. Stock Incentive Plans and Stock-Based Compensation
In October 1999, the Company's shareholders approved the 1999 Stock Incentive Plan (the "1999 Plan"). Under the 1999 Plan, stock options and restricted stock or other stock-based awards for up to 4,747,902 shares of common stock were available for issuance to employees, officers, directors, consultants and advisors of the Company. Options were granted for terms of up to ten years and vest over varying periods. Option grants to new employees generally vested 25% on the first anniversary of the employment date and thereafter in equal quarterly installments over the next three years. Subsequent grants to existing employees generally vested in equal quarterly installments over four years from the grant date. The option price per share was determined by the Board of Directors.
In May 2000, the Company's shareholders approved an increase of 3,300,000 in the number of shares authorized under the 1999 Plan and an automatic annual increase in the number of shares authorized under the 1999 Plan. The automatic annual increase was equal to the lesser of: 5% of the number of shares of common stock outstanding on the first day of each fiscal year; 4,000,000 shares; or an amount determined by the Board of Directors, which was subject to a maximum of 20,047,902 authorized shares under the 1999 Plan. During the years ended September 30, 2009 and 2008, the Company increased the number of shares available under the 1999 Plan by 0 shares and 2,051,450 shares, respectively. As of September 30, 2009, the Company was authorized to grant options, restricted stock or other awards of up to 16,608,723 shares of common stock under the 1999 Plan, and 3,073,640 shares were available for future grant. However, no grants were awarded under the 1999 Plan subsequent to September 30, 2009, as it had a 10 year term and expired in October 2009.
In May 2000, the Company's shareholders approved the 2000 Director Stock Option Plan (the "Director Plan"). Under the Director Plan, the Company may make formula grants of stock options to non-employee directors of up to 500,000 shares of common stock. Each non-employee director receives an initial grant of 50,000 shares upon appointment to the Company's board, which vests in equal annual installments over four years beginning on the first anniversary of the grant date. Subsequent annual grants of 15,000 shares to each non-employee director vest 100% on the first anniversary of the grant date. In March 2004, the Company's shareholders approved an increase of an additional 325,000 shares of common stock authorized to be issued under the Director Plan, resulting in a total of 825,000 shares authorized to be issued. Under the Director Plan, options to purchase 885,000 shares have been granted, options to purchase 150,000 shares have been exercised and options to purchase 60,000 shares
67
NETWORK ENGINES, INC.
NOTES TO CONSOLIDATED FINANCIAL STATEMENTS (Continued)
11. Stock Incentive Plans and Stock-Based Compensation (Continued)
have been cancelled through September 30, 2011. As of September 30, 2011 and 2010, there were no shares available for future grant under the Director Plan.
In May 2000, the Company's shareholders approved the 2000 Employee Stock Purchase Plan (the "Purchase Plan"). Under the Purchase Plan, the Company may issue up to an aggregate of 750,000 shares of common stock to eligible employees. In March 2004, March 2007, and March 2008, the Company's shareholders approved increases of 500,000, 250,000, and 350,000 additional shares, respectively, of common stock authorized to be issued under the Purchase Plan, resulting in a total of 1,850,000 shares authorized to be issued. Eligible employees must be employed by the Company for more than 20 hours per week and more than five months in a fiscal year. Under the Purchase Plan, the Company can make two offerings each fiscal year, at the end of which employees may purchase shares of common stock using funds withheld through payroll deductions over the term of each offering. Offering periods begin on the 15th day of November and May each year. The per share purchase price for offerings is equal to 85% of the closing price of the Company's common stock at the end of the offering period. No shares of common stock were issued under the Purchase Plan during the years ended September 30, 2011 and 2010, as there were no shares available for issuance under the Company's Purchase Plan. During the year ended September 30, 2009, 364,072 shares of common stock were issued under the Purchase Plan. Although additional shares may be proposed for shareholder authorization in the future, there are no current plans to propose any additional shares.
In March 2009, the Company's shareholders approved the 2009 Stock Incentive Plan (the "2009 Plan"). Under the 2009 Plan, stock options and restricted stock or other stock-based awards for up to 750,000 shares of common stock may be issued to employees, officers, directors, consultants and advisors of the Company. In March 2010, the Company's shareholders approved an increase of 2,000,000 in the number of shares authorized under the 2009 Plan. Options are granted for terms of up to ten years and vest over varying periods. Option grants to new employees generally vest 25% on the first anniversary of the employment date and thereafter in equal quarterly installments over the next three years. Subsequent grants to existing employees generally vest in equal quarterly installments over four years from the grant date. The option price per share is determined by the Board of Directors, but is not less than 100% of the fair market value of the stock on the day the option is granted. Each non-employee director receives an initial grant of 50,000 shares upon appointment to the Company's board, which vests in equal annual installments over four years beginning on the first anniversary of the grant date. Subsequent annual grants of 15,000 shares to each non-employee director vest 100% on the first anniversary of the grant date. The number of shares to be allocated to non-employee directors cannot exceed 20% of the maximum number of shares authorized under the 2009 Plan.
As of September 30, 2011, the Company is authorized to grant options, restricted stock or other awards up to 2,750,000 shares of common stock under the 2009 Plan, and 1,545,625 shares were available for future grant.
68
NETWORK ENGINES, INC.
NOTES TO CONSOLIDATED FINANCIAL STATEMENTS (Continued)
11. Stock Incentive Plans and Stock-Based Compensation (Continued)
A summary of stock option activity under the 1999 Plan, 2009 Plan, and the Director Plan follows:
| |
Number of Shares |
Weighted Average Exercise Price |
Weighted Average Remaining Contractual Term (in years) |
|||||||
|---|---|---|---|---|---|---|---|---|---|---|
Outstanding, September 30, 2010 |
7,262,112 | $ | 1.95 | |||||||
Granted |
786,000 | $ | 1.55 | |||||||
Exercised |
(137,014 | ) | $ | 0.82 | ||||||
Forfeited |
(121,880 | ) | $ | 1.30 | ||||||
Expired |
(153,593 | ) | $ | 2.43 | ||||||
Outstanding, September 30, 2011 |
7,635,625 | $ | 1.93 | 5.24 | ||||||
Vested and expected to vest |
7,563,025 | $ | 1.94 | 5.21 | ||||||
Exercisable at September 30, 2011 |
6,389,482 | $ | 2.06 | 4.63 | ||||||
All options granted during the years ended September 30, 2011, 2010, and 2009 were granted with exercise prices equal to the fair market value of the Company's common stock on the grant date and had weighted average fair values of $0.95, $0.94, and $0.23 per share, respectively, determined using the Black-Scholes option pricing model. As of September 30, 2011, the Company had reserved 7,635,625 shares of common stock for the exercise of outstanding stock options. For the 7,563,025 shares vested and expected to vest as of September 30, 2011, the aggregate intrinsic value was $764,000.
The Company estimates the fair value of stock options using the Black-Scholes valuation model. This valuation model takes into account the exercise price of the award, as well as various significant assumptions, including the expected term, the expected volatility of the price of the Company's common stock over the expected term, the risk-free interest rate over the expected term, and the Company's expected annual dividend yield. The Company believes that the valuation model and the approaches utilized to develop the underlying assumptions are appropriate in calculating the fair values of the Company's stock options granted during the years ended September 30, 2011, 2010 and 2009. Estimates of fair value are not intended to predict the value ultimately realized by persons who receive equity awards. In determining the amount of expense to be recorded, judgment is also required to estimate forfeitures of awards based on the probability of employees completing the required service periods. Historical forfeitures are used as a starting point for developing estimates of future forfeitures.
69
NETWORK ENGINES, INC.
NOTES TO CONSOLIDATED FINANCIAL STATEMENTS (Continued)
11. Stock Incentive Plans and Stock-Based Compensation (Continued)
Assumptions used to determine the fair values of options granted using the Black-Scholes valuation model were:
| |
Year Ended September 30, | |||||
|---|---|---|---|---|---|---|
| |
2011 | 2010 | 2009 | |||
Expected term(1) |
3.75 to 6.50 years | 3.75 to 6.50 years | 3.50 to 6.00 years | |||
Expected volatility factor(2) |
69.80% to 77.71% | 71.56% to 75.31% | 66.82% to 80.11% | |||
Risk-free interest rate(3) |
0.76% to 2.42% | 1.45% to 2.97% | 1.28% to 2.21% | |||
Expected annual dividend yield |
—% | —% | —% | |||
- (1)
- The
expected term was determined based on analysis of the Company's historical exercise and post-vesting cancellation activity.
- (2)
- The
expected volatility for each grant was estimated based on a weighted average of the historical volatility of the Company's common stock. The weighted
average volatilities used for the years ended September 30, 2011, 2010 and 2009 were 72.36%, 72.14%, and 68.95%, respectively.
- (3)
- The risk-free interest rate for each grant was based on the U.S. Treasury yield curve in effect at the time of grant for a period equal to the expected term of the stock option.
The following table presents stock-based employee compensation expenses included in the Company's consolidated statements of operations (in thousands):
| |
Year Ended September 30, | |||||||||
|---|---|---|---|---|---|---|---|---|---|---|
| |
2011 | 2010 | 2009 | |||||||
Cost of revenues |
$ | 132 | $ | 150 | $ | 147 | ||||
Engineering and development |
112 | 169 | 245 | |||||||
Selling and marketing |
306 | 325 | 290 | |||||||
General and administrative |
340 | 435 | 630 | |||||||
Total stock-based compensation expense |
$ | 890 | $ | 1,079 | $ | 1,312 | ||||
At September 30, 2011, the aggregate intrinsic value of options outstanding and options exercisable was $768,000 and $547,000, respectively. The intrinsic value of a stock option is the amount by which the market value of the underlying stock exceeds the exercise price of the option.
The aggregate intrinsic value of options exercised during the years ended September 30, 2011, 2010, and 2009 was $102,000, $1,273,000, and $6,000, respectively.
70
NETWORK ENGINES, INC.
NOTES TO CONSOLIDATED FINANCIAL STATEMENTS (Continued)
11. Stock Incentive Plans and Stock-Based Compensation (Continued)
The following table summarizes the stock options outstanding at September 30, 2011:
| |
Options Outstanding | |
|
|||||||||||||
|---|---|---|---|---|---|---|---|---|---|---|---|---|---|---|---|---|
| |
Options Exercisable | |||||||||||||||
| |
|
Weighted Average Exercise Price |
Weighted Average Remaining Contractual Term (in years) |
|||||||||||||
Exercise Price Range
|
Number | Number | Weighted Average Exercise Price |
|||||||||||||
$0.37 - $0.38 |
110,708 | $ | 0.38 | 5.54 | 108,833 | $ | 0.38 | |||||||||
$0.39 - $0.39 |
807,379 | $ | 0.39 | 6.92 | 522,980 | $ | 0.39 | |||||||||
$0.50 - $1.27 |
459,627 | $ | 1.01 | 2.97 | 355,063 | $ | 0.97 | |||||||||
$1.36 - $1.36 |
1,454,282 | $ | 1.36 | 4.28 | 1,452,875 | $ | 1.36 | |||||||||
$1.38 - $1.57 |
1,258,877 | $ | 1.48 | 7.35 | 617,414 | $ | 1.44 | |||||||||
$1.59 - $1.73 |
769,139 | $ | 1.62 | 5.93 | 644,186 | $ | 1.61 | |||||||||
$1.75 - $2.11 |
355,093 | $ | 1.94 | 5.82 | 327,966 | $ | 1.95 | |||||||||
$2.12 - $2.12 |
909,688 | $ | 2.12 | 6.03 | 851,052 | $ | 2.12 | |||||||||
$2.19 - $2.76 |
782,832 | $ | 2.46 | 4.05 | 782,832 | $ | 2.46 | |||||||||
$3.03 - $8.62 |
728,000 | $ | 5.93 | 2.34 | 726,281 | $ | 5.94 | |||||||||
|
7,635,625 | $ | 1.93 | 5.24 | 6,389,482 | $ | 2.06 | |||||||||
At September 30, 2011, unrecognized compensation expense related to unvested stock options was $758,000, which is expected to be recognized over a weighted average period of 2.16 years.
12. Commitments and Contingencies
Operating Leases
The Company leases its office and manufacturing space under non-cancelable operating leases. During the year ended September 30, 2011, the Company entered into an amendment of its headquarters building in Canton, Massachusetts, which extended the lease term for 52,000 square feet of office and manufacturing space through September 2017 with two available extensions of five years, each at the Company's election. The new lease includes annual rent escalation clauses, and accordingly, rent expense is recognized on a straight-line basis and any amounts paid which are greater than or less than the amount expensed are recorded as deferred rent liabilities.
The Company also leases 83,000 square feet of office and manufacturing space in Plano, Texas. During the year ended September 30, 2010, the Company entered into a lease that replaced and extended the Company's existing lease for its space in Plano, Texas. The lease has an initial term of 90 months, with two available extension options of three years, each at the Company's election. The lease includes annual rent escalation clauses, and accordingly, rent expense is recognized on a straight-line basis, as described above.
The Company also entered into a lease agreement with Multis on January 18, 2011 to lease approximately 20,000 square feet of manufacturing and warehousing space in Galway, Ireland through December 2015, however, at the option of the Company, it may terminate the lease agreement with Multis on the third anniversary of the agreement, on January 18, 2014. Under the terms of the lease agreement, rent is payable quarterly.
71
NETWORK ENGINES, INC.
NOTES TO CONSOLIDATED FINANCIAL STATEMENTS (Continued)
12. Commitments and Contingencies (Continued)
As of September 30, 2011, the future minimum lease payments under the Company's non-cancelable operating leases were as follows (in thousands):
Year Ending September 30,
|
|
|||
|---|---|---|---|---|
2012 |
$ | 1,242 | ||
2013 |
1,355 | |||
2014 |
1,154 | |||
2015 |
1,080 | |||
2016 |
1,107 | |||
After 5 years |
1,009 | |||
Total |
$ | 6,947 | ||
Rent expense for the years ended September 30, 2011, 2010 and 2009 was $1,683,000, $1,585,000, and $1,590,000, respectively.
Guarantees and Indemnifications
Acquisition-related indemnifications—When, as part of an acquisition, the Company acquires all the stock of a company, the Company assumes liabilities for certain events or circumstances that took place prior to the date of acquisition. The maximum potential amount of future payments the Company could be required to make for such obligations is undeterminable. Although certain provisions of the agreements remain in effect indefinitely, the Company believes that the probability of receiving a claim related to acquisitions other than Alliance Systems is unlikely. As a result, the Company had not recorded any liabilities for such indemnification clauses as of September 30, 2011. As of September 30, 2011, the Company had received three claims related to the Alliance Systems acquisition. For one of the claims, the Company paid a settlement of $88,000 during the fiscal year ended September 30, 2008. The second claim was the result of a defective product purchased by a customer of Alliance System's. In April 2010, a settlement was reached with the former customer, whereby the former Alliance Systems shareholders agreed to pay $100,000 and the Company's insurer agreed to pay $300,000 to the former customer. Payment of the settlement was made on May 12, 2010. The third claim is related to a sales and use tax audit of Alliance Systems by the state of Texas. The Company is indemnified by the former shareholders of Alliance Systems, as provided under the terms of the merger agreement, for any resulting liabilities related to the period prior to the date that the Company acquired Alliance Systems.
The Company enters into standard indemnification agreements in the ordinary course of its business. Pursuant to these agreements, the Company indemnifies, holds harmless, and agrees to reimburse the indemnified party for losses suffered or incurred by the indemnified party, generally its business partners or customers, in connection with any patent, copyright, trademark, trade secret or other intellectual property infringement claim by any third party with respect to its products. The term of these indemnification agreements is generally perpetual. The Company has never incurred costs to defend lawsuits or settle claims related to these indemnification agreements. As a result, the Company believes the estimated fair value of these agreements is minimal. Accordingly, the Company has no liabilities recorded for these indemnifications as of September 30, 2011 and 2010.
72
NETWORK ENGINES, INC.
NOTES TO CONSOLIDATED FINANCIAL STATEMENTS (Continued)
12. Commitments and Contingencies (Continued)
Product Warranties
The Company offers and fulfills standard warranty services on some of its application platform solutions. Warranty terms vary in duration depending upon the product sold, but generally provide for the repair or replacement of any defective products for periods of up to 36 months after shipment. Based upon historical experience and expectation of future conditions, the Company reserves for the estimated costs to fulfill customer warranty obligations upon the recognition of the related product revenue.
The following table presents changes in the Company's product warranty liability (in thousands):
| |
Year Ended September 30, | |||||||||
|---|---|---|---|---|---|---|---|---|---|---|
| |
2011 | 2010 | 2009 | |||||||
Beginning balance |
$ | 557 | $ | 641 | $ | 931 | ||||
Accruals for warranties issued |
1,756 | 1,655 | 1,101 | |||||||
Fulfillment of warranties during the period |
(1,828 | ) | (1,739 | ) | (1,391 | ) | ||||
Ending balance |
$ | 485 | $ | 557 | $ | 641 | ||||
Contingencies
Initial Public Offering Lawsuit
On or about December 3, 2001, a putative class action lawsuit was filed in the United States District Court for the Southern District of New York against the Company, Lawrence A. Genovesi (the Company's former Chairman and Chief Executive Officer), Douglas G. Bryant (the Company's Chief Financial Officer), and several underwriters of the Company's initial public offering. The suit alleges, inter alia, that the defendants violated the federal securities laws by issuing and selling securities pursuant to the Company's initial public offering in July 2000 ("IPO") without disclosing to investors that the underwriter defendants had solicited and received excessive and undisclosed commissions from certain investors. The suit seeks damages and certification of a plaintiff class consisting of all persons who acquired shares of the Company's common stock between July 13, 2000 and December 6, 2000.
In October 2002, Lawrence A. Genovesi and Douglas G. Bryant were dismissed from this case without prejudice. On December 5, 2006, the United States Court of Appeals for the Second Circuit overturned the District Court's certification of a plaintiff class. On April 6, 2007, the Second Circuit denied plaintiffs' petition for rehearing, but clarified that the plaintiffs may seek to certify a more limited class in the District Court. On September 27, 2007, plaintiffs filed a motion for class certification in certain designated "focus cases" in the District Court. That motion has since been withdrawn. On November 13, 2007, the issuer defendants in certain designated "focus cases" filed a motion to dismiss the second consolidated amended class action complaints that were filed in those cases. On March 26, 2008, the District Court issued an Opinion and Order denying, in large part, the motions to dismiss the amended complaints in the "focus cases." On April 2, 2009, the plaintiffs filed a motion for preliminary approval of a new proposed settlement between plaintiffs, the underwriter defendants, the issuer defendants and the insurers for the issuer defendants. On June 10, 2009, the Court issued an opinion preliminarily approving the proposed settlement, and scheduling a settlement fairness hearing for September 10, 2009. On October 5, 2009, the Court issued an opinion granting plaintiffs' motion for final approval of the settlement, approval of the plan of distribution of the
73
NETWORK ENGINES, INC.
NOTES TO CONSOLIDATED FINANCIAL STATEMENTS (Continued)
12. Commitments and Contingencies (Continued)
settlement fund, and certification of the settlement classes. An Order and Final Judgment was entered on December 30, 2009. Various notices of appeal of the District Court's October 5, 2009 order were filed. On October 7, 2010, all but two parties who had filed a notice of appeal filed a stipulation with the District Court withdrawing their appeals with prejudice, and the two remaining objectors filed briefs in support of their appeals. On May 17, 2011, the Second Circuit dismissed one of the appeals and remanded the one remaining appeal to the District Court for further proceedings to determine whether the remaining objector has standing. On August 25, 2011, the District Court concluded that the remaining objector lacks standing to object to the settlement because he was not a class member. On September 23, 2011, the remaining objector filed a Notice of Appeal of the District Court's August 25, 2011 Order. That appeal remains pending. The Company is unable to predict the outcome of this suit and as a result, no amounts have been accrued as of September 30, 2011.
13. Income Taxes
The Company recorded an income tax benefit of $30,613,000 for the year ended September 30, 2011. The benefit was primarily attributable to the reduction of the Company's deferred income tax valuation allowance. In accordance with authoritative guidance related to accounting for income taxes, the Company evaluated the likelihood that it would realize the deferred income taxes to offset future taxable income, as the deferred income taxes are comprised primarily of net operating loss ("NOL") carryforwards. As of September 30, 2011, the Company expects that the deferred tax assets will be recovered based upon its cumulative profits over the past three years, as well as its projection of future profitability. As such, the Company fully reduced the deferred income tax valuation allowance of $30,856,000 as of September 30, 2011, of which $29,283,000 related to deferred federal taxes and $1,573,000 related to deferred state taxes. The benefit recorded from reducing the valuation allowance was partially offset by a current provision of $226,000 for income taxes recorded for certain state taxes where the Company does not have NOL carryforwards to offset taxable income as well as a current provision of $17,000 related to foreign taxes.
The Company recorded a net benefit from income taxes of $11,000 for the year ended September 30, 2010. The benefit was attributable to the Company's ability to carry back its net operating loss ("NOL") from fiscal year 2009 to offset alternative minimum tax ("AMT") paid in prior years. For the year ended September 30, 2010, the benefit of approximately $125,000 was partially offset by $114,000 in provisions for income taxes in certain states where the Company does not have NOL carryforwards to offset taxable income.
Due to a taxable loss incurred during the year ended September 30, 2009, the Company did not record a provision for any federal or state income taxes in that year.
74
NETWORK ENGINES, INC.
NOTES TO CONSOLIDATED FINANCIAL STATEMENTS (Continued)
13. Income Taxes (Continued)
The following table presents a reconciliation between the amount of the Company's income taxes utilizing the U.S. federal statutory rate and the Company's actual provision for income taxes (in thousands):
| |
Year Ended September 30, | |||||||||
|---|---|---|---|---|---|---|---|---|---|---|
| |
2011 | 2010 | 2009 | |||||||
At U.S. federal statutory rate |
$ | 2,070 | $ | 516 | $ | (1,088 | ) | |||
State taxes, net of federal effect |
149 | 200 | (113 | ) | ||||||
Foreign taxes |
17 | — | — | |||||||
Non-deductible expenses and other items |
400 | 171 | 446 | |||||||
State credits |
(13 | ) | — | — | ||||||
Foreign credits |
(17 | ) | — | — | ||||||
Foreign rate differential |
(39 | ) | — | — | ||||||
AMT Tax (Benefit) |
— | (125 | ) | — | ||||||
Effect of change in valuation allowance |
(33,180 | ) | (773 | ) | 755 | |||||
Provision for (benefit from) income taxes |
$ | (30,613 | ) | $ | (11 | ) | $ | — | ||
Deferred income taxes reflect the net tax effects of temporary differences between the carrying amounts of assets and liabilities for financial reporting purposes and income tax purposes using enacted tax rates in effect for the year in which the differences are expected to reverse. Net deferred tax assets consisted of the following (in thousands):
| |
September 30, | ||||||
|---|---|---|---|---|---|---|---|
| |
2011 | 2010 | |||||
Deferred tax assets: |
|||||||
Net operating losses |
$ | 22,122 | $ | 28,711 | |||
Temporary differences |
9,328 | 8,285 | |||||
Tax credit carryforwards |
1,452 | 1,616 | |||||
Capitalized research and engineering |
— | 108 | |||||
Total deferred tax assets |
32,902 | 38,720 | |||||
Valuation allowance for deferred tax assets |
— | (36,090 | ) | ||||
Net deferred tax assets |
32,902 | 2,630 | |||||
Deferred tax liabilities: |
|||||||
Intangible asset |
(2,046 | ) | (2,630 | ) | |||
Net deferred tax asset |
$ | 30,856 | $ | — | |||
A valuation allowance is established if it is more likely than not that all or a portion of the deferred tax asset will not be realized. As of September 30, 2011, the Company determined that based upon its three years of cumulative profitability as well as its future projected earnings it expects to realize the benefits from the deferred income taxes. As such, the Company fully reduced the deferred income tax valuation allowance of $30,856,000 as of September 30, 2011. As of September 30, 2010, a valuation allowance was recorded for the amount of the deferred tax asset not reduced by deferred tax liabilities due to the uncertainty of its realization.
75
NETWORK ENGINES, INC.
NOTES TO CONSOLIDATED FINANCIAL STATEMENTS (Continued)
13. Income Taxes (Continued)
The Company's deferred tax assets as of September 30, 2011 and 2010 in the table above do not include $2,704,000 and $2,686,000, respectively of excess tax benefits from the exercises of employee stock options that are a component of NOL's. Total Stockholder's Equity as of September 30, 2011 will be increased by $2,704,000, if and when, any such tax benefits are ultimately realized.
As of September 30, 2011, the Company had NOL carryforwards for federal and state income tax purposes of approximately $72,282,000 and $5,006,000 respectively, including deductions related to employee stock options of $7,953,000. For federal income tax purposes these NOL carryforwards will expire as follows: $29,501,000 in 2021, $22,686,000 in 2022, $3,458,000 in 2023, $1,172,000 in 2024, $9,187,000 in 2025 and $6,278,000 thereafter. For state income tax purposes these NOL carryforwards will expire as follows: $29,000 in 2012, $39,000 in 2013, $2,965,000 in 2014, $40,000 in 2015, $995,000 in 2016, and $938,000 thereafter.
The Company also has credits available, primarily related to research and development credits, for federal and state income tax purposes as of September 30, 2011 of approximately $1,045,000 and $591,000, respectively, which expire at various dates from 2012 through 2022.
An ownership change, as defined in the Internal Revenue Code, resulting from the issuance of additional stock may limit the amount of net operating loss and tax credit carryforwards that can be utilized annually to offset future taxable income and tax liabilities. The amount of the annual limitation is determined based upon the Company's value immediately prior to the ownership change. Subsequent significant changes in ownership could further affect the limitations in future years.
The Company has an uncertain tax position of approximately $534,000 related to the validity of certain tax credit carryforwards. The Company has recorded an allowance in the amount of $534,000 for this uncertainty to reduce the value of the deferred tax asset pertaining to the tax credit carryforwards. Because the Company has significant operating loss carryforwards to offset future taxable income, the Company does not expect to utilize any of these credits in the near term, and as a result, the Company does not expect that the uncertain tax position will change significantly within the next twelve months.
The Company accounts for uncertainties in income taxes using a two-step process in accordance with authoritative guidance provided by the FASB. Under this guidance, the Company classifies any penalties and interest as a component of the income tax provision. As part of the accounting for the acquisition of Alliance Systems, the Company has included, as a component of the net assets acquired, an estimated liability for approximately $123,000 for uncertain tax positions. These uncertain tax positions related to state tax filing requirements. This liability, which included an estimate of $31,000 for interest and penalties, was based on the known facts at the time of the purchase price allocation. As of September 30, 2011, approximately $62,000 was accrued for interest and penalties related to uncertain tax positions.
The Company files its tax returns as prescribed by the tax laws of the jurisdictions in which it operates. The Company's tax filings for federal and state jurisdictions for the years from 2004 to 2010 are still subject to examination.
76
NETWORK ENGINES, INC.
NOTES TO CONSOLIDATED FINANCIAL STATEMENTS (Continued)
13. Income Taxes (Continued)
A reconciliation of the beginning and ending amount of gross uncertain tax positions (in thousands) is presented in the table below.
| |
Year Ended September 30, | |||||||||
|---|---|---|---|---|---|---|---|---|---|---|
| |
2011 | 2010 | 2009 | |||||||
Beginning balance |
$ | 753 | $ | 753 | $ | 710 | ||||
Reclassification of prior year liability |
— | — | 43 | |||||||
Increase for prior years |
6 | — | — | |||||||
Increase for current year |
— | — | — | |||||||
Acquired uncertain tax positions |
— | — | — | |||||||
Reductions related to settlements with tax authorities |
— | — | — | |||||||
Reductions related to expiration of statute of limitations |
(6 | ) | — | — | ||||||
Ending balance |
$ | 753 | $ | 753 | $ | 753 | ||||
14. Employee Savings Plan
The Company sponsors a savings plan for its employees who meet certain eligibility requirements, which is designed to be a qualified plan under Section 401(k) of the Internal Revenue Code. Eligible employees are permitted to contribute to the 401(k) plan through payroll deductions within statutory and plan limits. The Company may make discretionary contributions upon the approval of the 401(k) plan trustees and the Company's Board of Directors. Through September 30, 2011, the Company had not made any contributions to this plan.
15. Line of Credit
On October 11, 2007, the Company entered into a Loan and Security Agreement (the "Loan Agreement") with Silicon Valley Bank (the "Bank") to establish a line of credit from which the Company could borrow. On August 5, 2008, the Company and the Bank entered into the First Loan Modification Agreement (the "First Modification"). The First Modification amended the Loan Agreement to extend its term to August 5, 2010, and to change the amount of the revolving loan facility to $10 million.
On February 5, 2010, the Company and the Bank entered into an Amended and Restated Loan and Security Agreement. This agreement amended the Loan Agreement to extend its term to February 4, 2012, and to change the interest rate on the line to one half of a point (0.50%) above the Prime Rate with interest payable monthly. The Prime Rate is the rate announced from time to time by the Bank.
77
NETWORK ENGINES, INC.
NOTES TO CONSOLIDATED FINANCIAL STATEMENTS (Continued)
16. Geographic Data
Substantially all of the Company's long-lived assets were located in the United States as of September 30, 2011, 2010, and 2009. The Company operates as one segment, which reflects the way that management views the Company's operations. The following table summarizes the Company's revenues by geographic region, in thousands:
| |
Year Ended September 30, | |||||||||
|---|---|---|---|---|---|---|---|---|---|---|
| |
2011 | 2010 | 2009 | |||||||
United States |
$ | 187,328 | $ | 167,584 | $ | 111,997 | ||||
Foreign countries |
85,140 | 54,036 | 36,725 | |||||||
Total net revenues |
$ | 272,468 | $ | 221,620 | $ | 148,722 | ||||
Revenues are attributed to countries based on the location of the end-users. Significant components of revenues in foreign countries consisted of the following (in thousands):
| |
Year Ended September 30, | |||||||||
|---|---|---|---|---|---|---|---|---|---|---|
| |
2011 | 2010 | 2009 | |||||||
Ireland |
$ | 44,164 | $ | 29,460 | $ | 19,146 | ||||
United Kingdom |
6,778 | 4,221 | 2,983 | |||||||
Netherlands |
6,681 | 3,814 | 396 | |||||||
Australia |
5,212 | 2,037 | 444 | |||||||
Hong Kong |
2,643 | 1,432 | — | |||||||
Canada |
2,041 | 1,713 | 2,874 | |||||||
China |
1,467 | 2,775 | 4,346 | |||||||
Other |
16,154 | 8,584 | 6,536 | |||||||
Total |
$ | 85,140 | $ | 54,036 | $ | 36,725 | ||||
78
NETWORK ENGINES, INC.
NOTES TO CONSOLIDATED FINANCIAL STATEMENTS (Continued)
17. Quarterly Financial Data (Unaudited)
The following information has been derived from unaudited consolidated financial statements that, in the opinion of management, include all recurring adjustments necessary for a fair statement of such information.
| |
Three Months Ended | ||||||||||||
|---|---|---|---|---|---|---|---|---|---|---|---|---|---|
| |
December 31, 2010 |
March 31, 2011 |
June 30, 2011 |
September 30, 2011 |
|||||||||
| |
(in thousands, except per share data) |
||||||||||||
Net revenues |
$ | 71,706 | $ | 64,953 | $ | 66,105 | $ | 69,704 | |||||
Gross margin |
7,522 | 7,556 | 7,772 | 8,082 | |||||||||
Net income(1) |
1,352 | 1,477 | 1,885 | 31,987 | |||||||||
Basic net income per share |
$ | 0.03 | $ | 0.03 | $ | 0.04 | $ | 0.75 | |||||
Diluted net income per share |
$ | 0.03 | $ | 0.03 | $ | 0.04 | $ | 0.74 | |||||
Basic weighted average shares outstanding |
42,859 |
42,895 |
42,951 |
42,670 |
|||||||||
Diluted weighted average shares outstanding |
43,867 | 44,438 | 43,910 | 43,330 | |||||||||
| |
Three Months Ended | ||||||||||||
|---|---|---|---|---|---|---|---|---|---|---|---|---|---|
| |
December 31, 2009 |
March 31, 2010 |
June 30, 2010 |
September 30, 2010 |
|||||||||
| |
(in thousands, except per share data) |
||||||||||||
Net revenues |
$ | 44,052 | $ | 55,030 | $ | 61,582 | $ | 60,956 | |||||
Gross margin |
6,055 | 6,503 | 6,749 | 6,165 | |||||||||
Net income |
198 | 236 | 672 | 423 | |||||||||
Basic net income per share |
$ | 0.00 | $ | 0.01 | $ | 0.02 | $ | 0.01 | |||||
Diluted net income per share |
$ | 0.00 | $ | 0.01 | $ | 0.01 | $ | 0.01 | |||||
Basic weighted average shares outstanding |
42,027 |
42,050 |
42,555 |
42,833 |
|||||||||
Diluted weighted average shares outstanding |
42,833 | 43,566 | 45,369 | 44,382 | |||||||||
- (1)
- The results of operations for the three months ended September 30, 2011 includes the impact of the change in the Company's deferred tax valuation allowance of $30,856,000 (see Note 13) and the impairment of goodwill of $505,000 (see Note 4).
18. Subsequent Event
As a result of the industry-wide hard drive supply shortage, the Company has accelerated its purchasing of materials in an effort to meet future demand. As a result, on October 26, 2011 the Company issued a letter of credit for $8 million to one of its largest suppliers to supplement its credit limit with this supplier. This letter of credit expires on January 25, 2012 and reduces the amount available under its existing line of credit. Because the Company will continue to purchase inventory on an accelerated schedule to meet expected demand for its second fiscal quarter, the Company's working capital requirements may require it to draw on its line of credit facility. As a result, on December 13, 2011, the Company entered into an amendment to increase its existing line of credit facility with SVB from $10 million to $18 million and to extend its term to March 31, 2012. Amounts borrowed under the Line of Credit will bear interest at a rate equal to the greater of the floating Prime Rate or 3.25%, payable monthly. The "Prime Rate" is the rate announced from time to time by the Wall Street Journal as its "prime rate." The Company is also subject to an unused line of credit fee of 0.30% per annum, payable monthly, and to certain financial covenants relating to liquidity and minimum operating cash flows per quarter. As of the date of issuance of these financial statements, the Company had $10 million in available credit on this facility as a result of the outstanding $8 million letter of credit.
79
ITEM 9. CHANGES IN AND DISAGREEMENTS WITH ACCOUNTANTS ON ACCOUNTING AND FINANCIAL DISCLOSURE
None.
ITEM 9A. CONTROLS AND PROCEDURES
Disclosure Controls and Procedures
Our management, with the participation of our chief executive officer and chief financial officer, evaluated the effectiveness of our disclosure controls and procedures (as defined in Rules 13a-15(e) and 15d-15(e) under the Securities Exchange Act) as of September 30, 2011. Based on this evaluation, our chief executive officer and chief financial officer concluded that, as of September 30, 2011, our disclosure controls and procedures were (1) effective in accumulating and communicating information to the Company's management, as appropriate, to allow timely decisions regarding required disclosure, and (2) effective, in that they provide reasonable assurance that information required to be disclosed by the Company in the reports that it files or submits under the Securities Exchange Act is recorded, processed, summarized and reported within the time periods specified in the SEC's rules and forms.
Management's Annual Report on Internal Control Over Financial Reporting
The management of Network Engines, Inc. is responsible for establishing and maintaining adequate internal control over financial reporting. Internal control over financial reporting is defined in Rule 13a-15(f) or 15d-15(f) promulgated under the Securities Exchange Act of 1934 as a process designed by, or under the supervision of, the company's principal executive and principal financial officers and effected by the company's board of directors, management and other personnel, to provide reasonable assurance regarding the reliability of financial reporting and the preparation of financial statements for external purposes in accordance with generally accepted accounting principles and includes those policies and procedures that:
- •
- Pertain to the maintenance of records that in reasonable detail accurately and fairly reflect the transactions and
dispositions of the assets of the company;
- •
- Provide reasonable assurance that transactions are recorded as necessary to permit preparation of financial statements in
accordance with generally accepted accounting principles, and that receipts and expenditures of the company are being made only in accordance with authorizations of management and directors of the
company; and
- •
- Provide reasonable assurance regarding prevention or timely detection of unauthorized acquisition, use or disposition of the company's assets that could have a material effect on the financial statements.
Because of its inherent limitations, internal control over financial reporting may not prevent or detect misstatements. Also, projections of any evaluation of effectiveness to future periods are subject to the risk that controls may become inadequate because of changes in conditions, or that the degree of compliance with the policies or procedures may deteriorate.
Management assessed the effectiveness of the Company's internal control over financial reporting as of September 30, 2011. In making this assessment, it used the criteria set forth in Internal Control-Integrated Framework issued by the Committee of Sponsoring Organizations of the Treadway Commission ("COSO"). Based on our assessment, we concluded that, as of September 30, 2011, the Company's internal control over financial reporting was effective based on those criteria.
The effectiveness of the Company's internal control over financial reporting as of September 30, 2011 has been audited by PricewaterhouseCoopers LLP, an independent registered public accounting firm, as stated in their report which appears under Item 15.
80
Changes in Internal Control Over Financial Reporting
During the quarter ended September 30, 2011, no change in the Company's internal control over financial reporting (as defined in Rules 13a-15(f) and 15d-15(f) under the Exchange Act) occurred that has materially affected, or is reasonably likely to materially affect, the Company's internal control over financial reporting.
On December 13, 2011, we entered into an amendment with Silicon Valley Bank ("SVB"). This agreement amends the Amended and Restated Loan and Security Agreement dated February 5, 2010. The amendment provides us with a revolving line of credit in an amount not to exceed $18,000,000. The line of credit matures and any outstanding principal balance is payable in full on March 31, 2012.
Amounts borrowed under the line of credit bear interest at a floating per annum rate equal to the Prime Rate. The "Prime Rate" is the rate announced from time to time by the Wall Street Journal as its "prime rate." We are also subject to an unused line of credit fee of 0.30% per annum, payable monthly, and to financial covenants which require us to maintain specified liquidity and minimum operating cash flows per quarter.
The foregoing description of the Amended Loan Agreement is not complete and is qualified in its entirety by reference to the Second Loan Modification Agreement, which is filed as Exhibit 10.42 hereto and is incorporated herein by reference.
ITEM 10. DIRECTORS, EXECUTIVE OFFICERS AND CORPORATE GOVERNANCE
The information required by this item relating to directors, code of ethics, audit committee, and audit committee financial expert of the Company and Section 16(a) beneficial ownership reporting compliance is contained in our Proxy Statement related to the 2012 Annual Meeting of Shareholders to be filed with the Securities and Exchange Commission no later than 120 days after the end of our fiscal year, under the sections captioned "Election of Directors", "Information About Directors" and "Section 16(a) Beneficial Ownership Reporting Compliance", and is incorporated herein by reference in response to this item. The information regarding executive officers is included in Part I of this Form 10-K under the section captioned "Executive Officers of the Company".
ITEM 11. EXECUTIVE COMPENSATION
The information required by this item is included under the section captioned "Executive Compensation" in our Proxy Statement related to the 2012 Annual Meeting of Shareholders to be filed with the Securities and Exchange Commission no later than 120 days after the end of our fiscal year and is incorporated herein by reference.
ITEM 12. SECURITY OWNERSHIP OF CERTAIN BENEFICIAL OWNERS AND MANAGEMENT AND RELATED STOCKHOLDER MATTERS
The information required by this item relating to security ownership of certain beneficial owners and management, and securities authorized for issuance under equity compensation plans, is included in our Proxy Statement related to the 2012 Annual Meeting of Shareholders to be filed with the Securities and Exchange Commission no later than 120 days after the end of our fiscal year under the section captioned "Stock Ownership of Directors, Officers and Greater-Than-5%-Stockholders" and is incorporated herein by reference.
81
ITEM 13. CERTAIN RELATIONSHIPS AND RELATED TRANSACTIONS, AND DIRECTOR INDEPENDENCE
The information required by this item relating to certain relationships and related transactions is included in our Proxy Statement related to the 2012 Annual Meeting of Shareholders to be filed with the Securities and Exchange Commission no later than 120 days after the end of our fiscal year under the sections captioned "Board and Committees" and "Certain Relationships and Related Party Transactions" and is incorporated herein by reference.
ITEM 14. PRINCIPAL ACCOUNTING FEES AND SERVICES
The information required by this item is included under the caption "Ratification of the Selection of Independent Registered Public Accounting Firm" in our Proxy Statement related to the 2012 Annual Meeting of Shareholders to be filed with the Securities and Exchange Commission no later than 120 days after the end of our fiscal year and is incorporated herein by reference.
ITEM 15. EXHIBITS AND FINANCIAL STATEMENT SCHEDULES
(a)(1) Financial Statements
The following consolidated financial statements are filed as part of this report under "Item 8—Financial Statements and Supplementary Data":
(a)(2) List of Schedules
Schedule II—Valuation and Qualifying Accounts for each of the three fiscal years ended September 30, 2011.
All other schedules to the consolidated financial statements are omitted as the required information is either inapplicable or presented in the consolidated financial statements.
(a)(3) List of Exhibits
The exhibits which are filed with this report or which are incorporated by reference are set forth in the Exhibit Index hereto.
82
Pursuant to the requirements of Section 13 or 15(d) of the Securities Exchange Act of 1934, the registrant has duly caused this report to be signed on its behalf by the undersigned, thereunto duly authorized, on December 14, 2011.
| NETWORK ENGINES, INC. | ||||
By: |
/s/ GREGORY A. SHORTELL Gregory A. Shortell President and Chief Executive Officer |
|||
Pursuant to the requirements of the Securities Exchange Act of 1934, the report has been signed as of December 14, 2011 below by the following persons on behalf of the registrant and in the capacities indicated.
Name
|
Title
|
|
|---|---|---|
| /s/ GREGORY A. SHORTELL Gregory A. Shortell |
President and Chief Executive Officer (Principal Executive Officer) and Director | |
/s/ DOUGLAS G. BRYANT Douglas G. Bryant |
Chief Financial Officer, Treasurer and Secretary (Principal Financial Officer and Principal Accounting Officer) |
|
/s/ JOHN A. BLAESER John A. Blaeser |
Director |
|
/s/ CHARLES A. FOLEY Charles A. Foley |
Director |
|
/s/ GARY E. HAROIAN Gary E. Haroian |
Director |
|
/s/ PATRICIA C. SUELTZ Patricia C. Sueltz |
Director |
|
/s/ FONTAINE K. RICHARDSON Fontaine K. Richardson |
Director |
|
/s/ ROBERT M. WADSWORTH Robert M. Wadsworth |
Director |
83
NETWORK ENGINES, INC.
Valuation and Qualifying Accounts
(in thousands)
Fiscal Year |
Description | Balance At Beginning of Period |
Additions | Deductions | Balance At End of Period |
||||||||||
|---|---|---|---|---|---|---|---|---|---|---|---|---|---|---|---|
2009 |
Allowance For Doubtful Accounts |
$ | 122 | $ | 83 | $ | 88 | $ | 117 | ||||||
2010 |
Allowance For Doubtful Accounts |
$ | 117 | $ | 32 | $ | 86 | $ | 63 | ||||||
2011 |
Allowance For Doubtful Accounts |
$ | 63 | $ | 54 | $ | 7 | $ | 110 | ||||||
2009 |
Allowance For Sales Returns |
$ |
194 |
$ |
629 |
$ |
733 |
$ |
90 |
||||||
2010 |
Allowance For Sales Returns |
$ | 90 | $ | 465 | $ | 478 | $ | 77 | ||||||
2011 |
Allowance For Sales Returns |
$ | 77 | $ | 1,265 | $ | 1,194 | $ | 148 | ||||||
2009 |
Deferred Tax Asset Valuation Allowance |
$ |
36,536 |
$ |
755 |
$ |
(73 |
) |
$ |
37,364 |
|||||
2010 |
Deferred Tax Asset Valuation Allowance |
$ | 37,364 | $ | 1,666 | $ | 2,940 | $ | 36,090 | ||||||
2011 |
Deferred Tax Asset Valuation Allowance |
$ | 36,090 | $ | 1,925 | $ | 38,015 | $ | — | ||||||
84
| Exhibit No. | Exhibit | |
|---|---|---|
| 2.1 | Agreement and Plan of Merger, dated October 9, 2007, by and among Network Engines, Inc., Nautilus Acquisition Corp., a Texas corporation and a wholly-owned subsidiary of Network Engines, Alliance Systems, Inc., a Texas corporation, and Jonathan Shapiro, as Shareholder Representative (Filed as Exhibit 2.1 to the Company's Current Report on Form 8-K dated October 15, 2007 and incorporated by reference herein). | |
| 3.1 | Second Amended and Restated Certificate of Incorporation of the Company (filed as Exhibit 3.1 to the Company's Annual Report on Form 10-K for the fiscal year ended September 30, 2000 (File No. 000-30863) and incorporated by reference herein). | |
| 3.2 | Third Amended and Restated By-laws of the Company (filed as Exhibit 3.01 to the Company's Current Report on Form 8-K dated February 8, 2008 and incorporated by reference herein). | |
| 4.1 | Specimen common stock certificate (filed as Exhibit 4.1 to the Company's registration statement on Form S-1 (File No. 333-34286) and incorporated by reference herein). | |
| 10.1 | Investor Rights Agreement, dated December 20, 1999, among the Company and certain of our investors (filed as Exhibit 10.6 to the Company's registration statement on Form S-1 (File No. 333-34286) and incorporated by reference herein). | |
| 10.2* | The Company's 1999 Stock Incentive Plan (filed as Exhibit 10.2 to the Company's registration statement on Form S-1 (File No. 333-34286) and incorporated by reference herein). | |
| 10.3* | Form of First Amendment to the Company's 1999 Stock Incentive Plan (filed as Exhibit 10.16 to the Company's registration statement on Form S-1 (File No. 333-34286) and incorporated by reference herein). | |
| 10.4* | Form of Incentive Stock Option Agreement under the Company's 1999 Stock Incentive Plan (filed as Exhibit 10.3 to the Company's registration statement on Form S-1 (File No. 333-34286) and incorporated by reference herein). | |
| 10.5* | The Company's 2000 Employee Stock Purchase Plan, as Amended (filed as Exhibit 10.4 to the Company's registration statement on Form S-1 (File No. 333-34286) and incorporated by reference herein). | |
| 10.6* | The Company's 2000 Director Stock Option Plan, as Amended (filed as Exhibit 10.5 to the Company's registration statement on Form S-1 (File No. 333-34286) and incorporated by reference herein). | |
| 10.7* | Form of option granted to Robert M. Wadsworth on March 16, 2000, under the Company's 1999 Stock Incentive Plan (filed as Exhibit 10.15 to the Company's registration statement on Form S-1 (File No. 333-34286) and incorporated by reference herein). | |
| 10.12 | Lease dated October 19, 1999 with New Boston Batterymarch, LP for 25 Dan Road, Canton, Massachusetts (filed as exhibit 10.1 to the Company's registration statement of Form S-1 (File No. 333-34286) and incorporated by reference herein). | |
| 10.13 | First Amendment dated February 1, 2000 and Second Amendment dated June 1, 2000 to Lease for 25 Dan Road, Canton, Massachusetts (filed as Exhibit 10.18 to the Company's registration statement on Form S-1 (File No. 333-34286) and incorporated by reference herein). |
85
| Exhibit No. | Exhibit | |
|---|---|---|
| 10.14 | Third Amendment dated September 14, 2000 and Fourth Amendment dated October 14, 2003 to Lease for 25 Dan Road, Canton, Massachusetts (filed as Exhibit 10.24 to the Company's Annual Report on Form 10-K for the fiscal year ended September 30, 2003 (File No. 000-30863) and incorporated by reference herein). | |
| 10.15† | Purchase Agreement for product between the Company and EMC Corporation, dated February 5, 2002 (filed as Exhibit 10.36 to the Company's Quarterly Report on Form 10-Q for the fiscal quarter ended March 31, 2002 (File No. 000-30863) and incorporated by reference herein). | |
| 10.16 | Severance Terms Agreement, dated January 9, 2006, between the Company and Gregory A. Shortell (Filed as Exhibit 10.1 to the Company's Quarterly Report on Form 10-Q for the quarter ended December 31, 2005 (File No. 000-30863) and incorporated by reference herein). | |
| 10.17 | Letter Agreement, dated January 6, 2006, between the Company and Gregory A. Shortell (Filed as Exhibit 10.2 to the Company's Quarterly Report on Form 10-Q for the quarter ended December 31, 2005 (File No. 000-30863) and incorporated by reference herein). | |
| 10.19 | Base Salaries of Executive Officers of the Company. | |
| 10.20 | Summary of the Company's Non-Employee Director Compensation. | |
| 10.21 | Fifth Amendment dated July 20, 2006 to Lease for 25 Dan Road, Canton, Massachusetts (Filed as Exhibit 10.21 to the Company's Annual Report on Form 10-K for fiscal year ended September 30, 2008 and incorporated by reference herein). | |
| 10.24 | Loan and Security Agreement, dated as of October 11, 2007, by and among Network Engines, Inc., Alliance Systems, Inc. and Silicon Valley Bank (Filed as Exhibit 10.1 to the Company's Current Report on Form 8-K dated October 15, 2007 and incorporated by reference herein). | |
| 10.25* | Amended and Restated Executive Retention Agreement, dated December 30, 2008, between the Company and Gregory A. Shortell (filed as Exhibit 99.1 to the Company's Current Report on Form 8-K dated January 6, 2009 and incorporated by reference herein). | |
| 10.26* | Amended and Restated Executive Retention Agreement, dated December 30, 2008, between the Company and Douglas G. Bryant (filed as Exhibit 99.2 to the Company's Current Report on Form 8-K dated January 6, 2009 and incorporated by reference herein). | |
| 10.29* | Amended and Restated Executive Retention Agreement, dated December 30, 2008, between the Company and Richard P. Graber (filed as Exhibit 99.4 to the Company's Current Report on Form 8-K dated January 6, 2009 and incorporated by reference herein). | |
| 10.30 | First Loan Modification Agreement, dated as of August 5, 2008, by and among Network Engines, Inc., Alliance Systems, Inc. and Silicon Valley Bank (Filed as Exhibit 10.1 to the Company's Quarterly Report on Form 10-Q for the quarter ended June 30, 2008 and incorporated by reference herein). | |
| 10.31 | Sixth Amendment dated August 6, 2008 to Lease for 25 Dan Road, Canton, Massachusetts (Filed as Exhibit 10.31 to the Company's Annual Report on Form 10-K for fiscal year ended September 30, 2008 and incorporated by reference herein). |
86
| Exhibit No. | Exhibit | |
|---|---|---|
| 10.32* | Amended and Restated Executive Retention Agreement, dated December 30, 2008, between the Company and Charles N. Cone III (filed as Exhibit 99.3 to the Company's Current Report on Form 8-K dated January 6, 2009 and incorporated by reference herein). | |
| 10.33* | The Company's 2009 Incentive Plan (filed as Exhibit 10.34 to the Company's Quarterly Report on Form 10-Q for the quarter ended March 31, 2009 and incorporated by reference herein). | |
| 10.34* | Form of Incentive Stock Option Agreement under the 2009 Incentive Plan (filed as Exhibit 10.35 to the Company's Quarterly Report on Form 10-Q for the quarter ended March 31, 2009 and incorporated by reference herein). | |
| 10.35* | Form of Non-statutory Stock Option Agreement under the 2009 Incentive Plan (filed as Exhibit 10.36 to the Company's Quarterly Report on Form 10-Q for the quarter ended March 31, 2009 and incorporated by reference herein). | |
| 10.36 | Amended and Restated Loan and Security Agreement, dated as of February 5, 2010, by and among Network Engines, Inc., and Silicon Valley Bank (Filed as Exhibit 10.1 to the Company's Quarterly Report on Form 10-Q for the quarter ended December 31, 2009 and incorporated by reference herein). | |
| 10.37 | Lease Agreement, dated June 30, 2010, between Network Engines, Inc. and Rainier Asset Management Company, LLC (Filed as Exhibit 10.2 to the Company's Quarterly Report on Form 10-Q for the quarter ended June 30, 2010 and incorporated by reference herein). | |
| 10.38 | Seventh Amendment dated March 31, 2011 to Lease for 25 Dan Road, Canton, Massachusetts (Filed as Exhibit 10.1 to the Company's Quarterly Report on Form 10-Q for the quarter ended March 31, 2011 and incorporated by reference herein). | |
| 10.39 | Eight Amendment dated March 31, 2011 to Lease for 25 Dan Road, Canton, Massachusetts (Filed as Exhibit 10.2 to the Company's Quarterly Report on Form 10-Q for the quarter ended March 31, 2011 and incorporated by reference herein). | |
| 10.40† | Amendment Number One, dated August 12, 2003, to the Purchase Agreement for product between the Company and EMC Corporation dated February 5, 2002 (Filed as Exhibit 10.3 to the Company's Quarterly Report on Form 10-Q for the quarter ended March 31, 2011 and incorporated by reference herein). | |
| 10.41† | Amendment Number Two, dated February 18, 2011, to the Purchase Agreement for product between the Company and EMC Corporation dated February 5, 2002 (Filed as Exhibit 10.4 to the Company's Quarterly Report on Form 10-Q for the quarter ended March 31, 2011 and incorporated by reference herein). | |
| 10.42 | Second Loan Modification Agreement, dated as of December 13, 2011, by and among Network Engines, Inc., and Silicon Valley Bank. | |
| 14.1 | Code of Business Conduct and Ethics of the Company (filed as Exhibit 14 to the Company's Current Report on form 8-K dated February 3, 2004 and incorporated by reference herein). | |
| 21.1 | Subsidiaries of the Company. | |
| 23.1 | Consent of PricewaterhouseCoopers LLP. | |
| 31.1 | Certification of Gregory A. Shortell, the Chief Executive Officer of the Company, pursuant to Section 302 of the Sarbanes-Oxley Act of 2002. |
87
| Exhibit No. | Exhibit | |
|---|---|---|
| 31.2 | Certification of Douglas G. Bryant, the Chief Financial Officer of the Company, pursuant to Section 302 of the Sarbanes-Oxley Act of 2002. | |
| 32.1 | Certification of Gregory A. Shortell, the Chief Executive Officer of the Company, pursuant to Section 906 of the Sarbanes-Oxley Act of 2002. | |
| 32.2 | Certification of Douglas G. Bryant, the Chief Financial Officer of the Company, pursuant to Section 906 of the Sarbanes-Oxley Act of 2002. | |
| 101.INS‡ | XBRL Instance Document | |
| 101.SCH‡ | XBRL Schema Document | |
| 101.CAL‡ | XBRL Calculation Linkbase Document | |
| 101.DEF‡ | XBRL Definition Linkbase Document | |
| 101.LAB‡ | XBRL Label Linkbase Document | |
| 101.PRE‡ | XBRL Presentation Linkbase Document |
- *
- Indicates
management contract or compensatory plan or arrangement.
- †
- Confidential
treatment requested as to certain portions, which have been separately filed with the Securities and Exchange Commission pursuant to
a Confidential Treatment Request.
- ‡
- Pursuant to Rule 406T of Regulation S-T, these interactive data files shall not be deemed to be "filed" for purposes of Section 18 of the Securities Exchange Act of 1934, as amended, or otherwise subject to liability under that section, and shall not be incorporated by reference into any registration statement or other document filed under the Securities Act of 1933, as amended, except as expressly set forth by specific reference in such filing.
88