Attached files
| file | filename |
|---|---|
| 8-K - FORM 8-K - LENNOX INTERNATIONAL INC | t72157_8k.htm |
| EX-99.2 - EXHIBIT 99.2 - LENNOX INTERNATIONAL INC | ex99-2.htm |
Exhibit 99.1
 |
2011
Investment Community Meeting
December 14, 2011
|
 |
FORWARD-LOOKING STATEMENTS
This presentation contains forward-looking statements within the meaning of the Private Securities Litigation Reform Act of 1995. These statements are subject to numerous risks and uncertainties that could cause actual results to differ materially from such statements. Such risks and uncertainties include, but are not limited to, the impact of higher raw material and commodity prices, the impact of unfavorable weather, and the ability of the company to execute its strategic plans. For more information concerning these and other risks and uncertainties, see Lennox International’s Form 10-K and other publicly available filings with the Securities and Exchange Commission. LII disclaims any intention or obligation to update or revise any forward-looking statements, whether as a result of new information, future events or otherwise.
Use of Non-GAAP Financial Measures
A reconciliation of non-GAAP financial measures appearing in this presentation to financial measures prepared in accordance with U.S. Generally Accepted Accounting Principles
(GAAP) is posted on the company’s website at www.lennoxinternational.com.
2
|
 |
Who We Are
Update on Strategic Priorities 2011 Review & 2012 Guidance Questions & Answers
3
|
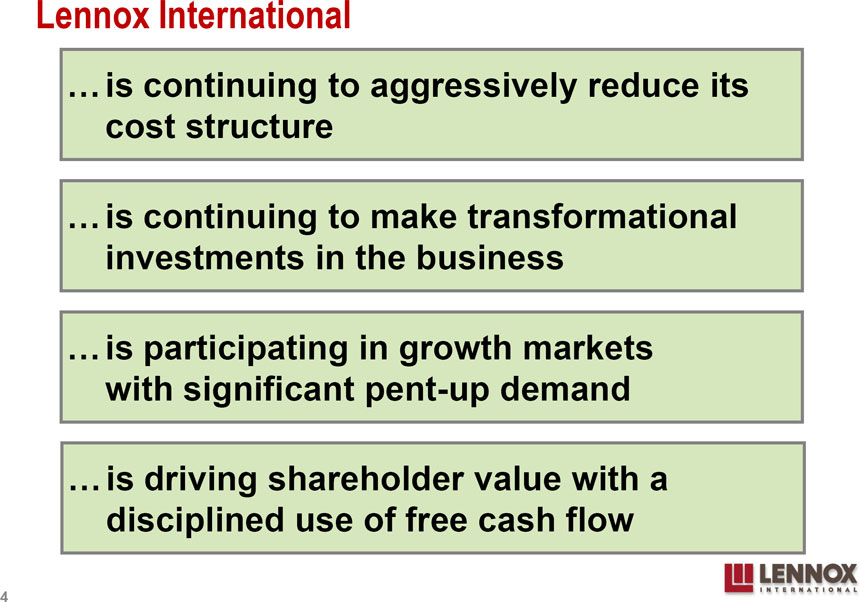 |
Lennox International
… is continuing to aggressively reduce its cost structure
… is continuing to make transformational investments in the business
… is participating in growth markets with significant pent-up demand
… is driving shareholder value with a disciplined use of free cash flow
4
|
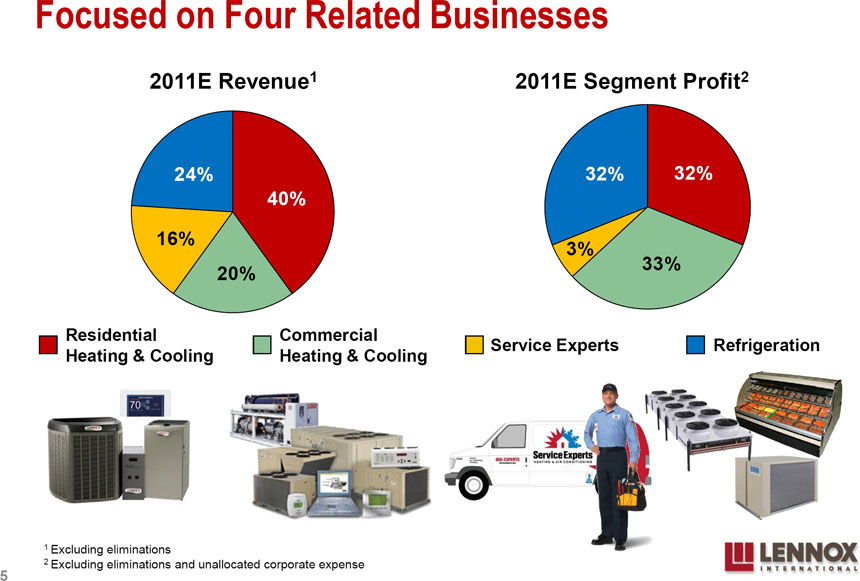 |
Focused on Four Related Businesses
2011E Revenue1 2011E Segment Profit2 24% 32% 32% 40% 16% 3% 33% 20% Residential Commercial
Service Experts Refrigeration Heating & Cooling Heating & Cooling
1 Excluding eliminations
2 Excluding eliminations and unallocated corporate expense
5
|
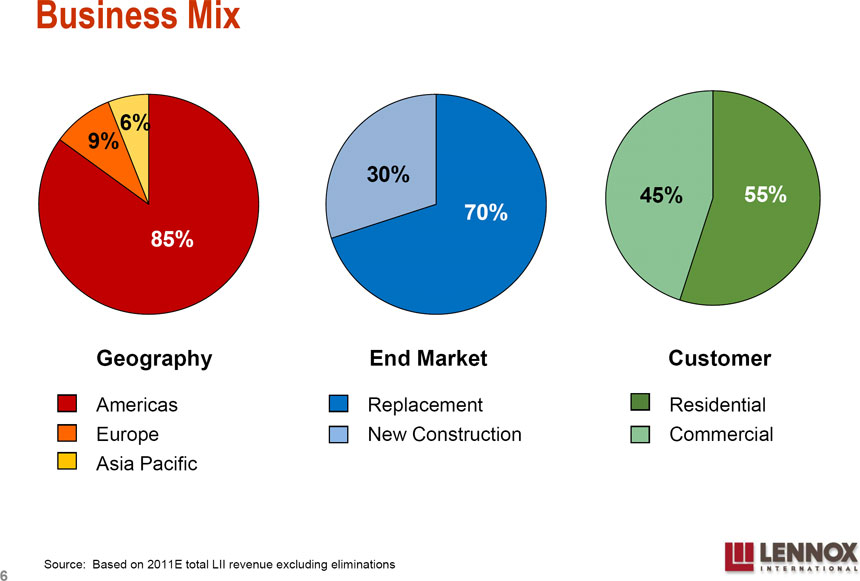 |
Business Mix
9% 6%
30%
45% 55%
70% 85%
Geography End Market Customer
Americas Replacement Residential Europe New Construction Commercial Asia Pacific
Source: Based on 2011E total LII revenue excluding eliminations
6
|
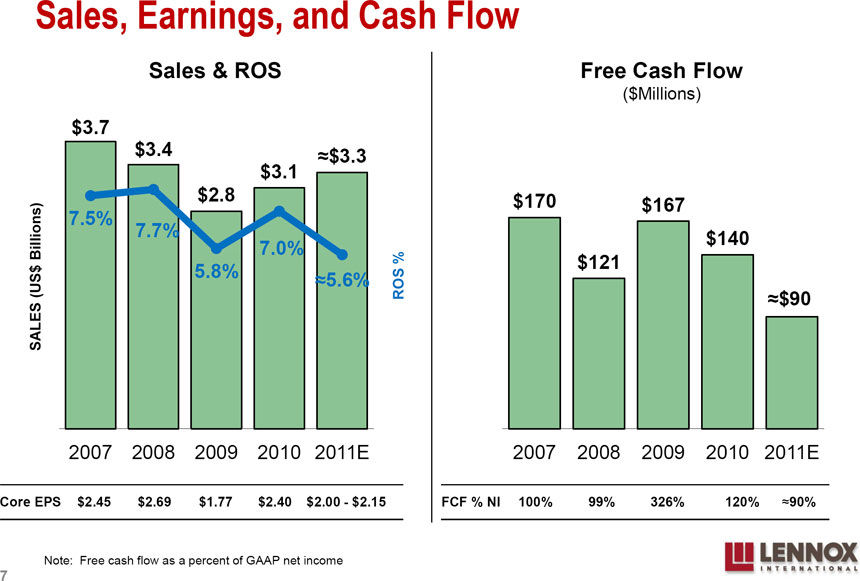 |
Sales, Earnings, and Cash Flow
Sales & ROS Free Cash Flow
($Millions)
$4 10% $250
$3.7 $3.4 $3.1 $3.3
8% $200
$3 $2.8 $170 $167 7.5% 7.7% $140 7.0% 6% $150 $121
$2 5.8% 5.6% ROS %
SALES (US$ Billions) 4% $100 $90
$1
2% $50
$0 0% $0
2007 2008 2009 2010 2011E 2007 2008 2009 2010 2011E
Core EPS $2.45 $2.69 $1.77 $2.40 $2.00 - $2.15 FCF % NI 100% 99% 326% 120% 90%
Note: Free cash flow as a percent of GAAP net income
7
|
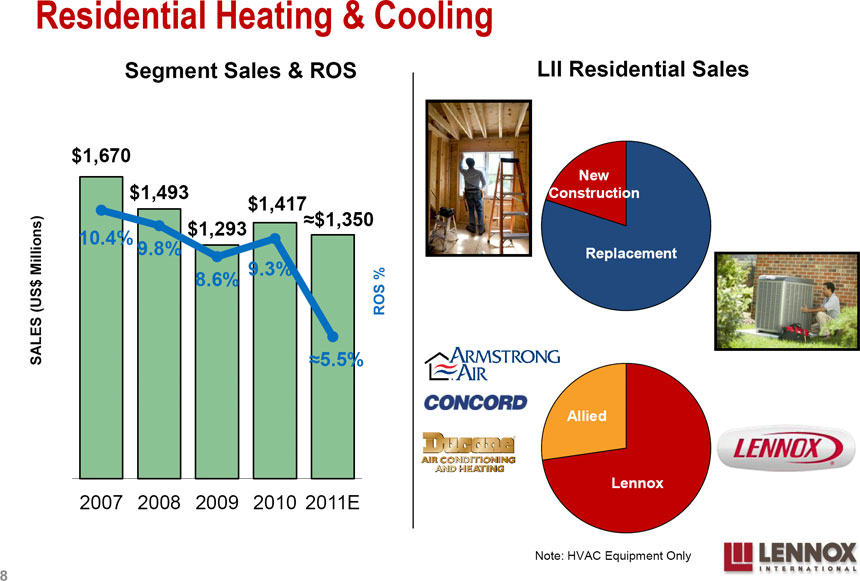 |
Residential Heating & Cooling
Segment Sales & ROS LII Residential Sales $2,000 14% Replacement
$1,670
12% NC
New NC $1,493 Construction
$1,500
$1,293$1,417 $1,35010% Replacement 10.4% 9.8% Replacement
8.6% 9.3% 8%
$1,000 ROS %
SALES (US$ Millions) 6%
5.5%
4% $500
Allied Allied 2%
Lennox
$0 0% Lennox
2007 2008 2009 2010 2011E
Note: HVAC Equipment Only
8
|
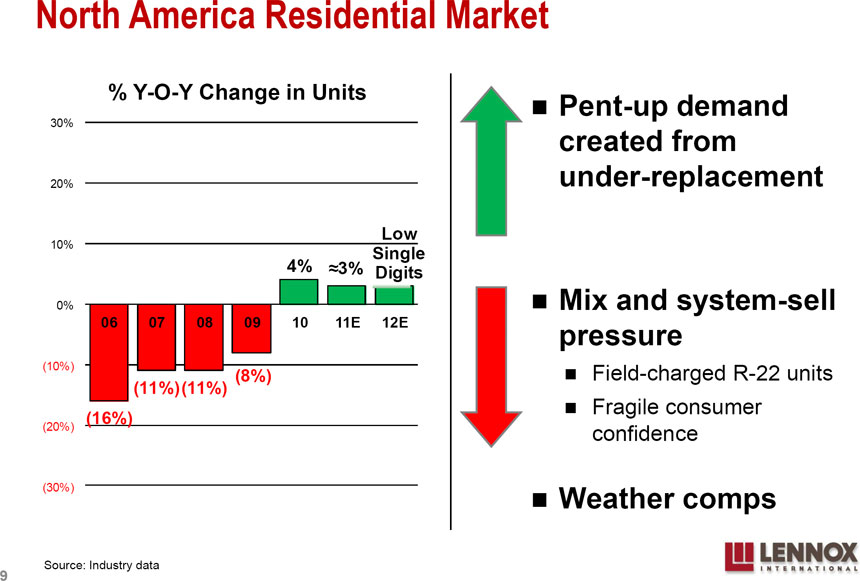 |
North America Residential Market % Y-O-Y Change in Units Pent-up demand
30% created from 20% under-replacement Low 10% Single 4% 3% Digits 0% Mix and system-sell
06 07 08 09 10 11E 12E pressure (10%) Field-charged R-22 units (11%)(11%) (8%) Fragile consumer
(16%) (20%) confidence (30%) Weather comps Source: Industry data
9
|
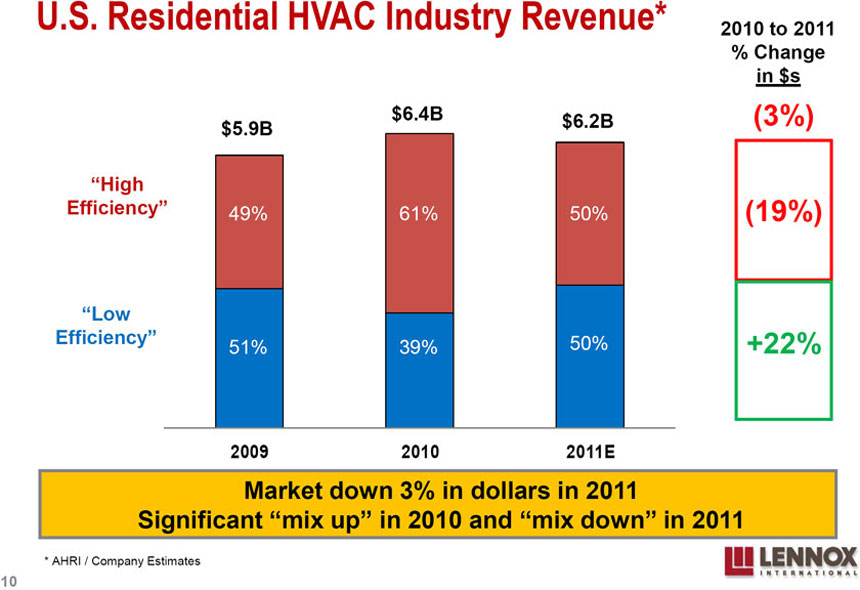 |
U.S. Residential HVAC Industry Revenue* 2010 to 2011
% Change in $s $6.4B $6.2B (3%) $5.9B
“High 50%
Efficiency” 49% 61% 50% (19%)
“Low 50%
Efficiency” 50% +22% 51% 39%
2009 2010 2011E
Market down 3% in dollars in 2011
Significant “mix up” in 2010 and “mix down” in 2011
* AHRI / Company Estimates
10
|
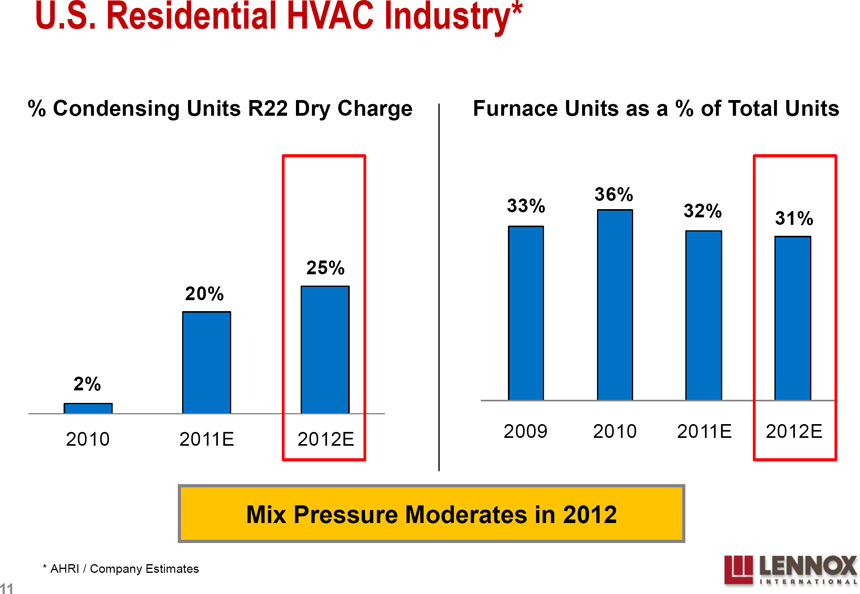 |
U.S. Residential HVAC Industry*
% Condensing Units R22 Dry Charge Furnace Units as a % of Total Units
36% 33% 32% 31% 25% 20%
2% 2010 2011E 2012E 2009 2010 2011E 2012E
Mix Pressure Moderates in 2012 * AHRI / Company Estimates
11
|
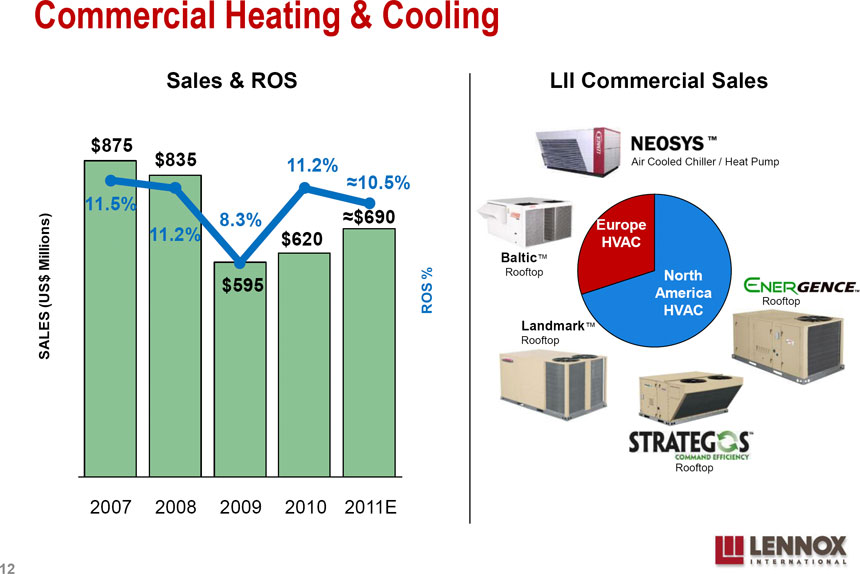 |
Commercial Heating & Cooling
Sales & ROS LII Commercial Sales
$1,000 14%
$875
$835 11.2% Air Cooled Chiller / Heat Pump
12%
$800 10.5% 11.5%
8.3% $690 10% Europe
11.2% $620
HVAC $600 Baltic
8% Rooftop North $595 America
ROS % Rooftop
HVAC
6% Landmark $400
SALES (US$ Millions) Rooftop
4% $200 2%
Rooftop
$0 0%
2007 2008 2009 2010 2011E
12
|
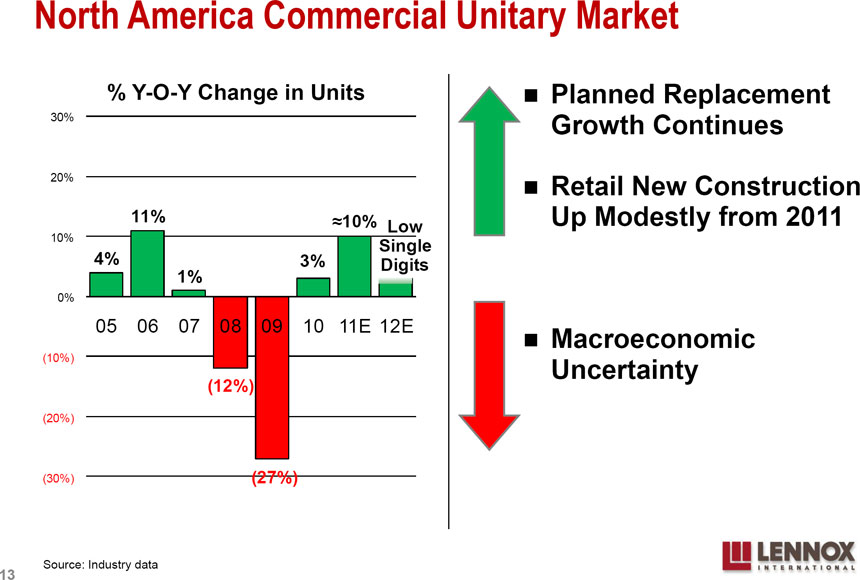 |
North America Commercial Unitary Market
% Y-O-Y Change in Units Planned Replacement
30% Growth Continues
20% Retail New Construction 11% Up Modestly from 2011
10% Low
10% Single
4% 3% Digits
1% 0% 05 06 07 08 09 10 11E 12E Macroeconomic (10%) Uncertainty
(12%) (20%)
(30%) (27%)
Source: Industry data
13
|
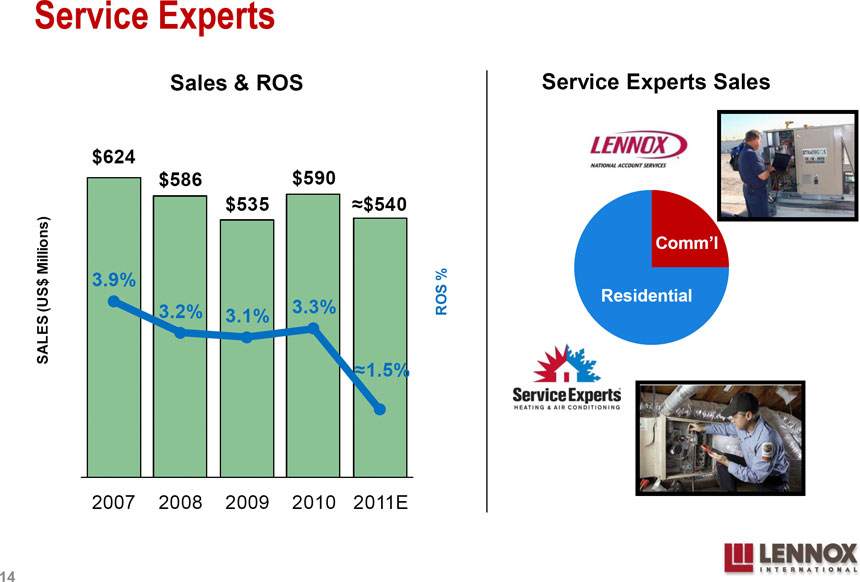 |
Service Experts
Sales & ROS Service Experts Sales 8% $624 $586 $590 $600
$535 $540 6%
Comm’l
$400 3.9%
4% Residential
3.2% 3.3% ROS %
SALES (US$ Millions) 3.1%
1.5%
$200 2% $0 0%
2007 2008 2009 2010 2011E
14
|
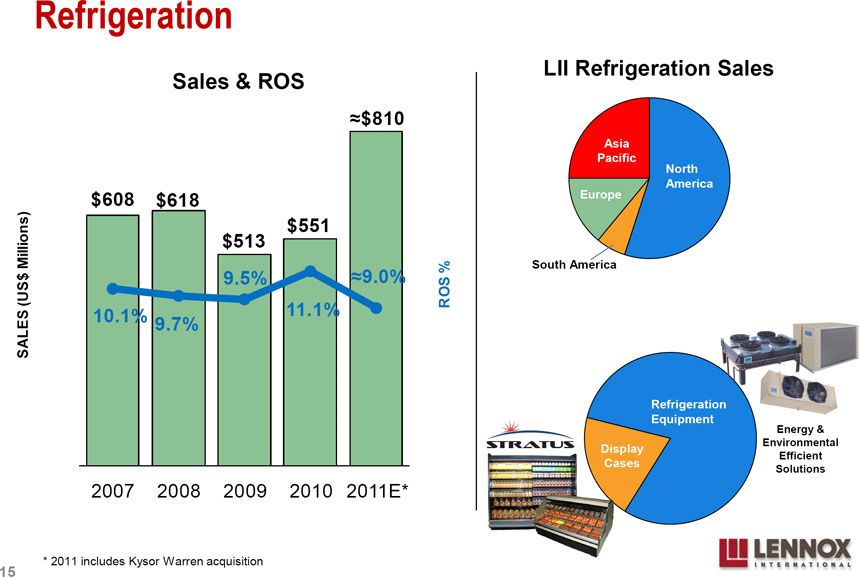 |
Refrigeration
LII Refrigeration Sales Sales & ROS $810 20%
$800 Asia 18% Pacific North 16% America $608 $618 Europe $600 $551 14%
$513 12% South America 9.5% 9.0% 10% $400 11.1% ROS %
SALES (US$ Millions) 10.1% 9.7% 8% 6% $200
4% Refrigeration Equipment
2% Energy & Environmental
Display
Efficient
$0 0% Cases
Solutions
2007 2008 2009 2010 2011E*
* 2011 includes Kysor Warren acquisition
15
|
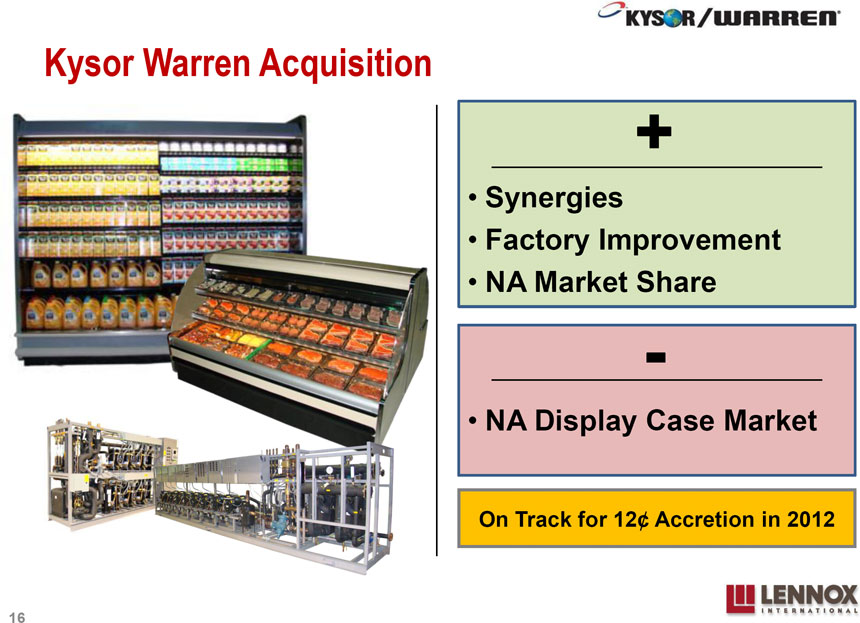 |
Kysor Warren Acquisition
Synergies
Factory Improvement
NA Market Share
NA Display Case Market
On Track for 12¢ Accretion in 2012
16
|
 |
Who We Are
Update on Strategic Priorities 2011 Review & 2012 Guidance Questions & Answers
17
|
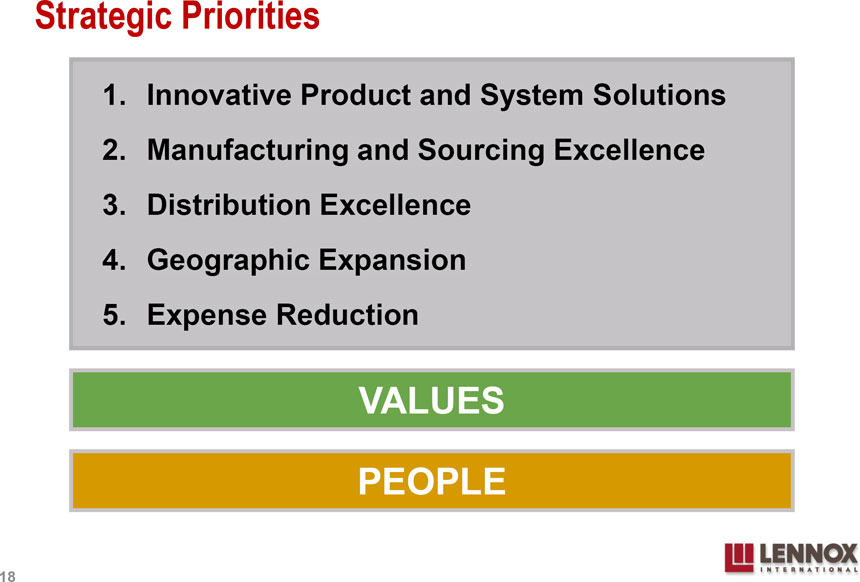 |
Strategic Priorities
1. Innovative Product and System Solutions
2. Manufacturing and Sourcing Excellence
3. Distribution Excellence
4. Geographic Expansion
5. Expense Reduction
VALUES
PEOPLE
18
|
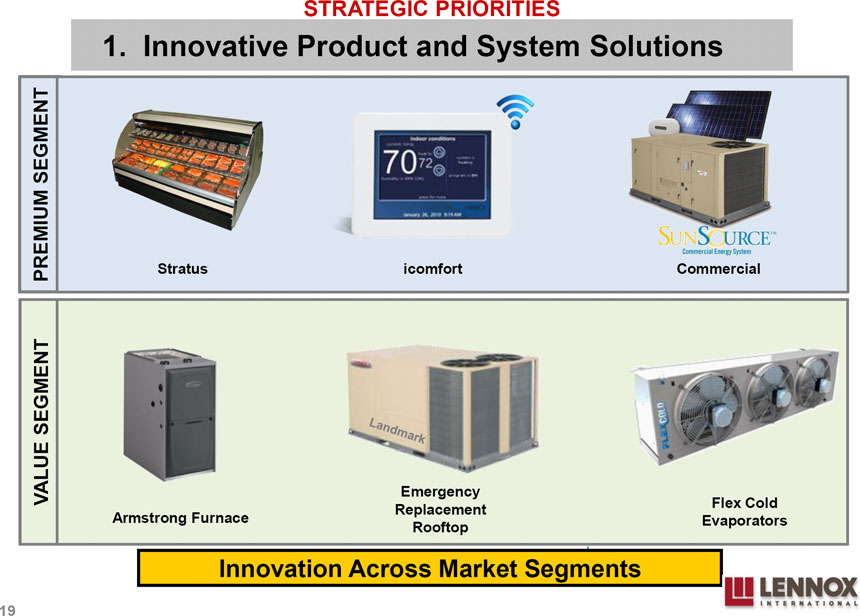 |
STRATEGIC PRIORITIES
1. Innovative Product and System Solutions
PREMIUM SEGMENT Stratus icomfort Commercial
VALUE SEGMENT Emergency
Flex Cold Replacement Armstrong Furnace Evaporators Rooftop
Innovation Across Market Segments
19
|
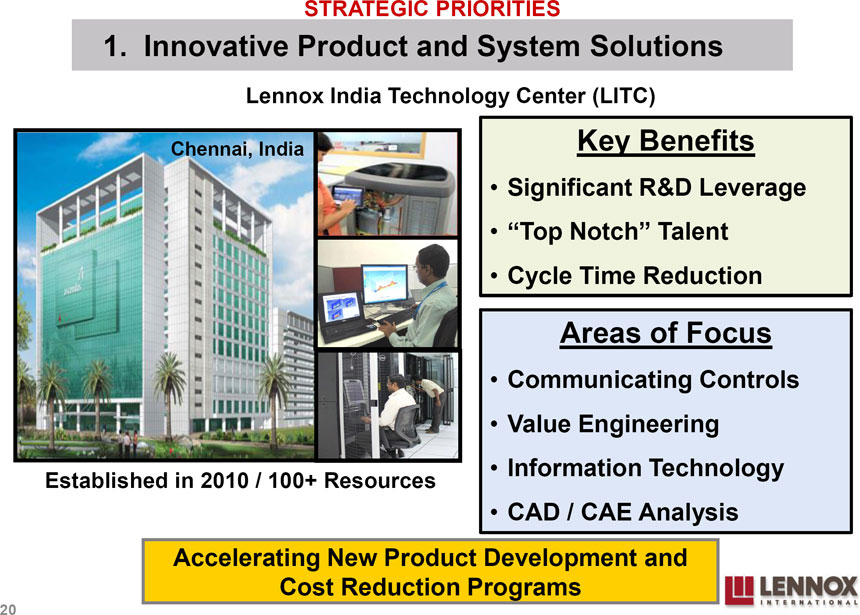 |
STRATEGIC PRIORITIES
1. Innovative Product and System Solutions
Lennox India Technology Center (LITC)
Chennai, India Key Benefits
Significant R&D Leverage
“Top Notch” Talent
Cycle Time Reduction
Areas of Focus
Communicating Controls
Value Engineering
Information Technology
Established in 2010 / 100+ Resources
CAD / CAE Analysis Accelerating New Product Development and Cost Reduction Programs
20
|
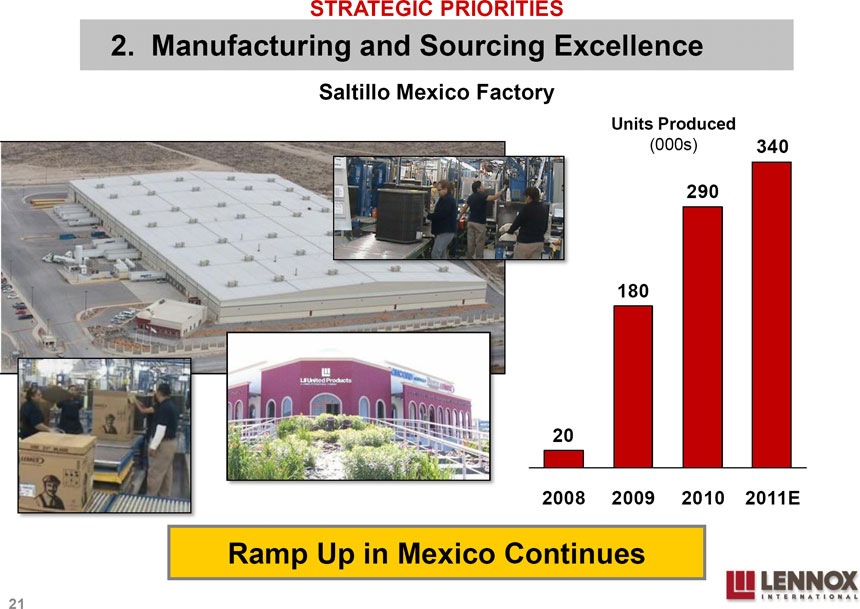 |
STRATEGIC PRIORITIES
2. Manufacturing and Sourcing Excellence
Saltillo Mexico Factory
Units Produced
(000s) 340
290 180 20 2008 2009 2010 2011E
Ramp Up in Mexico Continues
21
|
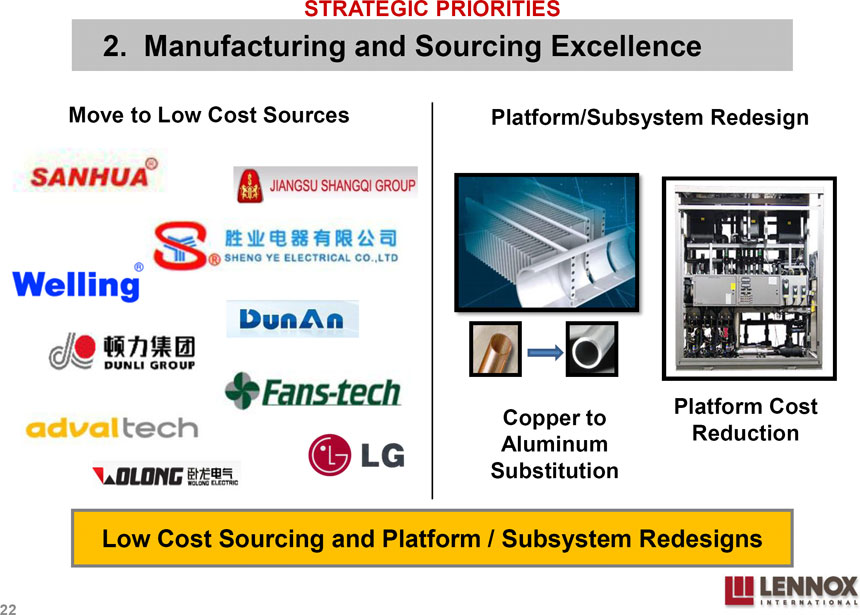 |
STRATEGIC PRIORITIES
2. Manufacturing and Sourcing Excellence
Move to Low Cost Sources Platform/Subsystem Redesign
Platform Cost Copper to Reduction Aluminum Substitution
Low Cost Sourcing and Platform / Subsystem Redesigns
22
|
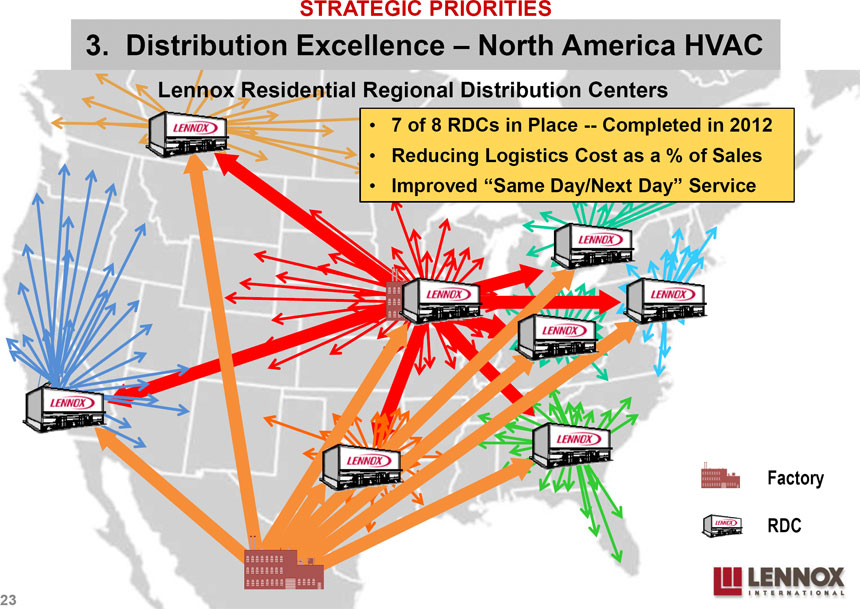 |
STRATEGIC PRIORITIES
3. Distribution Excellence North America HVAC
Lennox Residential Regional Distribution Centers
7 of 8 RDCs in Place -- Completed in 2012
Reducing Logistics Cost as a % of Sales
Improved “Same Day/Next Day” Service
Factory RDC 23
|
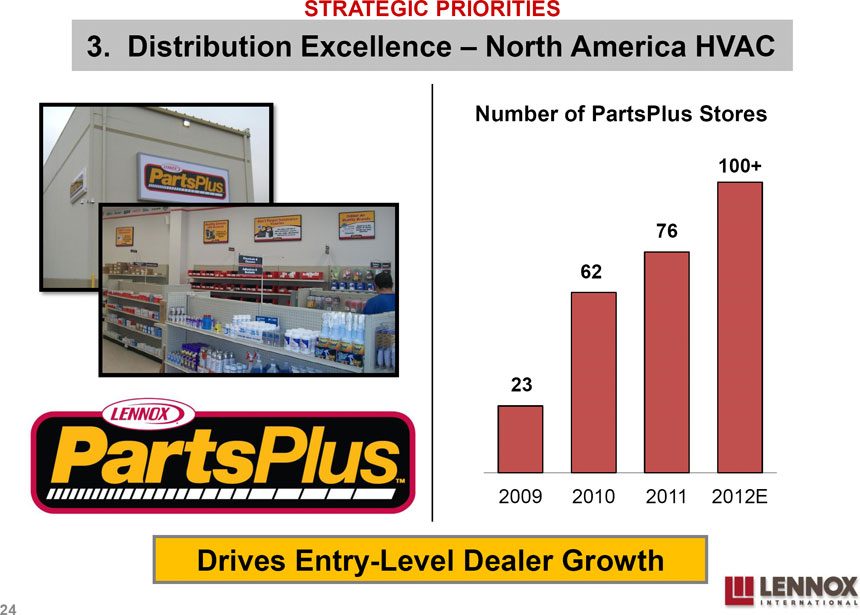 |
STRATEGIC PRIORITIES
3. Distribution Excellence North America HVAC
Number of PartsPlus Stores
100+ 76 62 23
2009 2010 2011 2012E Drives Entry-Level Dealer Growth
24
|
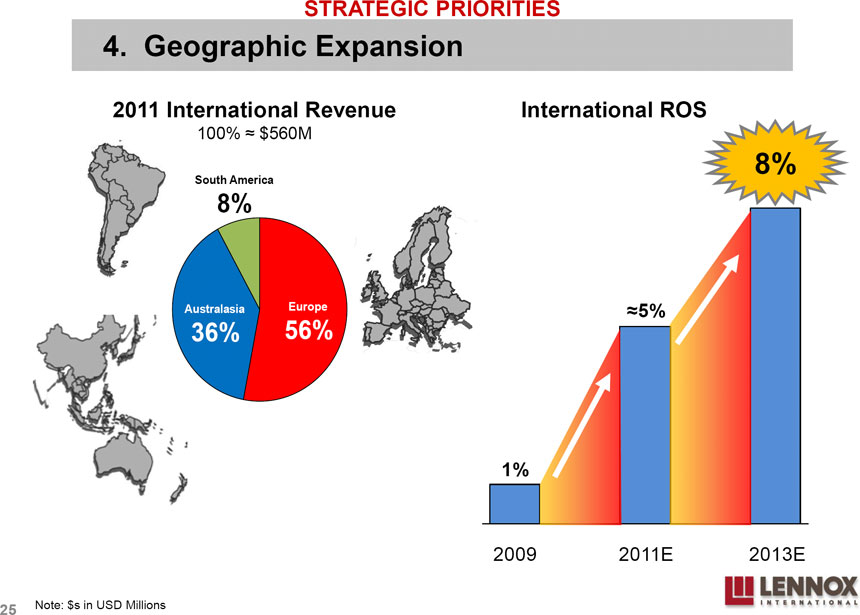 |
STRATEGIC PRIORITIES
4. Geographic Expansion
2011 International Revenue International ROS
100% $560M
8%
South America
8% Australasia Europe 5%
36% 56% 1%
2009 2011E 2013E
25 Note: $s in USD Millions
|
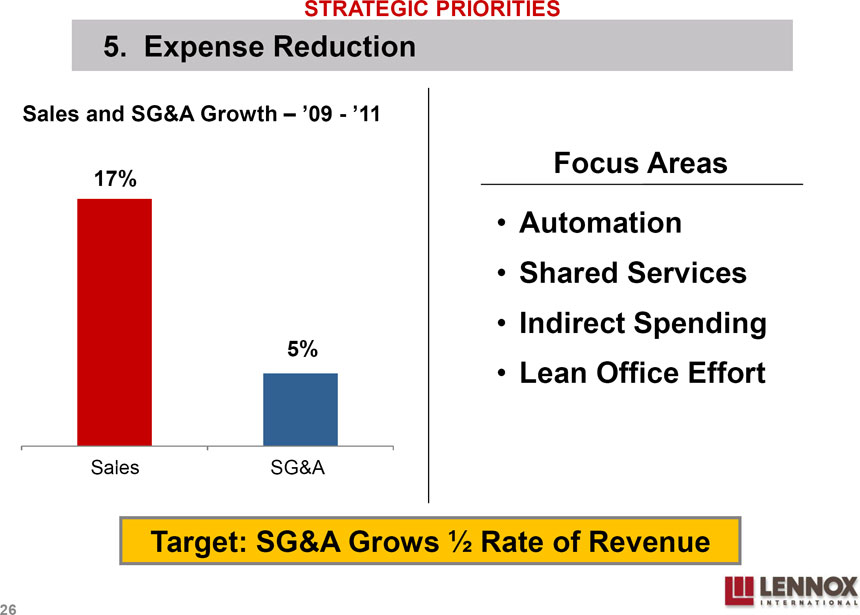 |
STRATEGIC PRIORITIES
5. Expense Reduction
Sales and SG&A Growth ’09 - ’11
Focus Areas
17% Automation
Shared Services
Indirect Spending
5%
Lean Office Effort
Sales1 SG&A 2
Target: SG&A Grows ½ Rate of Revenue
26
|
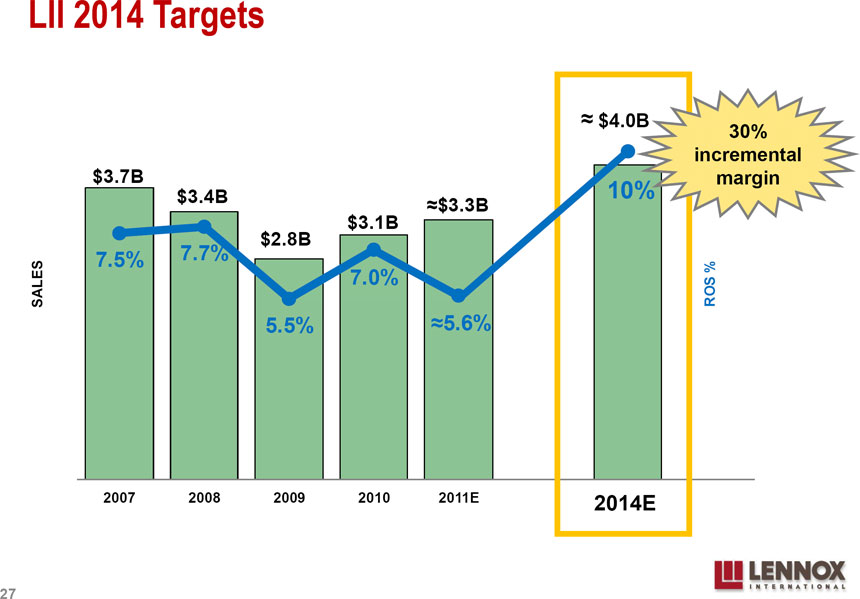 |
LII 2014 Targets
$5 12% $4.0B
30% incremental10%
$4 $3.7B margin $3.4B
$3.3B 10% $3.1B 8% $3 $2.8B
7.5% 7.7%
SALES 7.0% ROS % 6% $2 5.5% 5.6% 4% $1 2%
$0 0% 2007 2008 2009 2010 2011E 2014E
27
|
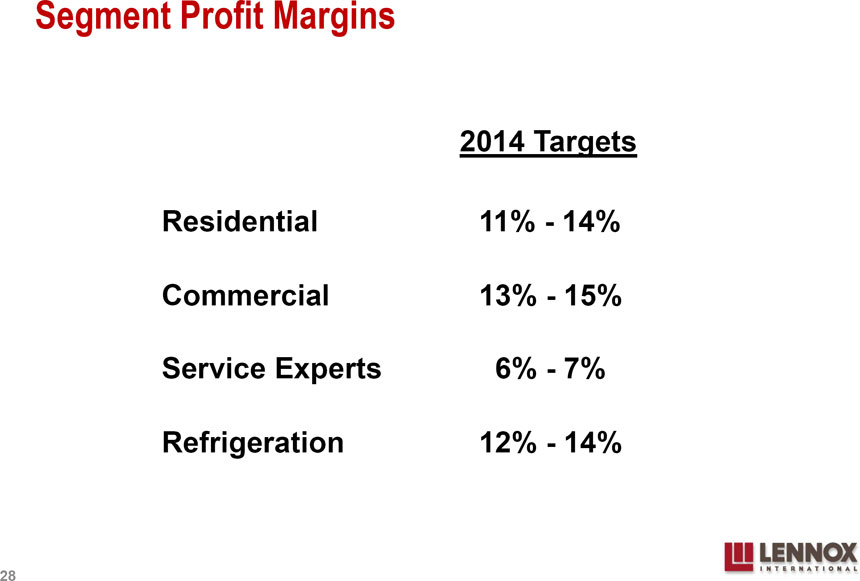 |
Segment Profit Margins
2014 Targets
Residential 11% - 14% Commercial 13% - 15% Service Experts 6% - 7% Refrigeration 12% - 14%
28
|
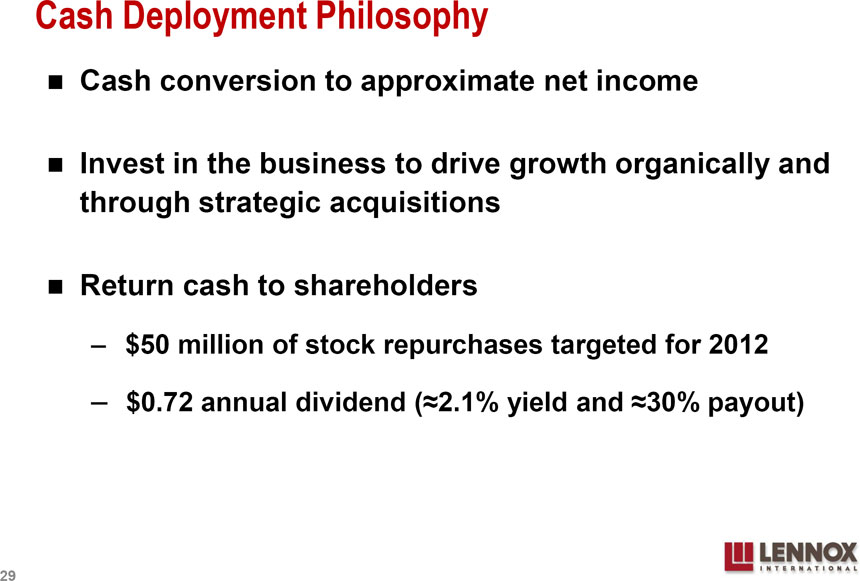 |
Cash Deployment Philosophy Cash conversion to approximate net income
Invest in the business to drive growth organically and through strategic acquisitions
Return cash to shareholders $50 million of stock repurchases targeted for 2012
$0.72 annual dividend ( 2.1% yield and 30% payout)
29
|
 |
Who We Are
Update on Strategic Priorities 2011 Review & 2012 Guidance Questions & Answers
30
|
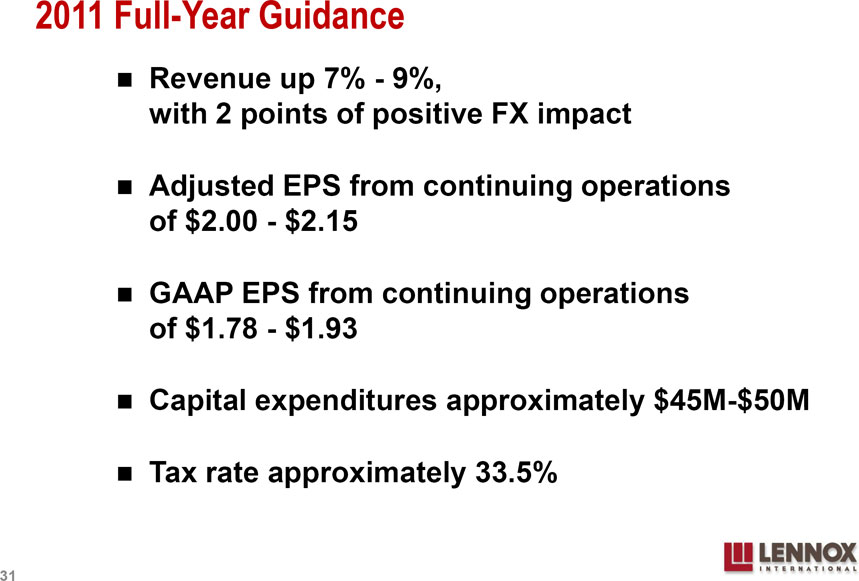 |
2011 Full-Year Guidance
Revenue up 7% - 9%, with 2 points of positive FX impact
Adjusted EPS from continuing operations of $2.00 - $2.15
GAAP EPS from continuing operations of $1.78 - $1.93
Capital expenditures approximately $45M-$50M
Tax rate approximately 33.5%
31
|
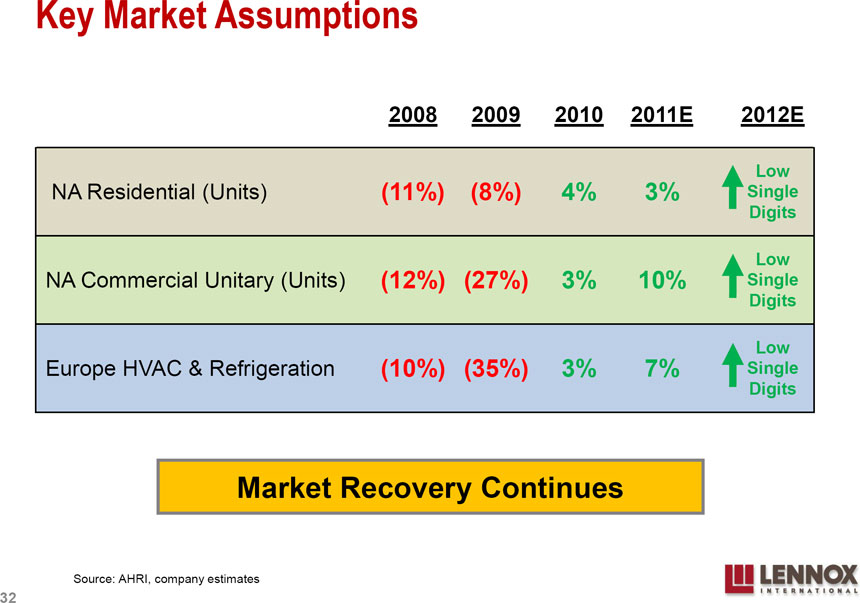 |
Key Market Assumptions
2008 2009 2010 2011E 2012E
Low
NA Residential (Units) (11%) (8%) 4% 3% Single
Digits Low
NA Commercial Unitary (Units) (12%) (27%) 3% 10% Single
Digits Low
Europe HVAC & Refrigeration (10%) (35%) 3% 7% Single
Digits
Market Recovery Continues
Source: AHRI, company estimates
32
|
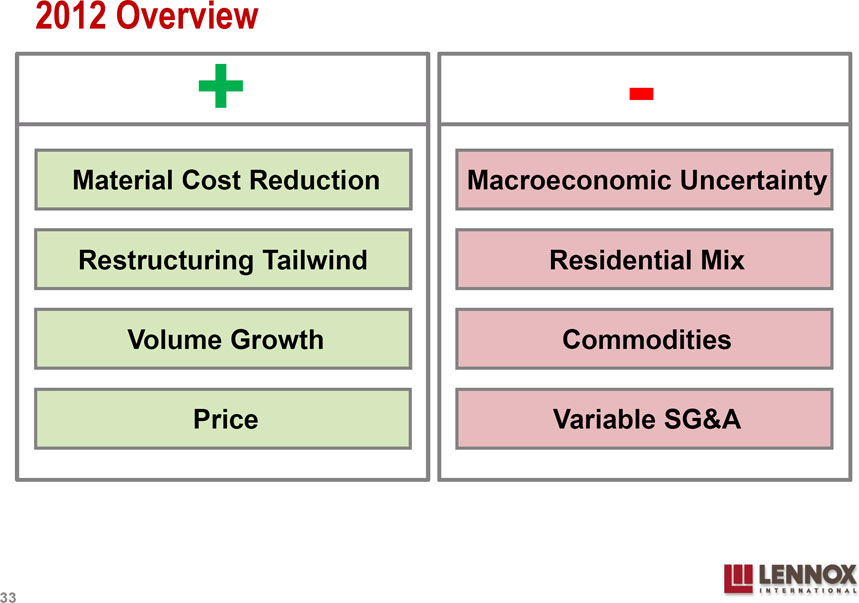 |
2012 Overview
+ -
Material Cost Reduction Macroeconomic Uncertainty Restructuring Tailwind Residential Mix Volume Growth Commodities Price Variable SG&A
33
|
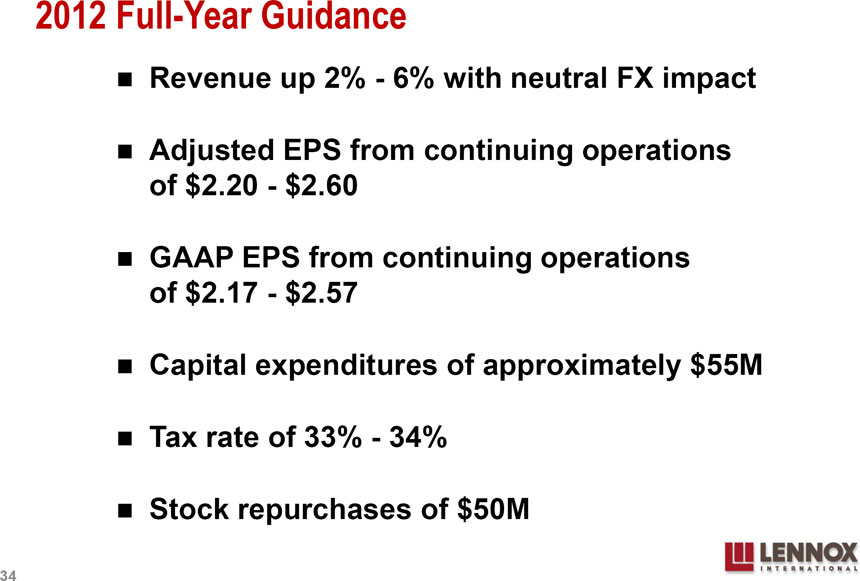 |
2012 Full-Year Guidance
Revenue up 2% - 6% with neutral FX impact
Adjusted EPS from continuing operations of $2.20 - $2.60
GAAP EPS from continuing operations of $2.17 - $2.57
Capital expenditures of approximately $55M Tax rate of 33% - 34% Stock repurchases of $50M
34
|
 |
Lennox International
… is continuing to aggressively reduce its cost structure
… is continuing to make transformational investments in the business
… is participating in growth markets with significant pent-up demand
… is driving shareholder value with a disciplined use of free cash flow
35
|
 |
36 |
 |
GAAP / Non-GAAP Reconciliations
37
|
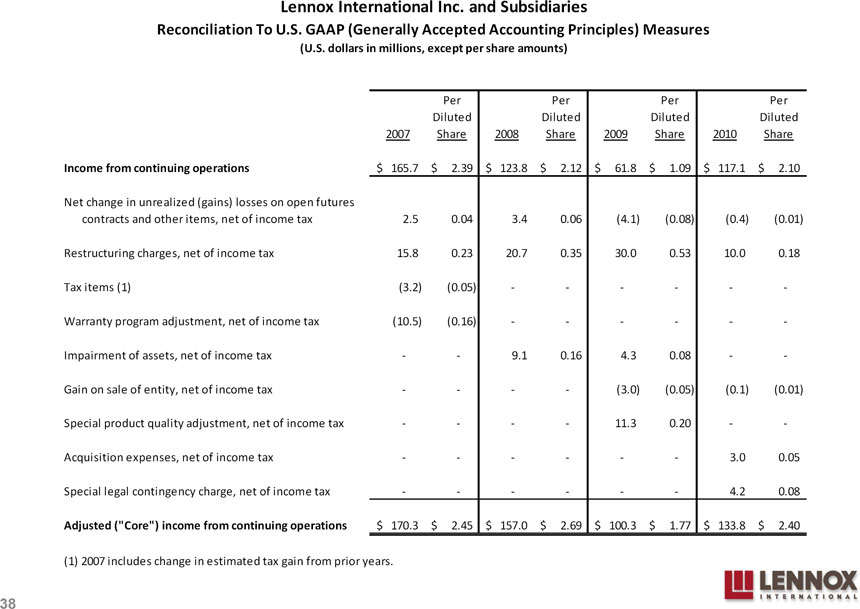 |
Lennox International Inc. and Subsidiaries
Reconciliation To U.S. GAAP (Generally Accepted Accounting Principles) Measures
(U.S. dollars in millions, except per share amounts)
Per Per Per Per Diluted Diluted Diluted Diluted 2007 Share 2008 Share 2009 Share 2010 Share
Income from continuing operations $ 165.7 $ 2.39 $ 123.8 $ 2.12 $ 61.8 $ 1.09 $ 117.1 $ 2.10
Net change in unrealized (gains) losses on open futures contracts and other items, net of income tax 2.5 0.04 3.4 0.06 (4.1) (0.08) (0.4) (0.01)
Restructuring charges, net of income tax 15.8 0.23 20.7 0.35 30.0 0.53 10.0 0.18 Tax items (1) (3.2) (0.05) - - - - - -Warranty program adjustment, net of income tax (10.5) (0.16) - - - - - -Impairment of assets, net of income tax - - 9.1 0.16 4.3 0.08 - -Gain on sale of entity, net of income tax - - - - (3.0) (0.05) (0.1) (0.01) Special product quality adjustment, net of income tax - - - - 11.3 0.20 - -Acquisition expenses, net of income tax - - - - - - 3.0 0.05 Special legal contingency charge, net of income tax - - - - - - 4.2 0.08 Adjusted (“Core”) income from continuing operations $ 170.3 $ 2.45 $ 157.0 $ 2.69 $ 100.3 $ 1.77 $ 133.8 $ 2.40 (1) 2007 includes change in estimated tax gain from prior years.
38
|
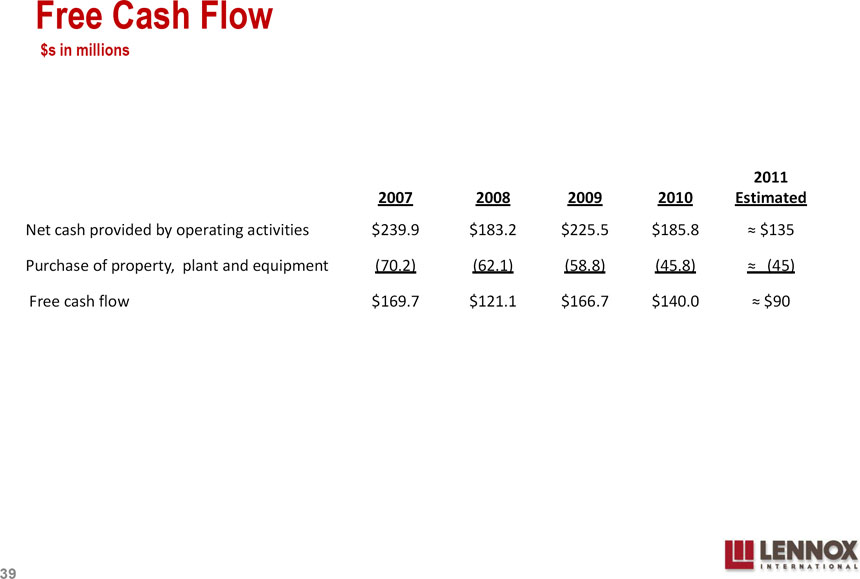 |
Free Cash Flow
$s in millions
2011 2007 2008 2009 2010 Estimated
Net cash provided by operating activities $239.9 $183.2 $225.5 $185.8 $135 Purchase of property, plant and equipment (70.2) (62.1) (58.8) (45.8) (45) Free cash flow $169.7 $121.1 $166.7 $140.0 $90
39
|
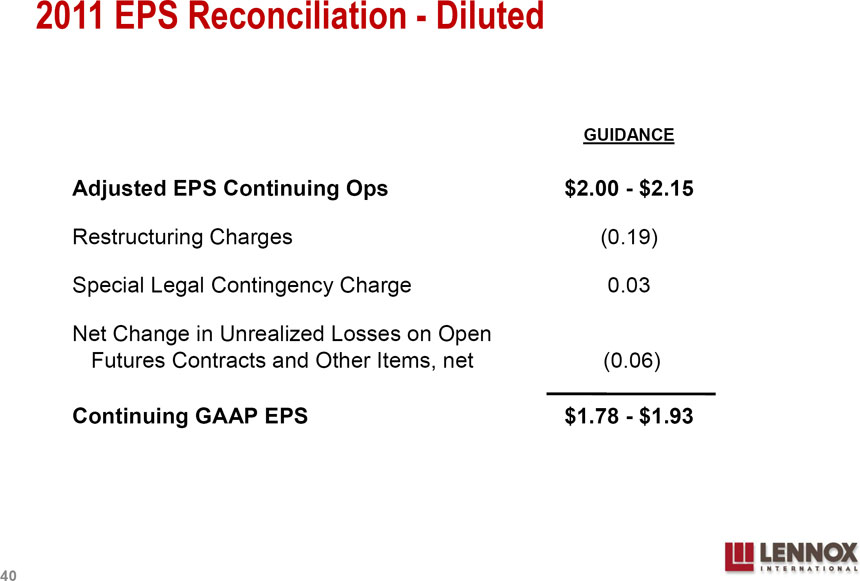 |
2011 EPS Reconciliation - Diluted
GUIDANCE
Adjusted EPS Continuing Ops $2.00 - $2.15
Restructuring Charges (0.19)
Special Legal Contingency Charge 0.03
Net Change in Unrealized Losses on Open Futures Contracts and Other Items, net (0.06)
Continuing GAAP EPS $1.78 - $1.93
40
|
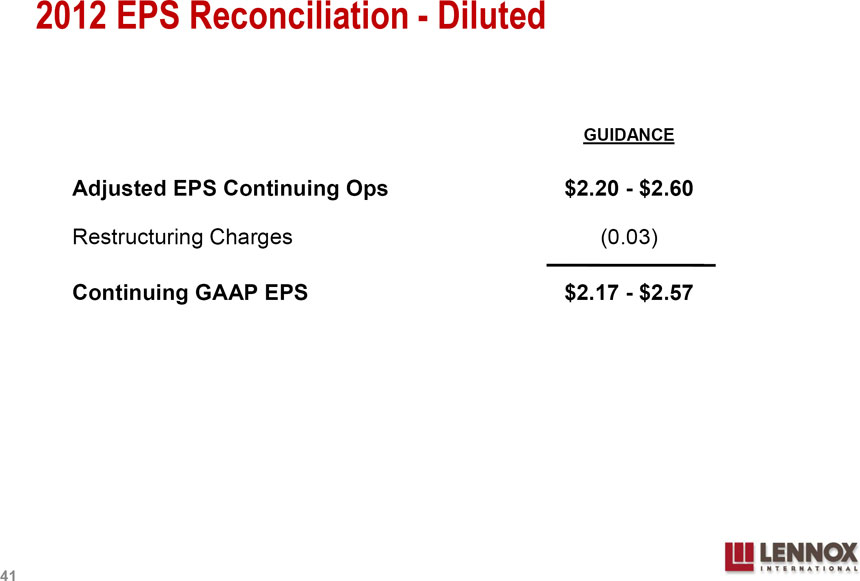 |
2012 EPS Reconciliation - Diluted
GUIDANCE
Adjusted EPS Continuing Ops $2.20 - $2.60
Restructuring Charges (0.03)
Continuing GAAP EPS $2.17 - $2.57
41
|