Attached files
| file | filename |
|---|---|
| 8-K - CURRENT REPORT ON FORM 8-K - DELTA AIR LINES, INC. | delta_8k-12141.htm |
Exhibit 99.1


2
This presentation contains various projections and other forward-looking statements which
represent Delta’s estimates or expectations regarding future events. All forward-looking
statements involve a number of assumptions, risks and uncertainties, many of which are
beyond Delta’s control, that could cause the actual results to differ materially from the
projected results. Factors which could cause such differences include, without limitation,
business, economic, competitive, industry, regulatory, market and financial uncertainties
and contingencies, as well as the “Risk Factors” discussed in Delta’s Form 10-K for the year
ended December 31, 2010. Caution should be taken not to place undue reliance on Delta’s
forward-looking statements, which represent Delta’s views only as of the date of this
presentation, and which Delta has no current intention to update.
In this presentation, we will discuss certain non-GAAP financial measures. You can find the
reconciliations of those measures to comparable GAAP measures on our website at
delta.com.
reconciliations of those measures to comparable GAAP measures on our website at
delta.com.
Safe Harbor

State of the Airline
Richard Anderson
Chief Executive Officer

Looking Ahead
Ed Bastian
President

2011: Solid Results In Challenging Times
Challenging Times
Solid Results
• 30% increase in fuel prices, resulting
in $3 billion higher fuel expense
in $3 billion higher fuel expense
• Economic weakness in the world’s
two largest economies
two largest economies
• On-going impact of the earthquake
and tsunami in Japan
and tsunami in Japan
• War and unrest in the Middle East
• $1.1 billion net profit
• Fully recovered fuel price run-
up
up
• $1.5 billion of free cash flow
• Adjusted net debt of $12.9
billion, a $4.1 billion reduction in
two years
billion, a $4.1 billion reduction in
two years
• 8.8% return on invested capital
5
Note: All results are estimates and exclude special items.
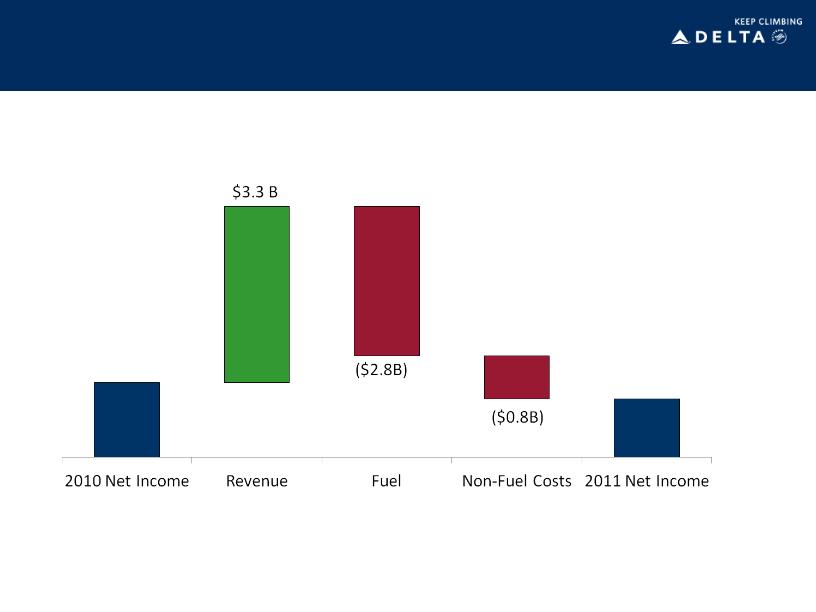
Delta Has Built A Resilient Business Model
$1.4 B
$1.1B
Capacity discipline, strength in corporate revenues and hedging strategy have
mitigated high fuel costs
mitigated high fuel costs
6
Note: All results exclude special items . Including special items, Delta’s net income was $0.6 billion in 2010 and is estimated to be $0.8 billion for 2011.

Strong End To The Year
December quarter 2011
Operating margin
6 - 8%
Fuel price
$2.96
Profit sharing expense
$75 million
Non-operating expense
$275 - $300 million
Capital expenditures
$375 million
Total unrestricted liquidity
$5.3 billion
December quarter 2011 vs.
December quarter 2010
December quarter 2010
Passenger unit revenue
Up 11 - 12%
Consolidated unit cost
Up 8%
Consolidated ex-fuel unit cost
Up 2%
System capacity
Down 4-5%
Domestic
Down 3-4%
International
Down 4-5%
7
Margins will expand despite $600 million higher fuel expense
The Landscape Ahead For 2012
The 2012 Landscape
• Slow, but positive, global GDP growth
• Anticipate recession in Europe
• Fuel prices remain at historically high levels
• Industry restructuring and capacity discipline
allows for recovery of higher fuel costs
allows for recovery of higher fuel costs
Solid earnings growth
and continued free
cash flow generation
and continued free
cash flow generation
8
Industry Factors
Delta Factors
• Sustained caution on capacity, with a system
reduction of 2 - 3%
reduction of 2 - 3%
• Summer to winter variation of 20%
• Revenue momentum from corporate share
gains and new merchandising revenues
gains and new merchandising revenues
• Expect corporate travel up 6 - 8%
• Non-fuel costs remain under pressure
• Cost advantage critical to maintain

Delta’s Path Forward
Grow Unit Revenues
Improve Productivity
Invest in the Business
Delever the Balance
Sheet
Sheet
Grow passenger and ancillary unit revenues through
corporate revenue gains, fuel cost recovery, and
technology-enabled merchandising initiatives
corporate revenue gains, fuel cost recovery, and
technology-enabled merchandising initiatives
Focus on total cost productivity, including fuel, and
implement structural initiatives needed to return non-fuel
unit costs to 2010 levels
implement structural initiatives needed to return non-fuel
unit costs to 2010 levels
Continue investments in the network and toward
consistent, high-quality products and service that earn a
revenue premium
consistent, high-quality products and service that earn a
revenue premium
Maintain capital discipline, manage liquidity and direct
free cash flow toward debt reduction
free cash flow toward debt reduction
9
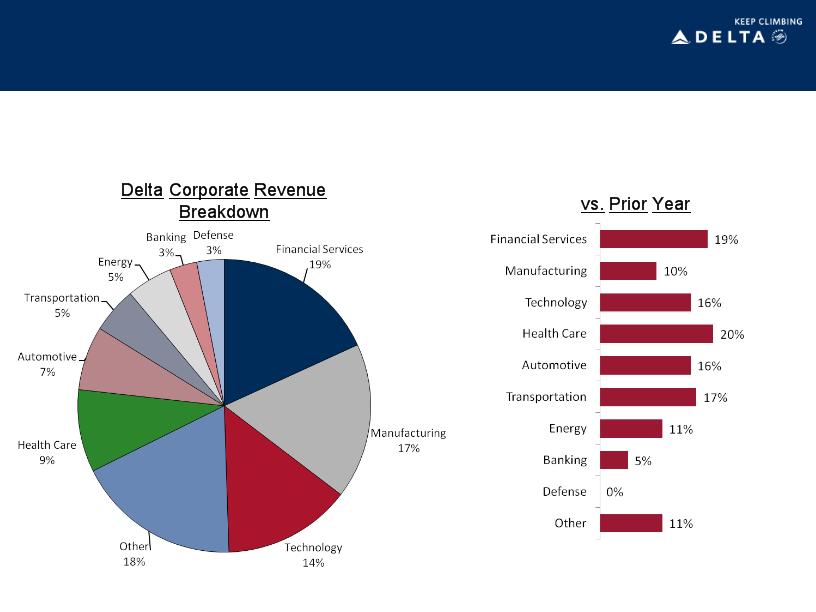
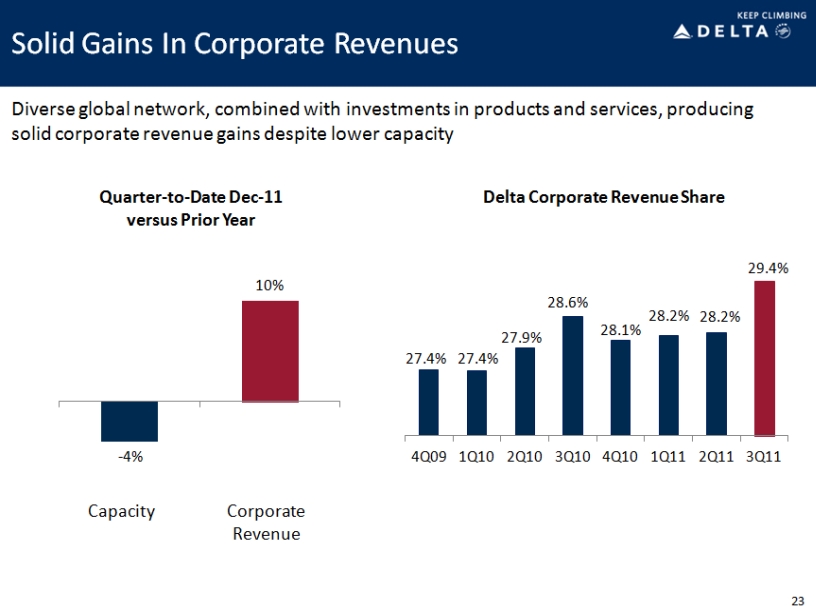
Largest Corporate Sectors Leading Growth
Rates
Rates
Last Four Weeks Booked Revenue
Corporate booked revenues up 14% despite 4-5% reduction in capacity
10
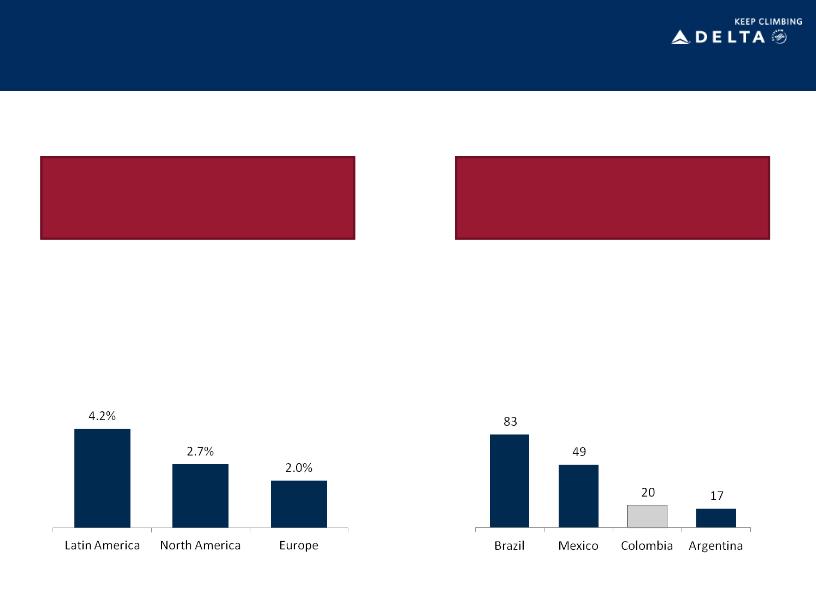
Strengthening Position In Latin America
Focused on building partnerships to leverage high growth potential in this region
11
Latin America Has High
Growth Potential
Growth Potential
Delta’s Expanded Latin
America Presence
America Presence
• Delta now accounts for nearly 20% of
US carriers’ capacity to Latin America
US carriers’ capacity to Latin America
• Partnerships with Aeromexico, GOL and
Aerolineas Argentinas give Delta access
to Latin America’s largest aviation
markets
Aerolineas Argentinas give Delta access
to Latin America’s largest aviation
markets
• Latin America expected to produce GDP
growth rates nearly double those of
Europe and US over next two decades
growth rates nearly double those of
Europe and US over next two decades
• Brazil, Mexico and Argentina are among
Latin America’s top growth areas
Latin America’s top growth areas
Annual GDP Growth (2011- (2030)
Source: Boeing 2011 Global Market Outlook
Aviation Market Size
(millions of passengers per year)
Source: IATA and Infraero
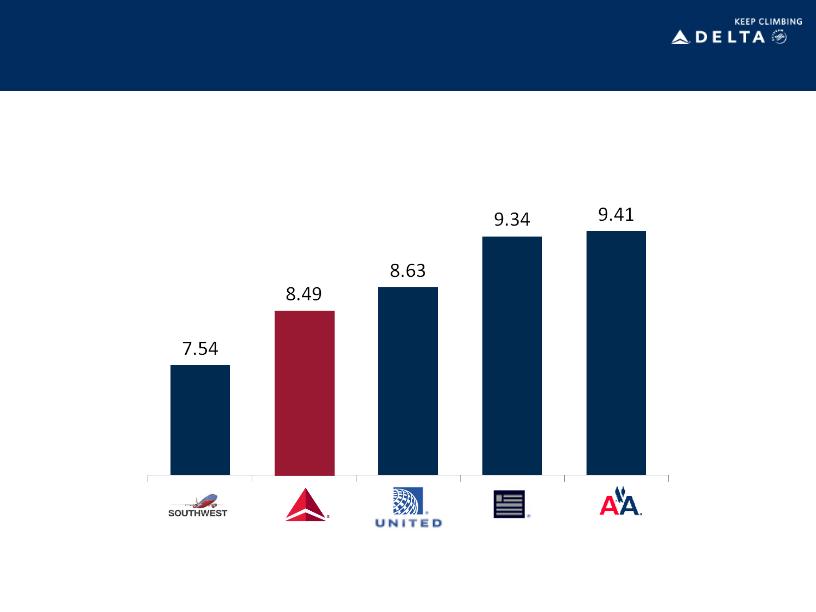
Maintaining A Competitive Cost Structure
12
YTD-September 2011 Non-Fuel Unit Costs (cents)
Note: excludes special items, ancillary businesses, and profit sharing.
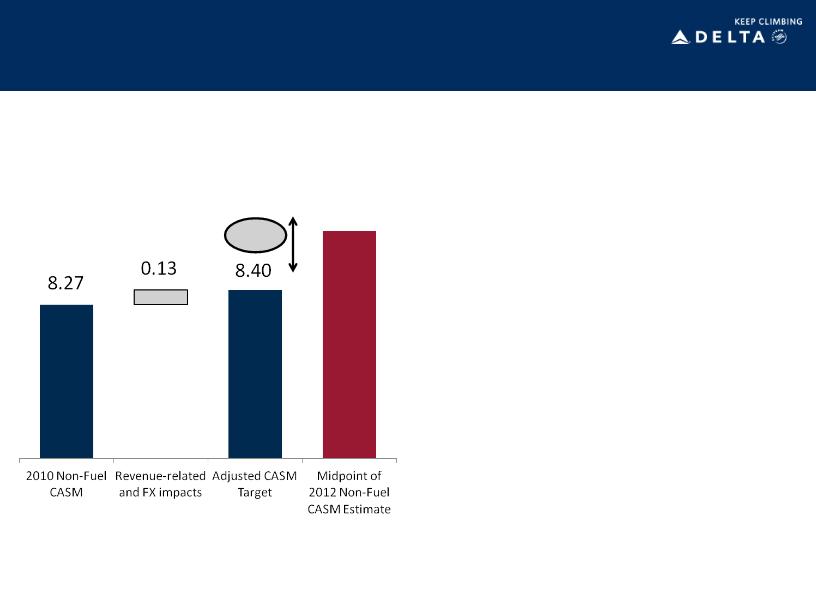
Non-Fuel Costs Present Opportunity
8.80
0.40
• Goal is to return non-fuel unit costs to
adjusted 2010 levels
adjusted 2010 levels
• 2012 revenues expected to be ~15%
higher than 2010
higher than 2010
• 2012 non-fuel unit costs are estimated to be
up 2-4% - ~4% or 0.40 cents higher than
this targeted level
up 2-4% - ~4% or 0.40 cents higher than
this targeted level
• Major drivers of the 0.40 cent differential:
Structural changes needed to bring costs down to targeted levels
13
|
• Wages and benefits -
wage harmonization, industry standard rates, and pension |
0.23 cents
|
|
• LaGuardia/ATL concourse F
|
0.05 cents
|
|
• Capacity reduction - fixed
cost impact |
0.15 cents
|
Note: excludes special items, ancillary businesses, and profit sharing.
Structural Changes Necessary To Lower Costs
• 737-900ER deliveries will
reduce overall fleet
maintenance costs;
maintenance reductions in
advance of those deliveries
to begin in late 2012
reduce overall fleet
maintenance costs;
maintenance reductions in
advance of those deliveries
to begin in late 2012
• Simplification of fleet post-
integration
integration
• Leverage AeroMexico joint
venture to optimize
maintenance opportunities
venture to optimize
maintenance opportunities
• With labor representation
resolved, workrules can be
harmonized and improve
productivity levels for
frontline employees
resolved, workrules can be
harmonized and improve
productivity levels for
frontline employees
• Continued improvements to
merit staff productivity
merit staff productivity
• Technology investments to
enhance efficiencies in crew
systems
enhance efficiencies in crew
systems
• Changing composition of
Delta’s fleet by eliminating
more smaller-gauge
aircraft, especially 50-seat
regional jets
Delta’s fleet by eliminating
more smaller-gauge
aircraft, especially 50-seat
regional jets
• Upgauging allows for
more efficient capacity
generation on smaller fleet
count
more efficient capacity
generation on smaller fleet
count
14
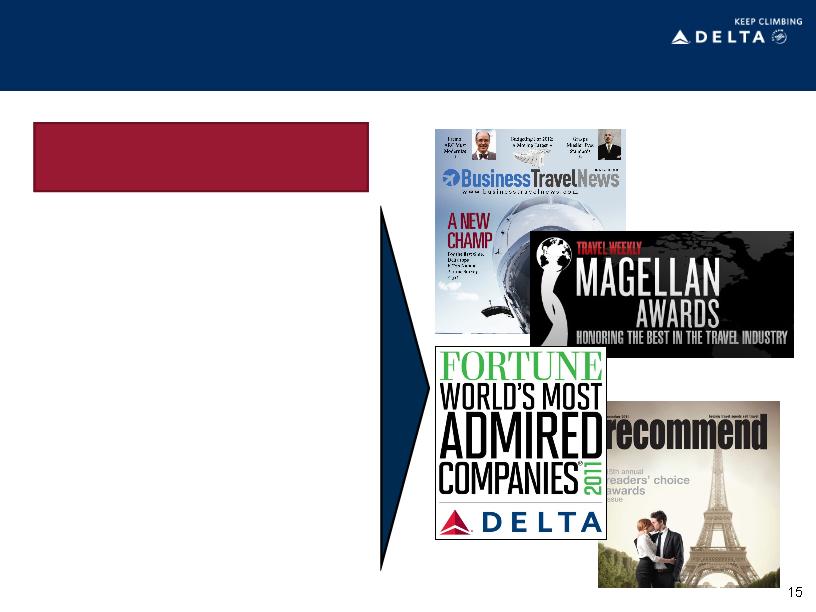
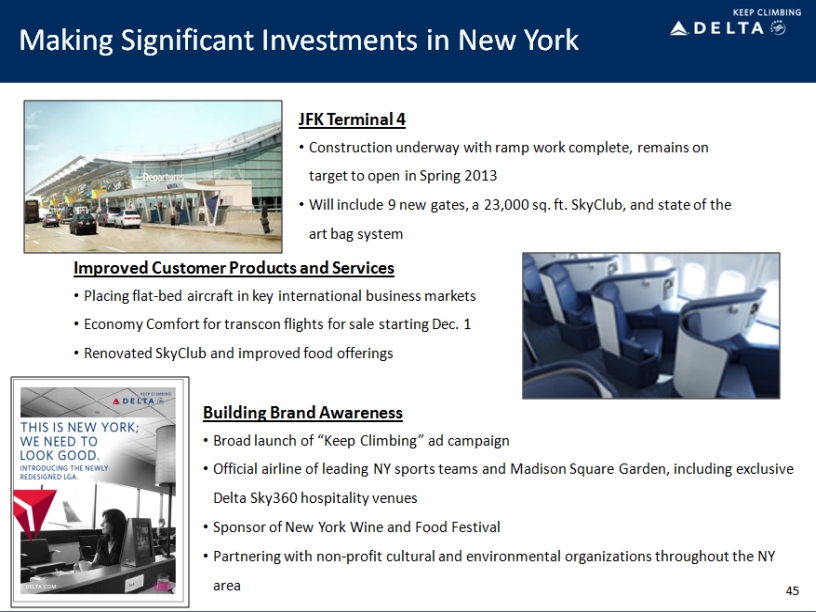
Investments In The Business Are Paying Off
Multi-Year Investments in
Products, Services and Facilities
Products, Services and Facilities
• Flat bed seats - more than 50% of
widebody international seats complete by
end of 2012
widebody international seats complete by
end of 2012
• Facilities - state of the art international
terminals slated for Atlanta (2012) and
JFK (2013)
terminals slated for Atlanta (2012) and
JFK (2013)
• Wi-Fi - entire mainline fleet complete,
installation on 2-class complete by early
2012
installation on 2-class complete by early
2012
• Economy Comfort - international fleet
complete, domestic fleet (incl. 2-class
RJs) for summer 2012
complete, domestic fleet (incl. 2-class
RJs) for summer 2012
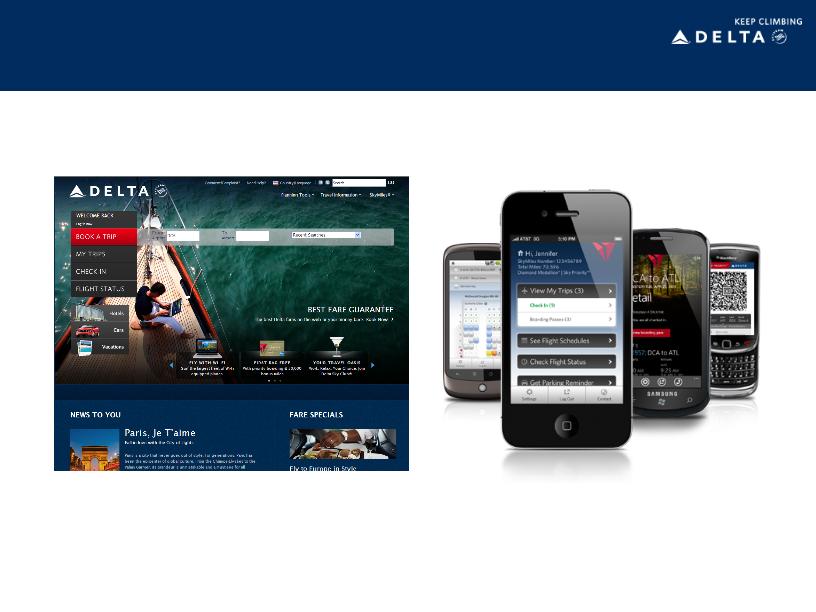
• Technology - enhancements to delta.com
and mobile applications
and mobile applications
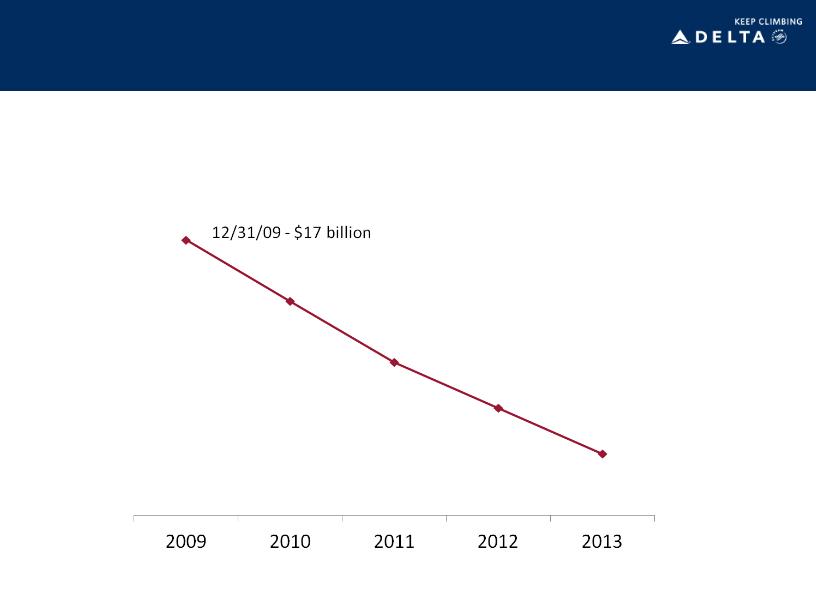
Solid Progress On Debt Reduction
12/31/11 - $12.9 billion
2013 - $10 billion
Adjusted Net Debt
Strong free cash flow generation has produced $4.1 billion net debt reduction in two
years
years
16
Continued Strong Relationship with American
Express
Express
• New four-year agreement with American
Express for annual SkyMiles pre-purchases of
$675 million
Express for annual SkyMiles pre-purchases of
$675 million
• Reduces seasonal volatility of cash flows
• From cash perspective, net effect is to
push out amortization of existing $1
billion agreement by two years
push out amortization of existing $1
billion agreement by two years
• SkyMiles American Express partnership is a
win-win for both companies
win-win for both companies
• Premium services for cardholders -
including priority boarding, free bags and
SkyClub access
including priority boarding, free bags and
SkyClub access
17
New agreement improves cash flows, extends benefits for cardholders

Delta: Keep Climbing
18
Focus on top-line
growth
growth
Taking a disciplined
approach
approach
Reducing risk
across the business
across the business
Growing and diversifying revenues through a broad
global network, corporate revenue gains, fuel cost
recovery and improved products and services
global network, corporate revenue gains, fuel cost
recovery and improved products and services
Disciplined management of capacity, costs and
capital to improve profitability, generate free
cash flow and invest in the business
capital to improve profitability, generate free
cash flow and invest in the business
Creating a solid franchise that generates strong margins and cash flow, provides for
net debt reduction and investment for the future
net debt reduction and investment for the future
Reducing labor, financial and operational risk
key to creating a stable business model in a
volatile industry
key to creating a stable business model in a
volatile industry

A Premium Revenue Carrier
Glen Hauenstein
EVP Network Planning and Revenue Management

A Premium Revenue Carrier
Product and facility enhancements targeted to
making Delta the airline of choice to, from and
through the U.S.
making Delta the airline of choice to, from and
through the U.S.
Elevate Delta’s Brand in the
Eyes of Our Customers
Eyes of Our Customers
Concentrate Capacity in
High Potential Markets
High Potential Markets
Expand Product Offerings
Leverage Alliances
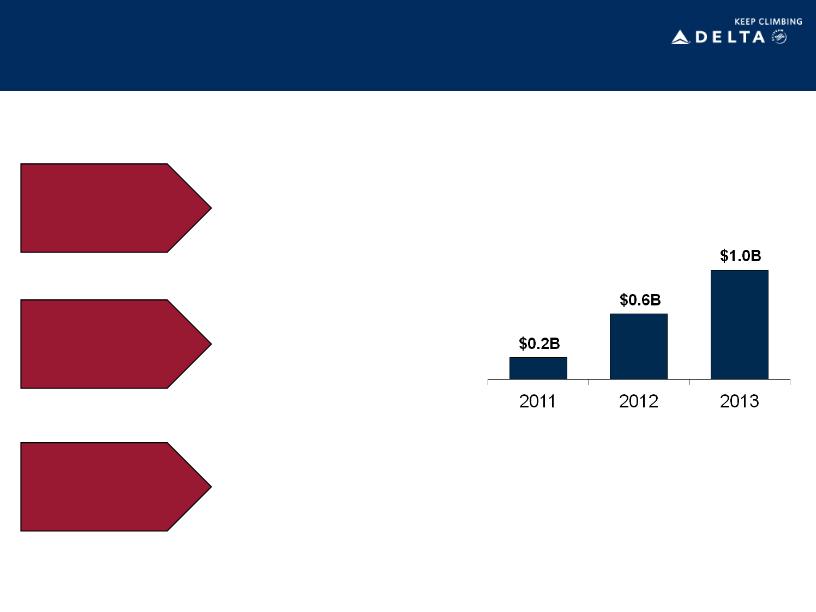
Grow annual merchandising revenues to $1 billion by
2013 through new products and enhanced eCommerce
2013 through new products and enhanced eCommerce
platforms
Schedule flexibility allows Delta to shift capacity to
high potential markets and adjust quickly to changing
demand dynamics
high potential markets and adjust quickly to changing
demand dynamics
Utilize global partnerships to expand network
breadth, leverage foreign point of sale, and improve
network value to the customer
breadth, leverage foreign point of sale, and improve
network value to the customer
20
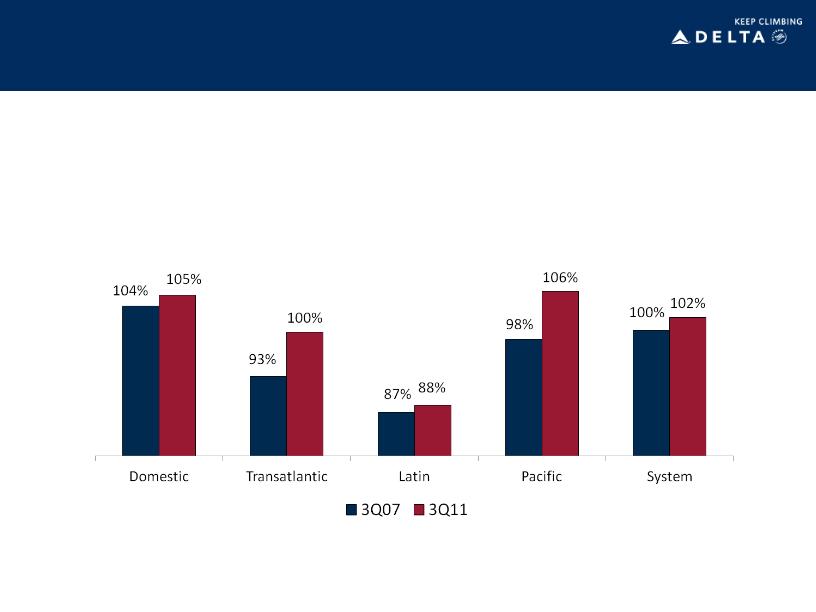
Delta Achieving Revenue Premium to the
Industry
Industry
Delta System Unit Revenue as
Percentage of ATA Average
Percentage of ATA Average
Merger synergies, capacity discipline, focus on higher value customer and
enhanced revenue management platforms allowing Delta to improve revenue
performance versus its peers in all entities
enhanced revenue management platforms allowing Delta to improve revenue
performance versus its peers in all entities
21
Investments Targeted at Higher Value
Passenger
Passenger
• Enhanced delta.com
platform
platform
• Personalized sales
programs
programs
• First Class Upsell
Delta named Best Overall Airline by Business Travel News
• New Atlanta international
terminal opening in 2012
terminal opening in 2012
• JFK Terminal 4 opening in
2013
2013
• Renewed Sky Clubs
• Ability to seamlessly
rebook a flight, check
itinerary and track baggage
rebook a flight, check
itinerary and track baggage
• Flat-bed seats installed on
entire international fleet by
Summer 2014
entire international fleet by
Summer 2014
• International and Domestic
Economy Comfort
Economy Comfort
• Most first class seats of any
domestic carrier
domestic carrier
• More than 800 Wi-Fi
equipped planes
equipped planes
Continuous effort to make Delta the airline of choice for corporate and business travelers
22
The Global Landscape
North America
Latin America
Europe
Asia
• Slow, but positive, GDP growth
• Continued industry capacity discipline
• Volatility increased as competitors go
through integration and restructuring
through integration and restructuring
• Delta capacity down 1-2%, driven by 60
small-gauge aircraft retirements
small-gauge aircraft retirements
• Anticipate recessionary climate
• Unit revenues pressured from economic
uncertainty combined with unfavorable
industry supply
uncertainty combined with unfavorable
industry supply
• Delta Transatlantic JV capacity down 7-8%
this year
this year
• 4 - 6% GDP growth
• Strongest margins in the system
• Growing Delta’s Latin America presence
through enhanced commercial partnerships
and equity investments
through enhanced commercial partnerships
and equity investments
• Solid GDP growth
• Japan demand returning to pre-event levels
by mid-2012
by mid-2012
• Building alliances with leading Chinese
airlines to capitalize on China growth
airlines to capitalize on China growth
• Annualization of 2011 additions to increase
overflight capacity by 10%
overflight capacity by 10%
24
Capacity Shifting to Higher Potential Markets
Aligning capacity with demand and reallocating assets to strategic core flying
|
Region
|
|
2012 Capacity
Change
|
|
Action Plan
|
|
Domestic
|
|
Down 1 - 2%
|
|
• Focus on right-sizing capacity
• Successfully implement LGA growth to reshape market
and achieve top position in New York • Provide competitive first class, mainline product in core
business and strategic markets |
|
Transatlantic
|
|
Down 7 - 8%
|
|
• Market optimization in coordination with JV partners
• Cancellation of underperforming routes
|
|
Latin
|
|
Flat to up 2%
|
|
• Growth to strong performing Brazil and Central America
• Rationalization of leisure capacity
|
|
Pacific
|
|
Up 1 - 2%
|
|
• Annualization of 2011 route additions
• Return to pre-earthquake Japan capacity
|
|
System
|
|
Down 2 - 3%
|
|
|
25
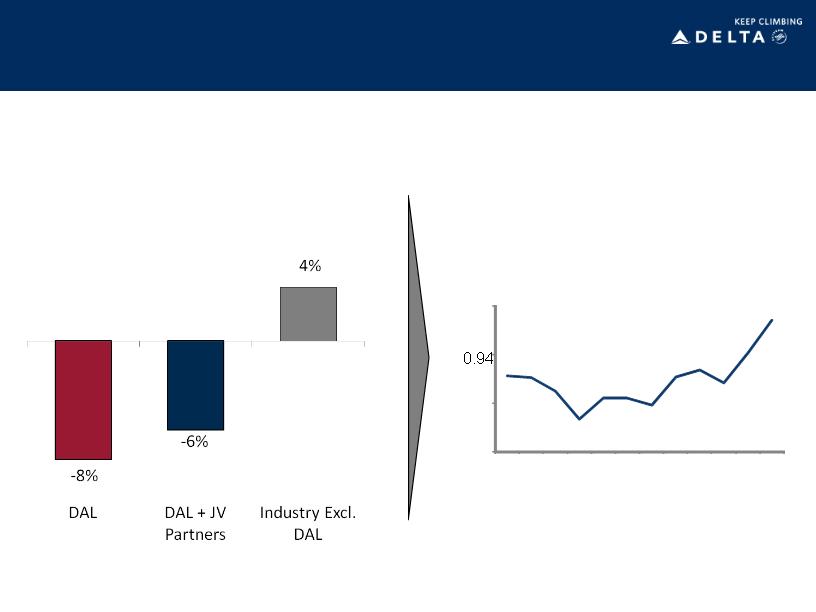
Rationalization of Transatlantic Capacity
Driving Unit Revenue Improvements
Driving Unit Revenue Improvements
U.S.-Europe Capacity Change,
December Quarter 2011 vs Prior Year
0.90
0.92
0.96
Q408
Q409
Q410
Q311
Delta Atlantic RASM Index
Rolling 4 Quarters
Capacity discipline has translated into improved performance versus peers
26
Alliances Expand Profit Potential
|
|
Delta
|
Delta with Partners
|
|
Destinations
|
343
|
1,164
|
|
Countries Served
|
63
|
187
|
|
Daily Flights
|
5,550
|
18,004
|
Ability to expand network breadth without significant fleet investment
Schedule data for March 2012
27
Revenue Growth from Expanded Product
Offerings
Offerings
Target of $1 billion in annual merchandising revenue by 2013
Seat Related
Products
Products
• Economy Comfort
• First Class Upsell
• Sky Priority seating
• Same day Confirmed
Travel Products
and Services
and Services
Technology and
Product
Investments
Product
Investments
• Hotel, car rentals and trip
insurance
insurance
• Wi-Fi
• SkyClub passes
• Optional packages and services
• Other ancillary products
• New delta.com platform in
2012
2012
• Booking class realignment
• Improvements to pricing and
forecasting systems
forecasting systems
Merchandising Revenue
28

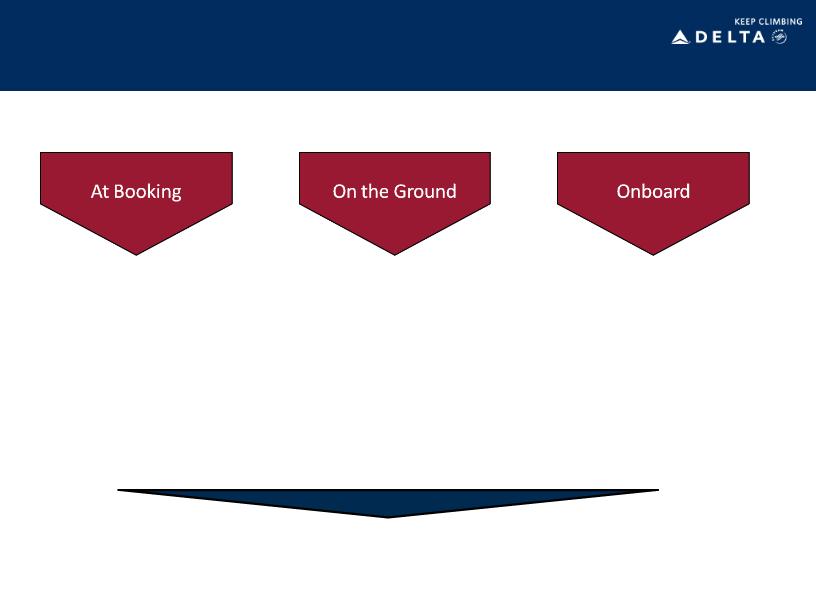
Revenue Innovation Through Technology
Tim Mapes
Senior Vice President - Marketing
A Brief History
31
“Impose”
• Bag Fees
• Meals for Sale
• “Service” Fees
“Involve”
• Amex Co-Brand
Card Acquisition
Card Acquisition
• Coach Up-sell to
First Class
First Class
• Sky Club Day Pass
“Improve”
• Economy
Comfort
Comfort
• Paid Preferred
Seats
Seats
• Segmented
offerings
offerings
PHASE 3
PHASE 4
PHASE 2
PHASE 1
“Inspire”
• Customization
of travel
experience
of travel
experience
• Bundled
offerings
offerings
PUSH
PULL

Strategic Building Blocks
Enterprise-wide clarity on varying levels of customer
value
value
Customer Segmentation
Product Differentiation
Leveraged Technology
Differentiated products, services based on customer
value
value
Simple, intuitive, reliable technology - across
platforms
platforms
Billions of annual customer touch points, impressions
Global Scale
32
Early Success
33
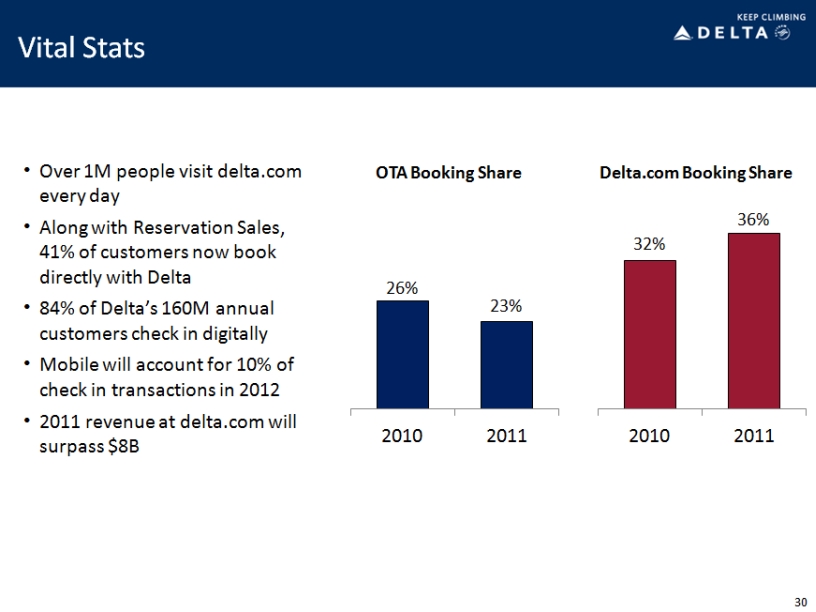
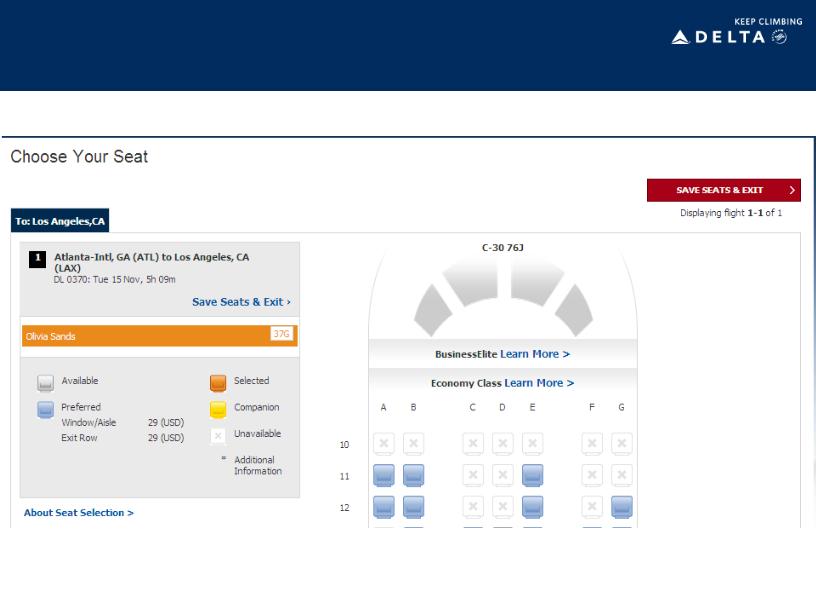
Improving Direct-Booking Revenue
34
Seizing Opportunities for Up-Sell
35
Launching New Products
36
Targeting Distinct Market Segments
37
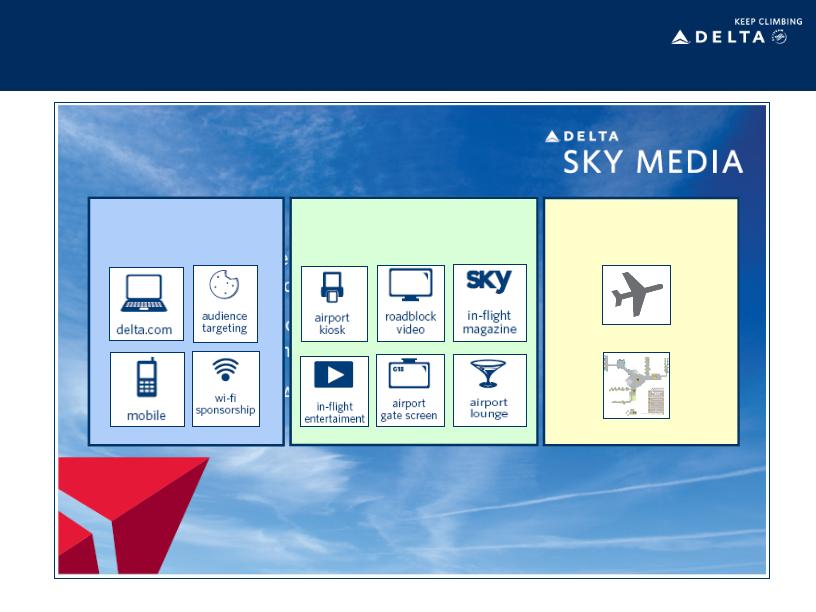
Monetizing Delta’s “Media” Audience
terminals
airplanes
WEB ENABLED ASSETS
TRADITIONAL AIRLINE
OUT OF HOME ASSETS
OUT OF HOME ASSETS
AIRLINE UNIQUE ASSETS
www.delta.com/skymedia
38
Delta.com As Global “Store Front”
39
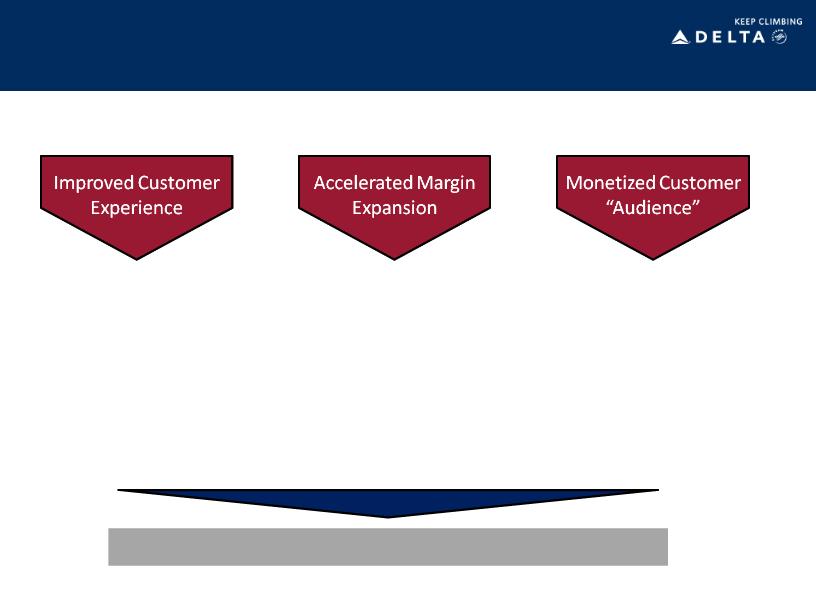
Financial & Customer Benefits
A quality “base” product
with a range of offerings
from which to choose to
enhance your
experience on Delta.
with a range of offerings
from which to choose to
enhance your
experience on Delta.
$1 Billion of incremental revenue by 2013
Differentiated bundles
of new products and
services customers
want - and will pay
for.
of new products and
services customers
want - and will pay
for.
Re-defined use of the
term “network” in an
airline to describe
Delta’s ability to deliver
5 billion customer
impressions/yr.
term “network” in an
airline to describe
Delta’s ability to deliver
5 billion customer
impressions/yr.
40

Winning in New York
Gail Grimmett
Senior Vice President - New York
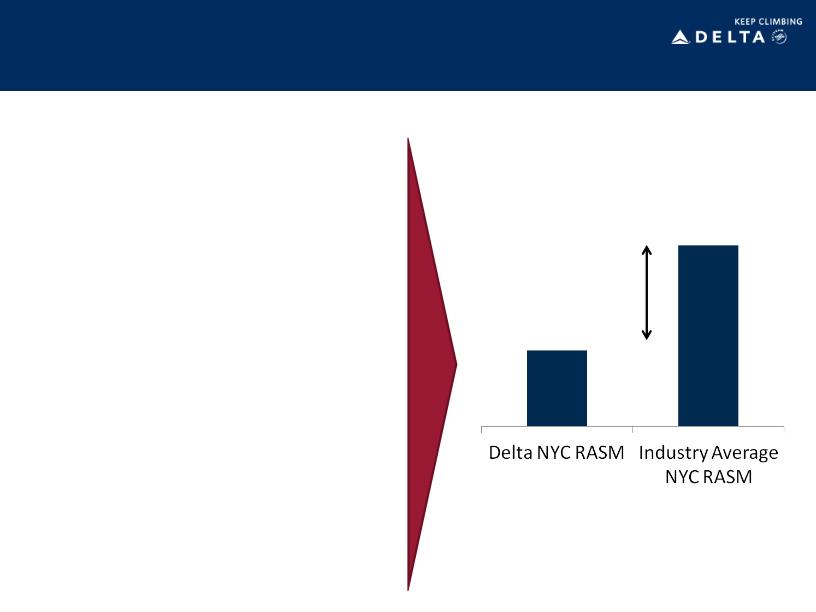
Delta’s Plan To Win In New York
By simply getting a “fair share” of New
York revenue, Delta’s revenue would
increase by more than $200 million.
York revenue, Delta’s revenue would
increase by more than $200 million.
The path to achieving this includes:
• Building a leading network position
by capitalizing on the LGA
expansion and more efficient use of
the JFK hub
by capitalizing on the LGA
expansion and more efficient use of
the JFK hub
• Improving NYC corporate share,
including leveraging breadth of JV
partners
including leveraging breadth of JV
partners
• Delivering a high-quality product
and brand to all customers
and brand to all customers
$200+
million
million
42
Building New York’s Leading Network Position
LGA Slot Position (Summer 2012)
• With over 250 flights per day, Delta will
be the premier carrier from LaGuardia
be the premier carrier from LaGuardia
• Nearly 50% of daily departures from
New York’s preferred business
airport
New York’s preferred business
airport
• Improved schedule
• New slots will allow 100 new flights
and 29 new destinations
and 29 new destinations
• Adding service to key business
destinations
destinations
• Improved facilities and amenities
• Terminals C & D connect to create a
26-gate complex
26-gate complex
• Maintain Marine Air Terminal for
high-value Shuttle customers
high-value Shuttle customers
43
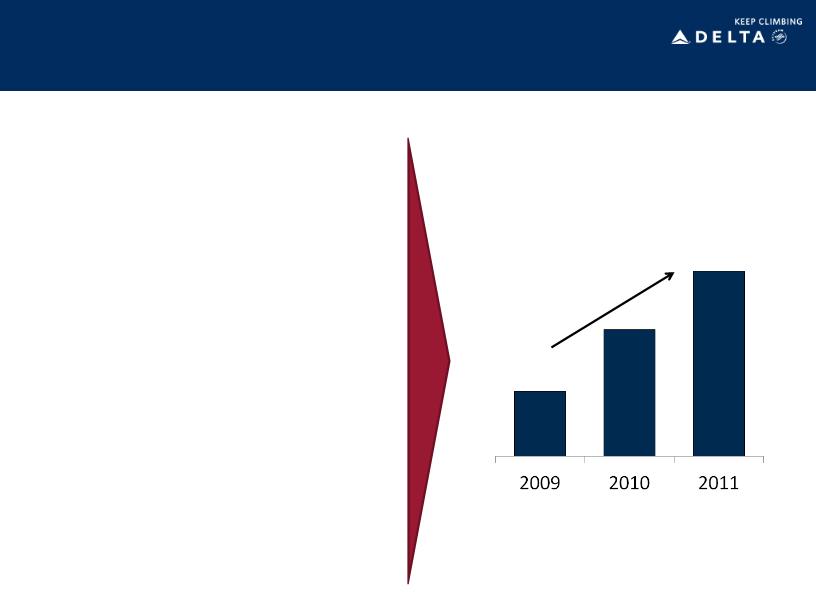
Winning New York Corporate Customers
+3.5 pts
New York Corporate Share
• In just three years, Delta has increased its
corporate share in NY by 3.5 points
corporate share in NY by 3.5 points
• Future growth will be driven by:
• Broader network offering, with more than 500
daily flights from New York to key
destinations
daily flights from New York to key
destinations
• Expanded facilities with enhanced amenities
at LGA and JFK
at LGA and JFK
• Premium products for premium customers
such as VIP Select, SkyPriority and Business
Elite and Economy Comfort for transcon
flights
such as VIP Select, SkyPriority and Business
Elite and Economy Comfort for transcon
flights
• Leveraging the breadth of all joint venture
relationships
relationships
44

Winning In New York
Leading Network Position
Winning Corporate
Customers
Customers
Significant Investments
Underway
Underway
• With the best-positioned slot portfolio and an
international gateway to all regions, Delta has
built an unmatched network position in New
York
international gateway to all regions, Delta has
built an unmatched network position in New
York
• Delta’s improved travel offering - network,
products and alliances - is gaining traction
with New York corporate customers
products and alliances - is gaining traction
with New York corporate customers
• Significant investments are targeted at
producing a consistently high-quality product
and brand
producing a consistently high-quality product
and brand
46

Benefits of Operational Investment
Steve Gorman
Chief Operating Officer
Delta: Performance Continues to Climb
Top tier completion factor,
on-time and baggage
performance
on-time and baggage
performance
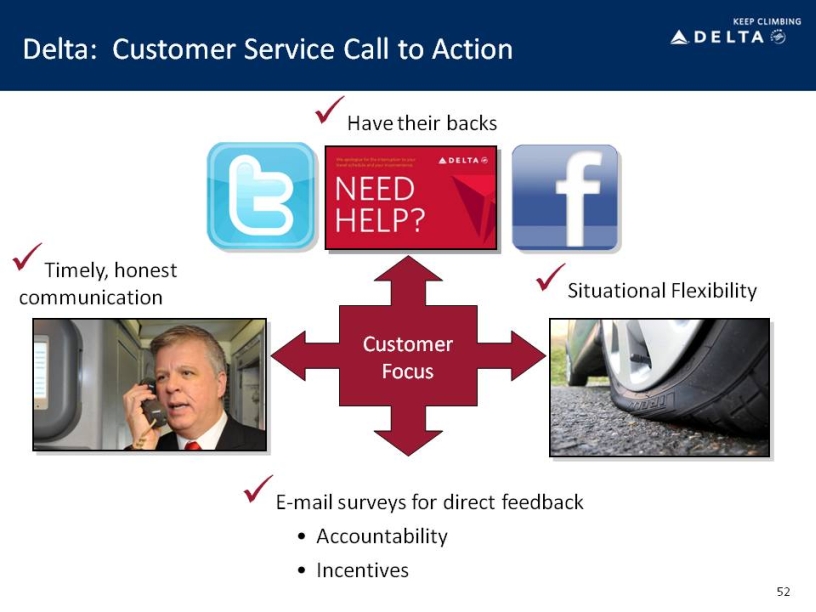
Customer service focus
Positive feedback from
our customers
our customers
Making Delta an airline of preference
ü
ü
ü
48
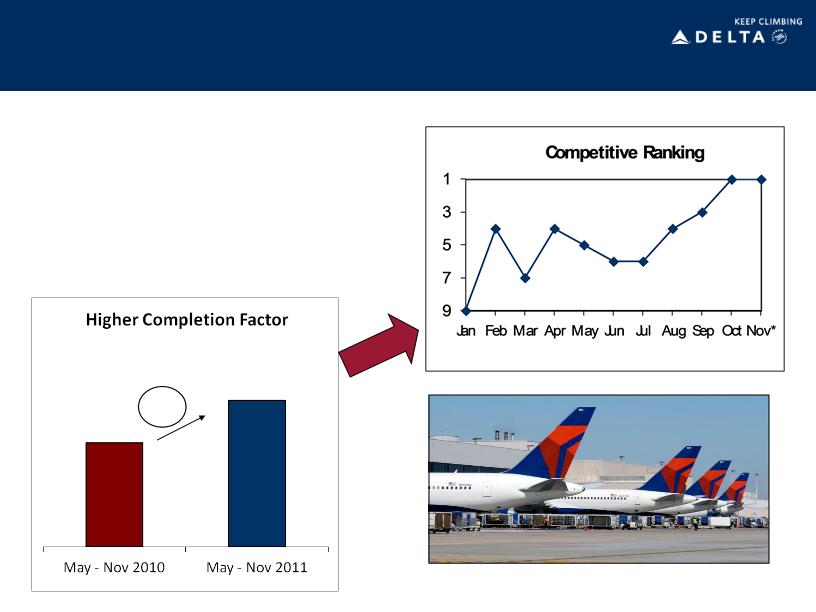
Delta: Completing Our Customers’ Flights
ü
Tech Ops action plans
• Added stations
• Technicians
• Parts
• Planning
49
*Preliminary
1 pt
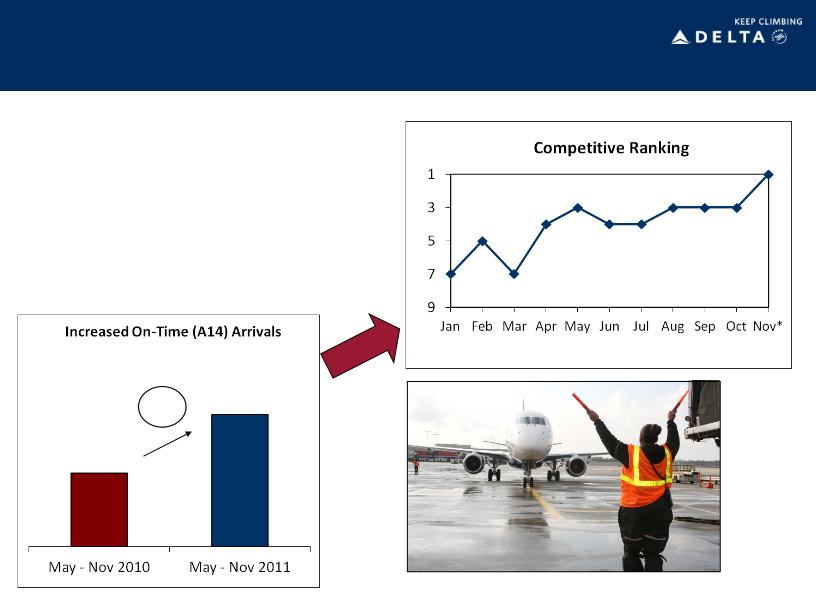
Delta: Arriving On Time
ü
Cross-functional action
team
team
• Awareness and promotion
• D-3 door closure
• Gate-checked bags
50
*Preliminary
9%
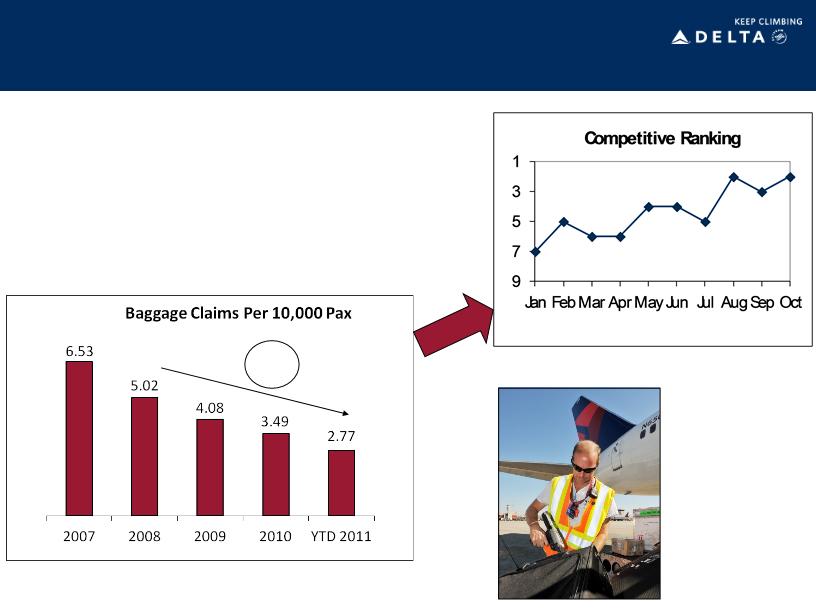
Delta: Bags Arrive with Customers
ü
Five-year positive trend
• Infrastructure
• Technology
• Process
58
%
%
51
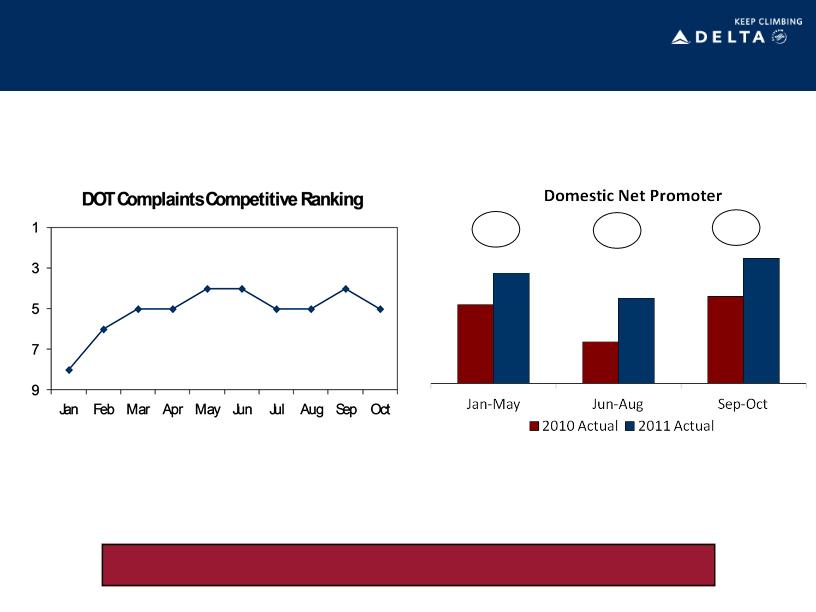
Delta: Our Customers Have Noticed
Making Delta an airline customers prefer
53
+30%
+64%
+34%

Solid Financial Foundation
Hank Halter
Chief Financial Officer

Solid Financial Foundation
Focus on Operating
Costs
Costs
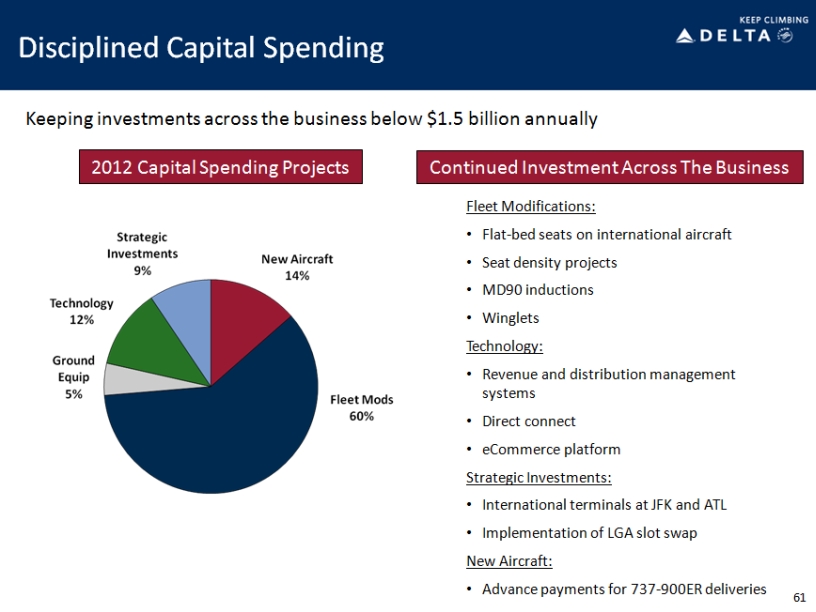
Disciplined Capital
Spending
Spending
• Measured capital spending, with focus on projects
with high rate of return
with high rate of return
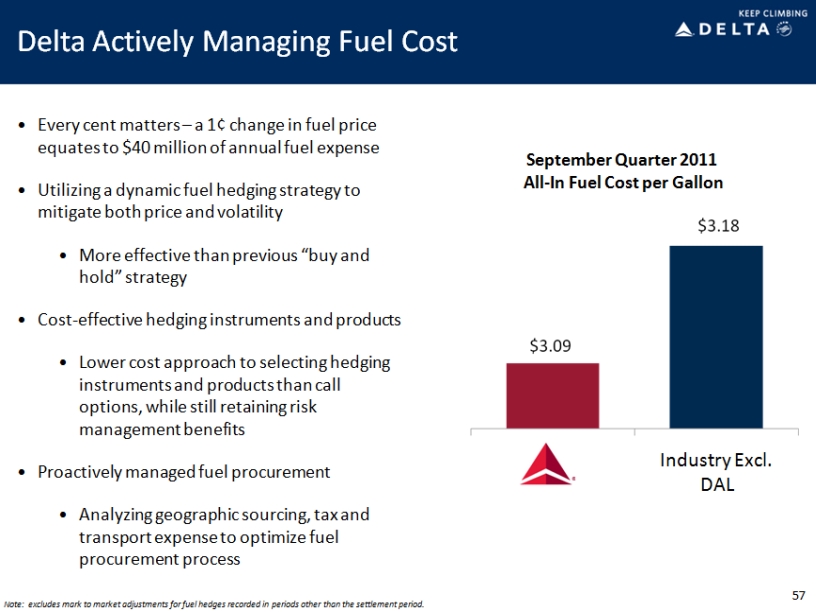
• Reducing fuel price volatility through hedging and
supply management
supply management
• Addressing non-fuel unit cost pressures to maintain
advantage to industry peers
advantage to industry peers
• Strong free cash flow generation provides for
delevering the balance sheet and derisking
the business
delevering the balance sheet and derisking
the business
Improved Balance
Sheet
55
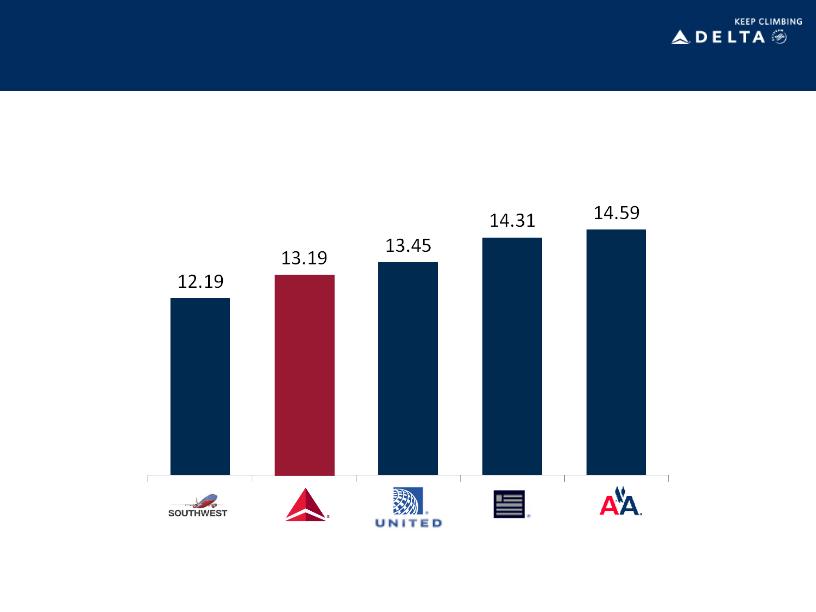
Maintaining A Total Cost Advantage
56
September 2011 Quarter Unit Costs (cents)
Note: excludes special items, ancillary businesses, and profit sharing.
Despite recent cost pressures, Delta maintains the lowest unit costs of the network carriers
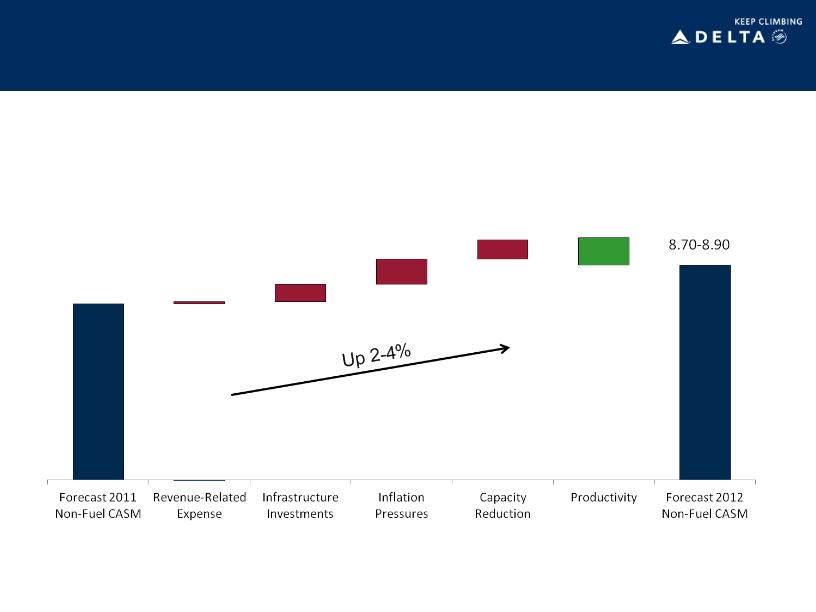
Pressure on 2012 Non-Fuel Unit Costs
8.53-8.55
Costs pressured by inflation, capacity reductions, and customer and operational
investments
investments
Non-Fuel Unit Cost
58
Note: excludes special items, ancillary businesses, and profit sharing.

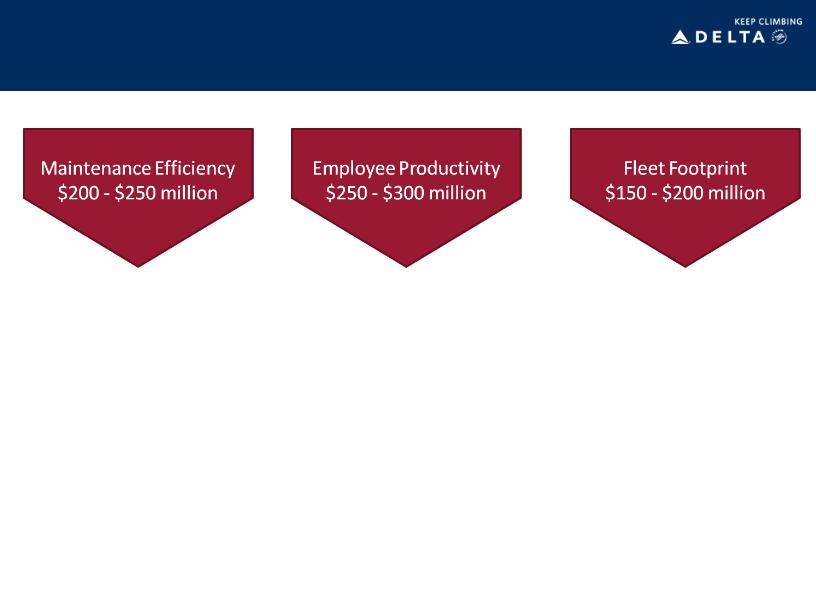
2012 Initiatives Will Partially Offset Cost
Pressures
Pressures
• Increase employee productivity
• Benefits from voluntary headcount reduction
• Improve facility utilization and rates
• Streamline merit organization
Productivity
Maintenance
and Fleet
Distribution
and Technology
• Drive channel share to lower-cost delta.com with
new platform
new platform
• Improved alignment of commissions
• Renegotiate rates with GDS providers and OTAs
• Ground 140 older, less efficient aircraft over two
years
years
• Leverage AeroMexico JV to optimize maintenance
opportunities
opportunities
• Greater workscope efficiencies
59

Delta Actively Managing Liquidity
• A $5 billion target level
for total liquidity
provides sufficient
cushion to handle the
inherent volatilities in
the industry
for total liquidity
provides sufficient
cushion to handle the
inherent volatilities in
the industry
• Industry leading $1.8
billion of available
revolvers saves over
$100 million annually
billion of available
revolvers saves over
$100 million annually
60
Significant Free
Cash Flow
Generation
Cash Flow
Generation
• Continued focus on
generating returns from
the business
generating returns from
the business
• Free cash flow
generation, combined
with consistent access
to the capital markets,
reduces need to
maintain high liquidity
balances
generation, combined
with consistent access
to the capital markets,
reduces need to
maintain high liquidity
balances
$5 Billion Targeted
Liquidity
Liquidity
Minimize Liquidity
Carrying Costs
Carrying Costs
Derisking the Business through Debt Reduction
Solid Progress On Debt
Reduction…
Reduction…
$17B
12/31/11
$12.9B
$10B
62
On track to achieve $10 billion adjusted net debt target in the next 18 months
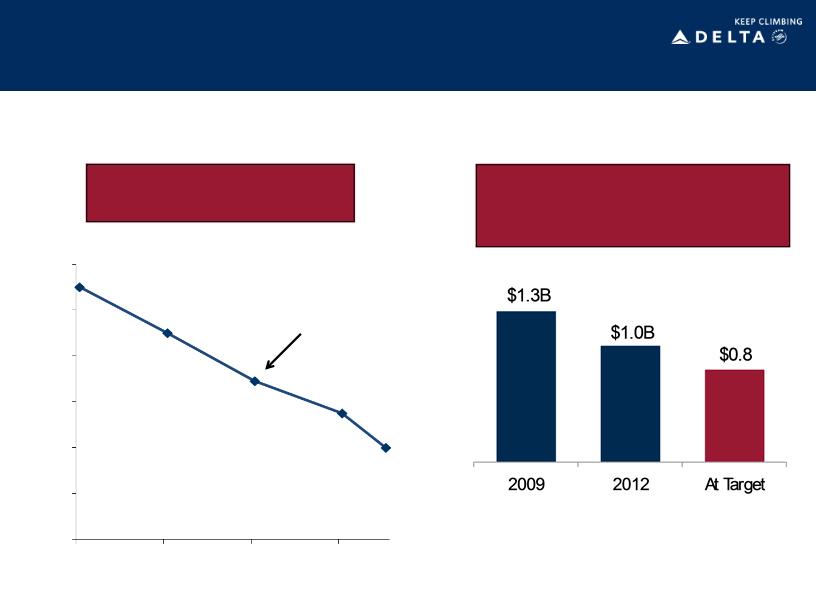
…Producing Interest Expense
Savings and Enhanced
Flexibility
Savings and Enhanced
Flexibility
2009
Mid-2013

Delta: Keep Climbing
63
Focus on top-line
growth
growth
Taking a disciplined
approach
approach
Reducing risk
across the business
across the business
Growing and diversifying revenues through a broad
global network, corporate revenue gains, fuel cost
recovery and improved products and services
global network, corporate revenue gains, fuel cost
recovery and improved products and services
Disciplined management of capacity, costs and
capital to improve profitability, generate free
cash flow and invest in the business
capital to improve profitability, generate free
cash flow and invest in the business
Creating a solid franchise that generates strong margins and cash flow, provides for
net debt reduction and investment for the future
net debt reduction and investment for the future
Reducing labor, financial and operational risk
key to creating a stable business model in a
volatile industry
key to creating a stable business model in a
volatile industry
|
Non-GAAP Financial Measures
|
||||||||||
|
We sometimes use information that is derived from our Consolidated Financial Statements, but that is not presented in accordance with accounting principles generally accepted in the U.S. (“GAAP”). Certain of this information is considered “non-GAAP financial measures” under the U.S. Securities and Exchange Commission rules. The non-GAAP financial measures should be considered in addition to results prepared in accordance with GAAP, but should not be considered a substitute for or superior to GAAP results.
|
||||||||||
|
Delta is unable to reconcile certain forward-looking projections to GAAP for future periods, including projected consolidated non-fuel cost per available seat mile (CASM), as the nature or amount of special items cannot be estimated at this time.
|
||||||||||
|
Delta excludes special items because management believes the exclusion of these items is helpful to investors to evaluate the company’s recurring operational performance.
|
||||||||||
|
Delta adjusts for mark-to-market (MTM) adjustments for fuel hedges recorded in periods other than the settlement period in order to evalutate the company's financial results in the period shown.
|
||||||||||
|
Delta uses adjusted total debt, including aircraft rent, in addition to long-term adjusted debt and capital leases, to present estimated financial obligations. Delta reduces adjusted total debt by cash, cash equivalents and short-term investments, resulting in adjusted net debt, to present the amount of additional assets needed to satisfy the debt.
|
||||||||||
|
Delta presents consolidated CASM excluding fuel expense and related taxes because management believes the volatility in fuel prices impacts the comparability of year-over-year financial performance.
|
||||||||||
|
Consolidated CASM excludes ancillary businesses not associated with the generation of a seat mile. These businesses include aircraft maintenance and staffing services Delta provides to third parties and Delta’s vacation wholesale operations.
|
||||||||||
|
Delta excludes profit sharing expense from consolidated CASM because management believes the exclusion of this item provides a more meaningful comparison of the company’s results to the airline industry and prior year results.
|
||||||||||
|
Delta presents free cash flow because management believes this metric is helpful to investors to evaluate the company’s ability to generate cash.
|
||||||||||
|
Net Income
|
||||||||
|
Full Year 2011
|
Full Year
|
|||||||
|
(in billions)
|
Projection
|
2010
|
||||||
|
Net income
|
$ | 0.8 | $ | 0.6 | ||||
|
Items excluded:
|
||||||||
|
Restructuring and other items
|
0.2 | 0.4 | ||||||
|
Loss on extinguishment of debt
|
0.1 | 0.4 | ||||||
|
MTM adjustments for fuel hedges recorded in periods other than the settlement period
|
- | - | ||||||
|
Net income excluding special items
|
$ | 1.1 | $ | 1.4 | ||||
|
Adjusted Net Debt
|
||||||||||||||||
|
December 31, 2011
|
||||||||||||||||
|
(in billions)
|
Projection
|
December 31, 2009
|
||||||||||||||
|
Debt and capital lease obligations
|
$ | 13.6 | $ | 17.2 | ||||||||||||
|
Plus: unamortized discount, net from purchase accounting and fresh start reporting
|
0.8 | 1.1 | ||||||||||||||
|
Adjusted debt and capital lease obligations
|
$ | 14.4 | $ | 18.3 | ||||||||||||
|
Plus: 7x last twelve months' aircraft rent
|
2.1 | 3.4 | ||||||||||||||
|
Adjusted total debt
|
16.5 | 21.7 | ||||||||||||||
|
Less: cash, cash equivalents and short-term investments
|
(3.6 | ) | (4.7 | ) | ||||||||||||
|
Adjusted net debt
|
$ | 12.9 | $ | 17.0 | ||||||||||||
|
Unit Cost
|
|
Full Year 2011
Projection
|
Full Year
2010
|
Nine Months Ended
September 30, 2011
|
Three Months Ended
September 30, 2011
|
% Change
Three Months Ended
December 31,
2011 vs. 2010
Projection |
||||||||||||||||
|
Unit Cost
|
14.08 to 14.10 | ¢ | 12.69 | ¢ | 14.18 | ¢ | 14.16 | ¢ | 5 | % | ||||||||||
|
Items excluded:
|
||||||||||||||||||||
|
Ancillary businesses
|
(0.35 | ) | (0.28 | ) | (0.34 | ) | (0.38 | ) | 0 | % | ||||||||||
|
Profit sharing
|
(0.11 | ) | (0.13 | ) | (0.10 | ) | (0.26 | ) | 0 | % | ||||||||||
|
Restructuring and other items
|
(0.09 | ) | (0.19 | ) | (0.09 | ) | - | 1 | % | |||||||||||
|
MTM adjustments for fuel hedges recorded in periods other than the settlement period
|
- | - | (0.11 | ) | (0.33 | ) | 2 | % | ||||||||||||
|
Unit Cost excluding special items
|
13.53 to 13.55
|
12.09 | 13.54 | 13.19 | 8 | % | ||||||||||||||
|
Aircraft fuel and related taxes
|
(5.00 | ) | (3.82 | ) | (5.05 | ) | (5.09 | ) | -6 | % | ||||||||||
|
Non-Fuel Unit Cost excluding special items
|
8.53 to 8.55 | ¢ | 8.27 | ¢ | 8.49 | ¢ | 8.10 | ¢ | 2 | % | ||||||||||
|
Free Cash Flow
|
||||||||
|
(in billions)
|
Full Year 2011 Projection
|
|||||||
|
Net cash provided by operating activities (GAAP)
|
$ | 2.6 | ||||||
|
Net cash used in investing activities (GAAP)
|
$ | (1.3 | ) | |||||
|
Adjustments:
|
||||||||
|
Redemption of short-term investments
|
(0.6 | ) | ||||||
|
Purchase of short-term investments
|
0.8 | |||||||
|
Cash used in investing
|
(1.1 | ) | ||||||
|
Total free cash flow
|
$ | 1.5 | ||||||
|
Average Price Per Fuel Gallon, Adjusted
|
||||||||
|
Three Months Ended
|
||||||||
|
Three Months Ended
|
December 31, 2011
|
|||||||
|
September 30, 2011
|
Projection
|
|||||||
|
Average price per fuel gallon including fuel expense incurred under contract carrier arrangements
|
$ | 3.29 | $ | 2.75 | ||||
|
MTM adjustments for fuel hedges recorded in periods other than the settlement period
|
(0.20 | ) | 0.21 | |||||
|
Average price per fuel gallon adjusted for MTM adjustments for fuel hedges recorded in periods other than the settlement period
|
$ | 3.09 | $ | 2.96 | ||||
|
Operating Margin
|
|||||
|
Full Year 2011
|
|||||
|
Projection
|
|||||
|
Operating Margin
|
7 to 9%
|
||||
|
Items excluded:
|
|||||
|
Restructuring and other items
|
1%
|
||||
|
MTM adjustments for fuel hedges recorded in periods other than the settlement period
|
-2%
|
||||
|
Operating Margin excluding special items
|
6 to 8%
|
||||
|
Non-Operating Expense
|
||||
|
(in millions)
|
Three Months Ended
December 31, 2011
Projection
|
|||
|
Non-operating expense
|
$315 - $340
|
|||
|
Item excluded:
|
||||
|
Loss on extinguishment of debt
|
40
|
|||
|
Non-operating expense excluding special items
|
$275 - $300
|
|||