Attached files
| file | filename |
|---|---|
| 8-K - FORM 8-K - DUNKIN' BRANDS GROUP, INC. | d269143d8k.htm |
 Dunkin’
Brands Group, Inc.
Brands Group, Inc.
Investor Presentation
Investor Presentation
December 2011
December 2011
Exhibit 99.1 |
 Confidential information: Copying, dissemination or distribution of this
information is strictly prohibited. Forward-looking statements
2
Certain information contained in this presentation, particularly information regarding future economic
performance, finances, and expectations and objectives of management constitutes
forward-looking statements. Forward-looking statements can be identified by the
fact that they do not relate strictly to historical or current facts and are generally contain
words such as “believes,” “expects,” “may,” “will,”
“should,” “seeks,” “approximately,” “intends,”
“plans,” “estimates” or “anticipates” or similar expressions. Our
forward-looking statements are subject to risks and uncertainties, which may cause actual results to
differ materially from those projected or implied by the forward-looking statement.
Forward-looking statements are based on current expectations and assumptions and currently
available data and are neither predictions nor guarantees of future events or performance. You
should not place undue reliance on forward-looking statements, which speak only as of the
date hereof. We do not undertake to update or revise any forward-looking statements
after they are made, whether as a result of new information, future events, or otherwise,
except as required by applicable law. Regulation G
This presentation contains certain non-GAAP measures which are provided to assist in
an understanding of the Dunkin’ Brands Group, Inc. business and its performance. These
measures should always be considered in conjunction with the appropriate GAAP measure.
Reconciliations of non-GAAP amounts to the relevant GAAP amount are provided as an
attachment to these slides. |
 Confidential information: Copying, dissemination or distribution of this
information is strictly prohibited. Strong platform for continued growth
Our key business strengths
Strong and established brands with leading market positions
Two strong and highly recognized global brands that generated LTM
franchisee-reported sales of $8.1 bn
(1)
Strong comp store sales trajectory
Significant opportunities to grow brands globally
Over 16,500 global locations with significant opportunity for domestic and
international growth Invested during downturn to position ourselves for
growth Franchised business model provides platform for growth
Nearly 100% franchised business model generates high margins with low capex
requirements, driving cash flow generation
Store-level
economics
generates
franchisee
demand
for
additional
restaurants
Strong performance since IPO underscores long-term growth opportunity
Highly
experienced,
aligned
and
motivated
management
team
with
franchise
“operating”
philosophy
3
1. Last twelve months (“LTM”) ending September 24, 2011
|
 Two
leading global brands each with over 60 years of heritage
Source:
NPD Group/CREST for year ending February 2011; Omnibus Awareness Study, July
2010; 4
Over 95% aided brand awareness in U.S.
#1 in QSR customer loyalty for 5 straight years
1 bn+ cups of coffee sold in the U.S. annually
#1 position in Hot Regular/Flavored/Decaf Coffee,
Iced Coffee, Donuts, Bagels and tied in Muffins
Over 50% share of New England coffee servings and
morning meal traffic
36 U.S. states and in 31 other countries
1,000+ ice cream flavors
95% aided brand awareness in U.S
#1 hard serve ice cream position in U.S.
#1 market share positions in Fast Food Ice Cream
category in Japan and South Korea in 2010
45 U.S. states and in 46 other countries
Brand Keys
America Runs on Dunkin’
®
More Flavors, More Fun™
Confidential information: Copying, dissemination or distribution of this
information is strictly prohibited. |
 Confidential information: Copying, dissemination or distribution of this
information is strictly prohibited. U.S.
$6.2 bn
(76%)
Intl
$1.9bn
(24%)
$6.3bn
(78%)
$1.7bn
(22%)
9,900
(60%)
6,625
(40%)
U.S.
9,387
(57%)
Intl
7,138
(43%)
Substantial global platform across both brands
5
1. Last twelve months (“LTM”) ending September 24, 2011
2. Data as of September 24, 2011
LTM Franchisee-Reported Sales
1
Global Points of Distribution
2 |
 Confidential information: Copying, dissemination or distribution of this
information is strictly prohibited. 6
Our growth strategy |
 Confidential information: Copying, dissemination or distribution of this
information is strictly prohibited. 7
Focused growth strategies across each segment
7% of LTM revenue
73% of LTM revenue
20% of LTM revenue
Note: LTM figures as of 9/24/2011
Continue DD U.S.
contiguous store
expansion
Increase comparable
store sales growth of BR
U.S.
Drive accelerated
international growth
across both brands
Increase comparable
store sales and
profitability in DD U.S. |
 Confidential information: Copying, dissemination or distribution of this
information is strictly prohibited. 8
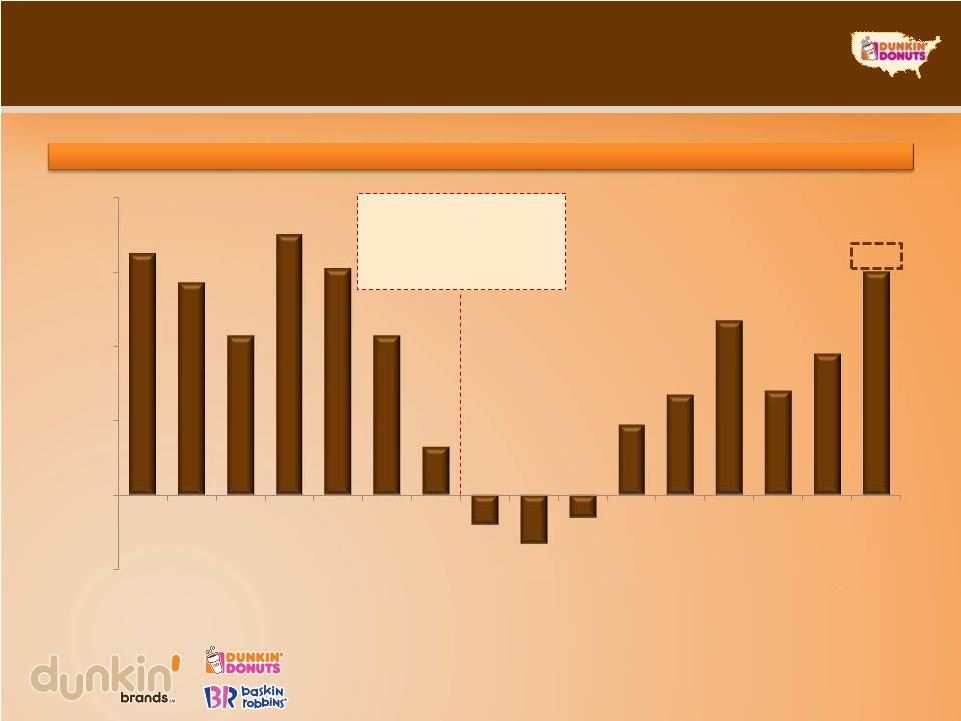
Strong DD U.S. comp growth momentum
Resilient comp performance throughout economic cycles
Note: Fiscal year-end changed from August to December starting in 2006
45 consecutive
quarters of
comparable store
sales growth
6.5%
5.7%
4.3%
7.0%
6.1%
4.3%
1.3%
(0.8%)
(1.3%)
(0.6%)
1.9%
2.7%
4.7%
2.8%
3.8%
6.0%
(2.0%)
0.0%
2.0%
4.0%
6.0%
8.0%
2001
2002
2003
2004
2005
2006
2007
2008
2009
1Q10
2Q10
3Q10
4Q10
1Q11
2Q11
3Q11
Dunkin’
Donuts U.S. comparable store sales growth |
 Confidential information: Copying, dissemination or distribution of this
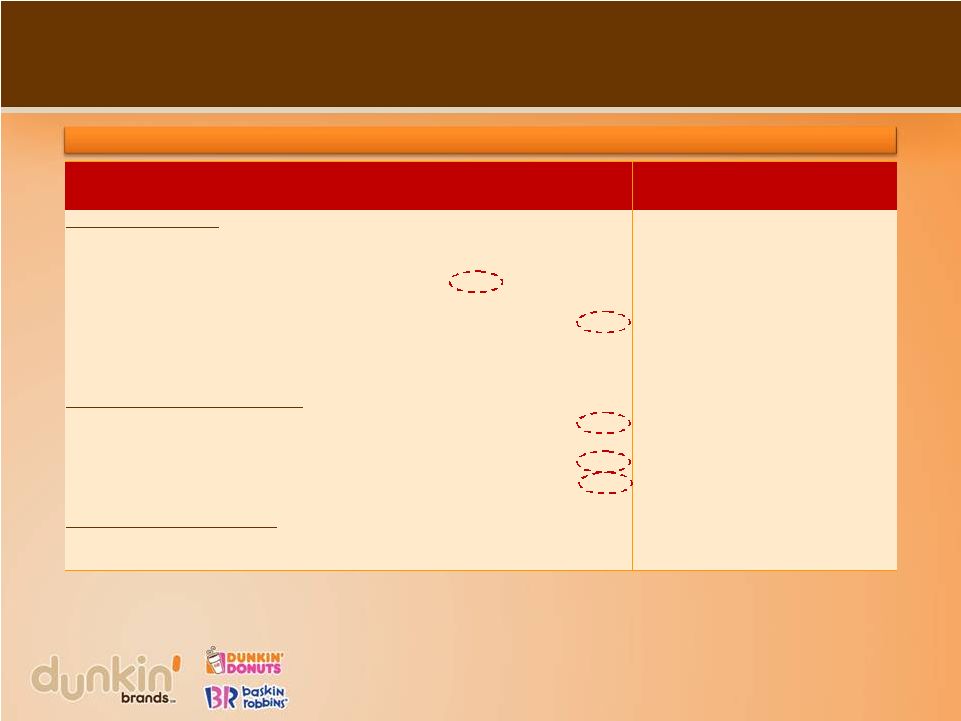
information is strictly prohibited. 9
Dunkin’
Donuts U.S. strategy
Drive comparable store sales and profitability
•
Successful product innovation record with strong pipeline
•
Differentiated brand platform with high-impact marketing
•
Operations-focused culture driving improved in-store
experience
Accelerate profitable and contiguous POD growth
•
Among one of the industry-leading expansion track records
•
Significant opportunity across U.S. |
 Confidential information: Copying, dissemination or distribution of this
information is strictly prohibited. 10
Powerful track record of product innovation
1995
Coffee excellence
•
Hazelnut and
French Vanilla
1996
Breakfast sandwiches
Bagels
1998
Fruit Coolatta
®
2000
Dunkaccino
®
Hot chocolate
2001
Vanilla Chai
2003
Hot espresso
platform
2004
Iced lattes
2005
Turbo Ice
®
Tropicana
®
Coolatta
®
9 iced coffee and hot
coffee flavors
2008
DD Smart
®
Flatbreads
2010
Bagel twists
Coolatta
®
mixology
PM snacks
2009
Wake-Up Wrap
®
2011
Big n’
Toasty
Shaped donuts
Dunkin’
K-Cups
Frozen Iced Tea
Captain America
Coolatta |
 Confidential information: Copying, dissemination or distribution of this
information is strictly prohibited. 11
High impact marketing with broad reach
Produce news “buzz”
from Limited Time
Offerings
TV, Radio, Print, Public Relations, Point
of Purchase, Local Marketing
Growing loyalty
program
Strong grocery
coffee business
Strong heritage in traditional media
Growing interactive, internet
and social media |
 Confidential information: Copying, dissemination or distribution of this
information is strictly prohibited. 12
Intense focus on restaurant level
operational support
People &
systems
Great guest
experience
Profitable
topline sales
Strong guest satisfaction scores
Clearly defined store
standards
Strong remodel program
Strong support to
franchisees and
restaurant managers with
training and marketing
Effective systems for
back-office management |
 Confidential information: Copying, dissemination or distribution of this
information is strictly prohibited. 13
Our U.S. development opportunity |
 Confidential information: Copying, dissemination or distribution of this
information is strictly prohibited. Region
Population
(mm)
Stores
(1)
Penetration
Core
36.0
3,754
1:9,600
Eastern Established
53.8
2,180
1:24,700
Eastern Emerging
88.7
845
1:105,000
West
130.0
116
1:1,120,700
14
Significant opportunity for profitable growth
1. As of 9/24/2011 |
 Confidential information: Copying, dissemination or distribution of this
information is strictly prohibited. 15
Proven ability to increase penetration
in Established markets
Note: Penetration figures based on store counts as of 9/24/11
1. Represents net development of the region, not select DMAs, for the nine month
period ending 9/24/11 359,000
Total penetration of select
established markets
5,800
5,500
6,600
13,800
15,000
20,000
25,000
30,000
33,000
50,000
79,000
84,000
117,000
114,000
123,000
140,000
0
50,000
100,000
150,000
200,000
350,000
34,200
19,100
0
25,000
50,000
2000
Q3 2011
Core
Established
Emerging
29%
Q3 2011 YTD net
new open (% of total)
(1)
28%
38%
West
5% |
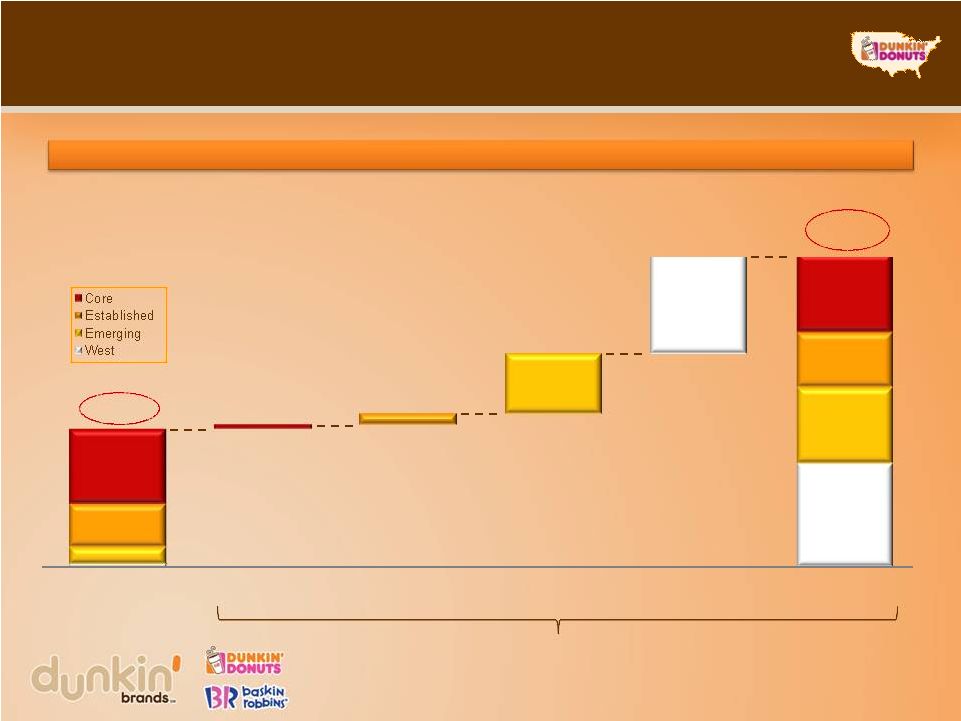 16
Significant long-term expansion opportunity
for Dunkin’
Donuts U.S.
~15,000
6,895
1:9,200
1:20,000
1:23,000
1:25,000
1:20,000
DD pro forma long-term penetration
Confidential information: Copying, dissemination or distribution of this
information is strictly prohibited. 116
~5,116
845
~3,845
2,180
~2,730
3,754
~3,954
~200
~550
~3,000
Q3 2011
Core
Established
Emerging
West
Long
term
~
5,000
Dunkin’
Donuts U.S. bridge to long-term goal (existing stores + new net
development) |
 Confidential information: Copying, dissemination or distribution of this
information is strictly prohibited. 17
Our international growth opportunity |
 Confidential information: Copying, dissemination or distribution of this
information is strictly prohibited. Note:
Unit count as of 9/24/11
Store count:
5,255
429
577
88
789
6,000
18
Asia
Middle East
Europe
Americas
Australia / NZ
100
200
300
400
500
600
700
800
900
-
Baskin-Robbins
Dunkin' Donuts
2,349
233
101
311
11
2,906
556
328
266
77
Both brands have strong international
presence with significant growth potential |
 Confidential information: Copying, dissemination or distribution of this
information is strictly prohibited. Drive continued international growth
for both brands
19
History of successful international growth, particularly
in Asia
Dunkin’
Brands is among the largest U.S. QSR
companies overseas by unit count
Emphasis on improving penetration in existing
markets, given strong concept acceptance
Both brands have been able to grow in new markets
•
Baskin-Robbins has close-to-universal product
appeal
•
Dunkin’
Donuts’
platform allows for localization
and flexibility
•
13% international SWS CAGR
•
9% international POD CAGR
Drive growth and increase penetration in established
markets (Japan, Korea and Middle East)
Leverage brands’
strengths to grow in newer, high-
potential markets
•
Accelerate China growth for both brands
•
Launch Dunkin’
Donuts in India
•
Build-out other emerging markets
450 –
500 planned 2011 net
openings
Focused international growth priorities
A history of successful international growth
2007 –
2010 international growth: |
 Confidential information: Copying, dissemination or distribution of this
information is strictly prohibited. 20
Continue to re-energize Baskin-Robbins U.S.
Leveraging 65-year heritage and 95% aided brand awareness
Implementing focused strategic plan aimed at improving comp sales
•
Sharpening brand differentiation
•
Improving operations and marketing
•
Optimizing supply chain to increase franchisee profitability
•
Introducing standardized retail technology
•
Accelerating store transfer program
Current results are encouraging
•
Improving comp sales trend (+1.7% in Q3)
•
Increased franchisee engagement
•
Reached an all-time high in overall guest satisfaction
|
 21
Financial highlights
Confidential information: Copying, dissemination or distribution of this
information is strictly prohibited. |
 Confidential information: Copying, dissemination or distribution of this
information is strictly prohibited. 22
Long-term earnings target
Strong, consistent revenue growth
•
U.S. consolidated comps in the
2–4% range
•
Total net unit development of
approximately 3–5% with
opportunity to accelerate
Highly leverageable cost structure
•
Drives margin expansion of
150–200 bps per year
Strong free cash flow
•
Facilitates earnings growth through
deleveraging or shareholder payout
6–8% revenue growth
10–12% operating income
(excl. intangibles
amortization) growth
15%+ EPS (excl. intangibles
amortization) growth
* These targets are forward-looking, are subject to significant business, economic, regulatory and
competitive uncertainties and contingencies, many of which are beyond the control of the Company
and its management, and are based upon assumptions with respect to future decisions, which are subject to change. Actual results will vary and those variations may
be material. For discussion of some of the important factors that could cause these variations,
please consult the “Risk Factors” section of the preliminary prospectus. Nothing in this
presentation should be regarded as a representation by any person that these targets will be achieved
and the Company undertakes no duty to update its targets. Drivers
Long-term targets* |
 Confidential information: Copying, dissemination or distribution of this
information is strictly prohibited. Three months
ended 9/24/11
Increase /
(decrease) to prior
year period
Nine months
ended 9/24/11
Increase /
(decrease) to prior
year period
Select operating metrics
Systemwide sales growth
8.9%
230 bps
7.1%
100 bps
Consolidated U.S. comp
5.6%
380 bps
3.9%
320 bps
Dunkin' Donuts U.S. comp
6.0%
330 bps
4.3%
290 bps
Baskin-Robbins U.S. comp
1.7%
750 bps
(0.7%)
540 bps
Consolidated global PODs
1
16,525
3.0%
16,525
3.0%
Dunkin' Donuts global PODs
9,900
2.3%
9,900
2.3%
Baskin-Robbins global PODs
6,625
3.9%
6,625
3.9%
Select income statement items ($mm)
Revenues
$163.5
9.3%
$459.7
7.6%
Adjusted operating income
2
75.9
21.3%
197.7
11.5%
Adjusted operating margin
46.4%
450 bps
43.0%
150 bps
Adjusted net income
2
31.3
32.5%
65.6
7.0%
Select balance sheet items ($mm)
Cash and cash equivalents
3
$181.8
Net debt
4
/ LTM adjusted EBITDA
5
4.6x
23
Third quarter and year-to-date results
1
Expected global net development of over 600 PODs in FY2011
2
Adjusted operating income and adjusted net income are non-GAAP measures
reflecting operating income and net income, determined in accordance with GAAP, further adjusted for amortization of
intangible assets,
impairment
charges,
and
Sponsor
management
agreement
termination
fee,
and
in
the
case
of
adjusted
net
income,
loss on debt extinguishment and refinancing charges, net of the
tax impact of such adjustments.
3
Amount includes $69.7mm cash held for advertising funds or reserved for gift
card/certificate programs 4
Net debt excludes cash held or reserved for gift card/gift certificate
programs 5
Adjusted
EBITDA
reflects
LTM
09/24/2011
credit
agreement
EBITDA
of
$300.7mm
Financial highlights |
 Confidential information: Copying, dissemination or distribution of this
information is strictly prohibited. 24
Executing on growth initiatives since IPO
Product innovation in beverages, premium breakfast sandwiches and deli sandwiches
driving higher average Dunkin’
Donuts U.S. ticket sales
Strengthening core comps and introduction of K-Cups helping further improve
franchisee profitability
•
No evidence of K-Cup cannibalization of in-store ready-brewed
coffee Global promotions and “What Are You Drinkin’?”
campaign reinforce position as
#1retailer of hot and iced coffee in U.S.
Average age of Dunkin’
Donuts U.S. restaurant image now less than 5 years
•
On track to complete record 500+ remodels in 2011
Strong interest from franchisee candidates for newly released markets
New Baskin-Robbins International store design and localized product
offerings support further expansion in existing and new markets
Q3 Baskin-Robbins U.S. comparable store sales of 1.7% highlight ongoing
operational improvements and successful promotional activities
10,000
Global Dunkin’
Donuts store opened in China
th |
 Confidential information: Copying, dissemination or distribution of this
information is strictly prohibited. Brands have unique mix of heritage and
consumer buzz Track record of driving strong comps
Both domestic and international white space growth
opportunities
Experienced management team focused on disciplined
growth
Committed to strong long-term
earnings growth and cash flow
generation with an asset-light
business model
Summary
25 |
 Confidential information: Copying, dissemination or distribution of this
information is strictly prohibited. 26
Attachment –
Non-GAAP Reconciliation
Three months ended
Nine months ended
September
24, 2011
September
25, 2010
Increase
(Decrease)
September
24, 2011
September
25, 2010
Increase
(Decrease)
Operating income
$54,112
$54,574
(0.8)%
$160,742
$149,145
7.8%
Adjustments:
14,671
-
n/m
14,671
-
n/m
7,001
7,762
(9.8)%
21,106
25,315
(16.6)%
163
265
(38.5)%
1,220
2,955
(58.7)%
Adjusted operating income
$75,947
$62,601
21.3%
$197,739
$177,415
11.5%
Adjusted operating income is reconciled to operating income for the periods presented
as follows: Impairment charges
Amortization of intangible assets
Sponsor termination fee |
 Confidential information: Copying, dissemination or distribution of this
information is strictly prohibited. 27
Attachment –
Non-GAAP Reconciliation
Three months ended
Nine months ended
September
24, 2011
September
25, 2010
Basis
Point
Increase
(Decrease)
September
24, 2011
September
25, 2010
Basis
Point
Increase
(Decrease)
Operating income margin
33.1%
36.5%
(340)
35.0%
34.9%
10
Adjustments:
8.9%
0.0%
890
3.2%
0.0%
320
4.3%
5.2%
(90)
4.6%
5.9%
(130)
0.1%
0.2%
(10)
0.2%
0.7%
(50)
Adjusted operating income margin
46.4%
41.9%
450
43.0%
41.5%
150
Adjusted operating income margin is reconciled to operating income margin for the
periods presented as follows:
Impairment charges
Amortization of intangible assets
Sponsor termination fee |
 Confidential information: Copying, dissemination or distribution of this
information is strictly prohibited. 28
Attachment –
Non-GAAP Reconciliation
Three months ended
Nine months ended
September
24, 2011
September
25, 2010
Increase
(Decrease)
September
24, 2011
September
25, 2010
Increase
(Decrease)
Net income
$7,412
$18,842
(60.7)%
$22,851
$42,117
(45.7)%
Adjustments:
14,671
-
n/m
14,671
-
n/m
7,001
7,762
(9.8)%
21,106
25,315
(16.6)%
163
265
(38.5)%
1,220
2,955
(58.7)%
18,050
-
n/m
34,222
3,693
826.7%
(15,954)
(3,211)
396.9%
(28,488)
(12,785)
122.8%
Adjusted net income
$31,343
$23,658
32.5%
$65,582
$61,295
7.0%
Adjusted net income is reconciled to net income for the periods presented as
follows: 1
Tax impact of adjustments calculated at 40% effective tax rate for each period
presented. Impairment charges
Amortization of intangible assets
Sponsor termination fee
Loss on debt extinguishment and
refinancing transactions
Tax impact of adjustments
1 |
 Confidential information: Copying, dissemination or distribution of this
information is strictly prohibited. 29 |