Attached files
| file | filename |
|---|---|
| EX-32.1 - SECTION 906 CEO CERTIFICATION - GEOSPACE TECHNOLOGIES CORP | d249151dex321.htm |
| EX-23.1 - CONSENT OF UHY LLP, INDEPENDENT REGISTERED PUBLIC ACCOUNTING FIRM - GEOSPACE TECHNOLOGIES CORP | d249151dex231.htm |
| EX-32.2 - SECTION 906 CFO CERTIFICATION - GEOSPACE TECHNOLOGIES CORP | d249151dex322.htm |
| EX-21.1 - SUBSIDIARIES OF THE REGISTRANT - GEOSPACE TECHNOLOGIES CORP | d249151dex211.htm |
| EX-31.1 - SECTION 302 CEO CERTIFICATION - GEOSPACE TECHNOLOGIES CORP | d249151dex311.htm |
| EX-31.2 - SECTION 302 CFO CERTIFICATION - GEOSPACE TECHNOLOGIES CORP | d249151dex312.htm |
| EXCEL - IDEA: XBRL DOCUMENT - GEOSPACE TECHNOLOGIES CORP | Financial_Report.xls |
Table of Contents
UNITED STATES
SECURITIES AND EXCHANGE COMMISSION
Washington, D.C. 20549
FORM 10-K
| x | Annual Report Pursuant to Section 13 or 15(d) of the Securities Exchange Act of 1934 |
for the Fiscal Year Ended September 30, 2011
OR
| ¨ | Transition Report Pursuant to Section 13 or 15(d) of the Securities Exchange Act of 1934 |
Commission file number 001-13601
OYO GEOSPACE CORPORATION
(Exact Name of Registrant as Specified in Its Charter)
| Delaware | 76-0447780 | |
| (State or Other Jurisdiction of | (I.R.S. Employer | |
| Incorporation or Organization) | Identification No.) |
7007 Pinemont Drive
Houston, Texas 77040-6601
(Address of Principal Executive Offices)
(713) 986-4444
(Registrant’s telephone number, including area code)
Securities Registered pursuant to Section 12(b) of the Act:
| Title of Each Class |
Name of Each Exchange on Which Registered | |
| Common Stock | The NASDAQ Global Market |
Securities Registered pursuant to Section 12(g) of the Act:
NONE
Indicate by check mark if the Registrant is a well-known seasoned issuer, as defined in Rule 405 of the Securities Act. Yes ¨ No x
Indicate by check mark if the Registrant is not required to file reports pursuant to Section 13 or Section 15(d) of the Act. Yes ¨ No x
Indicate by check mark whether the Registrant (1) has filed all reports required to be filed by Section 13 or 15(d) of the Securities Exchange Act of 1934 during the preceding 12 months (or for such shorter period that the Registrant was required to file such reports), and (2) has been subject to such filing requirements for the past 90 days. Yes x No ¨
Indicate by check mark whether the registrant has submitted electronically and posted on its corporate Website, if any, every Interactive Data File required to be submitted and posted pursuant to Rule 405 of Regulation S-T (§232.405 of this chapter) during the preceding 12 months (or for such shorter period that the Registrant was required to submit and post such files). Yes x No ¨
Indicate by check mark if disclosure of delinquent filers pursuant to Item 405 of Regulation S-K (§229.405 of this chapter) is not contained herein, and will not be contained, to the best of the Registrant’s knowledge, in definitive proxy or information statements incorporated by reference in Part III of this Form 10-K or any amendment to this Form 10-K. ¨
Indicate by check mark whether the Registrant is a large accelerated filer, an accelerated filer, a non-accelerated filer or a smaller reporting company. See definitions of “large accelerated filer”, “accelerated filer” and “smaller reporting company” in Rule 12b-2 of the Exchange Act.
| Large accelerated filer | ¨ | Accelerated filer | x | |||
| Non-accelerated filer | ¨ | Smaller reporting company | ¨ | |||
Indicate by check mark whether the registrant is a shell company (as defined in Rule 12b-2 of the Exchange Act). Yes ¨ No x
There were 6,352,758 shares of the Registrant’s Common Stock outstanding as of the close of business on December 5, 2011. As of March 31, 2011, the aggregate market value of the Registrant’s Common Stock held by non-affiliates was approximately $454 million (based upon the closing price of $98.58 on March 31, 2011, as reported by The NASDAQ Global Market).
DOCUMENTS INCORPORATED BY REFERENCE
Portions of the definitive proxy statement for the Registrant’s 2012 Annual Meeting of Stockholders are incorporated by reference into Part III of this report.
Table of Contents
PART I
Item 1. Business
Overview
OYO Geospace Corporation is a Delaware corporation incorporated on September 13, 1997. Unless otherwise specified, the discussion in this Annual Report on Form 10-K refers to OYO Geospace Corporation and its subsidiaries. We design and manufacture instruments and equipment used in the acquisition and processing of seismic data as well as in the characterization and monitoring of producing oil and gas reservoirs. Demand for our products has been, and will likely continue to be, vulnerable to downturns in the economy and the oil and gas industry in general. While natural gas prices have stabilized and crude oil prices have strengthened during most of fiscal years 2010 and 2011, there was substantial volatility in oil and natural gas prices during fiscal years 2008 and 2009. Please refer to the risks discussed under the heading “Risk Factors” for more information.
We have engaged in the seismic instrument and equipment business since 1980 and market our products primarily to the oil and gas industry. We also design, manufacture and distribute thermal imaging equipment and thermal media products targeted at the screen print, point of sale, signage and textile market sectors. We have been manufacturing thermal imaging products since 1995. We report and evaluate financial information for each of these two segments: Seismic and Thermal Solutions.
Seismic Products
The seismic segment of our business accounts for the majority of our sales. Geoscientists use seismic data primarily in connection with the exploration, development and production of oil and gas reserves to map potential and known hydrocarbon bearing formations and the geologic structures that surround them.
Seismic Exploration Products
A seismic energy source and a seismic data recording system are combined to acquire seismic data. We provide many of the components of seismic data recording systems, including data acquisition systems, geophones, hydrophones, multi-component sensors, seismic leader wire, geophone strings, connectors, seismic telemetry cables and other seismic related products. On land, our customers use our data acquisition systems, geophones, leader wire, cables and connectors to receive and measure seismic reflections resulting from an energy source to data recording units, which store information for processing and analysis. In the marine environment, large ocean-going vessels tow long seismic cables known as “streamers” containing hydrophones which are used to detect pressure changes. Hydrophones transmit electrical impulses back to the vessel’s data recording unit where the seismic data is stored for subsequent processing and analysis. Our marine seismic products help steer streamers while being towed and help recover streamers if they become disconnected from the vessel.
Our seismic sensor, cable and connector products are compatible with most major competitive seismic data acquisition systems currently in use, and sales result primarily from seismic contractors purchasing our products as components of new seismic data acquisition systems or to repair and replace components of seismic data acquisition systems already in use.
During fiscal year 2008, we announced the development of a land-based wireless (or nodal) data acquisition system. Each nodal station operates independently and therefore can be deployed in virtually unlimited channel configurations. Rather than utilizing interconnecting cables as required by most traditional land data acquisition systems, each nodal station operates as an independent data collection system. As a result, our nodal system requires less maintenance, which we believe allows our customers to operate more effectively and efficiently because of its reduced environmental impact, lower weight and ease of operation. Our nodal system is designed into configurations ranging from one to four channels per station. Since its introduction, we have sold approximately 91,000 channels of our land-based nodal acquisition system and currently have approximately 32,000 available for rent. We may increase our rental fleet further pending additional demand by our customers.
1
Table of Contents
In October 2009, we introduced a marine-based nodal data acquisition system. Similar to our land nodal system, the marine nodal system can be deployed in virtually unlimited channel configurations and does not require interconnecting cables between each station. Our deepwater versions of this nodal system can be deployed in depths of up to 3,000 meters.
Our wholly-owned subsidiary in the Russian Federation manufactures international standard geophones, sensors, seismic leader wire, seismic telemetry cables and related seismic products for customers in the Russian Federation and other international seismic marketplaces. Operating in foreign locations involves certain risks as discussed under the heading “Risk Factors – Our Foreign Subsidiaries and Foreign Marketing Efforts Face Additional Risks and Difficulties” in this Annual Report on Form 10-K.
Seismic Reservoir Products
We have developed permanently installed high-definition reservoir characterization products for ocean-bottom applications in producing oil and gas fields. We also produce a retrievable version of this ocean-bottom system for use on fields where permanently installed systems are not appropriate or economical. Seismic surveys repeated over selected time intervals show dynamic changes within the reservoir and can be used to monitor the effects of production. Utilizing these tools, producers can enhance the recovery of oil and gas deposits over the life of a reservoir.
In addition, we produce seismic borehole acquisition systems which employ a fiber optic augmented wireline capable of very high data transmission rates. These systems are used for several reservoir characterization applications, including an application pioneered by us allowing operators and service companies to monitor and measure the results of fracturing operations.
Emerging Technology Products
Our products continue to develop and expand beyond seismic applications through the utilization of our existing engineering experience and manufacturing capabilities. We design and manufacture power and communication transmission cable products for offshore applications and market these products to the offshore oil and gas and offshore construction industries. These products include a variety of specialized cables, primarily used in deepwater applications, such as remotely operated vehicle (“ROV”) tethers, umbilicals and electrical control cables. These products also include specially designed and manufactured cables, including armored cables, engineered to withstand harsh offshore operating environments.
In addition, we design and manufacture industrial sensors for the vibration monitoring, security and earthquake detection markets. We also design and manufacture other specialty cable and connector products, such as those used in connection with global positioning products and water meter applications.
Thermal Solutions Products
Our thermal solutions product technologies were originally developed for seismic data processing applications. In 1995, we modified this technology for application in other markets. Our thermal printers include both thermal imagesetters for graphics applications and thermal plotters for seismic applications. In addition, our thermal solutions products include direct-to-screen systems, thermal printheads, dry thermal film, thermal transfer ribbons and other thermal media. Our thermal imaging solutions produce images ranging in size from 12 to 54 inches wide and in resolution from 400 to 1,200 dots per inch. We market our thermal imaging solutions to a variety of industries, including the screen printing, point-of-sale, signage, flexographic and textile markets. We also continue to sell these products to our seismic customers.
The quality of thermal imaging is determined primarily by the interrelationship between a thermal printhead and the thermal media, be it film, ribbon, or any other media. We manufacture thermal printheads and thermal film, which we believe will enable us to more effectively match the characteristics of our thermal printers to thermal film, thereby improving print quality, and make us more competitive in markets for these products.
2
Table of Contents
We also distribute private label high-quality dry thermal media for use in our thermal printers and direct-to-screen systems. In addition, we are continuously engaged in efforts to develop new lines of dry thermal film and ribbon in order to improve the image quality of our media for use with our printheads. In order to achieve more than marginal growth in our thermal solutions product business in future periods, we believe that it is important to continue our concentration of efforts on both our printhead and media improvements.
Products and Product Development
Seismic Products
Our seismic product lines currently consist of land and marine nodal seismic data acquisition systems, high-definition reservoir characterization products and services, geophones and hydrophones, including multi-component geophones and hydrophones, seismic leader wire, geophone string and acquisition system connectors, seismic telemetry cables, marine seismic cable retrieval and steering devices and specialized data acquisition systems targeted at conventional and niche markets. Our seismic products are compatible with most major seismic data acquisition systems currently in use. We believe that our seismic products are among the most technologically advanced instruments and equipment available for seismic data acquisition.
In fiscal year 2008, we introduced “wireless” land and marine nodal seismic data acquisition systems which allow our customers to deploy an unlimited quantity of autonomous nodal stations without the requirement to deploy and maintain lengthy power/communication cables. Our nodal systems are designed into configurations ranging from one to four channels per station. Since its introduction, we have sold approximately 85,000 channels of our land-based nodal acquisition system through September 30, 2011. At September 30, 2011, we had approximately 20,000 channels in our rental fleet which were available for rent to our customers. We expect to increase our rental fleet further pending additional demand by our customers.
Our high-definition reservoir characterization products include the HDSeis™ product line and a suite of borehole and reservoir characterization products and services. Our HDSeis™ System is a high-definition seismic data acquisition system with flexible architecture that allows it to be configured as a borehole seismic system or as a subsurface system for both land and marine reservoir-monitoring projects. The scalable architecture of the HDSeis™ System enables custom designed system configuration for applications ranging from low-channel engineering and environmental-scale surveys requiring a minimum number of recording channels to high-channel surveys required to efficiently conduct permanent reservoir imaging and monitoring. Modular architecture allows virtually unlimited channel expansion. In addition, multi-system synchronization features make the HDSeis™ System well suited for multi-well or multi-site acquisition, simultaneous surface and downhole acquisition and continuous reservoir monitoring projects.
Reservoir characterization requires special purpose or custom designed systems in which portability becomes less critical and functional reliability assumes greater importance. This reliability factor helps assure successful operations in inaccessible locations over a considerable period of time. Additionally, reservoirs located in deepwater or harsh environments require special instrumentation and new techniques to maximize recovery. Reservoir characterization also requires high-bandwidth, high-resolution seismic data for engineering project planning and reservoir management. We believe our HDSeis™ System and tools, designed for cost-effective deployment and lifetime performance, will make borehole and seabed seismic acquisition a cost-effective and reliable process for the challenges of reservoir characterization and monitoring.
Our multi-component seismic product developments include an omni-directional geophone for use in reservoir monitoring, a compact marine three-component or four-component gimbaled sensor and special-purpose connectors, connector arrays and cases.
Our products used in marine seismic data acquisition include our patented marine seismic streamer retrieval devices (“SRDs”). Occasionally, streamer cables are severed and become disconnected from the vessel as a result of obstacles, inclement weather, vessel traffic or human error. Our SRDs, which are attached to the streamer cables, contain air bags which are designed to inflate automatically at a given depth, bringing the severed
3
Table of Contents
streamer cables to the surface. These SRDs save the seismic contractors significant time and money compared to the alternative of losing the streamer cable. We also produce seismic streamer steering devices, or “birds,” which are finlike devices that attach to the streamer cable. These birds help maintain the streamer cable at a certain desired depth as it is being towed through the water.
In order to take advantage of our existing cable manufacturing facilities and capabilities in Houston, we are designing and selling cable products to the offshore oil and gas and offshore construction industries. The production of offshore marine cables requires specialized design capabilities and manufacturing equipment. We also utilize these design capabilities and manufacturing equipment to produce deepwater reservoir characterization products. We are aggressively working to diversify our seismic product lines as well as utilizing our manufacturing capabilities to develop and produce products for use in other industries.
Thermal Solutions Products
Our thermal solutions products include thermal imagesetters for graphics applications and thermal plotters for seismic applications. In addition, our thermal solution products include thermal printheads and thermal media products. We market these products to a variety of industries, including the screen print, point of sale, signage and textile markets. We also sell these products to our seismic customers.
We design, manufacture and sell thermal printers with data images ranging in size from 12 to 54 inches wide and resolution ranging from 400 to 1,200 dpi. We also manufacture our own line of thermal film products as well as distribute another brand of thermal film to the users of our thermal printers. In our thermal solutions segments, we derive revenue primarily from the sale of thermal solutions products to our commercial graphics customers.
Competition
Seismic Products
We believe that we are one of the world’s largest manufacturers and distributors of seismic related products. The principal competitors in our seismic business segment for data acquisition systems, geophones, hydrophones, geophone string connectors, leader wire and telemetry cables are SERCEL (a division of CGGVeritas), ION Geophysical (“ION”), INOVA (a joint venture formed in 2009 between ION and Bureau of Geophysical Prospecting, a subsidiary of China National Petroleum Company) and Steward Cable (a division of Amphenol Corporation). Furthermore, entities in China affiliated with SERCEL as well as other Chinese manufacturers produce low-cost geophones meeting current industry standards.
We believe that the principal keys for success in the seismic instruments and equipment market are technological superiority, product durability, reliability, and customer support. We also believe that price and product delivery are always important considerations for our customers. In general, most customers prefer to standardize data acquisition systems, geophones and hydrophones, particularly if they are used by seismic companies which have multiple crews which are able to support each other. This standardization makes it difficult for competitive manufacturers to gain market share from other manufacturers with existing customer relationships.
As mentioned above, a key factor for seismic instruments and equipment manufacturers is durability under harsh field conditions. Instruments and equipment must meet not only rigorous technical specifications regarding signal integrity and sensitivity, but must also be extremely rugged and durable to withstand the rigors of field use, often in harsh environments.
We believe our primary competitors for our “wireless” nodal seismic data acquisition systems are SERCEL, Fairfield Industries and INOVA.
With respect to our marine seismic products, we are not aware of any competing companies that manufacture a product functionally similar to our patented seismic streamer retrieval device. We believe our primary competitors in the manufacture of our streamer depth positioning device, or “birds,” are ION and SERCEL.
4
Table of Contents
We believe our primary competitors for our deepwater cabled reservoir characterization and monitoring systems are SERCEL, ION and Petroleum Geo-Services ASA.
We believe our primary competitors for high-definition borehole seismic data acquisition systems are Avalon and SERCEL.
We believe our primary competitors for rental of seismic equipment are Mitcham Industries, Inc. and Seismic Equipment Solutions.
Thermal Solutions Products
We believe that the primary competitors to our thermal imaging business segments include emulsion producers like KIWO USA, Inc. as a distributor of direct-to-screen technologies, Colour Scanned Technology as a manufacturer of direct-to-screen technologies, iSys Group as a manufacturer of thermal technologies for oil and gas exploration applications, as well as manufacturers of alternative technologies such as inkjet devices distributed and used for film output. A key competitive factor in this market is producing equipment that is technologically advanced, yet cost effective.
Suppliers
We produce our own brand of dry thermal film internally. We also purchase a substantial quantity of dry thermal film manufactured by Agfa-Gevaert N.V. (AGFA”). For a discussion of the risks related to our reliance on AGFA, see “Risk Factors – We Rely on a Key Supplier for a Significant Portion of Our Dry Thermal Film.”
We do not currently experience any significant difficulties in obtaining raw materials from our suppliers for the production of our seismic or thermal imaging products.
Product Manufacturing and Assembly
Our manufacturing and product assembly operations consist of machining or molding the necessary component parts, configuring these parts along with components received from various vendors and assembling a final product. We manufacture seismic equipment to the specifications of our customers. For example, we can armor cables for applications such as deepwater uses. We assemble geophone strings and seismic telemetry cables based on a number of customer choices such as length, gauge, tolerance and color of molded parts. With regard to dry thermal film, we mix and react various chemicals to formulate a reactive layer that is then coated onto a clear polyester film. The film is then coated with a protective topcoat that produces the final product. Upon completion of our manufacturing and assembly operations, we test our final products to the functional and, in the case of seismic equipment, environmental extremes of product specifications and inspect the products for quality assurance. We normally manufacture and ship our products based on customer orders and, therefore, typically do not maintain significant inventories of finished goods held for sale.
5
Table of Contents
Markets and Customers
Our principal seismic customers are seismic contractors and major independent and government-owned oil and gas companies that either operate their own seismic crews or specify seismic instrument and equipment preferences to contractors. For our deepwater reservoir characterization products, our customers are generally large international oil and gas companies that operate long-term offshore oil and gas producing properties. Our thermal imaging customers primarily consist of direct users of our equipment as well as specialized resellers that focus on the newsprint, silkscreen and corrugated box printing industries. Two customers comprised 20.2% and 11.1% of our revenues during fiscal year 2011. One customer comprised 13.2% and 12.0% of our revenues during the fiscal years 2010 and 2009, respectively. The following table describes our sales by customer type (in thousands):
| YEAR ENDED SEPTEMBER 30, | ||||||||||||
| 2011 | 2010 | 2009 | ||||||||||
| Seismic exploration customers |
$ | 131,645 | $ | 89,777 | $ | 59,084 | ||||||
| Seismic reservoir customers |
15,968 | 14,600 | 12,020 | |||||||||
| Industrial customers |
11,040 | 10,397 | 7,939 | |||||||||
| Thermal solutions customers |
13,519 | 12,955 | 13,028 | |||||||||
| Other |
798 | 804 | 789 | |||||||||
|
|
|
|
|
|
|
|||||||
| $ | 172,970 | $ | 128,533 | $ | 92,860 | |||||||
|
|
|
|
|
|
|
|||||||
During the last three years, there has been substantial uncertainty in the capital markets and access to credit remains uncertain. Due to these conditions, certain of our customers may curtail their seismic contracting activities which would result in a decrease in demand for our products. Furthermore, certain of our customers could experience an inability to pay suppliers, including us, in the event they are unable to access the capital markets to fund their business operations. These risks are more fully described under the heading “Risk Factors” in this Annual Report on Form 10-K.
Intellectual Property
We seek to protect our intellectual property by means of patents, trademarks, trade secrets and other measures. Although we do not consider any single patent essential to our success, we consider our patents regarding our marine seismic cable retrieval devices to be of particular value to us. These patents are scheduled to expire in 2013 and 2022.
Research and Development
We expect to incur significant future research and development expenditures aimed at the development of additional seismic data acquisition products and thermal imaging technologies. We have incurred company-sponsored research and development expenses of $11.5 million, $9.9 million and $8.1 million during the fiscal years ended September 30, 2011, 2010 and 2009, respectively.
Employees
As of September 30, 2011, we employed approximately 1,008 people predominantly on a full-time basis, of which 602 were employed in the United States and 361 in the Russian Federation. Our employees in the Russian Federation belong to a national union for machine manufacturers. Our remaining employees are not unionized. We have never experienced a work stoppage and consider our relationship with our employees to be satisfactory.
Financial Information by Segment and Geographic Area
For a discussion of financial information by segment and geographic area, see Note 17 to the consolidated financial statements contained in this Annual Report on Form 10-K.
6
Table of Contents
This Annual Report on Form 10-K, along with our Quarterly Reports on Form 10-Q, Current Reports on Form 8-K and amendments to those reports filed or furnished pursuant to Section 13(a) or 15(d) of the Securities Exchange Act of 1934 (the “Exchange Act”), are available free of charge through our website as soon as reasonably practicable after we electronically file such material with, or furnish it to, the Securities and Exchange Commission (“SEC”). Our website address is http://www.oyogeospace.com.
Item 1A. Risk Factors
Risk Factors
Commodity Price Levels May Affect Demand for Our Products
Demand for many of our products and the profitability of our operations depend primarily on the level of worldwide oil and gas exploration activity. Prevailing oil and gas prices and market expectations regarding potential changes in such prices significantly affect the level of worldwide oil and gas exploration activity. During periods of improved energy commodity prices, the capital spending budgets of oil and natural gas operators tend to expand, which results in increased demand for our products. Conversely, in periods when these energy commodity prices deteriorate, capital spending budgets of oil and natural gas operators tend to contract and the demand for our products generally weakens. Historically, the markets for oil and gas have been volatile and are subject to wide fluctuation in response to changes in the supply of and demand for oil and gas, market uncertainty and a variety of additional factors that are beyond our control. These factors include the level of consumer demand, regional and international economic conditions, weather conditions, domestic and foreign governmental regulations, price and availability of alternative fuels, political conditions and hostilities in the Middle East and other significant oil-producing regions, increases and decreases in foreign supply of oil and gas, and the ability of OPEC to set and maintain production levels and prices of foreign imports and overall economic conditions.
Continued effects of the economic recession could lead to a decline in demand for crude oil and natural gas. Further slowdowns in economic activity would likely reduce worldwide demand for energy and result in an extended period of lower crude oil and natural gas prices. Any unexpected material changes in oil and gas prices or other market trends that adversely impact seismic exploration activity would likely affect the demand for our products and could materially and adversely affect our results of operations and liquidity.
Our New Products May Not Achieve Market Acceptance
Our outlook and assumptions are based on various macro-economic factors and internal assessments, and actual market conditions could vary materially from those assumed. In recent years, we have incurred significant expenditures to fund our research and development efforts, and we intend to continue those expenditures in the future. However, research and development is by its nature speculative, and we cannot assure you that these expenditures will result in the development of new products or services or that any new products and services we have developed recently or may develop in the future will be commercially marketable or profitable to us. In particular, we have incurred substantial expenditures to develop our wireless nodal seismic data acquisition systems, as well as other seismic products for reservoir characterization applications. In addition, we try to use some of our capabilities, particularly our cable manufacturing capabilities, to supply products to new markets. Further, we have incurred substantial expense and expended significant effort to develop our thermal solutions products. We cannot assure you that we will realize our expectations regarding acceptance of and revenues generated by our new products and services in existing or new markets.
We May Experience Fluctuations in Quarterly Results of Operations
Historically, the rate of new orders for our products has varied substantially from quarter to quarter. Moreover, we typically operate, and expect to continue to operate, on the basis of orders in-hand for our products before we commence substantial manufacturing “runs.” The short-term nature of our order backlog generally does not allow us to predict with any accuracy demand for our products more than approximately three months in advance. Thus, our ability to replenish orders and the completion of orders, particularly large orders for deepwater reservoir characterization projects, can significantly impact our operating results and cash flow for any quarter, and results of operations for any one quarter may not be indicative of results of operations for future quarters. These periodic fluctuations in our operating results could adversely affect our stock price.
7
Table of Contents
Our Credit Risk Could Increase if Our Customers Face Difficult Economic Circumstances
We believe that our allowances for bad debts are adequate in light of known circumstances. However, we cannot assure you that additional amounts attributable to uncollectible receivables and bad debt write-offs will not have a material adverse effect on our future results of operations. Many of our seismic customers are not well capitalized and as a result cannot always pay our invoices when due. We have in the past incurred write-offs in our accounts receivable due to customer credit problems. We have found it necessary from time to time to extend trade credit, including on promissory notes, to long-term customers and others where some risks of non-payment exist. With the recent global financial crisis and tight commercial credit availability, some of our customers relying on credit markets as the source of funds for their capital spending may experience significant liquidity difficulties, which increase those credit risks. An increase in the level of bad debts and any deterioration in our credit risk could adversely affect the price of our stock. In addition, we rent equipment to our customers that can be utilized in various countries around the world. If our rental customers experienced financial difficulties, it could be difficult or impossible to retrieve our rental equipment from foreign countries.
Our industry is characterized by rapid technological development and product obsolescence
Our instruments and equipment in both of our business segments are constantly undergoing rapid technological improvement. Our future success depends on our ability to continue to:
| • | improve our existing product lines, |
| • | address the increasingly sophisticated needs of our customers, |
| • | maintain a reputation for technological leadership, |
| • | maintain market acceptance of our products, |
| • | anticipate changes in technology and industry standards, |
| • | respond to technological developments on a timely basis, and |
| • | develop new markets for our products and capabilities. |
Current competitors or new market entrants may develop new technologies, products or standards that could render our products obsolete. We cannot assure you that we will be successful in developing and marketing, on a timely and cost effective basis, product enhancements or new products that respond to technological developments, that are accepted in the marketplace or that comply with new industry standards. Additionally, in anticipation of customer product orders, from time to time we acquire substantial quantities of inventories, which if not sold or integrated into products within a reasonable period of time, could become obsolete. We would be required to impair the value of such inventories on our balance sheet.
We Operate in Highly Competitive Markets
The markets for most of our products are highly competitive. Many of our existing and potential competitors have substantially greater marketing, financial and technical resources than we do. Some competitors currently offer a broader range of instruments and equipment for sale than we do and may offer financing arrangements to customers on terms that we may not be able to match. In addition, new competitors may enter the market and competition could intensify. As to our thermal solutions products, we compete with other printing solutions, including inkjet and laser printing technologies, many of which are provided by large companies with significant resources.
We cannot assure you that sales of our products will continue at current volumes or prices if current competitors or new market entrants introduce new products with better features, performance, price or other characteristics than our products. Competitive pressures or other factors may also result in significant price competition that could have a material adverse effect on our results of operations.
8
Table of Contents
We Have a Limited Market for Our Seismic Products
In our seismic business segment, we market our traditional products to seismic service contractors and to large, independent and government-owned oil and gas companies. We estimate that, based on published industry sources, fewer than 50 seismic contracting companies are currently operating worldwide (excluding those operating in the Russian Federation and the former Soviet Union, India, the People’s Republic of China and certain Eastern European countries, where seismic data acquisition activity is difficult to verify). We estimate that fewer than 20 seismic contractors are engaged in marine seismic exploration. Due to these market factors, a relatively small number of customers, some of whom are experiencing financial difficulties, have accounted for most of our sales. From time to time these seismic contractors have sought to vertically integrate and acquire our competitors, which has influenced their supplier decisions before and after such transactions. The loss of a small number of these customers could materially and adversely impact sales of our seismic products.
We Cannot Be Certain of the Effectiveness of Patent Protection
We hold and from time to time apply for certain patents relating to some of our seismic data acquisition and other products. We also own several patents which relate to the development of dry thermal film. We cannot assure you that our patents will prove enforceable or free of challenge, that any patents will be issued for which we have applied or that competitors will not develop functionally similar technology outside the protection of any patents we have or may obtain.
Our Foreign Subsidiaries and Foreign Marketing Efforts Face Additional Risks and Difficulties
Based on customer billing data, net sales outside the United States accounted for approximately 46.6% of our net sales during fiscal year 2011; however, we believe the percentage of sales outside the United States is much higher as many of our products are first delivered to a domestic location and ultimately shipped to a foreign location. We again expect net sales outside of the United States to represent a substantial portion of our net sales for fiscal year 2012 and subsequent years.
Foreign sales are subject to special risks inherent in doing business outside of the United States, including the risk of war, terrorist activities, civil disturbances, embargo and government activities and foreign attitudes about conducting business activities with the United States, restrictions of the movement and exchange of funds, inhibitions of our ability to collect accounts receivable, international sanctions, expropriation and nationalization of our assets or those of our customers, currency fluctuations, devaluations and conversion restrictions, confiscatory taxation or other adverse tax policies and governmental actions that may result in the deprivation of our contractual rights, all of which may disrupt markets or our operations.
A portion of our manufacturing is conducted through our subsidiary OYO-GEO Impulse, which is based in the Russian Federation. Our business could be directly affected by political and economic conditions in the Russian Federation. Boycotts, protests, governmental sanctions and other actions in the region could adversely affect our ability to operate profitably. The risk of doing business in the Russian Federation and other economically or politically volatile areas could adversely affect our operations and earnings. Foreign sales are also generally subject to the risk of compliance with additional laws, including tariff regulations and import and export restrictions. Sales in certain foreign countries require prior U.S. government approval in the form of an export license. We cannot assure you that we will not experience difficulties in connection with future foreign sales. Also due to foreign laws and restrictions, should we experience substantial growth in certain foreign markets, for example in the Russian Federation, we may not be able to transfer cash balances to the United States to assist with debt servicing or other obligations.
Our subsidiaries in the Russian Federation and in Canada together reported operating losses of $1.3 million and $3.3 million, respectively, for fiscal years 2010 and 2009 primarily due to difficult seismic market conditions. These market conditions are influenced by macro-economic conditions such as the world-wide economic crisis, credit availability, crude oil and natural gas commodity price volatility and other factors impacting world-wide energy exploration activities. In addition, other factors contributed to these difficult conditions such as high tax regimes, the over-supply of natural gas as recently seen in North America, intense competitive pricing pressures,
9
Table of Contents
and reduced demand by our Houston-based operations for products manufactured by our Russian subsidiary. We cannot assure you that these conditions will improve in the near term or that these subsidiaries will not experience these difficult market conditions again in the future, and these subsidiaries may generate future operating losses, asset impairments charges, or closure if we are unable to stabilize their operations.
Unfavorable Currency Exchange Rate Fluctuations Could Adversely Affect Our Results of Operations
Substantially all of our sales from the United States are made in U.S. dollars, though from time to time we may make sales in foreign currencies. As a result, we may be subject to foreign currency fluctuations on our sales. The reporting currency for our financial statements is the U.S. dollar. However, the assets, liabilities, revenues and costs of our Russian, Canadian and United Kingdom subsidiaries are denominated in currencies other than U.S. dollars. To prepare our consolidated financial statements, we must translate those assets, liabilities, revenues and expenses into U.S. dollars at then-applicable exchange rates. Consequently, increases and decreases in the value of the U.S. dollar versus these other currencies will affect the amount of these items in our consolidated financial statements, even if their value has not changed in their original currency. These translations could result in significant changes to our results of operations from period to period. For the fiscal year ended September 30, 2011, approximately 9.1% of our consolidated revenues related to the operations of our foreign subsidiaries.
We Have a Relatively Small Public Float, and Our Stock Price May be Volatile
We have approximately 4.7 million shares outstanding held by non-affiliates. This small float results in a relatively illiquid market for our common stock. Our daily trading volume for the year ended September 30, 2011 averaged approximately 55,000 shares. Our small float and daily trading volumes have in the past caused, and may in the future result in, significant volatility in our stock price.
We Rely on a Key Supplier for a Significant Portion of Our Dry Thermal Film
While we currently manufacture dry thermal film, we also purchase a large quantity of dry thermal film from a European manufacturer through its distributor in the United Kingdom. Except for the film produced by us and sold to us by this manufacturer/distributor, we know of no other source for dry thermal film that performs well in our thermal imaging equipment. If we are unable to economically manufacture dry thermal film internally or the European manufacturer/distributor we rely on were to discontinue producing dry thermal film, were to become unwilling to contract with us on competitive terms or were unable to supply dry thermal film in sufficient quantities to meet our requirements, our ability to compete in the thermal imaging marketplace could be impaired, which could adversely affect our financial performance.
Our Success Depends Upon a Limited Number of Key Personnel
Our success depends on attracting and retaining highly skilled professionals. A number of our employees are highly skilled engineers and other professionals. In addition, our success depends to a significant extent upon the abilities and efforts of the members of our senior management. If we fail to continue to attract and retain such professionals, our ability to compete in the industry could be adversely affected.
A General Downturn in the Economy in Future Periods May Adversely Affect Our Business
The recent downturn in the economy, and any economic slowdown in future periods, could adversely affect our business in ways that we cannot predict. During times of economic slowdown, our customers may reduce their capital expenditures and defer or cancel pending projects. Such developments occur even among customers that are not experiencing financial difficulties. Any economic downturn may adversely affect the demand for oil and gas generally or cause volatility in oil and gas commodity prices and, therefore, adversely affect the demand for our services to the oil and gas industry and related service and equipment. It could also adversely affect the demand for consumer products, which could in turn adversely affect our thermal solutions business. To the extent these factors adversely affect other seismic companies in the industry, there could be an oversupply of products and services and downward pressure on pricing for seismic products and services, which could adversely affect us. Additionally, bankruptcies or financial difficulties among our customers could reduce our cash flows and adversely impact our liquidity and profitability.
10
Table of Contents
Global Capital and Credit Market Issues Could Negatively Affect Our Liquidity and Increase Our Costs of Borrowing
United States and global credit markets have recently experienced significant dislocations and liquidity disruptions which have caused the spreads on prospective debt refinancings to widen considerably. These circumstances materially impacted liquidity in the debt markets, making financing terms for borrowers less attractive, and in certain cases have resulted in the unavailability of certain types of debt financing. Events affecting the credit markets have also had an adverse effect on other financial markets in the United States, which may make it more difficult or costly in the future for us to borrow additional funds. Our business could also be negatively impacted if our suppliers or customers experience disruptions resulting from tighter capital and credit markets or a slowdown in the general economy. Any of these risks could increase our interest expense, or impair our ability to fund our operations or expand our business, which could have a material adverse effect on our financial results.
We Have a Minimal Disaster Recovery Program at the Pinemont Facility
Due to its proximity to the Texas Gulf Coast, our Pinemont facility is annually subject to the threat of hurricanes, and the aftermath that follows. Hurricanes may cause, among other types of damage, the loss of electrical power for extended periods of time. If we lost electrical power at the Pinemont facility, or if a fire or other natural disaster occurred, we would be unable to continue our manufacturing operations during the power outage because we do not own a generator or any other back-up power source large enough to provide for our manufacturing power consumption needs. We have a back-up generator to provide power for our information technology operations. Although we store our back-up data offsite, we do not maintain an alternative facility to run our information technology operations. Additionally, we do not have an alternative manufacturing or operating location in the United States. A significant disruption in our manufacturing and information technology operations could materially and adversely affect our business operations during an extended period of a power outage, fire or other natural disaster.
The Credit Agreement Imposes Restrictions on Our Business
We and several of our subsidiaries are parties to a credit agreement with a bank. The credit agreement contains covenants and requires maintenance of certain financial ratios and tests, which impose restrictions on our business and on the business of our guarantor-subsidiaries. We currently believe that the most restrictive covenant in the credit agreement is the consolidated cash flow coverage ratio. Our ability to comply with these restrictions may be affected by events beyond our control, including, but not limited to, prevailing economic, financial and industry conditions and continuing declines in our sales of products. The breach of any of these covenants or restrictions, as well as any failure to make a payment of interest or principal when due, could result in a default under the credit agreement. Such a default would permit our lender to declare amounts borrowed from it to be due and payable, together with accrued and unpaid interest, and the ability to borrow under the credit agreement could be terminated. If we are unable to repay debt to our lender, the lender could proceed against the collateral securing that debt. While we intend to seek alternative sources of cash in such a situation, there is no guarantee that any alternative cash source would be available, or would be available on terms favorable to us.
We Have Been Subject to Control by a Principal Stockholder
At September 30, 2011, OYO Corporation owned indirectly in the aggregate approximately 20.3% of our common stock. Accordingly, OYO Corporation, through its wholly owned subsidiary OYO Corporation U.S.A., is able to exercise substantial influence over our management, operations and affairs. In addition, we currently have, and may continue to have, a variety of contractual relationships with OYO Corporation and its affiliates. These relationships could further enable OYO Corporation to indirectly exert substantial influence on our operations.
11
Table of Contents
Item 1B. Unresolved Staff Comments
None.
Item 2. Properties
As of September 30, 2011, our operations included the following locations:
| Location |
Owned/Leased | Approximate Square Footage |
Use | |||||
| Houston, Texas |
Owned | 387,000 | See Note 1 below | |||||
| Houston, Texas |
Owned | 77,000 | See Note 2 below | |||||
| Ufa, Bashkortostan, Russia |
Owned | 120,000 | Manufacturing, sales and service | |||||
| Calgary, Alberta, Canada |
Owned | 45,000 | Manufacturing, sales and service | |||||
| Luton, Bedfordshire, England |
Owned | 8,000 | Sales and service | |||||
| Beijing, China |
Leased | 1,000 | Sales and service | |||||
We believe that our facilities are adequate for our current and immediately projected needs.
| (1) | This property is located at 7007 Pinemont Drive in Houston, Texas (the “Pinemont facility”). The Pinemont facility contains all manufacturing, engineering, selling, marketing and administrative activities for both the seismic and thermal solution segment of our company in the United States. The Pinemont facility also serves as our company headquarters. |
| (2) | This property, located at 7334 N. Gessner in Houston, Texas (the “Gessner facility”), previously contained a manufacturing operation and certain support functions. In February 2006, we entered into a seven-year lease with a tenant whereby the tenant agreed to lease portions of the building up to August 15, 2008, and to lease the entire building from August 16, 2008 through February 14, 2013. The lease agreement was amended in 2009 to allow the tenant the option to lease the entire building through July 31, 2020. |
Item 3. Legal Proceedings
From time to time we are a party to what we believe is routine litigation and proceedings that may be considered as part of the ordinary course of our business.
On July 8, 2009, we received a complaint filed in the United States District Court in Nevada alleging that the Geospace Seismic Recorder (“GSR”), our newly developed wireless data acquisition system, infringes a patent held by Ascend Geo, LLC (“Ascend”). We requested and were granted a change in venue to the United States District Court for the Southern District of Texas in Houston (the “Court”). In addition to monetary damages, Ascend requested a preliminary injunction against future sales by us of the GSR nodal system. We filed our response with the Court requesting that it deny Ascend’s request for a preliminary injunction and, on November 4, 2009, the Court denied Ascend’s request for a preliminary injunction. On January 4, 2011, the Court dismissed Ascend’s case with prejudice. On April 5, 2011, the U.S. Patent and Trademark Office cancelled all claims of Ascend’s patent.
12
Table of Contents
PART II
Item 5. Market for Registrant’s Common Equity and Related Stockholder Matters
The following graphs compare the performance of the Company’s common stock with the performance of the Russell 2000 index and the Standard & Poor’s Oil & Gas Equipment and Services index as of each of the dates indicated.
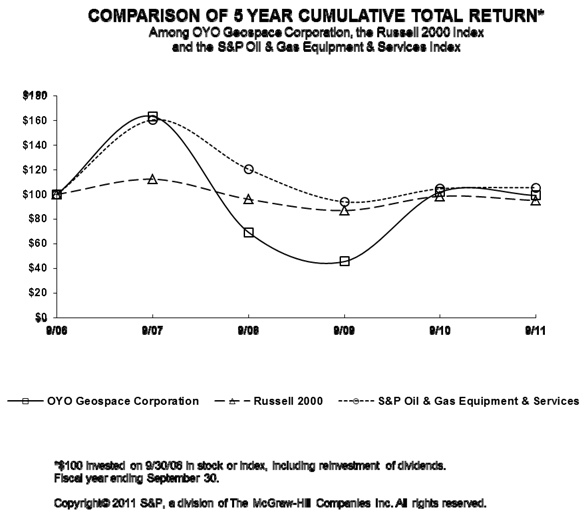
The graph assumes $100 invested on September 30, 2006 (a) in the Company’s common stock, (b) in the stocks comprising the Russell 2000 index on that day and (c) in the stocks comprising the Standard & Poor’s Oil & Gas Equipment and Services index on that day. Reinvestment of all dividends on stocks comprising the two indices is assumed. The foregoing graphs are based on historical data and are not necessarily indicative of future performance. These graphs shall not be deemed to be “soliciting material” or to be “filed” with the Securities and Exchange Commission or subject to the Regulations of 14A or 14C under the Exchange Act or to the liabilities of Section 18 of the Exchange Act.
Our common stock is quoted on The NASDAQ Global Market under the symbol “OYOG”. On December 5, 2011, there were approximately 17 holders of record of our common stock, and the closing price per share on such date was $87.22 as quoted by The NASDAQ Global Market.
13
Table of Contents
The following table shows the high and low per share sales prices for our common stock reported on The NASDAQ Global Market.
| Low | High | |||||||
| Year Ended September 30, 2011: |
||||||||
| Fourth Quarter |
$ | 55.08 | $ | 107.25 | ||||
| Third Quarter |
82.01 | 100.62 | ||||||
| Second Quarter |
84.33 | 109.99 | ||||||
| First Quarter |
58.00 | 100.30 | ||||||
| Year Ended September 30, 2010: |
||||||||
| Fourth Quarter |
$ | 45.17 | $ | 58.40 | ||||
| Third Quarter |
41.23 | 55.47 | ||||||
| Second Quarter |
33.85 | 50.47 | ||||||
| First Quarter |
23.02 | 43.70 | ||||||
Since our initial public offering in 1997, we have not paid dividends, and we do not intend to pay cash dividends on our common stock in the foreseeable future. We presently intend to retain our earnings for use in our business, with any future decision to pay cash dividends dependent upon our growth, profitability, financial condition and other factors our Board of Directors may deem relevant. Our existing credit agreement also has covenants that materially limit our ability to pay dividends. For a discussion of our credit agreement, see the section entitled “Management’s Discussion and Analysis of Financial Condition and Results of Operation – Liquidity and Capital Resources” contained in this Annual Report on Form 10-K.
The following equity plan information is provided as of September 30, 2011:
Equity Compensation Plan Information
| Plan Category | Number of Securities to be (a) |
Weighted-average Exercise Price of Outstanding Options, Warrants and Rights (b) |
Number of Securities (c) |
|||||||||
| Equity Compensation Plans Approved by Security Holders (1) |
172,400 | $ | 27.69 | 137,896 | ||||||||
| Equity Compensation Plans Not Approved by Security Holders |
400 | $ | 39.22 | 19,000 | ||||||||
| (1) | The securities are to be issued pursuant to the Company’s 1999 Broad-Based Option Plan. A description of such plan is provided in Note 11 to the consolidated financial statements contained in this Annual Report on Form 10-K. |
14
Table of Contents
Item 6. Selected Consolidated Financial Data
The following table sets forth certain selected historical financial data on a consolidated basis. We have derived the selected consolidated financial information as of September 30, 2011 and 2010 and for fiscal years 2011, 2010 and 2009 from our audited consolidated financial statements appearing elsewhere in this Annual Report on Form 10-K. We have derived the selected consolidated financial information as of September 30, 2009, 2008 and 2007 and for fiscal years 2008 and 2007 from audited consolidated formation not included herein. The selected consolidated financial data should be read in conjunction with “Management’s Discussion and Analysis of Financial Condition and Results of Operations” in item 7 and our consolidated financial statements appearing elsewhere in this Annual Report on Form 10-K. When reviewing the table below, please also note the recent transactions and new accounting pronouncements described in the section entitled “Management’s Discussion and Analysis of Financial Condition and Results of Operations – Critical Accounting Policies”, contained in this Annual Report on Form 10-K.
| Year Ended September 30, | ||||||||||||||||||||
| 2011 | 2010 | 2009 | 2008 | 2007 | ||||||||||||||||
| (in thousands, except share and per share amounts) | ||||||||||||||||||||
| Statement of Operations Data: |
||||||||||||||||||||
| Sales |
$ | 172,970 | $ | 128,533 | $ | 92,860 | $ | 134,495 | $ | 138,106 | ||||||||||
| Cost of sales |
98,857 | 81,177 | 66,287 | 87,441 | 87,587 | |||||||||||||||
|
|
|
|
|
|
|
|
|
|
|
|||||||||||
| Gross profit |
74,113 | 47,356 | 26,573 | 47,054 | 50,519 | |||||||||||||||
| Operating expenses: |
||||||||||||||||||||
| Selling, general and administrative |
18,051 | 16,618 | 14,572 | 16,913 | 16,492 | |||||||||||||||
| Research and development |
11,529 | 9,925 | 8,062 | 8,945 | 7,327 | |||||||||||||||
| Bad debt expense (recovery) |
128 | (479 | ) | 318 | 1,615 | 236 | ||||||||||||||
|
|
|
|
|
|
|
|
|
|
|
|||||||||||
| Total operating expenses |
29,708 | 26,064 | 22,952 | 27,473 | 24,055 | |||||||||||||||
|
|
|
|
|
|
|
|
|
|
|
|||||||||||
| Gain (loss) on disposal of equipment |
— | (184 | ) | (12 | ) | 604 | 1,655 | |||||||||||||
|
|
|
|
|
|
|
|
|
|
|
|||||||||||
| Income from operations |
44,405 | 21,108 | 3,609 | 20,185 | 28,119 | |||||||||||||||
| Other income (expense), net |
214 | (206 | ) | (298 | ) | 233 | 118 | |||||||||||||
|
|
|
|
|
|
|
|
|
|
|
|||||||||||
| Income before income taxes |
44,619 | 20,902 | 3,311 | 20,418 | 28,237 | |||||||||||||||
| Income tax expense |
14,908 | 6,820 | 1,551 | 6,266 | 8,638 | |||||||||||||||
|
|
|
|
|
|
|
|
|
|
|
|||||||||||
| Net income |
$ | 29,711 | $ | 14,082 | $ | 1,760 | $ | 14,152 | $ | 19,599 | ||||||||||
|
|
|
|
|
|
|
|
|
|
|
|||||||||||
| Net income per share: |
||||||||||||||||||||
| Basic |
$ | 4.78 | $ | 2.33 | $ | 0.30 | $ | 2.40 | $ | 3.38 | ||||||||||
|
|
|
|
|
|
|
|
|
|
|
|||||||||||
| Diluted |
$ | 4.73 | $ | 2.27 | $ | 0.29 | $ | 2.31 | $ | 3.23 | ||||||||||
|
|
|
|
|
|
|
|
|
|
|
|||||||||||
| Weighted average shares outstanding: |
||||||||||||||||||||
| Basic |
6,220,657 | 6,031,314 | 5,950,403 | 5,908,727 | 5,793,840 | |||||||||||||||
| Diluted |
6,286,324 | 6,193,018 | 6,079,378 | 6,116,039 | 6,063,446 | |||||||||||||||
| Other Financial Data: |
||||||||||||||||||||
| Depreciation, amortization and stock-based compensation |
$ | 7,783 | $ | 5,629 | $ | 5,472 | $ | 4,598 | $ | 3,912 | ||||||||||
| Capital expenditures |
20,144 | 6,117 | 1,709 | 9,796 | 17,007 | |||||||||||||||
| As of September 30, | ||||||||||||||||||||
| 2011 | 2010 | 2009 | 2008 | 2007 | ||||||||||||||||
| (in thousands) | ||||||||||||||||||||
| Balance Sheet Data: |
||||||||||||||||||||
| Working capital |
$ | 124,900 | $ | 91,577 | $ | 82,842 | $ | 82,475 | $ | 60,329 | ||||||||||
| Total assets |
196,801 | 163,496 | 141,482 | 159,380 | 128,162 | |||||||||||||||
| Short-term debt |
— | 440 | 728 | 709 | 322 | |||||||||||||||
| Long-term debt |
— | 7,260 | 8,820 | 19,526 | 5,147 | |||||||||||||||
| Stockholders’ equity |
177,013 | 136,586 | 118,658 | 117,363 | 102,370 | |||||||||||||||
We did not declare or pay any dividends during any of the periods noted in the above tables.
15
Table of Contents
Item 7. Management’s Discussion and Analysis of Financial Condition and Results of Operations
The following is management’s discussion and analysis of the major elements of our consolidated financial statements. You should read this discussion and analysis together with our consolidated financial statements, including the accompanying notes, and other detailed information appearing elsewhere in this Annual Report on Form 10-K, including under the heading “Risk Factors”. The discussion of our financial condition and results of operations includes various forward-looking statements about our markets, the demand for our products and services and our future plans and results. These statements are based on assumptions that we consider to be reasonable, but that could prove to be incorrect. For more information regarding our assumptions, you should refer to the section entitled “—Forward-Looking Statements and Assumptions” contained in this Item 7 in this Annual Report on Form 10-K.
Background
We design and manufacture instruments and equipment used in the acquisition and processing of seismic data as well as in the characterization and monitoring of producing oil and gas reservoirs. We have been in the seismic instrument and equipment business since 1980 and market our products primarily to the oil and gas industry. We also design, manufacture and distribute thermal imaging equipment and thermal media products targeted at the screen print, point of sale, signage and textile market sectors. We have been manufacturing thermal imaging products in our Thermal Solutions segment since 1995. For a more detailed discussion of our business segments and products, see the information under the heading “Business” in this Annual Report on Form 10-K.
Worldwide Economic Slowdown
Demand for many of our products depends primarily on the level of worldwide oil and gas exploration activity. That activity, in turn, depends primarily on prevailing oil and gas prices and availability of seismic data. Despite signs of economic recovery in 2010 and 2011, sovereign debt issues in Europe and slower economic growth in the U.S. and China have renewed the uncertainty of the global economy and may, in turn, cause energy commodity prices to decline.
We saw a strong recovery in the demand for some of our products in fiscal year 2011. However, we remain cautious regarding the future and we continue to monitor the impact that these economic conditions may have on our operations. We believe that our current cash balances, cash flow from operations and cash borrowings available under our credit facility will provide sufficient resources to meet our working capital liquidity needs for the next twelve months.
Consolidated Results of Operations
The economic slowdown adversely affected our product revenues in fiscal year 2009. In fiscal year 2009, we experienced declines in almost every major product category in each of our business segments. In fiscal year 2010 and again in fiscal year 2011 product revenues increased from the previous year in most product categories. We have not sold any large-scale seabed reservoir characterization systems since fiscal year 2007, although a smaller seabed system was sold in fiscal year 2010. These reservoir characterization products generally have higher profit margins than our traditional seismic exploration products.
As we have reported in the past, our sales and operating profits have varied significantly from quarter-to-quarter, and even year-to-year, and are expected to continue that trend in the future, especially when our quarterly financial results are impacted by the presence or absence of relatively large, but somewhat erratic, shipments of seismic seabed, borehole reservoir characterization systems and/or wireless data acquisition systems. At present, we do not have any large orders for seabed reservoir characterization products in our backlog, although we remain optimistic about on-going discussions with customers concerning these products. The quote-to-contract time for large permanent and retrievable seabed seismic data acquisition systems is generally quite long, and since these sales are not recognized in our financial statements until the products are shipped and/or accepted by our customer, the exact timing of any future sales can dramatically affect our quarterly results.
16
Table of Contents
In fiscal years 2010 and 2009, our subsidiaries located in the Russian Federation and in Canada experienced significant declines in sales and, together, generated operating losses of $1.3 million and $3.3 million, respectively. The difficult seismic market conditions in the Russian Federation resulted from a decline in oil exploration activities precipitated in part by the severe drop in crude oil commodity prices (relative to prices in prior years) and a higher federal tax imposed upon Russian producers of crude oil for export. In addition, our Houston-based manufacturing operation significantly reduced the purchase of products manufactured by our Russian subsidiary in an effort to stabilize and eventually reduce our consolidated inventory levels. The resulting low factory utilization, combined with intense competition for declining seismic product orders in the Russian market, contributed to the poor financial results of our Russian subsidiary during fiscal years 2010 and 2009. In regards to our subsidiary in Canada, high levels of natural gas storage and low natural gas demand in North America significantly reduced natural gas-oriented seismic exploration activities both in the United States and in Canada, resulting in low levels of product sales and the under-utilization of our seismic rental equipment. The lower level of sales recorded by our Canadian subsidiary in 2010 and 2009 was not adequate to offset fixed costs associated with rental equipment depreciation and facility utilization as well as general overhead costs. While both the Russian and Canadian subsidiaries experienced significant revenue increases during fiscal year 2011, the Russian subsidiary reported an operating loss of $0.4 million in fiscal year 2011 and continues to face intense pricing competition for product sales to its Russian and CIS customers. We are working closely with the Russian management team to address these issues in an effort to return this operation to profitability.
We report and evaluate financial information for two segments: Seismic and Thermal Solutions. Summary financial data by business segment follows (in thousands):
| Year Ended September 30, | ||||||||||||
| 2011 | 2010 | 2009 | ||||||||||
| Seismic |
||||||||||||
| Exploration product sales |
$ | 131,645 | $ | 89,777 | $ | 59,084 | ||||||
| Reservoir product sales and services |
15,968 | 14,600 | 12,020 | |||||||||
| Industrial product sales |
11,040 | 10,397 | 7,939 | |||||||||
|
|
|
|
|
|
|
|||||||
| Total seismic sales |
158,653 | 114,774 | 79,043 | |||||||||
| Operating income |
53,477 | 28,955 | 10,591 | |||||||||
| Thermal Solutions |
||||||||||||
| Sales |
13,519 | 12,955 | 13,028 | |||||||||
| Operating income (loss) |
(37 | ) | 397 | 370 | ||||||||
| Corporate |
||||||||||||
| Sales |
798 | 804 | 789 | |||||||||
| Operating loss |
(9,035 | ) | (8,244 | ) | (7,352 | ) | ||||||
| Consolidated Totals |
||||||||||||
| Sales |
172,970 | 128,533 | 92,860 | |||||||||
| Operating income |
44,405 | 21,108 | 3,609 | |||||||||
Overview
Fiscal Year 2011 Compared to Fiscal Year 2010
Consolidated net sales for fiscal year 2011 increased $44.4 million, or 34.6%, from fiscal year 2010. The higher level of sales resulted from increased customer demand for our seismic products and particularly robust demand for sales and rentals of our land-based wireless (or nodal) data acquisition systems. The increased demand for our seismic products is being driven by strong oil and gas exploration activities throughout the world.
17
Table of Contents
Consolidated gross profits for fiscal year 2011 increased by $26.8 million, or 56.5%, from fiscal year 2010. The increase in gross profits resulted from (i) increased sales and rentals of seismic products, (ii) a more favorable product mix, and (iii) improved manufacturing productivity due to higher production output.
Consolidated operating expenses for fiscal year 2011 increased $3.6 million, or 14.0%, from fiscal year 2010. The increase in operating expenses resulted from (i) increased pretax earnings giving rise to $0.5 million of increased incentive compensation expenses, (ii) increased product development expenditures of $1.2 million relating to product enhancements and new product introductions, and (iii) a general increase in expenses associated with increased sales activities.
The U.S. statutory tax rate applicable to us for fiscal years 2011 and 2010 was 35.0%; however, our effective tax rate was 33.4% and 32.6% for fiscal years 2011 and 2010, respectively. The lower effective tax rate in fiscal year 2011 resulted from (i) the impact of the manufacturers’/producers’ deduction available in the United States and (ii) an increase in research and experimentation tax credits resulting from United States Congress’ renewal and extension of the tax credit program during fiscal year 2011 through December 2012. The lower effective tax rate in fiscal year 2010 resulted from (i) the impact of the manufacturers’/producers’ deduction available in the United States, (ii) a revaluation of our United States net deferred tax assets from 34.0% to 35.0%, (iii) the revaluation of a tax loss carryback for our Canadian subsidiary, and (iv) a reduction in our contingent tax expenses.
Fiscal Year 2010 Compared to Fiscal Year 2009
Consolidated net sales for fiscal year 2010 increased $35.7 million, or 38.4%, from fiscal year 2009. The higher level of sales stems from the increase in customer demand for our seismic products and particularly robust demand for our land-based wireless (or nodal) data acquisition systems. The increased demand for our seismic products in fiscal year 2010 was driven by higher crude oil commodity prices and increased natural gas exploration activities in North America.
Consolidated gross profits for fiscal year 2010 increased by $20.8 million, or 78.2%, from fiscal year 2009. The increase in gross profits was caused by an increase in sales of our products, improved factory utilization and a favorable product mix.
Consolidated operating expenses for fiscal year 2010 increased $3.1 million, or 13.6%, from fiscal year 2009. Increased operating expenses primarily resulted from a $2.3 million increase of incentive compensation resulting from higher consolidated pretax profits, and general expense increases due to higher sales volume. These operating expense increases were partially offset by lower bad debt expenses resulting from improved collection of our outstanding accounts receivable.
The U.S. statutory tax rate applicable to us for fiscal years 2010 and 2009 was 35.0% and 34.0%, respectively; however, our effective tax rate was 32.6% and 46.8% for fiscal years 2010 and 2009, respectively. The lower effective tax rate in fiscal year 2010 resulted from (i) the impact of the manufacturers’/producers’ deduction available in the United States, (ii) a revaluation of our United States net deferred tax assets from 34.0% to 35.0%, (iii) the revaluation of a tax loss carryback for our Canadian subsidiary, and (iv) a reduction in our contingent tax expenses. The United States Congress had not extended the provision for research and experimentation credits beyond calendar year 2009; therefore, the Company had not recorded any related tax benefit of such credits beyond its first quarter ended December 31, 2009. The higher effective tax rate for fiscal year 2009 resulted primarily from pretax losses in foreign taxing jurisdictions having lower statutory tax rates than the U.S. statutory rate.
18
Table of Contents
Segment Results of Operations
Seismic Products
Fiscal Year 2011 Compared to Fiscal Year 2010
Net Sales. Sales of our seismic products for fiscal year 2011 increased $43.9 million, or 38.2%, from fiscal year 2010. The increase in our seismic product sales is due to (i) robust demand for sales and rentals of our wireless data acquisition systems, (ii) increased demand for most of our other seismic products, including higher margin marine and reservoir products, and (iii) improving market conditions in Canada and the Russian Federation.
Operating Income. Operating income for fiscal year 2011 increased $24.5 million, or 84.7%, from fiscal year 2010. The higher operating income resulted primarily from increased product sales and equipment rentals, improved factory productivity, and a more favorable product mix. These improvements in our operating income were partially offset by (i) additional charges for inventory obsolescence due to the aging of certain of our inventories, (ii) increased incentive compensation expenses due to a higher level of pretax income, and (iii) operating losses at our subsidiary in the Russian Federation due to competitive pricing pressures in its local market.
Fiscal Year 2010 Compared to Fiscal Year 2009
Net Sales. Sales of our seismic products for fiscal year 2010 increased $35.7 million, or 45.2%, from fiscal year 2009. The increase in sales is due to a higher demand for most of our seismic products caused by increased oil and gas exploration activities worldwide. In addition, we experienced robust demand for our land-based wireless (or nodal) data acquisition system.
Operating Income. Operating income from sales of our seismic products for fiscal year 2010 increased $18.4 million, or 173.4%, from fiscal year 2009. The higher operating income is directly related to (i) improved product sales and product mix, (ii) higher factory utilization resulting from increased manufacturing activities, (iii) improved operating results from our subsidiary in the Russian Federation, and (iv) the leveraging of fixed operating expenses over a greater volume of revenues.
Thermal Solutions Products
Fiscal Year 2011 Compared to Fiscal Year 2010
Net Sales. Sales of our thermal solutions products for fiscal year 2011 increased $0.6 million, or 4.4%, from fiscal year 2010. Approximately $0.3 million of this increase resulted from growing sales to our Canadian customers. We consider the remaining increase to be somewhat normal due to recurring fluctuations in product sales volume and not associated with any long-term trend.
Operating Income. Our operating income from our thermal solutions products for fiscal year 2011 decreased $0.4 million, or 109.3%, from fiscal year 2010. The decline in profitability resulted from (i) lower margins on product sales due to higher material costs for our film products, (ii) additional charges for inventory obsolescence expense due to the aging of certain inventories, and (iii) increased incentive compensation expenses relative to the improvement in our consolidated financial results.
Fiscal Year 2010 Compared to Fiscal Year 2009
Net Sales. Sales of our thermal solutions products for fiscal year 2010 decreased $73,000, or 0.6%, from fiscal year 2009. We consider this small decrease to be somewhat normal due to recurring fluctuations in product sales volume and not associated with any long-term trend.
Operating Income. Our operating income from our thermal solutions products for fiscal year 2010 increased $27,000, or 7.3%, from fiscal year 2009. The increase in operating income is caused by increased production efficiencies.
Incentive Compensation Program
We adopted an incentive compensation program for fiscal year 2011 whereby most employees will be eligible to begin earning incentive compensation if the Company reaches a five percent pretax return on stockholders’ equity, determined as of September 30, 2010. To be eligible to participate in this incentive
19
Table of Contents
compensation program, employees must participate in our Core Values Program. Based on our experience in prior years, we expect one hundred percent of our eligible employees to participate in the Core Values Program. The incentive compensation program does not apply to the employees of our subsidiary in the Russian Federation since such employees participate in a locally administered bonus program. Certain non-executive employees are required to achieve specific goals to earn a significant portion of their total incentive compensation award. Any bonus awards earned under this program in fiscal year 2011 will be paid out to eligible employees after the end of the fiscal year.
Upon reaching the five percent threshold under this proposed program, an incentive compensation accrual will be established equal to 14.5 percent of the amount of any consolidated pretax profits above the five percent pretax return threshold. The maximum aggregate bonus available under the program for fiscal year 2011 was originally $3.5 million; however, our board of directors subsequently increased the maximum bonus pool to $4.2 million based on the record earnings of the Company in fiscal year 2011. Under this program as modified, for the fiscal years ended September 30, 2011 and 2010, we had accrued $4.2 million and $3.3 million, respectively, of incentive compensation expense.
Liquidity and Capital Resources
At September 30, 2011, we had $31.4 million in cash and cash equivalents. For fiscal year 2011, we generated approximately $1.1 million of cash in operating activities. Sources of cash generated in our operating activities resulted from net income of $29.7 million. Additional sources of cash included net non-cash charges of $11.8 million for deferred income tax benefit, depreciation, amortization, stock-based compensation, inventory obsolescence and bad debts. Other sources of cash included , (i) a $2.0 million decrease in trade accounts and notes receivable primarily resulting from improved cash receipts from customers during fiscal year 2011, (ii) a $1.8 million increase in accrued expenses and other primarily resulting from an increase of $0.8 million for incentive compensation expenses due to increased consolidated pretax earnings, and a $0.7 million increase in warranty accruals due to increased potential warranty exposure resulting from increased product sales, and (iii) a $1.2 million increase in accounts payable due to increased purchases of raw materials. These sources of cash were offset by (i) a $29.5 million increase in inventories due to the replenishment of low levels of our wireless data acquisition system inventories, and increasing levels of work-in-process resulting from product orders and anticipated demand for wireless data acquisition system sales and rentals, (ii) a $11.2 million adjustment to transfer gross profits from rental equipment sales to investing activities since such transactions involve the sale of long-lived assets, (iii) a $2.5 million increase in other current assets resulting from the advanced payment of income taxes in certain tax jurisdictions, (iv) a $1.7 million decrease in income tax payable resulting from the payment of income taxes owed on our pretax profits and (v) a $0.6 million decrease in deferred revenue resulting from a reduction in the amount of advanced payments received from our customers.
Throughout fiscal years 2009 and 2010, we made substantial efforts to reduce our inventory levels in order to meet declining levels of product demand for our traditional seismic products and to generate cash flows to reduce our indebtedness. Due to the relatively low levels of inventories at the outset of fiscal year 2011 and the significant demand for new products like our wireless data acquisition system and our intention to establish and increase our rental fleet of wireless data acquisition equipment, we have strategically increased certain product inventories to meet this demand. However, we continue to be subject to high levels of inventory obsolescence expense for our older and slower moving products. We continue to give substantial attention to the management of our inventories in this area.
For fiscal year 2011, we used approximately $5.2 million of cash in investing activities. The uses of cash primarily resulted from (i) our investment of $15.4 million for rental equipment, (ii) $4.7 million of capital expenditures for property and equipment, and (iii) a $4.9 million investment in short-term investments. In addition, we transferred $0.2 million of inventories to our rental equipment during fiscal year 2011 which had a non-cash impact. The uses of cash outlined above were partially offset by $19.9 million of proceeds from the sale of used rental equipment. Due to strong customer demand for our wireless rental equipment, we estimate that our capital expenditures for rental equipment in fiscal year 2012 could be approximately $16.0 million or more, including non-cash additions to our used rental fleet. In addition, we estimate that other capital expenditures for property and equipment could be approximately $5.0 million. Similar to fiscal year 2011, in fiscal year 2012 we expect to sell a
significant amount of our rental equipment to customers and, therefore, generate sales proceeds to partially or fully offset such investments in rental equipment. For fiscal year 2012, we expect to finance our capital expenditures in rental equipment and other property and equipment from our cash on hand, internal cash flow, rental equipment sales proceeds and/or from borrowings under our Credit Agreement.
20
Table of Contents
For fiscal year 2011, we generated approximately $2.0 million of cash in the financing activities of our operations. During fiscal year 2011, we generated $9.7 million of proceeds from the exercise of stock options and related tax benefits. Partially offsetting these proceeds was a $7.7 million cash payment to pay off a mortgage loan obligation.
At September 30, 2010, we had $33.5 million in cash and cash equivalents. For fiscal year 2010, we generated approximately $30.0 million of cash from our operating activities. Sources of cash generated in our operating activities include net income of $14.1 million. Additional sources of cash include net non-cash charges of $6.6 million for deferred income tax expense, depreciation, amortization, stock-based compensation, inventory obsolescence and bad debts. Other sources of cash included (i) a $6.7 million decrease in inventories due to improved management activities, (ii) a $5.0 million increase in accrued expenses primarily resulting from higher incentive compensation costs resulting from higher levels of pretax income and (iii) a $1.9 million increase in income taxes payable primarily resulting from the increase in taxable income. These sources of cash were offset by (i) a $2.7 million increase in accounts and notes receivable resulting from higher levels of sales, (ii) a $0.9 million decrease in accounts payable due to increases in purchases of raw materials and (iii) a $0.9 million decrease in prepaid expenses and other resulting from the timing of funding our payrolls.
For fiscal year 2010, we used approximately $6.1 million of cash in investing activities primarily resulting from our capital expenditures for rental equipment. In addition, we transferred $0.3 million of inventories to our rental equipment during fiscal year 2010 which had a non-cash impact.
For fiscal year 2010, we generated approximately $1.3 million of cash in the financing activities of our operations. Sources of cash included $3.3 million of proceeds from the exercise of stock options and related tax benefits. These sources of cash were offset by $1.8 million of principal payments under mortgage loans and a $0.1 million payment as a penalty for early extinguishment of debt.
At September 30, 2009, we had $8.6 million in cash and cash equivalents. For fiscal year 2009, we generated approximately $17.3 million of cash in operating activities. Sources of cash generated in our operating activities resulted from net income of $1.8 million. Additional sources of cash include net non-cash charges of $7.5 million for deferred income tax expense, depreciation, amortization, stock-based compensation, inventory obsolescence and bad debts. Other sources of cash included a $14.3 million decrease in accounts and notes receivable due to improved collections and lower levels of product sales, and a $3.2 million decrease in inventories. These sources of cash were offset by (i) a $4.2 million decrease in accrued expenses primarily resulting from a decline in payroll-related costs due to employee headcount reductions and lower incentive compensation costs resulting from lower levels of pretax income, (ii) a $3.4 million decrease in accounts payable due to declines in purchases of raw materials and other expense reductions and (iii) a $1.4 million decrease in income taxes payable primarily resulting from the decrease in taxable income.
For fiscal year 2009, we used approximately $1.7 million of cash in investing activities resulting from our capital expenditures.
For fiscal year 2009, we used approximately $9.7 million of cash in the financing activities of our operations, resulting from $10.0 million of principal payments under the Credit Agreement and $0.7 million principal payments for our mortgage loans. These uses of cash were offset by $1.0 million of proceeds from the exercise of stock options and related tax benefits.
On March 2, 2011, we entered into a new credit agreement (as amended, the “New Credit Agreement”) with a bank. Under the New Credit Agreement, we can borrow up to $25.0 million principally secured by our accounts receivable, inventories and equipment. In addition, certain of our domestic subsidiaries have guaranteed our obligations under the New Credit Agreement and such subsidiaries have secured the obligations by the pledge
21
Table of Contents
of certain of the assets of such subsidiaries. The New Credit Agreement expires on March 2, 2014. The New Credit Agreement limits the incurrence of additional indebtedness, requires the maintenance of certain financial ratios, restricts us and our subsidiaries’ ability to pay dividends and contains other covenants customary in agreements of this type. The interest rate for borrowings under the New Credit Agreement is a LIBOR based rate with a margin spread of 250-350 basis points depending upon the maintenance of certain ratios. At September 30, 2011, the interest rate was 2.7%. At September 30, 2011, there were no borrowings outstanding under the New Credit Agreement, standby letters of credit outstanding in the amount of $0.2 million and additional borrowings available were $24.8 million. Please see “Risk Factors” for more information about the restrictive covenants imposed on us by the New Credit Agreement.
Prior to entering into the New Credit Agreement, several of our subsidiaries were a party to a credit agreement (the “Previous Credit Agreement”) with a bank, and could borrow up to $25.0 million secured principally by the subsidiaries’ accounts receivable and inventories. The Previous Credit Agreement, as amended, was scheduled to expire on April 30, 2011, however this agreement was terminated on March 2, 2011 and replaced by the New Credit Agreement. Borrowings under the Previous Credit Agreement were subject to borrowing base restrictions based on levels of eligible accounts receivable and inventories. The Previous Credit Agreement limited the incurrence of additional indebtedness, required the maintenance of certain financial amounts, restricted the Company’s and the borrower subsidiaries’ ability to pay dividends and contained other covenants customary in agreements of this type.
Off-Balance Sheet Arrangements
We do not have any obligations which meet the definition of an off-balance sheet arrangement and which have or are reasonably likely to have a current or future effect on our financial statements or the items contained therein that are material to investors.
Critical Accounting Policies
The preparation of financial statements in conformity with accounting principles generally accepted in the United States requires the use of estimates and assumptions that affect the amounts reported in the financial statements and accompanying notes. We consider many factors in selecting appropriate operational and financial accounting policies and controls, and in developing the estimates and assumptions that are used in the preparation of these financial statements. We continually evaluate our estimates, including those related to bad debt reserves, inventory obsolescence reserves, self-insurance reserves for medical expenses, product warranty reserves, intangible assets, stock-based compensation and deferred income tax assets. We base our estimates on historical experience and various other factors, including the impact from the current economic conditions that we believe to be reasonable under the circumstances. Actual results may differ from these estimates under different conditions or assumptions.
Our normal credit terms for trade receivables are 30 days. In certain situations, credit terms for trade receivables may be extended to 60 days or longer and such receivables generally do not require collateral. Additionally, we provide long-term financing in the form of promissory notes when competitive conditions require such financing and, in such cases, we may require collateral. We perform ongoing credit evaluations of our customers’ accounts and notes receivable and allowances are recognized for potential credit losses.
Our long-lived assets are reviewed for impairment whenever an event or change in circumstances indicates the carrying amount of an asset or group of assets may not be recoverable. The impairment review, if necessary, includes a comparison of expected future cash flows (undiscounted and without interest charges) to be generated by an asset group with the associated carrying value of the related assets. If the carrying value of the asset group exceeds the expected future cash flows, an impairment loss is recognized to the extent that the carrying value of the asset group exceeds its fair value.
22
Table of Contents
Management makes judgments regarding the interpretation of tax laws that might be challenged upon an audit and causes changes to previous estimates of tax liability. In addition, we operate within multiple taxing jurisdictions and are subject to audit in these jurisdictions as well as by the Internal Revenue Service. In management’s opinion, adequate provisions for income taxes have been made for all open tax years. The potential outcomes of examinations are regularly assessed in determining the adequacy of the provision for income taxes and income tax liabilities. Management believes that adequate provisions have been made for reasonable and foreseeable outcomes related to uncertain tax matters.
We record a write-down of our inventories when the cost basis of any manufactured product, including any estimated future costs to complete the manufacturing process, exceeds its net realizable value. Inventories are stated at the lower of cost or market value. Cost is determined on a first-in, first-out method, except that our subsidiary in the Russian Federation uses an average cost method to value its inventories.
We periodically review the composition of our inventories to determine if market demand, product modifications, technology changes, excessive quantities on-hand and other factors hinder our ability to recover its investment in such inventories. Management’s assessment is based upon historical product demand, estimated future product demand and various other judgments and estimates. Inventory obsolescence reserves are recorded when such assessments reveal that portions or components of our inventory investment will not be realized in our operating activities.
We primarily derive revenue from the sale, and short-term rental under operating leases, of seismic instruments and equipment and thermal solutions products. We generally recognize sales revenues when our products are shipped and title and risk of loss have passed to the customer. We recognize rental revenues as earned over the rental period. Rentals of our equipment generally range from daily rentals to rental periods of up to six months or longer. Except for certain of our reservoir characterization products, our products are generally sold without any customer acceptance provisions and our standard terms of sale do not allow customers to return products for credit. In instances where the customer requires a significant performance test for our new and unproven products, we do not recognize the revenue attributable to the product as to which the performance test applies until the performance test is satisfied. Collection of revenue from the sale of large-scale reservoir characterization products may occur at various stages of production or after delivery of the product, and the collected funds are generally not refundable to the customer.
Most of our products do not require installation assistance or sophisticated instruction. We offer a standard product warranty, which obligates us to repair or replace equipment with manufacturing defects. We maintain a reserve for future warranty costs based on historical experience or, in the absence of historical experience, management estimates. We record a write-down of inventory when the cost basis of any item (including any estimated future costs to complete the manufacturing process) exceeds its net realizable value.
We recognize revenue when all of the following criteria are met:
| • | Persuasive evidence of an arrangement exists. We operate under a purchase order/contract system for goods sold to customers, and under rental/lease agreements for equipment rentals. These documents evidence that an arrangement exists. |
| • | Delivery has occurred or services have been rendered. For product sales, we do not recognize revenues until delivery has occurred or performance tests are met. For rental revenue, we recognize revenue when earned. |
| • | The seller’s price to the buyer is fixed or determinable. Sales prices are defined in writing in a customer’s purchase order, purchase contract or equipment rental agreement. |
| • | Collectibility is reasonably assured. We evaluate customer credit to ensure collectibility is reasonably assured. |
Occasionally, our seismic customers are not able to take immediate delivery of products which were specifically manufactured to the customer’s specifications. These occasions generally occur when customers face logistical issues such as project delays or with their seismic crew deployment. In these instances, our customers have asked us to hold the equipment for a short period of time until they can take physical delivery of the product (referred to as “bill and hold” arrangements). We consider the following criteria for recognizing revenue when delivery has not occurred:
| • | Whether the risks of ownership have passed to the customer, |
23
Table of Contents
| • | Whether we have obtained a fixed commitment to purchase the goods in written documentation from the customer, |
| • | Whether the customer requested that the transaction be on a bill and hold basis and we received that request in writing, |
| • | Whether the customer has a substantial business purpose for ordering the goods on a bill and hold basis, |
| • | Whether there is a fixed schedule for delivery of the product, |
| • | Whether we have any specific performance obligations such that the earning process is not complete, |
| • | Whether the equipment is segregated from our other inventory and not subject to being used to fill other orders, and |
| • | Whether the equipment is complete and ready for shipment. |
We do not modify our normal billing and credit terms for these types of sales. As of September 30, 2011 and 2010, we had no sales under bill and hold arrangements. As of September 30, 2009, we had recognized $0.6 million of sales under bill and hold arrangements.
Recent Accounting Pronouncements
See Note 1 of our Notes to Consolidated Financial Statements for information regarding the effect of new accounting pronouncements on our financial statements.
Forward-Looking Statements and Assumptions
This Annual Report on Form 10-K and the documents incorporated by reference herein, if any, contain “forward-looking” statements within the meaning of Section 27A of the Securities Act of 1933, as amended, and Section 21E of the Securities Exchange Act of 1934, as amended. You can identify these forward-looking statements by terminology such as “may”, “will”, “should”, “intend”, “expect”, “plan”, “budget”, “forecast”, “anticipate”, “believe”, “estimate”, “predict”, “potential”, “continue” or similar words. You should read statements that contain these words carefully because they discuss our future expectations, contain projections of our future results of operations or of our financial position or state other forward-looking information. These forward-looking statements reflect our best judgment about future events and trends based on the information currently available to us. However, there may be events in the future that we are not able to predict or control. The factors listed under the caption “Risk Factors”, as well as cautionary language in this Annual Report on Form 10-K, provide examples of risks, uncertainties and events that may cause our actual results to differ materially from the expectations we describe in our forward-looking statements. You should be aware that the occurrence of the events described in these risk factors and elsewhere in this Annual Report on Form 10-K could have a material adverse effect on our business, results of operations and financial position, and actual events and results of operations may vary materially from our current expectations.
24
Table of Contents
Management’s Current Outlook and Assumptions
Our estimates as to future results and industry trends, to the extent described in this document, are generally based on assumptions regarding the future level of seismic exploration activity, seismic reservoir monitoring projects, demand for offshore cable and other industrial products and demand for thermal imaging technologies, and in turn, their effect on the demand and pricing of our products and services. Our analysis of the market and its impact on us is based upon the following assumptions:
| • | Although crude oil prices have stabilized over the last two years, we believe the impact of the sovereign debt issues in Europe, slower economic growth in the U.S. and China and the resulting recessionary fears, combined with potentially volatile and unsteady energy commodity prices may constrain oil and gas exploration activities in North America and also in certain international markets. Furthermore, we believe many of our seismic customers relying on credit markets as the source of funds for their capital spending could be prohibited from purchasing new equipment until financial markets stabilize and demand for exploration activities increases. The uncertainty of these global economic matters and their ultimate impact on energy exploration activities and on our customers’ ability to access credit markets may cause demand for our seismic exploration products to decrease. |
| • | In fiscal years 2010 and 2009, our Russian and Canadian seismic operations experienced low product demand, excess manufacturing capacity, intense price competition, low rental equipment utilization and certain asset write-downs resulting from these factors. Together, the seismic activities of these subsidiaries generated operating losses of $1.3 million and $3.3 million in fiscal years 2010 and 2009, respectively. While both the Russian and Canadian subsidiaries experienced significant revenue increases during fiscal year 2011, the Russian subsidiary reported an operating loss of $0.4 million in fiscal year 2011 and continues to face intense pricing competition for product sales to its Russian and CIS customers. We do not expect our Russian subsidiary to emerge from these difficult conditions until later in fiscal year 2012 and, therefore, we do not expect significant improvements in the operating results of our Russian subsidiary in fiscal year 2012. We do, however, expect improving operating results from our Canadian subsidiary throughout fiscal year 2012 due to expected increases in oil and gas exploration activities in Canada, and from customer demand for purchases and rentals of our wireless data acquisition system. |
| • | We believe the impact of political conditions and hostilities around the world, including those in North Africa and the Middle East, which may impact oil and gas commodity prices, will not cause a significant increase or decrease in demand for our seismic products for the foreseeable future. |
| • | Based upon our current backlog, we expect revenues from our borehole and seabed reservoir characterization products and services to remain level with fiscal year 2011 revenues. Our current product backlog does not contain any orders for large-scale seabed reservoir monitoring systems. If we were to sell such a system in fiscal year 2012, we would expect our revenues for these products to increase significantly. |
| • | We expect revenues from the sale and rental of recent product introductions, such as our wireless nodal seismic data recording systems, to improve during fiscal year 2012. |
| • | We expect demand for our products used in the thermal solutions industry to remain level with fiscal year 2011 revenues. |
| • | We expect sales of our industrial products to remain level with our fiscal year 2011 sales. |
Item 7A. Quantitative and Qualitative Disclosures about Market Risk
We have some market risk relative to sensitive instruments entered into for trading purposes and have only very limited risk as to arrangements entered into other than for trading purposes. We do not engage in commodity or commodity derivative instrument purchasing or selling transactions. Because of the inherent unpredictability of foreign currency rates and interest rates, as well as other factors, actual results could differ materially from those projected in this Item.
Short-Term Investment Risk
Our short-term investments consisting of corporate bonds, government bonds and other similar investments are classified for accounting purposes as available-for-sale. If these short-term investments are not held to maturity, the proceeds obtained when the instruments are sold will be impacted by the current interest rates at the time they are sold.
25
Table of Contents
Foreign Currency and Operations Risk
One of our wholly-owned subsidiaries, OYO-GEO Impulse, is located in the Russian Federation. Therefore, our financial results may be affected by factors such as changes in foreign currency exchange rates, weak economic conditions in the Russian Federation or changes in its political climate. Our consolidated balance sheet at September 30, 2011 reflected approximately $6.4 million of net working capital related to OYO-GEO Impulse. For third-party transactions, OYO-GEO Impulse both receives its income and pays its expenses primarily in rubles. To the extent that transactions of OYO-GEO Impulse are settled in rubles, a devaluation of the ruble versus the U.S. dollar could reduce any contribution from OYO-GEO Impulse to our consolidated results of operations and total comprehensive income as reported in U.S. dollars. We do not hedge the market risk with respect to our operations in the Russian Federation; therefore, such risk is a general and unpredictable risk of future disruptions in the valuation of rubles versus U.S. dollars to the extent such disruptions result in any reduced valuation of OYO-GEO Impulse’s net working capital or future contributions to our consolidated results of operations. At September 30, 2011, the foreign exchange rate of the U.S. dollar to the ruble was 1:28.9. If the U.S. dollar versus ruble exchange rate were to decline by ten percent, our working capital could decline by $0.6 million.
Foreign Currency Intercompany Accounts and Notes Receivable
From time to time, we provide access to capital to our foreign subsidiaries through U.S. dollar denominated interest bearing promissory notes. Such funds are generally used by our foreign subsidiaries to purchase capital assets and for general working capital needs. In addition, we sell products to our foreign subsidiaries in U.S. dollars on trade credit terms. Because U.S. dollar denominated intercompany debts are accounted for in the local currency of our foreign subsidiaries, any appreciation or devaluation of such foreign currencies against the U.S. dollar will result in a gain or loss, respectively, to our consolidated statement of operations. At September 30, 2011, we had outstanding accounts and notes receivable of $0.4 million from our subsidiary in the Russian Federation. At September 30, 2011, the foreign exchange rate of the U.S. dollar to ruble was 1:28.9. If the U.S. dollar exchange rate were to decline by ten percent, our intercompany accounts and notes receivable would decline by $36,000 in the Russian Federation.
Floating Interest Rate Risk
The New Credit Agreement contains a floating interest rate, which subjects us to the risk of increased interest costs associated with any upward movements in bank market interest rates. Under the New Credit Agreement our borrowing interest rate is a LIBOR based rate plus 250-350 basis points. As of September 30, 2011, we had no borrowings under the New Credit Agreement.
Item 8. Financial Statements and Supplementary Data
Our consolidated financial statements, including the reports thereon, the notes thereto and supplementary data begin at page F-1 of this Annual Report on Form 10-K and are incorporated herein by reference.
Item 9. Changes in and Disagreements with Accountants on Accounting and Financial Disclosure
None.
Item 9A. Controls and Procedures
Evaluation of Disclosure Controls and Procedures
Our management is responsible for establishing and maintaining a system of disclosure controls and procedures that are designed to ensure that information required to be disclosed in our reports filed under the Exchange Act is recorded, processed, summarized and reported within the time periods specified under SEC’s rules and forms, and that such information is accumulated and communicated to our management, including our Chief Executive Officer (“CEO”) and Chief Financial Officer (“CFO”). Notwithstanding the foregoing, there can be no assurance that the Company’s disclosure controls and procedures will detect or uncover all failures of persons within the Company and its consolidated subsidiaries to report material information otherwise required to be set forth in the Company’s reports.
26
Table of Contents
In connection with the preparation of this Annual Report on Form 10-K, the Company carried out an evaluation under the supervision and with the participation of the Company’s management, including the CEO and CFO, as of September 30, 2011 of the effectiveness of the Company’s disclosure controls and procedures, as such term is defined in Rules 13a-15(e) and 15d-15(e) under the Exchange Act. Based on that evaluation, the CEO and CFO concluded that our disclosure controls and procedures are effective as of September 30, 2011.
Management’s Report on Internal Control Over Financial Reporting
Our management is responsible for establishing and maintaining effective internal control over financial reporting (as defined in Rules 13a-15(f) and 15d-15(f) under the Exchange Act). Because of its inherent limitations, internal control over financial reporting may not prevent or detect misstatements. Also, projections of any evaluation of effectiveness to future periods are subject to the risk that controls may become inadequate because of changes in conditions, or that the degree of compliance with the policies or procedures may deteriorate.
Our management assessed the effectiveness of our internal control over financial reporting as of September 30, 2011. In making this assessment, we used the criteria set forth by the Committee of Sponsoring Organizations of the Treadway Commission (COSO) in Internal Control Integrated Framework. Based on this assessment, our management concluded that, as of September 30, 2011, our internal control over financial reporting is effective based on those criteria.
Our internal control over financial reporting as of September 30, 2011 has been audited by UHY LLP, an independent registered public accounting firm, as stated in their report which appears herein.
Changes in Internal Control Over Financial Reporting
There were no changes in the Company’s internal control over financial reporting that occurred during the Company’s fiscal quarter ending September 30, 2011 that have materially affected, or are reasonably likely to materially affect, the Company’s internal control over financial reporting.
Item 9B. Other Information
None.
27
Table of Contents
PART III
Item 10. Directors and Executive Officers of the Registrant
The information required by this Item is contained in our definitive Proxy Statement to be distributed in connection with our 2012 Annual Meeting of Stockholders under the captions “Election of Directors”, “Executive Officers and Compensation,” “Section 16(a) Beneficial Ownership Reporting Compliance” and “Code of Ethics” and is incorporated herein by reference.
Item 11. Executive Compensation
The information required by this Item is contained in our definitive Proxy Statement to be distributed in connection with our 2012 Annual Meeting of Stockholders under the caption “Executive Officers and Compensation” and is incorporated herein by reference.
Item 12. Security Ownership of Certain Beneficial Owners and Management and Related Stockholder Matters
The information required by this Item is contained in our definitive Proxy Statement to be distributed in connection with our 2012 Annual Meeting of Stockholders under the caption “Security Ownership of Certain Beneficial Owners and Management” and is incorporated herein by reference, and in Item 5, “Market for Registrant’s Common Equity and Related Stockholder Matters,” contained in Part II hereof.
Item 13. Certain Relationships and Related Transactions and Director Independence
The information required by this Item is contained in our definitive Proxy Statement to be distributed in connection with our 2012 Annual Meeting of Stockholders under the caption “Certain Relationships and Related Transactions” and is incorporated herein by reference.
Item 14. Principal Accountant Fees and Services
The information required by this Item is contained in our definitive Proxy Statement to be distributed in connection with our 2012 Annual Meeting of Stockholders under the caption “Independent Public Accountants” and is incorporated herein by reference.
28
Table of Contents
PART IV
Item 15. Exhibits, Financial Statement Schedules
Financial Statements and Financial Statement Schedules
The financial statements and financial statement schedules listed on the accompanying Index to Financial Statements (see page F-1) are filed as part of this Annual Report on Form 10-K.
Exhibits
| Exhibit |
Description of Documents | |
| 3.1(a) | Restated Certificate of Incorporation of the Registrant. | |
| 3.2(a) | Restated Bylaws of the Registrant. | |
| 3.3(p) | Amendment No. 1 to OYO Geospace Corporation Amended and Restated Bylaws. | |
| 4.1(a) | Restated Certificate of Incorporation of the Registrant. | |
| 4.2(a) | Restated Bylaws of the Registrant. | |
| 4.3(p) | Amendment No. 1 to OYO Geospace Corporation Amended and Restated Bylaws. | |
| 10.1(a) | Employment Agreement dated as of August 1, 1997, between the Company and Gary D. Owens.* | |
| 10.2(a) | Employment Agreement dated as of August 1, 1997, between the Company and Michael J. Sheen.* | |
| 10.3(b) | OYO Geospace Corporation 1997 Key Employee Stock Option Plan.* | |
| 10.4(c) | Amendment No. 1 to OYO Geospace Corporation 1997 Key Employee Stock Option Plan, dated February 2, 1998.* | |
| 10.5(c) | Amendment No. 2 to OYO Geospace Corporation 1997 Key Employee Stock Option Plan, dated November 16, 1998.* | |
| 10.6(g) | Amendment No. 3 to OYO Geospace Corporation 1997 Key Employee Stock Option Plan, dated November 10, 2000.* | |
| 10.7(g) | Amendment No. 4 to OYO Geospace Corporation 1997 Key Employee Stock Option Plan, dated February 8, 2005.* | |
| 10.8(b) | OYO Geospace Corporation 1997 Non-Employee Director Plan.* | |
| 10.9(g) | Amendment No. 1 to OYO Geospace Corporation 1997 Non-Employee Director Plan, dated February 8, 2005.* | |
| 10.10(a) | Printhead Purchase Agreement dated November 10, 1995 between the Company and OYO Corporation. | |
| 10.11(a) | Master Sales Agreement dated November 10, 1995, between the Company and OYO Corporation. | |
| 10.12(d) | Form of Director Indemnification Agreement. | |
| 10.13(f) | Business Loan Agreement dated November 22, 2004, made by and between Union Planters Bank, N.A. (predecessor in interest to Regions Bank), and Concord Technologies, LP, Geospace Technologies, LP, OYO Instruments, LP, Geospace Engineering Resources International, LP and OYOG Operations, LP. | |
| 10.14(h) | First Amendment to Loan Agreement dated as of September 19, 2005, between Regions Bank (F/K/A Union Planters Bank, N.A.) and Concord Technologies, LP, Geospace Technologies, LP, OYO Instruments, LP, Geospace Engineering Resources International, LP and OYOG Operations, LP. | |
| 10.15(h) | Promissory Note dated September 19, 2005, made by Concord Technologies, LP, Geospace Technologies, LP, OYO Instruments, LP, Geospace Engineering Resources International, LP and OYOG Operations, LP for the benefit of Regions Bank (F/K/A Union Planters Bank, N.A.). | |
| 10.16(h) | Guaranty Agreement dated September 19, 2005, made by and between the Company and Regions Bank (F/K/A Union Planters Bank, N.A.). Each of OYOG, LLC and OYOG Limited Partner, LLC has entered into a Guaranty Agreement with Regions Bank (F/K/A Union Planters Bank, N.A.) which is substantially identical to the exhibited Guaranty Agreement. | |
| 10.17(h) | Security Agreement dated as of September 19, 2005, between Regions Bank (F/K/A Union Planters Bank, N.A.), and Concord Technologies, LP. Each of Geospace Technologies, LP, OYO Instruments, LP, Geospace Engineering Resources International, LP and OYOG Operations, LP has entered into a Security Agreement with Regions Bank (F/K/A Union Planters Bank, N.A.) which is substantially identical to the exhibited Security Agreement. | |
29
Table of Contents
| 10.18(e) | Deed of Trust, Security Agreement, Assignment of Rents and Financing Statement, dated September 10, 2003, by and between OYOG Operations, LP and Compass Bank. | |
| 10.19(e) | Promissory Note dated September 10, 2003, made by OYOG Operations, LP payable to Compass Bank. | |
| 10.20(e) | Guaranty Agreement dated September 10, 2003, by and between the Company and Compass Bank. | |
| 10.21(e) | Earnest Money Contract dated May 27, 2003, by and between Cooper Tools, Inc. and OYOG Operations, L.P. | |
| 10.22(e) | First Amendment to Earnest Money Contract, dated July 14, 2003, by and between Cooper Tools, Inc. and OYOG Operations, LP. | |
| 10.23(e) | Second Amendment to Earnest Money Contract, dated August 14, 2003, by and between Cooper Tools, Inc. and OYOG Operations, LP. | |
| 10.24(e) | Third Amendment to Earnest Money Contract, dated August 22, 2003, by and between Cooper Tools, Inc. and OYOG Operations, LP. | |
| 10.25(i) | OYO Geospace Corporation Fiscal Year 2009 Bonus Plan.* | |
| 10.26(j) | Second Amendment to Loan Agreement dated as of June 16, 2006, between Regions Bank (F/K/A Union Planters Bank, N.A.) and Concord Technologies, LP, Geospace Technologies, LP, OYO Instruments, LP, Geospace Engineering Resources International, LP and OYOG Operations, LP. | |
| 10.27(k) | Third Amendment to Loan Agreement dated as of January 10, 2007, between Regions Bank (F/K/A Union Planters Bank, N.A.) and Concord Technologies, LP, Geospace Technologies, LP, OYO Instruments, LP, Geospace Engineering Resources International, LP and OYOG Operations, LP. | |
| 10.28(l) | Fourth Amendment to Loan Agreement dated as of October 12, 2007, between Regions Bank (F/K/A Union Planters Bank, N.A.) and Concord Technologies, LP, Geospace Technologies, LP, OYO Instruments, LP, Geospace Engineering Resources International, LP and OYOG Operations, LP. | |
| 10.29(m) | Fifth Amendment to Loan Agreement dated as of March 12, 2008, between Regions Bank (F/K/A Union Planters Bank, N.A.) and Concord Technologies, LP, Geospace Technologies, LP, OYO Instruments, LP, Geospace Engineering Resources International, LP and OYOG Operations, LP. | |
| 10.30(m) | Promissory Note dated March 13, 2008, made by OYOG Operations, LP payable to Compass Bank. | |
| 10.31(m) | Deed of Trust, Security Agreement, Assignment of Rents and Financing Statement, dated March 13, 2008, by and between OYOG Operations, LP and Compass Bank. | |
| 10.32(m) | Guaranty Agreement dated March 13, 2008, by and between the Company and Compass Bank. | |
| 10.33(m) | Guaranty Agreement dated March 13, 2008, by and between Geospace Technologies, LP and Compass Bank. | |
| 10.34(n) | First Amendment effective October 1, 2008 to Employment Agreement dated as of August 1, 1997, between the Company and Gary D. Owens.* | |
| 10.35(n) | First Amendment effective October 1, 2008 to Employment Agreement dated as of August 1, 1997, between the Company and Michael J. Sheen.* | |
| 10.36(o) | Sixth Amendment to Loan Agreement dated as of April 30, 2009, between Regions Bank (f/k/a Union Planters Bank, N.A.) and Concord Technologies, LP, Geospace Technologies, LP, OYO Instruments, LP, Geospace Engineering Resources International, LP, and OYOG Operations, LP. | |
| 10.37(q) | OYO Geospace Corporation Fiscal Year 2011 Bonus Plan.* | |
| 10.38(r) | Loan Agreement dated as of March 2, 2011, by and among the Company, as borrower, certain subsidiaries of the Company, as guarantors, and The Frost National Bank, as lender. | |
| 10.39(r) | First Amendment to Loan Agreement dated as of March 2, 2011, by and among the Company, as borrower, certain subsidiaries of the Company, as guarantors, and The Frost National Bank, as lender. | |
| 10.40(r) | Promissory Note dated March 2, 2011, made by OYO Geospace Corporation payable to The Frost National Bank. | |
| 21.1 | Subsidiaries of the Registrant. | |
| 23.1 | Consent of UHY LLP, Independent Registered Public Accounting Firm. | |
| 31.1 | Certification of the Company’s Chief Executive Officer pursuant to Section 302 of the Sarbanes-Oxley Act of 2002. | |
| 31.2 | Certification of the Company’s Chief Financial Officer pursuant to Section 302 of the Sarbanes-Oxley Act of 2002. | |
30
Table of Contents
| 32.1 | Certification of the Company’s Chief Executive Officer pursuant to Section 906 of the Sarbanes-Oxley Act of 2002. | |
| 32.2 | Certification of the Company’s Chief Financial Officer pursuant to Section 906 of the Sarbanes-Oxley Act of 2002. | |
| ++101 | Interactive Data Files | |
| (a) | Incorporated by reference to the Registrant’s Registration Statement on Form S-1 filed September 30, 1997 (Registration No. 333-36727). | |
| (b) | Incorporated by reference to Amendment No. 1 to the Registrant’s Registration Statement on Form S-1 filed November 5, 1997 (Registration No. 333-36727). | |
| (c) | Incorporated by reference to Registrant’s Annual Report on Form 10-K for the year ended September 30, 1998. | |
| (d) | Incorporated by reference to Amendment No. 2 to the Registrant’s Registration Statement on Form S- 1 filed November 18, 1997 (Registration No. 333-36727). | |
| (e) | Incorporated by reference to the Registrant’s Annual Report on Form 10-K for the year ended September 30, 2003. | |
| (f) | Incorporated by reference to the Registrant’s Annual Report on Form 10-K for the year ended September 30, 2004. | |
| (g) | Incorporated by reference to the Registrant’s Registration Statement on Form S-8 filed February 15, 2005. (Registration No. 333-122835) | |
| (h) | Incorporated by reference to the Registrant’s Current Report on Form 8-K filed September 21, 2005. | |
| (i) | Incorporated by reference to the Registrant’s Quarterly Report on Form 10-Q for the quarter ended December 31, 2008, filed February 6, 2009. | |
| (j) | Incorporated by reference to the Registrant’s Current Report on Form 8-K filed July 3, 2006. | |
| (k) | Incorporated by reference to the Registrant’s Current Report on Form 8-K filed January 11, 2007. | |
| (l) | Incorporated by reference to the Registrant’s Current Report on Form 8-K filed November 26, 2007. | |
| (m) | Incorporated by reference to the Registrant’s Current Report on Form 8-K filed March 17, 2008. | |
| (n) | Incorporated by reference to the Registrant’s Quarterly Report on Form 10-Q for the quarter ended December 31, 2009, filed February 5, 2010. | |
| (o) | Incorporated by reference to the Registrant’s Current Report on Form 8-K filed May 4, 2009. | |
| (p) | Incorporated by reference to the Registrant’s Quarterly Report on Form 10-Q for the quarter ended June 30, 2007, filed August 3, 2007. | |
| (q) | Incorporated by reference to the Registrant’s Quarterly Report on Form 10-Q for the quarter ended December 31, 2010, filed February 4, 2011. | |
| (r) | Incorporated by reference to the registrant’s Current Report on Form 8-K filed March 8, 2011. |
| * | This exhibit is a management contract or a compensatory plan or arrangement. |
| ++ | Pursuant to Rule 406T of Regulation S-T, these interactive data files are deemed not filed or part of a registration statement or prospectus for purposes of Sections 11 or 12 of the Securities Act of 1933 or Section 18 of the Securities Exchange Act of 1934 and otherwise are not subject to liability. |
31
Table of Contents
SIGNATURES
Pursuant to the requirements of Section 13 or 15(d) of the Securities Exchange Act of 1934, the Registrant has duly caused this report to be signed on its behalf by the undersigned, thereunto duly authorized.
| OYO GEOSPACE CORPORATION | ||
| By: | /s/ GARY D. OWENS | |
| Gary D. Owens, Chairman of the Board | ||
| President and Chief Executive Officer | ||
| December 9, 2011 | ||
Pursuant to the requirements of the Securities Exchange Act, this Annual Report on Form 10-K has been signed below by the following persons on behalf of the Registrant and in the capacities and on the dates indicated.
| Signature |
Title |
Date | ||
| /s/ GARY D. OWENS Gary D. Owens |
Chairman of the Board President and Chief Executive Officer (Principal Executive Officer) |
December 9, 2011 | ||
| /s/ THOMAS T. MCENTIRE Thomas T. McEntire |
Vice President Chief Financial Officer (Principal Financial Officer and Accounting Officer) and Secretary |
December 9, 2011 | ||
| /s/ WILLIAM H. MOODY William H. Moody |
Director |
December 9, 2011 | ||
| /s/ TAKASHI KANEMORI Takashi Kanemori |
Director |
December 9, 2011 | ||
| /s/ RICHARD C. WHITE Richard C. White |
Director |
December 9, 2011 | ||
| /s/ MICHAEL J. SHEEN Michael J. Sheen |
Director |
December 9, 2011 | ||
| /s/ Thomas L. Davis Thomas L. Davis |
Director |
December 9, 2011 | ||
| /s/ CHARLES H. STILL Charles H. Still |
Director |
December 9, 2011 | ||
32
Table of Contents
OYO GEOSPACE CORPORATION AND SUBSIDIARIES
INDEX TO FINANCIAL STATEMENTS
F-1
Table of Contents
REPORT OF INDEPENDENT REGISTERED PUBLIC ACCOUNTING FIRM
To the Board of Directors and
Stockholders of OYO Geospace Corporation:
We have audited the accompanying consolidated balance sheets of OYO Geospace Corporation and subsidiaries (“the Company”) as of September 30, 2011 and 2010, and the related consolidated statements of operations, comprehensive income, stockholders’ equity and cash flows for each of the three fiscal years in the period ended September 30, 2011. Our audits also included the financial statement schedule listed in the accompanying index. These consolidated financial statements and schedule are the responsibility of the Company’s management. Our responsibility is to express an opinion on these consolidated financial statements and schedule based on our audits.
We conducted our audits in accordance with the standards of the Public Company Accounting Oversight Board (United States). Those standards require that we plan and perform the audits to obtain reasonable assurance about whether the financial statements are free of material misstatement. An audit includes examining, on a test basis, evidence supporting the amounts and disclosures in the financial statements. An audit also includes assessing the accounting principles used and significant estimates made by management, as well as evaluating the overall financial statement presentation. We believe that our audits provide a reasonable basis for our opinion.
In our opinion, the consolidated financial statements referred to above present fairly, in all material respects, the consolidated financial position of OYO Geospace Corporation and subsidiaries as of September 30, 2011 and 2010, and the consolidated results of their operations and their cash flows for each of the three fiscal years in the period ended September 30, 2011, in conformity with accounting principles generally accepted in the United States of America. Also, in our opinion, the related financial statement schedule, when considered in relation to the basic consolidated financial statements taken as a whole, presents fairly, in all material respects, the information set forth therein.
We also have audited, in accordance with the standards of the Public Company Accounting Oversight Board (United States), the effectiveness of OYO Geospace Corporation and subsidiaries’ internal control over financial reporting as of September 30, 2011, based on criteria established in Internal Control—Integrated Framework issued by the Committee of Sponsoring Organizations of the Treadway Commission (COSO), and our report dated December 9, 2011 expressed an unqualified opinion on the effectiveness of the Company’s internal control over financial reporting.
| /s/ UHY LLP |
| Houston, Texas |
| December 9, 2011 |
F-2
Table of Contents
REPORT OF INDEPENDENT REGISTERED PUBLIC ACCOUNTING FIRM
To the Board of Directors and
Stockholders of OYO Geospace Corporation:
We have audited OYO Geospace Corporation and subsidiaries’ (“the Company”) internal control over financial reporting as of September 30, 2011, based on criteria established in Internal Control—Integrated Framework issued by the Committee of Sponsoring Organizations of the Treadway Commission (COSO). The Company’s management is responsible for maintaining effective internal control over financial reporting and for its assessment of the effectiveness of internal control over financial reporting, included in Part II, Item 9A of this Form 10-K. Our responsibility is to express an opinion on the Company’s internal control over financial reporting based on our audit.
We conducted our audit in accordance with the standards of the Public Company Accounting Oversight Board (United States). Those standards require that we plan and perform the audit to obtain reasonable assurance about whether effective internal control over financial reporting was maintained in all material respects. Our audit included obtaining an understanding of internal control over financial reporting, assessing the risk that a material weakness exists, testing and evaluating the design and operating effectiveness of internal control, and performing such other procedures as we considered necessary in the circumstances. We believe that our audit provides a reasonable basis for our opinion.
A company’s internal control over financial reporting is a process designed to provide reasonable assurance regarding the reliability of financial reporting and the preparation of financial statements for external purposes in accordance with generally accepted accounting principles. A company’s internal control over financial reporting includes those policies and procedures that (1) pertain to the maintenance of records that, in reasonable detail, accurately and fairly reflect the transactions and dispositions of the assets of the company; (2) provide reasonable assurance that transactions are recorded as necessary to permit preparation of financial statements in accordance with generally accepted accounting principles, and that receipts and expenditures of the company are being made only in accordance with authorizations of management and directors of the company; and (3) provide reasonable assurance regarding prevention or timely detection of unauthorized acquisition, use, or disposition of the company’s assets that could have a material effect on the financial statements.
Because of its inherent limitations, internal control over financial reporting may not prevent or detect misstatements. Also, projections of any evaluation of effectiveness to future periods are subject to the risk that controls may become inadequate because of changes in conditions, or that the degree of compliance with the policies or procedures may deteriorate.
In our opinion, OYO Geospace Corporation and subsidiaries maintained, in all material respects, effective internal control over financial reporting as of September 30, 2011, based on criteria established in Internal Control – Integrated Framework issued by the Committee of Sponsoring Organizations of the Treadway Commission.
We have also audited, in accordance with the standards of the Public Company Accounting Oversight Board (United States), the consolidated balance sheets of OYO Geospace Corporation and subsidiaries as of September 30, 2011 and 2010, and the related consolidated statements of operations, comprehensive income, stockholders’ equity and cash flows for each of the three fiscal years in the period ended September 30, 2011, and our report dated December 9, 2011, expressed an unqualified opinion on those consolidated financial statements.
| /s/ UHY LLP |
| Houston, Texas |
| December 9, 2011 |
F-3
Table of Contents
OYO Geospace Corporation and Subsidiaries
Consolidated Balance Sheets
(In thousands, except share amounts)
| AS OF SEPTEMBER 30, | ||||||||
| 2011 | 2010 | |||||||
| ASSETS | ||||||||
| Current assets: |
||||||||
| Cash and cash equivalents |
$ | 31,388 | $ | 33,453 | ||||
| Short-term investments |
4,926 | — | ||||||
| Trade accounts receivable, net of allowance of $411 and $334 |
19,761 | 19,107 | ||||||
| Current portion of notes receivable, net of allowance of $0 |
2,100 | 2,400 | ||||||
| Inventories, net |
72,390 | 47,395 | ||||||
| Deferred income tax asset |
6,356 | 4,542 | ||||||
| Other current assets |
5,660 | 3,089 | ||||||
|
|
|
|
|
|||||
| Total current assets |
142,581 | 109,986 | ||||||
| Rental equipment, net |
11,945 | 8,003 | ||||||
| Property, plant and equipment, net |
34,692 | 33,988 | ||||||
| Patents, net of accumulated amortization of $5,534 and $5,295 |
319 | 558 | ||||||
| Goodwill |
1,843 | 1,843 | ||||||
| Non-current deferred income tax asset |
505 | 754 | ||||||
| Non-current notes receivable, net of allowance of $0 |
3,706 | 6,131 | ||||||
| Other assets |
1,210 | 2,233 | ||||||
|
|
|
|
|
|||||
| Total assets |
$ | 196,801 | $ | 163,496 | ||||
|
|
|
|
|
|||||
| LIABILITIES AND STOCKHOLDERS’ EQUITY | ||||||||
| Current liabilities: |
||||||||
| Notes payable and current maturities of long-term debt |
— | 440 | ||||||
| Accounts payable trade |
5,042 | 3,809 | ||||||
| Accrued expenses and other current liabilities |
11,384 | 10,793 | ||||||
| Deferred revenue |
774 | 1,311 | ||||||
| Deferred income tax liability |
82 | — | ||||||
| Income tax payable |
399 | 2,056 | ||||||
|
|
|
|
|
|||||
| Total current liabilities |
17,681 | 18,409 | ||||||
| Long-term debt, net of current maturities |
— | 7,260 | ||||||
| Non-current deferred income tax liability |
2,107 | 1,241 | ||||||
|
|
|
|
|
|||||
| Total liabilities |
19,788 | 26,910 | ||||||
|
|
|
|
|
|||||
| Commitments and contingencies |
||||||||
| Stockholders’ equity: |
||||||||
| Preferred stock, 1,000,000 shares authorized, no shares issued and outstanding |
— | — | ||||||
| Common stock, $.01 par value, 20,000,000 shares authorized, 6,351,258 and 6,117,358 shares issued and outstanding |
64 | 61 | ||||||
| Additional paid-in capital |
57,446 | 47,059 | ||||||
| Retained earnings |
119,333 | 89,622 | ||||||
| Accumulated other comprehensive income (loss) |
170 | (156 | ) | |||||
|
|
|
|
|
|||||
| Total stockholders’ equity |
177,013 | 136,586 | ||||||
|
|
|
|
|
|||||
| Total liabilities and stockholders’ equity |
$ | 196,801 | $ | 163,496 | ||||
|
|
|
|
|
|||||
The accompanying notes are an integral part of the consolidated financial statements.
F-4
Table of Contents
OYO Geospace Corporation and Subsidiaries
Consolidated Statements of Operations
(In thousands, except share and per share amounts)
| YEAR ENDED SEPTEMBER 30, | ||||||||||||
| 2011 | 2010 | 2009 | ||||||||||
| Sales |
$ | 172,970 | $ | 128,533 | $ | 92,860 | ||||||
| Cost of sales |
98,857 | 81,177 | 66,287 | |||||||||
|
|
|
|
|
|
|
|||||||
| Gross profit |
74,113 | 47,356 | 26,573 | |||||||||
| Operating expenses: |
||||||||||||
| Selling, general and administrative expenses |
18,051 | 16,618 | 14,572 | |||||||||
| Research and development expenses |
11,529 | 9,925 | 8,062 | |||||||||
| Bad debt expense (recovery) |
128 | (479 | ) | 318 | ||||||||
|
|
|
|
|
|
|
|||||||
| Total operating expenses |
29,708 | 26,064 | 22,952 | |||||||||
|
|
|
|
|
|
|
|||||||
| Loss on disposal of equipment |
— | (184 | ) | (12 | ) | |||||||
|
|
|
|
|
|
|
|||||||
| Income from operations |
44,405 | 21,108 | 3,609 | |||||||||
|
|
|
|
|
|
|
|||||||
| Other income (expense): |
||||||||||||
| Interest expense |
(43 | ) | (238 | ) | (602 | ) | ||||||
| Interest income |
267 | 254 | 809 | |||||||||
| Foreign exchange gains (losses) |
80 | (52 | ) | (414 | ) | |||||||
| Other, net |
(90 | ) | (170 | ) | (91 | ) | ||||||
|
|
|
|
|
|
|
|||||||
| Total other income (expense), net |
214 | (206 | ) | (298 | ) | |||||||
|
|
|
|
|
|
|
|||||||
| Income before income taxes |
44,619 | 20,902 | 3,311 | |||||||||
| Income tax expense |
14,908 | 6,820 | 1,551 | |||||||||
|
|
|
|
|
|
|
|||||||
| Net income |
$ | 29,711 | $ | 14,082 | $ | 1,760 | ||||||
|
|
|
|
|
|
|
|||||||
| Earnings per common share: |
||||||||||||
| Basic |
$ | 4.78 | $ | 2.33 | $ | 0.30 | ||||||
|
|
|
|
|
|
|
|||||||
| Diluted |
$ | 4.73 | $ | 2.27 | $ | 0.29 | ||||||
|
|
|
|
|
|
|
|||||||
| Weighted average common shares outstanding: |
||||||||||||
| Basic |
6,220,657 | 6,031,314 | 5,950,403 | |||||||||
|
|
|
|
|
|
|
|||||||
| Diluted |
6,286,324 | 6,193,018 | 6,079,378 | |||||||||
|
|
|
|
|
|
|
|||||||
The accompanying notes are an integral part of the consolidated financial statements.
F-5
Table of Contents
OYO Geospace Corporation and Subsidiaries
Consolidated Statements of Comprehensive Income
(In thousands)
| YEAR ENDED SEPTEMBER 30, | ||||||||||||
| 2011 | 2010 | 2009 | ||||||||||
| Net income |
$ | 29,711 | $ | 14,082 | $ | 1,760 | ||||||
| Other comprehensive income (loss): |
||||||||||||
| Change in unrealized loss on available-for-sale securities |
(12 | ) | — | — | ||||||||
| Foreign currency translation adjustments |
338 | 86 | (1,736 | ) | ||||||||
|
|
|
|
|
|
|
|||||||
| Comprehensive income |
$ | 30,037 | $ | 14,168 | $ | 24 | ||||||
|
|
|
|
|
|
|
|||||||
The accompanying notes are an integral part of the consolidated financial statements.
F-6
Table of Contents
OYO Geospace Corporation and Subsidiaries
Consolidated Statement of Stockholders’ Equity
For the years ended September 30, 2011, 2010 and 2009
(In thousands, except share amounts)
| Additional Paid-In |
Retained |
Accumulated Comprehensive |
Total | |||||||||||||||||||||
| Common Stock | ||||||||||||||||||||||||
| Shares | Amount | Capital | Earnings | Income (Loss) | ||||||||||||||||||||
| Balance at September 30, 2008 |
5,936,508 | $ | 59 | $ | 42,030 | $ | 73,780 | $ | 1,494 | $ | 117,363 | |||||||||||||
| Net income |
— | — | — | 1,760 | — | 1,760 | ||||||||||||||||||
| Other comprehensive loss |
— | — | — | — | (1,736 | ) | (1,736 | ) | ||||||||||||||||
| Excess tax benefit from share – based compensation |
— | 147 | — | — | 147 | |||||||||||||||||||
| Issuance of common stock pursuant to exercise of options, net of tax |
58,400 | 1 | 840 | — | — | 841 | ||||||||||||||||||
| Stock-based compensation |
— | — | 283 | — | — | 283 | ||||||||||||||||||
|
|
|
|
|
|
|
|
|
|
|
|
|
|||||||||||||
| Balance at September 30, 2009 |
5,994,908 | $ | 60 | $ | 43,300 | $ | 75,540 | $ | (242 | ) | $ | 118,658 | ||||||||||||
| Net income |
— | — | — | 14,082 | — | 14,082 | ||||||||||||||||||
| Other comprehensive income |
— | — | — | — | 86 | 86 | ||||||||||||||||||
| Excess tax benefit from share – based compensation |
— | 1,128 | — | — | 1,128 | |||||||||||||||||||
| Issuance of common stock pursuant to exercise of options, net of tax |
122,450 | 1 | 2,186 | — | — | 2,187 | ||||||||||||||||||
| Stock-based compensation |
— | — | 445 | — | — | 445 | ||||||||||||||||||
|
|
|
|
|
|
|
|
|
|
|
|
|
|||||||||||||
| Balance at September 30, 2010 |
6,117,358 | $ | 61 | $ | 47,059 | $ | 89,622 | $ | (156 | ) | $ | 136,586 | ||||||||||||
| Net income |
— | — | — | 29,711 | — | 29,711 | ||||||||||||||||||
| Other comprehensive income |
— | — | — | — | 326 | 326 | ||||||||||||||||||
| Excess tax benefit from share – based compensation |
— | 6,896 | — | — | 6,896 | |||||||||||||||||||
| Issuance of common stock pursuant to exercise of options, net of tax |
233,900 | 3 | 2,755 | — | — | 2,758 | ||||||||||||||||||
| Stock-based compensation |
— | — | 736 | — | — | 736 | ||||||||||||||||||
|
|
|
|
|
|
|
|
|
|
|
|
|
|||||||||||||
| Balance at September 30, 2011 |
6,351,258 | $ | 64 | $ | 57,446 | $ | 119,333 | $ | 170 | $ | 177,013 | |||||||||||||
|
|
|
|
|
|
|
|
|
|
|
|
|
|||||||||||||
The accompanying notes are an integral part of the consolidated financial statements.
F-7
Table of Contents
OYO Geospace Corporation and Subsidiaries
Consolidated Statements of Cash Flows
(In thousands)
| YEAR ENDED SEPTEMBER 30, | ||||||||||||
| 2011 | 2010 | 2009 | ||||||||||
| Cash flows from operating activities: |
||||||||||||
| Net income |
$ | 29,711 | $ | 14,082 | $ | 1,760 | ||||||
| Adjustments to reconcile net income to net cash provided by (used in) operating activities: |
||||||||||||
| Deferred income tax expense (benefit) |
(718 | ) | (1,416 | ) | 451 | |||||||
| Depreciation |
6,769 | 4,921 | 4,943 | |||||||||
| Amortization |
278 | 263 | 246 | |||||||||
| Stock-based compensation |
736 | 445 | 283 | |||||||||
| Bad debt expense (recovery) |
128 | (479 | ) | 318 | ||||||||
| Inventory obsolescence expense |
4,608 | 2,872 | 1,272 | |||||||||
| Gross profit from sale of used rental equipment |
(11,165 | ) | (385 | ) | (277 | ) | ||||||
| Loss on early extinguishment of debt |
— | 137 | — | |||||||||
| (Gain) loss on disposal of property, plant and equipment |
— | 184 | 12 | |||||||||
| Realized loss on short-term investments |
27 | — | — | |||||||||
| Effects of changes in operating assets and liabilities: |
||||||||||||
| Trade accounts and notes receivable |
2,006 | (2,678 | ) | 14,257 | ||||||||
| Inventories |
(29,528 | ) | 6,673 | 3,238 | ||||||||
| Other current assets |
(2,539 | ) | (855 | ) | 223 | |||||||
| Accounts payable |
1,227 | (879 | ) | (3,382 | ) | |||||||
| Accrued expenses and other |
1,810 | 3,047 | (4,348 | ) | ||||||||
| Deferred revenue |
(558 | ) | 948 | (550 | ) | |||||||
| Income tax payable |
(1,656 | ) | 1,898 | (1,382 | ) | |||||||
|
|
|
|
|
|
|
|||||||
| Net cash provided by operating activities |
1,136 | 28,778 | 17,064 | |||||||||
|
|
|
|
|
|
|
|||||||
| Cash flows from investing activities: |
||||||||||||
| Proceeds from the sale of property, plant and equipment |
1 | 11 | 23 | |||||||||
| Proceeds from the sale of used rental equipment |
19,917 | 1,243 | 277 | |||||||||
| Purchases of short-term investments |
(4,926 | ) | — | — | ||||||||
| Investment in rental equipment |
(15,414 | ) | (3,893 | ) | (1,319 | ) | ||||||
| Purchase of property and equipment |
(4,730 | ) | (2,224 | ) | (390 | ) | ||||||
|
|
|
|
|
|
|
|||||||
| Net cash used in investing activities |
(5,152 | ) | (4,863 | ) | (1,409 | ) | ||||||
|
|
|
|
|
|
|
|||||||
| Cash flows from financing activities: |
||||||||||||
| Change in book overdrafts |
— | — | (35 | ) | ||||||||
| Net borrowings (principal payments) under line of credit |
— | — | (9,978 | ) | ||||||||
| Principal payments under mortgage loans |
(7,700 | ) | (1,848 | ) | (709 | ) | ||||||
| Penalty for early extinguishment of debt |
— | (137 | ) | — | ||||||||
| Excess tax benefits from stock-based compensation |
6,896 | 1,128 | 147 | |||||||||
| Proceeds from exercise of stock options and other |
2,758 | 2,187 | 841 | |||||||||
|
|
|
|
|
|
|
|||||||
| Net cash provided by (used in) financing activities |
1,954 | 1,330 | (9,734 | ) | ||||||||
|
|
|
|
|
|
|
|||||||
| Effect of exchange rate changes on cash |
(3 | ) | (363 | ) | 1,088 | |||||||
|
|
|
|
|
|
|
|||||||
| Increase (decrease) in cash and cash equivalents |
(2,065 | ) | 24,882 | 7,009 | ||||||||
| Cash and cash equivalents, beginning of fiscal year |
33,453 | 8,571 | 1,562 | |||||||||
|
|
|
|
|
|
|
|||||||
| Cash and cash equivalents, end of fiscal year |
$ | 31,388 | $ | 33,453 | $ | 8,571 | ||||||
|
|
|
|
|
|
|
|||||||
The accompanying notes are an integral part of the consolidated financial statements.
F-8
Table of Contents
OYO Geospace Corporation and Subsidiaries
Notes to Consolidated Financial Statements
1. Summary of Significant Accounting Policies:
The Company
OYO Geospace Corporation (“OYO”) designs and manufactures instruments and equipment used in the acquisition and processing of seismic data as well as in the characterization and monitoring of producing oil and gas reservoirs. OYO also manufactures and distributes thermal imaging equipment and dry thermal film products to a variety of markets including the screenprint, point of sale, signage and textile markets. As of September 30, 2011, OYO Corporation U.S.A. (“OYO USA”) owned approximately 20.3% of OYO’s common stock. OYO USA is a wholly owned subsidiary of OYO Corporation, a Japanese corporation (“OYO Japan”).
OYO and its subsidiaries are referred to collectively as the “Company”. The significant accounting policies followed by the Company are summarized below.
Basis of Presentation
The accompanying financial statements present the consolidated financial position, results of operations and cash flows of the Company in accordance with U.S. generally accepted accounting principles. All intercompany balances and transactions have been eliminated.
Reclassifications
Certain amounts previously presented in the consolidated financial statements have been reclassified to conform to the current year presentation. Such reclassifications had no effect on net income, stockholders’ equity or cash flows.
Use of Estimates
The preparation of financial statements in conformity with accounting principles generally accepted in the United States of America requires the use of estimates and assumptions that affect the amounts reported in the financial statements and accompanying notes. The Company considers many factors in selecting appropriate operational and financial accounting policies and controls, and in developing the estimates and assumptions that are used in the preparation of these financial statements. The Company continually evaluates its estimates, including those related to bad debt reserves, inventory obsolescence reserves, self-insurance reserves, product warranty reserves, long-lived assets, intangible assets and deferred income tax assets. The Company bases its estimates on historical experience and various other factors that are believed to be reasonable under the circumstances. Actual results may differ from these estimates under different conditions or assumptions.
Cash and Cash Equivalents
The Company considers all highly liquid investments purchased with an original or remaining maturity at the time of purchase of three months or less to be cash equivalents.
Short-term Investments
The Company classifies its investments consisting of corporate bonds, government bonds and other such similar investments as available-for-sale securities. Available-for-sale securities are carried at fair market value with net unrealized holding gains and losses reported each period as a component of comprehensive income in stockholders’ equity. The Company’s short-term investments have contractual maturities ranging from December 2011 to December 2013. See note 2 for additional information.
F-9
Table of Contents
Concentrations of Credit Risk
The Company maintains its cash in bank deposit accounts that, at times, exceed federally insured limits. Management of the Company believes that the financial strength of the financial institutions holding such deposits minimizes the credit risk of such deposits.
The Company sells products to customers throughout the United States and various foreign countries. The Company’s normal credit terms for trade receivables are 30 days. In certain situations, credit terms may be extended to 60 days or longer. The Company performs ongoing credit evaluations of its customers and generally does not require collateral for its trade receivables. Additionally, the Company provides long-term financing in the form of promissory notes when competitive conditions require such financing. In such cases, the Company may require collateral. Allowances are recognized for potential credit losses. At September 30, 2011, the Company had two customers comprising 15.5% and 13.3%, respectively, of the Company’s trade accounts receivable. At September 30, 2010, the Company had two customers comprising 22.3% and 11.1%, respectively, of the Company’s trade accounts receivable. The Company had one customer comprising 88.3% of its notes receivable balance at September 30, 2011. The Company had two customers comprising 75.9% and 15.0%, respectively, of its notes receivable balance at September 30, 2010. Two customers comprised 20.2% and 11.1% of the Company’s revenues during fiscal year 2011. One customer comprised 13.2% and 12.0% of the Company’s revenues during the fiscal years 2010 and 2009, respectively.
The Company has a subsidiary located in the Russian Federation. Therefore, the Company’s financial results may be affected by factors such as changes in foreign currency exchange rates, weak economic conditions or changes in political climate within the Russian Federation. The Company’s consolidated balance sheet at September 30, 2011 reflected approximately $6.4 million of net working capital related to this subsidiary. This subsidiary receives a substantial portion of its revenues and pays its expenses primarily in rubles. During the fiscal year ended September 30, 2011, this subsidiary received approximately $5.2 million of its income in U.S. dollars as a result of intercompany sales to the Company’s subsidiary located in the United States. The Company’s consolidated balance sheet at September 30, 2010 reflected approximately $5.1 million of net working capital related to this subsidiary. During the fiscal year ended September 30, 2010, this subsidiary received approximately $3.6 million of its income in U.S. dollars as a result of intercompany sales to the Company’s subsidiary located in the United States. To the extent that transactions of this subsidiary are settled in rubles, a devaluation of the ruble versus the United States dollar could reduce any contribution from this subsidiary to its consolidated results of operations as reported in U.S. dollars. The Company does not hedge the market risk with respect to its operations in the Russian Federation; therefore, such risk is a general and unpredictable risk of future disruptions in the valuation of rubles versus U.S. dollars to the extent such disruptions result in any reduced valuation of the subsidiary’s net working capital or future contributions to its consolidated results of operations.
Inventories
The Company records a write-down of its inventories when the cost basis of any manufactured product, including any estimated future costs to complete the manufacturing process, exceeds its net realizable value. Inventories are stated at the lower of cost or market value. Cost is determined on the first-in, first-out method, except that the Company’s subsidiary in the Russian Federation uses an average cost method to value its inventories.
F-10
Table of Contents
Property, Plant and Equipment and Rental Equipment
Property, plant and equipment and rental equipment are stated at cost. Depreciation expense is calculated using the straight-line method over the following estimated useful lives:
| Years | ||||
| Rental equipment |
3-10 | |||
| Property, plant and equipment: |
||||
| Machinery and equipment |
3-15 | |||
| Buildings and building improvements |
10-50 | |||
| Other |
5-10 | |||
Expenditures for renewals and betterments are capitalized. Repairs and maintenance expenditures are charged to expense as incurred. The cost and accumulated depreciation of assets sold or otherwise disposed of are removed from the accounts and any gain or loss thereon is reflected in the statement of operations.
Patents
Patents are amortized over the legal life of the patent or the estimated useful life of the patent, whichever is shorter. Patent amortization expense was approximately $0.2 million during each of fiscal years 2011, 2010 and 2009. Patent amortization expense is estimated to be approximately $0.2 million for the fiscal year ending September 30, 2012 and approximately $80,000 during fiscal year 2013.
Impairment of Long-lived Assets
The Company’s long-lived assets are reviewed for impairment whenever an event or change in circumstances indicates the carrying amount of an asset or group of assets may not be recoverable. The impairment review, if necessary, includes a comparison of expected future cash flows (undiscounted and without interest charges) to be generated by an asset group with the associated carrying value of the related assets. If the carrying value of the asset group exceeds the expected future cash flows, an impairment loss is recognized to the extent that the carrying value of the asset group exceeds its fair value.
Goodwill
For the fiscal year ended September 30, 2011, the Company adopted simplified procedures for analyzing goodwill impairment. See Recent Accounting Pronouncements in this footnote for additional information. The new guidance on the testing of goodwill for impairment provides the option to first assess qualitative factors to determine if the annual two-step test of goodwill for impairment must be performed. If, based on the qualitative assessment of events or circumstances, an entity determines it is more likely than not that the goodwill fair value is more than its carrying amount then it is not necessary to perform the two-step impairment test. However, if an entity concludes otherwise, then the two-step impairment test must be performed to identify potential impairment and to measure the amount of goodwill impairment, if any. The Company determined that it is more likely than not that the fair value of its goodwill was more than its carrying amount and the two-step process was not necessary for the fiscal year ended September 30, 2011.
Revenue Recognition
The Company primarily derives revenue from the sale, and short-term rental under operating leases, of seismic instruments and equipment and thermal solutions products. The Company generally recognizes sales revenues when its products are shipped and title and risk of loss have passed to the customer. The Company recognizes rental revenues as earned over the rental period. Rentals of the Company’s equipment generally range from daily rentals to rental periods of up to six months or longer. Except for certain of the Company’s reservoir characterization products, its products are generally sold without any customer acceptance provisions and its standard terms of sale do not allow customers to return products for credit. In instances where the customer requires a significant performance test for the Company’s new and unproven products, the Company does not
F-11
Table of Contents
recognize the revenue attributable to the product as to which the performance test applies until the performance test is satisfied. Collection of revenue from the sale of large-scale reservoir characterization products may occur at various stages of production or after delivery of the product, and the collected funds are not refundable to the customer. Most of the Company’s products do not require installation assistance or sophisticated instruction.
The Company recognizes revenue when all of the following criteria are met:
| • | Persuasive evidence of an arrangement exists. The Company operates under a purchase order/contract system for goods sold to customers, and under rental/lease agreements for equipment rentals. These documents evidence that an arrangement exists. |
| • | Delivery has occurred or services have been rendered. For product sales, the Company does not recognize revenues until delivery has occurred or performance measures are met. For rental revenue, the Company recognizes revenue when earned. |
| • | The seller’s price to the buyer is fixed or determinable. Sales prices are defined in writing in a customer’s purchase order, purchase contract or equipment rental agreement. |
| • | Collectibility is reasonably assured. The Company evaluates customer credit to ensure that collectibility of revenue is reasonably assured. |
Occasionally seismic customers are not able to take immediate delivery of products which were specifically manufactured to the customer’s specifications. These occasions generally occur when customers face logistical issues such as project delays or delays with their seismic crew deployment. In these instances, customers have asked the Company to hold the equipment for a short period of time until they can take physical delivery of the product (referred to as “bill and hold” arrangements). The Company considers the following criteria for recognizing revenue when delivery has not occurred:
| • | Whether the risks of ownership have passed to the customer, |
| • | Whether we have obtained a fixed commitment to purchase the goods in written documentation from the customer, |
| • | Whether the customer requested that the transaction be on a bill and hold basis and the Company received that request in writing, |
| • | Whether the customer has a substantial business purpose for ordering the goods on a bill and hold basis, |
| • | Whether there is a fixed schedule for delivery of the product, |
| • | Whether the Company has any specific performance obligations such that the earning process is not complete, |
| • | Whether the equipment is segregated from its other inventory and not subject to being used to fill other orders, and |
| • | Whether the equipment is complete and ready for shipment. |
The Company does not modify its normal billing and credit terms for these types of sales. As of September 30, 2011 and 2010, there were no sales under bill and hold arrangements. As of September 30, 2009, there were $0.6 million of sales under bill and hold arrangements.
Deferred Revenue
The Company records deferred revenue when funds are received prior to the recognition of the associated revenue.
F-12
Table of Contents
Research and Development Costs
The Company expenses research and development costs as incurred. Research and development costs include salaries, employee benefit costs, department supplies, direct project costs and other related costs.
Product Warranties
The Company offers a standard product warranty obligating it to repair or replace products with manufacturing defects. The Company maintains a reserve for future warranty costs based on historical experience or, in the absence of historical product experience, management’s estimates. Changes in the warranty reserve are contained in the following table (in thousands):
| Balance at the beginning of the period (October 1, 2009) |
$ | 832 | ||
| Accruals for warranties issued during the period | 3,219 | |||
| Accruals related to pre-existing warranties (including changes in estimates) | — | |||
| Settlements made (in cash or in kind) during the period | (2,673 | ) | ||
|
|
|
|||
| Balance at the end of the period (September 30, 2010) | 1,378 | |||
| Accruals for warranties issued during the period | 2,675 | |||
| Accruals related to pre-existing warranties (including changes in estimates) | — | |||
| Settlements made (in cash or in kind) during the period | (1,930 | ) | ||
|
|
|
|||
| Balance at the end of the period (September 30, 2011) | $ | 2,123 | ||
|
|
|
Stock-Based Compensation
Under the FASB share-based payment framework, the Company expenses the grant date fair value of equity awards over the requisite service period. The Company uses the Black-Scholes model to value its new stock option grants. The share-based payment framework also requires the Company to estimate forfeitures in calculating the expense related to stock-based compensation. In addition, the share-based payment framework requires the Company to reflect the benefits of tax deductions in excess of recognized compensation cost to be reported as a financing cash inflow. The Company recorded stock-based compensation expenses of $0.7 million, $0.4 million and $0.3 million for the fiscal years ended September 30, 2011, 2010 and 2009, respectively.
There were no stock options granted during fiscal year 2011 and 63,000 and 146,000 stock options granted during fiscal years 2010 and 2009, respectively. The fair value of options granted during the fiscal year ended September 30, 2010 and 2009 was estimated using the Black-Scholes option-pricing model using the following data:
| 2010 | 2009 | |||||||
| Dividend yield rate |
0 | % | 0 | % | ||||
| Risk-free interest rate |
2.4 | % | 2.1 | % | ||||
| Expected volatility |
56.6 | % | 51.4 | % | ||||
| Expected option term |
6.25 years | 6.25 years | ||||||
The computation of expected volatility was based on the historical volatility. Historical volatility was calculated from historical data for the time approximately equal to the expected term of the option award starting from the date of grant. The risk-free interest rate assumption is based upon the U.S. Treasury yield curve in effect at the time of grant for the period corresponding with the expected life of the option. The expected term of options granted is derived from the vesting period and historical information and represents the period of time that options granted are expected to be outstanding.
F-13
Table of Contents
Foreign Currency Gains and Losses
The assets and liabilities of the Company’s foreign subsidiaries have been translated into U.S. dollars using the exchange rates in effect at the balance sheet date. Results of operations have been translated using the average exchange rates during the year. Resulting translation adjustments have been recorded as a component of accumulated other comprehensive income (loss) in stockholders’ equity. Foreign currency transaction gains and losses are included in the statement of operations as they occur.
Shipping and Handling Costs
Amounts billed to a customer in a sales transaction related to reimbursable shipping and handling costs are included in revenues and the associated costs incurred by the Company for reimbursable shipping and handling costs are reported in cost of sales. The Company had shipping and handling costs of $0.7 million, $0.7 million and $0.6 million for each of the fiscal years ended September 30, 2011, 2010 and 2009, respectively.
Income Taxes
Income taxes are presented in accordance with FASB guidance for accounting for income taxes. The estimated future tax effects of temporary differences between the tax bases of assets and liabilities and amounts reported in the accompanying consolidated balance sheets, as well as operating loss and tax credit carrybacks and carryforwards are recorded. Deferred tax assets and liabilities are determined based on differences between financial reporting and tax bases of assets and liabilities (temporary differences) and are measured using the enacted tax rates and laws that will be in effect when the differences are expected to reverse. The Company periodically reviews the recoverability of tax assets recorded on the balance sheet and provides valuation allowances if it is more likely than not that such assets will not be realized.
Subsequent Events
The Company evaluates events and transactions that occur after the balance sheet date but before the financial statements are issued. The Company evaluated such events and transactions through the date the financial statements were filed electronically with the Securities and Exchange Commission.
Recent Accounting Pronouncements
In May 2011, the FASB issued guidance to amend certain measurement and disclosure requirements related to fair value measurements to improve consistency with international reporting standards. This guidance is effective prospectively for public entities for interim and annual reporting periods beginning after December 15, 2011, with early adoption by public entities prohibited, and is applicable to the Company’s fiscal quarter beginning October 1, 2012. The Company is currently evaluating this guidance, but does not expect its adoption will have a material effect on its consolidated financial statements.
In June 2011, the FASB issued new guidance on the presentation of comprehensive income that will require a company to present components of net income and other comprehensive income in one continuous statement or in two separate, but consecutive statements. There are no changes to the components that are recognized in net income or other comprehensive income under current GAAP. This guidance is effective for fiscal years, and interim periods within those fiscal years, beginning after December 15, 2011, with early adoption permitted. The new guidance has been early adopted by the Company and the components of net income and other comprehensive income are presented in two separate, but consecutive statements for the Company’s fiscal years ended September 30, 2011, 2010 and 2009.
In September 2011, the FASB issued new guidance on the testing of goodwill for impairment that provides the option to first assess qualitative factors to determine if the annual two-step test of goodwill for impairment must be performed. If, based on the qualitative assessment of events or circumstances, an entity determines it is not more likely than not that the goodwill fair value is less than its carrying amount then it is not necessary to perform the two-step impairment test. However, if an entity concludes otherwise, then the two-step impairment test must be
F-14
Table of Contents
performed to identify potential impairment and to measure the amount of goodwill impairment, if any. The new guidance was adopted for the annual goodwill impairment testing for the Company’s fiscal year ended September 30, 2011. The Company determined that it is more likely than not that the fair value of its goodwill was more than its carrying amount and the two-step process was not necessary for the fiscal year ended September 30, 2011.
2. Short-term Investments
| As of September 30, 2011 (in thousands) | ||||||||||||||||
| Amortized Cost |
Unrealized Gains |
Unrealized Losses |
Estimated Fair Value |
|||||||||||||
| Short-term investments: |
||||||||||||||||
| Corporate |
$ | 3,890 | $ | — | $ | (18 | ) | $ | 3,872 | |||||||
| Government |
1,054 | — | — | 1,054 | ||||||||||||
|
|
|
|
|
|
|
|
|
|||||||||
| Total |
$ | 4,944 | $ | — | $ | (18 | ) | $ | 4,926 | |||||||
|
|
|
|
|
|
|
|
|
|||||||||
Accumulated other comprehensive income (loss) reflected on the balance sheet at September 30, 2011 includes unrealized losses (net of tax) of $12,000.
3. Fair Value of Financial Instruments
At June 30, 2011, the Company’s financial instruments included cash and cash equivalents, short-term investments, trade and other receivables, other current assets, accounts payable and other current liabilities. Due to the short-term maturities of cash and cash equivalents, trade and other receivables, other current assets, accounts payable and other current liabilities, the carrying amounts approximate fair value on the respective balance sheet dates.
The Company measures short-term investments at fair value on a recurring basis. The fair value measurement of the Company’s short-term investments was determined using the following inputs:
| As of September 30, 2011 (in thousands) | ||||||||||||||||
| Total | Quoted Prices in Active Markets for Identical Assets (Level 1) |
Significant Other Observable (Level 2) |
Significant Unobservable (Level 3) |
|||||||||||||
| Short-term investments: |
||||||||||||||||
| Corporate bonds |
$ | 3,872 | $ | 3,872 | $ | — | $ | — | ||||||||
| Government bonds |
1,054 | 1,054 | — | — | ||||||||||||
|
|
|
|
|
|
|
|
|
|||||||||
| Total |
$ | 4,926 | $ | 4,926 | $ | — | $ | — | ||||||||
|
|
|
|
|
|
|
|
|
|||||||||
Investments in corporate and government bonds classified as available-for-sale are measured using the quoted market prices (Level 1) as of September 30, 2011.
F-15
Table of Contents
4. Inventories:
Inventories consisted of the following (in thousands):
| AS OF SEPTEMBER 30, | ||||||||
| 2011 | 2010 | |||||||
| Finished goods and sub-assemblies |
$ | 20,430 | $ | 11,211 | ||||
| Work in progress |
14,255 | 7,166 | ||||||
| Raw materials |
47,257 | 35,663 | ||||||
| Obsolescence reserve |
(9,552 | ) | (6,645 | ) | ||||
|
|
|
|
|
|||||
| $ | 72,390 | $ | 47,395 | |||||
|
|
|
|
|
|||||
Inventory obsolescence expense was approximately $4.6 million, $2.9 million and $1.3 million during fiscal years 2011, 2010 and 2009, respectively.
5. Accounts and Notes Receivable:
The Company’s current trade accounts receivable consisted of the following (in thousands):
| AS OF SEPTEMBER 30, | ||||||||
| 2011 | 2010 | |||||||
| Trade accounts receivable |
$ | 20,172 | $ | 19,441 | ||||
| Allowance for doubtful accounts |
(411 | ) | (334 | ) | ||||
|
|
|
|
|
|||||
| $ | 19,761 | $ | 19,107 | |||||
|
|
|
|
|
|||||
The allowance for doubtful accounts represents the Company’s best estimate of probable credit losses. The Company determines the allowance based upon historical experience and a review of its balances. Accounts receivable balances are charged off against the allowance whenever it is probable that the receivable will not be recoverable. The Company does not have any off-balance-sheet credit exposure related to its customers.
Current notes receivable are reflected in the following table (in thousands):
| AS OF SEPTEMBER 30, | ||||||||
| 2011 | 2010 | |||||||
| Current notes receivable |
$ | 2,100 | $ | 2,400 | ||||
| Allowance for doubtful notes |
— | — | ||||||
|
|
|
|
|
|||||
| $ | 2,100 | $ | 2,400 | |||||
|
|
|
|
|
|||||
Non-current notes receivable are reflected in the following table (in thousands):
| AS OF SEPTEMBER 30, | ||||||||
| 2011 | 2010 | |||||||
| Non-current notes receivable |
$ | 3,706 | $ | 6,131 | ||||
| Allowance for doubtful notes |
— | — | ||||||
|
|
|
|
|
|||||
| $ | 3,706 | $ | 6,131 | |||||
|
|
|
|
|
|||||
Notes receivable are generally collateralized by the products sold, and bear interest at rates ranging up to 14.5% per year. The annual maturities of notes receivable will be approximately $2.1 million, $1.6 million, $1.7 million and $0.3 million, respectively, at various times through December 2015. The Company has, on occasion, extended or renewed notes receivable as they mature, but there is no obligation to do so.
F-16
Table of Contents
6. Rental Equipment:
Rental equipment consisted of the following (in thousands):
| AS OF SEPTEMBER 30, | ||||||||
| 2011 | 2010 | |||||||
| Rental equipment, primarily geophones and related products |
$ | 21,250 | $ | 19,421 | ||||
| Accumulated depreciation |
(9,305 | ) | (11,418 | ) | ||||
|
|
|
|
|
|||||
| $ | 11,945 | $ | 8,003 | |||||
|
|
|
|
|
|||||
Rental equipment depreciation expense was $2.8 million, $1.1 million and $0.8 million in fiscal years 2011, 2010 and 2009, respectively. We transferred $0.3 million and $0.3 million of inventories to our rental equipment during fiscal years 2011 and 2010 which had a non-cash impact.
7. Property, Plant and Equipment:
Property, plant and equipment consisted of the following (in thousands):
| AS OF SEPTEMBER 30, | ||||||||
| 2011 | 2010 | |||||||
| Land and land improvements |
$ | 3,230 | $ | 3,214 | ||||
| Buildings and building improvements |
24,520 | 23,895 | ||||||
| Machinery and equipment |
33,723 | 30,313 | ||||||
| Furniture and fixtures |
1,059 | 990 | ||||||
| Transportation equipment |
30 | 35 | ||||||
| Tools and molds |
359 | 237 | ||||||
| Construction in progress |
3,595 | 3,105 | ||||||
|
|
|
|
|
|||||
| 66,516 | 61,789 | |||||||
| Accumulated depreciation |
(31,824 | ) | (27,801 | ) | ||||
|
|
|
|
|
|||||
| $ | 34,692 | $ | 33,988 | |||||
|
|
|
|
|
|||||
Property, plant and equipment depreciation expense was $3.9 million, $3.8 million and $4.1 million in fiscal years 2011, 2010 and 2009, respectively.
8. Notes Payable and Long-Term Debt:
Notes payable and long-term debt consisted of the following (in thousands):
| AS OF SEPTEMBER 30, | ||||||||
| 2011 | 2010 | |||||||
| Mortgage note payable, original mortgage was refinanced in March 2008 and is due in monthly installments of $37 with interest at LIBOR plus 150 basis points through February 2028, with remaining principal and interest due March 2028, collateralized by certain land and building having a net book value of $12.9 million |
— | 7,700 | ||||||
| Less current portion |
— | (440 | ) | |||||
|
|
|
|
|
|||||
| $ | — | $ | 7,260 | |||||
|
|
|
|
|
|||||
On December 15, 2010 the Company paid off a long-term mortgage note with a principal balance outstanding of $7.7 million. The Company was not required to pay any additional fees as a result of the early extinguishment of the mortgage note.
On March 2, 2011, the Company entered into a new credit agreement (as amended, the “New Credit Agreement”) with a bank. Under the New Credit Agreement, the Company can borrow up to $25.0 million principally secured by its accounts receivable, inventories and equipment. In addition, certain domestic subsidiaries
F-17
Table of Contents
of the Company have guaranteed the obligations of the Company under the New Credit Agreement and such subsidiaries have secured the obligations by the pledge of certain of the assets of such subsidiaries. The New Credit Agreement expires on March 2, 2014. The New Credit Agreement limits the incurrence of additional indebtedness, requires the maintenance of certain financial ratios, restricts the Company and its subsidiaries’ ability to pay dividends and contains other covenants customary in agreements of this type. The interest rate for borrowings under the New Credit Agreement is a LIBOR based rate with a margin spread of 250-350 basis points depending upon the maintenance of certain ratios. At September 30, 2011, the Company was in compliance with all covenants. At September 30, 2011, there were no borrowings outstanding under the New Credit Agreement, standby letters of credit outstanding in the amount of $0.2 million and additional borrowings available were $24.8 million.
Prior to entering into the New Credit Agreement, several of the Company’s subsidiaries were a party to a credit agreement (the “Previous Credit Agreement”) with a bank, and could borrow up to $25.0 million secured principally by the subsidiaries’ accounts receivable and inventories. The Previous Credit Agreement, as amended, was scheduled to expire on April 30, 2011; however, this agreement was terminated on March 2, 2011 and replaced by the New Credit Agreement. Borrowings under the Previous Credit Agreement were subject to borrowing base restrictions based on levels of eligible accounts receivable and inventories. The Previous Credit Agreement limited the incurrence of additional indebtedness, required the maintenance of certain financial amounts, restricted the Company’s and the borrower subsidiaries’ ability to pay dividends and contained other covenants customary in agreements of this type.
9. Accrued Expenses and Other Current Liabilities:
Accrued expenses and other current liabilities consisted of the following (in thousands):
| AS OF SEPTEMBER 30, | ||||||||
| 2011 | 2010 | |||||||
| Employee bonuses |
$ | 4,167 | $ | 3,331 | ||||
| Product warranty |
2,123 | 1,378 | ||||||
| Compensated absences |
1,206 | 1,037 | ||||||
| Legal and professional fees |
475 | 517 | ||||||
| Payroll |
198 | 1,811 | ||||||
| Property taxes |
1,215 | 1,270 | ||||||
| Medical claims |
372 | 371 | ||||||
| Other |
1,628 | 1,078 | ||||||
|
|
|
|
|
|||||
| $ | 11,384 | $ | 10,793 | |||||
|
|
|
|
|
|||||
The Company is self-insured for certain losses related to employee medical claims. The Company has purchased stop-loss coverage for individual claims in excess of $150,000 per claimant per year in order to limit its exposure to any significant levels of employee medical claims. Self-insured losses are accrued based on the Company’s historical experience and on estimates of aggregate liability for uninsured claims incurred using certain actuarial assumptions followed in the insurance industry.
10. Employee Benefits:
The Company’s employees are participants in the OYO Geospace Corporation Employee’s 401(k) Retirement Plan (the “Plan”), which covers substantially all eligible employees in the United States. The Plan is a qualified salary reduction plan in which all eligible participants may elect to have a percentage of their compensation contributed to the Plan, subject to certain guidelines issued by the Internal Revenue Service. The Company’s share of discretionary matching contributions was approximately $0.6 million, $0.5 million and $0.5 million in fiscal years 2011, 2010 and 2009, respectively.
The Company’s stock incentive plans in which employees may participate are discussed in Note 11 to these Consolidated Financial Statements.
F-18
Table of Contents
The Company’s employees are also participants in the OYO Geospace Corporation Fiscal Year 2011 Bonus Plan (the “Bonus Plan”). Every employee of the Company is eligible to participate in Tier I of the Bonus Plan except for its employees in the Russian Federation, who participate in a local plan. Under Tier I, employees share proportionally in the Company’s profit based on each employee’s relative payroll. The Tier I bonus pool is established by accruing 14.5% of consolidated pretax profits (before bonus) above a specified range. Selected employees are eligible to participate in Tier II of the Bonus Plan, which applies after Tier I is fully funded. The Tier II Bonus pool is established by accruing 14.5% of consolidated pretax profits (before bonus) within a specified range. Under Tier II, participants share in the bonus pool based on their respective working groups meeting predefined goals. The Company recorded bonus expense of $4.2 million, $3.3 million and zero for the fiscal years 2011, 2010 and 2009, respectively.
11. Stockholders’ Equity:
In September 1997, the board of directors and stockholders approved the 1997 Key Employee Stock Option Plan (the “Employee Plan”), and, following amendments thereto, there has been reserved an aggregate of 1,125,000 shares of common stock for issuance thereunder. In November 1997, the board of directors and stockholders approved the Company’s 1997 Non-Employee Director Plan (the “Director Plan”) and following an amendment thereto, there has been reserved an aggregate of 150,000 shares of common stock for issuance thereunder. At September 30, 2011, the shares of common stock available for grant under the Employee Plan and Director Plan were 92,175 and 45,721, respectively.
Under the Employee Plan, the Company is authorized to grant nonqualified and incentive stock options to purchase common stock and restricted stock awards of common stock to key employees of the Company. Options have a term not to exceed ten years, with the exception of incentive stock options granted to employees owning ten percent or more of the outstanding shares of common stock, which have a term not to exceed five years. The exercise price of any option may not be less than the fair market value of the common stock on the date of grant. In the case of incentive stock options granted to an employee owning ten percent or more of the outstanding shares of common stock, the exercise price of such option may not be less than 110% of the fair market value of the common stock on the date of grant. Options vest over a four-year period commencing on the date of grant in 25% annual increments. Under the Employee Plan, the Company may issue shares of restricted stock to employees for no payment by the employee or for a payment below the fair market value on the date of grant. The restricted stock is subject to certain restrictions described in the Employee Plan, with no restrictions continuing for more than ten years from the date of the award.
The Company has not issued any shares of restricted stock under the Employee Plan since August 1, 2001. All issued shares of restricted stock are fully vested; thus there are no outstanding shares of restricted stock. The prior issuances by the Company of restricted stock were recorded at the fair value of the stock subject to those awards and were recorded as a component of stockholders’ equity, with a credit to additional paid-in capital. The Company recorded compensation expense based on the vesting criteria of the individual awards. The Company will account for future issuances of restricted stock awards in accordance with applicable guidelines, which require that stock-based awards be measured and recognized at fair value.
The Company established the Director Plan pursuant to which options to purchase shares of common stock are granted annually to non-employee directors and pursuant to which a portion of the annual fees paid for the services of such non-employee directors is payable in shares of common stock based on the fair market value thereof at the date of grant. However, as disclosed in our Current Report on Form 8-K filed with the Securities and Exchange Commission, on February 21, 2007, the Board of Directors of the Company approved a new compensation structure for non-employee directors, as recommended by the Board of Director’s Compensation Committee. Pursuant to an amendment to the Director Plan adopted at the same meeting, the annual options to non-employee directors will no longer be granted. Options granted under the Director Plan prior to the adoption of this amendment have a term of ten years. The exercise price of each option granted is the fair market value of the common stock on the date of grant. Options vest over a one-year period commencing on the date of grant.
Effective November 5, 1999, the board of directors approved the OYO Geospace Corporation 1999 Broad-Based Option Plan (the “Broad-Based Plan”) and reserved an aggregate of 50,000 shares for issuance thereunder. Under the Broad-Based Plan, the Company is authorized to issue to all employees (except executive officers and employee directors) nonqualified stock options to purchase common stock of the Company. These options have a
F-19
Table of Contents
term not to exceed ten years. The exercise price of any broad-based option may not be less than the fair market value of the common stock on the date of grant. These options vest over a one-year period commencing on the date of grant. There were 19,000 shares available for grant under this plan at September 30, 2011.
A summary of the activity with respect to stock options is as follows:
| Shares | Weighted Average Exercise Price |
|||||||
| Outstanding at September 30, 2008 |
380,750 | 12.81 | ||||||
| Granted |
146,000 | 17.56 | ||||||
| Exercised |
(58,400 | ) | 14.39 | |||||
| Forfeited |
(100 | ) | 11.25 | |||||
| Expired |
— | — | ||||||
|
|
|
|||||||
| Outstanding at September 30, 2009 |
468,250 | 14.10 | ||||||
| Granted |
63,000 | 50.08 | ||||||
| Exercised |
(122,450 | ) | 17.85 | |||||
| Forfeited |
(100 | ) | 11.25 | |||||
| Expired |
— | — | ||||||
|
|
|
|||||||
| Outstanding at September 30, 2010 |
408,700 | 18.53 | ||||||
| Granted |
— | — | ||||||
| Exercised |
(233,900 | ) | 11.79 | |||||
| Forfeited |
(2,000 | ) | 17.56 | |||||
| Expired |
— | — | ||||||
|
|
|
|||||||
| Outstanding at September 30, 2011 |
172,800 | 21.35 | ||||||
|
|
|
|||||||
The number of stock options vested during fiscal years 2011, 2010 and 2009 were 51,250, 37,750 and 2,000, respectively. The fair values of stock options vested during fiscal years 2011, 2010 and 2009 were $0.7 million, $0.3 million and $29,000, respectively.
The following table summarizes information about stock options outstanding and exercisable at September 30, 2011:
| Options Outstanding | Options Exercisable | |||||||||||||||||||
| Range of Exercise Prices |
Shares | Weighted Average Remaining Term (in years) |
Weighted Average Exercise Price |
Shares | Weighted Average Remaining Term (in years) |
Weighted Average Exercise Price |
||||||||||||||
| $ 6.81 to $13.49 |
14,650 | 1.5 | $ | 8.43 | 14,650 | 1.5 | $ | 8.43 | ||||||||||||
| $13.50 to $19.99 |
100,650 | 7.2 | 17.56 | 29,650 | 7.1 | 17.58 | ||||||||||||||
| $20.00 to $53.95 |
57,500 | 8.8 | 50.20 | 10,250 | 8.9 | 50.75 | ||||||||||||||
|
|
|
|
|
|||||||||||||||||
| 172,800 | 7.3 | 27.65 | 54,550 | 5.9 | 21.35 | |||||||||||||||
|
|
|
|
|
|||||||||||||||||
As of September 30, 2011 total unvested compensation expense associated with stock options amounted to $1.5 million and will be recognized over the next four fiscal years.
F-20
Table of Contents
12. Income Taxes:
Components of income before income taxes were as follows (in thousands):
| YEAR ENDED SEPTEMBER 30, | ||||||||||||
| 2011 | 2010 | 2009 | ||||||||||
| United States |
$ | 43,414 | $ | 21,404 | $ | 6,910 | ||||||
| Foreign |
1,205 | (502 | ) | (3,599 | ) | |||||||
|
|
|
|
|
|
|
|||||||
| $ | 44,619 | $ | 20,902 | $ | 3,311 | |||||||
|
|
|
|
|
|
|
|||||||
The provision (benefit) for income taxes consisted of the following (in thousands):
| YEAR ENDED SEPTEMBER 30, | ||||||||||||
| 2011 | 2010 | 2009 | ||||||||||
| Current: |
||||||||||||
| Federal |
$ | 15,281 | $ | 8,131 | $ | 958 | ||||||
| Foreign |
66 | (109 | ) | 47 | ||||||||
| State |
279 | 214 | 95 | |||||||||
|
|
|
|
|
|
|
|||||||
| 15,626 | 8,236 | 1,100 | ||||||||||
|
|
|
|
|
|
|
|||||||
| Deferred: |
||||||||||||
| Federal |
(1,228 | ) | (1,394 | ) | 1,303 | |||||||
| Foreign |
510 | (22 | ) | (852 | ) | |||||||
|
|
|
|
|
|
|
|||||||
| (718 | ) | (1,416 | ) | 451 | ||||||||
|
|
|
|
|
|
|
|||||||
| $ | 14,908 | $ | 6,820 | $ | 1,551 | |||||||
|
|
|
|
|
|
|
|||||||
Actual income tax expense (benefit) differs from income tax expense computed by applying the statutory federal tax rate of 35.0%, 35.0% and 34.0% for fiscal years ended September 30, 2011, 2010 and 2009, respectively, as follows (in thousands):
| YEAR ENDED SEPTEMBER 30, | ||||||||||||
| 2011 | 2010 | 2009 | ||||||||||
| Provision for U.S. federal income tax at statutory rate |
$ | 15,617 | $ | 7,313 | $ | 1,126 | ||||||
| Effect of foreign income taxes |
(244 | ) | (19 | ) | 415 | |||||||
| Manufacturers’/producers’ deduction |
(921 | ) | (504 | ) | (89 | ) | ||||||
| Research and experimentation tax credits |
(750 | ) | (27 | ) | (181 | ) | ||||||
| State income taxes, net of federal income tax benefit |
181 | 139 | 61 | |||||||||
| Nondeductible expenses |
504 | 197 | 92 | |||||||||
| Resolution of prior years’ tax matters |
(116 | ) | (121 | ) | (45 | ) | ||||||
| Contingency for uncertainty in income taxes |
632 | (123 | ) | 49 | ||||||||
| Other items |
5 | (35 | ) | 123 | ||||||||
|
|
|
|
|
|
|
|||||||
| $ | 14,908 | $ | 6,820 | $ | 1,551 | |||||||
|
|
|
|
|
|
|
|||||||
| 33.4 | % | 32.6 | % | 46.8 | % | |||||||
|
|
|
|
|
|
|
|||||||
F-21
Table of Contents
Deferred income taxes under the liability method reflect the net tax effects of temporary differences between the carrying amounts of assets and liabilities for financial reporting purposes and the amounts used for income tax purposes. Significant components of the Company’s net deferred income tax asset were as follows (in thousands):
| AS OF SEPTEMBER 30, 2011 | AS OF SEPTEMBER 30, 2010 | |||||||||||||||||||||||
| U. S. | Non U.S. | Total | U. S. | Non U.S. | Total | |||||||||||||||||||
| Deferred income tax assets: |
||||||||||||||||||||||||
| Allowance for doubtful accounts |
$ | 97 | $ | 2 | $ | 99 | $ | 78 | $ | 1 | $ | 79 | ||||||||||||
| Inventories |
4,335 | — | 4,335 | 2,930 | 108 | 3,038 | ||||||||||||||||||
| Capitalized research and development costs |
355 | — | 355 | 706 | — | 706 | ||||||||||||||||||
| Property, plant and equipment and other |
— | 71 | 71 | — | 344 | 344 | ||||||||||||||||||
| Intangible assets |
— | — | — | 28 | — | 28 | ||||||||||||||||||
| Net operating loss carryforwards, tax credits and deferrals |
— | 433 | 433 | — | 410 | 410 | ||||||||||||||||||
| Stock-based compensation |
333 | — | 333 | 487 | — | 487 | ||||||||||||||||||
| Accrued product warranty |
723 | 11 | 734 | 468 | 8 | 476 | ||||||||||||||||||
| Accrued compensated absences |
408 | — | 408 | 350 | — | 350 | ||||||||||||||||||
| Comprehensive income |
— | — | — | 81 | — | 81 | ||||||||||||||||||
| Insurance and other reserves |
788 | 31 | 819 | 602 | 88 | 690 | ||||||||||||||||||
|
|
|
|
|
|
|
|
|
|
|
|
|
|||||||||||||
| 7,039 | 548 | 7,587 | 5,730 | 959 | 6,689 | |||||||||||||||||||
| Deferred income tax liabilities: |
||||||||||||||||||||||||
| Allowance for doubtful accounts |
— | (120 | ) | (120 | ) | — | (92 | ) | (92 | ) | ||||||||||||||
| Intangible assets |
(58 | ) | — | (58 | ) | — | — | — | ||||||||||||||||
| Comprehensive income |
(92 | ) | — | (92 | ) | — | — | — | ||||||||||||||||
| Property, plant and equipment and other |
(2,645 | ) | — | (2,645 | ) | (2,542 | ) | — | (2,542 | ) | ||||||||||||||
|
|
|
|
|
|
|
|
|
|
|
|
|
|||||||||||||
| Net deferred income tax asset |
$ | 4,244 | $ | 428 | $ | 4,672 | $ | 3,188 | $ | 867 | $ | 4,055 | ||||||||||||
|
|
|
|
|
|
|
|
|
|
|
|
|
|||||||||||||
The Company has net operating losses at its Russian subsidiary that can be carried forward six years. Such net operating losses will expire beginning after fiscal year 2015.
Deferred income taxes are reported as follows in the accompanying consolidated balance sheet (in thousands):
| AS OF SEPTEMBER 30, | ||||||||
| 2011 | 2010 | |||||||
| Current deferred income tax asset |
$ | 6,356 | $ | 4,542 | ||||
| Noncurrent deferred income tax asset |
505 | 754 | ||||||
| Current deferred income tax liability |
(82 | ) | — | |||||
| Noncurrent deferred income tax liability |
(2,107 | ) | (1,241 | ) | ||||
|
|
|
|
|
|||||
| $ | 4,672 | $ | 4,055 | |||||
|
|
|
|
|
|||||
A valuation allowance is provided when it is more likely than not that some portion or all of the deferred tax assets will not be realized. Based on the Company’s expectation that the deductible temporary differences will reverse during periods in which the Company generates net taxable income or during periods in which losses can be carried back to offset prior year taxes, management believes that the Company will realize the benefit of its net deferred income tax assets.
F-22
Table of Contents
The financial reporting bases of investments in foreign subsidiaries exceed their tax bases. A deferred tax liability is not recorded for this temporary difference because the investment is essentially permanent. A reversal of the Company’s plans to permanently invest in these foreign operations would cause the excess to become taxable. At September 30, 2011 and 2010, the temporary difference related to undistributed earnings for which no deferred taxes have been provided was approximately $14.6 million and $14.0 million, respectively. The Company will need to reassess and reassert its ability and intent to indefinitely reinvest the remaining foreign earnings in order to continue the application of the exception under FASB guidelines.
From time to time the Company is the subject of audits by various tax authorities that can result in claims and assessments and additional tax payments, penalties and interest. The United States Internal Revenue Service (“IRS”) is in the process of conducting an audit of the Company’s United States Federal income tax returns for fiscal years 2009, 2008 and 2007. Management believes that the outcome of such audit will not have a material effect on the Company’s financial position, results of operations or cash flows.
Effective October 1, 2007, the Company adopted the provisions of the FASB guidance for accounting for uncertainty in income taxes. The Company classifies interest and penalties associated with the payment of income taxes in the Other Income (Expense) section of its consolidated statement of operations. Tax return filings, which are subject to review by local tax authorities by major jurisdiction, are as follows:
| • | United States – fiscal years ended September 2007, 2008, 2009, 2010 and 2011 |
| • | State of Texas – fiscal years ended September 2007, 2008, 2009, 2010 and 2011 |
| • | Russian Federation – calendar years 2008, 2009, 2010 and 2011 |
| • | Canada – fiscal years ended September 2007, 2008, 2009, 2010 and 2011 |
| • | United Kingdom – fiscal years 2007, 2008, 2009, 2010 and 2011 |
The following table is a reconciliation of the total amounts of unrecognized tax benefits (in thousands):
| Balance at October 1, 2008 |
$ | 192 | ||
| Change in prior year tax positions |
26 | |||
| Current tax positions |
23 | |||
| Lapse of statute of limitations |
— | |||
|
|
|
|||
| Balance at September 30, 2009 |
241 | |||
| Change in prior year tax positions |
(73 | ) | ||
| Current tax positions |
77 | |||
| Lapse of statute of limitations |
(25 | ) | ||
|
|
|
|||
| Balance at September 30, 2010 |
220 | |||
| Change in prior year tax positions |
581 | |||
| Current tax positions |
61 | |||
| Lapse of statute of limitations |
(10 | ) | ||
|
|
|
|||
| Balance at September 30, 2011 |
$ | 852 | ||
|
|
|
The Company believes that it is reasonably possible the unrecognized tax benefits could change within the next 12 months based on the resolution of on-going income tax audits. At this time it is not possible to determine the range of such changes.
These unrecognized tax benefits would favorably affect the Company’s effective tax rate in future periods if they are favorably resolved.
Management believes that adequate provisions for income taxes have been reflected in the financial statements and is not aware of any significant exposure items that have not been reflected in the financial statements. Amounts considered probable of settlement within one year have been included in the accrued expenses and other liabilities in the accompanying consolidated balance sheet.
F-23
Table of Contents
13. Earnings Per Common Share:
Basic earnings per share is computed by dividing net earnings available to common stockholders by the weighted average number of common shares outstanding during the period. Diluted earnings per share is determined on the assumption that outstanding dilutive stock options have been exercised and the aggregate proceeds as defined were used to reacquire common stock using the average price of such common stock for the period.
The following table summarizes the calculation of weighted average common shares and common equivalent shares outstanding for purposes of basic and diluted earnings per share (in thousands, except share and per share amounts):
| YEAR ENDED SEPTEMBER 30, | ||||||||||||
| 2011 | 2010 | 2009 | ||||||||||
| Net income |
$ | 29,711 | $ | 14,082 | $ | 1,760 | ||||||
| Weighted average common shares and common share equivalents: |
||||||||||||
| Common shares |
6,220,657 | 6,031,314 | 5,950,403 | |||||||||
| Common share equivalents |
65,667 | 161,704 | 128,975 | |||||||||
|
|
|
|
|
|
|
|||||||
| Total weighted average common shares and common share equivalents |
6,286,324 | 6,193,018 | 6,079,378 | |||||||||
|
|
|
|
|
|
|
|||||||
| Earnings per share: |
||||||||||||
| Basic |
$ | 4.78 | $ | 2.33 | $ | 0.30 | ||||||
|
|
|
|
|
|
|
|||||||
| Diluted |
$ | 4.73 | $ | 2.27 | $ | 0.29 | ||||||
|
|
|
|
|
|
|
|||||||
Options totaling zero, 63,000 and 13,200 shares of common stock in fiscal years 2011, 2010 and 2009 respectively, were not included in the calculation of weighted average shares for diluted earnings per share because their effects were antidilutive.
14. Related Party Transactions:
Sales to OYO Japan and other affiliated companies were approximately $1.3 million, $0.8 million and $1.1 million during fiscal years 2011, 2010 and 2009, respectively. Purchases of inventory from OYO Japan and other affiliated companies were approximately $0.2 million in each of fiscal years 2011, 2010 and 2009, respectively.
15. Commitments and Contingencies:
Operating Leases
The Company only leases office space and certain equipment under short-term operating leases; therefore, the Company does not have future minimum rental commitments under long-term noncancelable operating leases. Rent expense was approximately $10,000, $18,000 and $0.1 million during fiscal years 2011, 2010 and 2009, respectively.
Legal Proceedings
From time to time the Company is a party to what it believes is routine litigation and proceedings that may be considered as part of the ordinary course of its business. Legal expenses related to such matters are expensed as incurred.
On July 8, 2009, the Company received a complaint filed in the United States District Court in Nevada alleging that the Geospace Seismic Recorder (“GSR”), the Company’s newly developed wireless data acquisition system, infringes a patent held by Ascend Geo, LLC (“Ascend”). The Company requested and was granted a change in venue to the United States District Court for the Southern District of Texas in Houston (the “Court”). In addition to monetary damages, Ascend requested a preliminary injunction against future sales by the Company of
F-24
Table of Contents
the GSR nodal system. The Company filed its response with the Court requesting that it deny Ascend’s request for a preliminary injunction and, on November 4, 2009, the Court denied Ascend’s request for a preliminary injunction. On January 4, 2011, the Court dismissed Ascend’s case with prejudice. On April 5, 2011, the U.S. Patent and Trademark Office cancelled all claims of Ascend’s patent.
16. Supplemental Cash Flow Information:
Supplemental cash flow information is as follows (in thousands):
| YEAR ENDED SEPTEMBER 30, | ||||||||||||
| 2011 | 2010 | 2009 | ||||||||||
| Cash paid for: |
||||||||||||
| Interest |
$ | 44 | $ | 253 | $ | 336 | ||||||
| Income taxes |
12,966 | 5,289 | 4,121 | |||||||||
| Noncash investing and financing activities: |
||||||||||||
| Accrued capital expenditures |
2 | 34 | 126 | |||||||||
F-25
Table of Contents
17. Segment and Geographic Information:
The Company evaluates financial performance based on two business segments: Seismic and Thermal Solutions. The Seismic product lines currently consist of geophones and hydrophones, including multi-component geophones and hydrophones, seismic leader wire, geophone string connectors, seismic telemetry cables, high definition reservoir characterization products and services, marine seismic cable retrieval devices, data acquisition systems, offshore cables and industrial products. Thermal Solutions products include thermal printers, thermal printheads and dry thermal film and other media. The Company sells these products to a variety of markets, including the screen print, point of sale, signage and textile markets. The Company also sells these Thermal Solutions products to its seismic customers.
The following tables summarize the Company’s segment information:
| YEAR ENDED SEPTEMBER 30, | ||||||||||||
| 2011 | 2010 | 2009 | ||||||||||
| Net sales: |
||||||||||||
| Seismic |
$ | 158,653 | $ | 114,774 | $ | 79,043 | ||||||
| Thermal Solutions |
13,519 | 12,955 | 13,028 | |||||||||
| Corporate |
798 | 804 | 789 | |||||||||
|
|
|
|
|
|
|
|||||||
| Total |
172,970 | 128,533 | 92,860 | |||||||||
|
|
|
|
|
|
|
|||||||
| Income (loss) from operations: |
||||||||||||
| Seismic |
53,477 | 28,955 | 10,591 | |||||||||
| Thermal Solutions |
(37 | ) | 397 | 370 | ||||||||
| Corporate |
(9,035 | ) | (8,244 | ) | (7,352 | ) | ||||||
|
|
|
|
|
|
|
|||||||
| Total |
44,405 | 21,108 | 3,609 | |||||||||
|
|
|
|
|
|
|
|||||||
| Depreciation, amortization and stock-based compensation: |
||||||||||||
| Seismic |
5,990 | 3,995 | 3,610 | |||||||||
| Thermal Solutions |
345 | 375 | 598 | |||||||||
| Corporate |
1,448 | 1,259 | 1,264 | |||||||||
|
|
|
|
|
|
|
|||||||
| Total |
7,783 | 5,629 | 5,472 | |||||||||
|
|
|
|
|
|
|
|||||||
| Interest income: |
||||||||||||
| Seismic |
139 | 165 | 801 | |||||||||
| Thermal Solutions |
— | — | 8 | |||||||||
| Corporate |
128 | 89 | — | |||||||||
|
|
|
|
|
|
|
|||||||
| Total |
267 | 254 | 809 | |||||||||
|
|
|
|
|
|
|
|||||||
| Interest expense: |
||||||||||||
| Seismic |
— | — | — | |||||||||
| Thermal Solutions |
— | — | — | |||||||||
| Corporate |
43 | 238 | 602 | |||||||||
|
|
|
|
|
|
|
|||||||
| Total |
43 | 238 | 602 | |||||||||
|
|
|
|
|
|
|
|||||||
| * | The Company’s manufacturing operations for its Seismic and Thermal Solutions business segments are combined. Therefore, the Company does not segregate and report separate balance sheet accounts for these segments. As a result, the Company does not report business segment balance sheet information. |
“Corporate” net sales consists of rental revenue earned from an operating lease of a surplus building located in Houston, Texas. “Corporate” loss from operations primarily consists of the Company’s Houston headquarter general and administrative expenses.
F-26
Table of Contents
The Company generates product sales and rentals from its subsidiaries in the United States, Canada, the Russian Federation and the United Kingdom. Sales information for the Company is as follows (in thousands):
| YEAR ENDED SEPTEMBER 30, | ||||||||||||
| 2011 | 2010 | 2009 | ||||||||||
| United States |
$ | 155,781 | $ | 127,972 | $ | 87,371 | ||||||
| Canada |
8,966 | 3,706 | 3,526 | |||||||||
| Russian Federation |
10,144 | 7,973 | 4,152 | |||||||||
| United Kingdom |
4,883 | 3,432 | 2,835 | |||||||||
| Eliminations |
(6,804 | ) | (14,550 | ) | (5,024 | ) | ||||||
|
|
|
|
|
|
|
|||||||
| $ | 172,970 | $ | 128,533 | $ | 92,860 | |||||||
|
|
|
|
|
|
|
|||||||
Summaries of net sales by geographic area for fiscal years 2011, 2010 and 2009 are as follows (in thousands):
| YEAR ENDED SEPTEMBER 30, | ||||||||||||
| 2011 | 2010 | 2009 | ||||||||||
| Asia (excluding Japan and Middle East) |
$ | 18,542 | $ | 7,521 | $ | 9,114 | ||||||
| Canada |
13,158 | 6,011 | 10,730 | |||||||||
| Europe |
34,278 | 13,375 | 16,357 | |||||||||
| Japan |
4,230 | 4,163 | 971 | |||||||||
| Middle East |
6,588 | 9,441 | 14,236 | |||||||||
| United States |
92,368 | 85,423 | 40,254 | |||||||||
| Other |
3,806 | 2,599 | 1,198 | |||||||||
|
|
|
|
|
|
|
|||||||
| $ | 172,970 | $ | 128,533 | $ | 92,860 | |||||||
|
|
|
|
|
|
|
|||||||
Net sales are attributed to countries based on the ultimate destination of the product sold, if known. If the ultimate destination is not known, net sales are attributed to countries based on the geographic location of the initial shipment.
Long-lived assets were as follows (in thousands):
| AS OF SEPTEMBER 30, | ||||||||
| 2011 | 2010 | |||||||
| United States |
$ | 43,992 | $ | 35,315 | ||||
| Canada |
5,135 | 12,504 | ||||||
| Russian Federation |
4,108 | 4,387 | ||||||
| United Kingdom |
471 | 510 | ||||||
| China |
8 | 8 | ||||||
|
|
|
|
|
|||||
| $ | 53,714 | $ | 52,724 | |||||
|
|
|
|
|
|||||
F-27
Table of Contents
18. Selected Quarterly Information (Unaudited):
The following table represents summarized data for each of the quarters in fiscal years 2011 and 2010 (in thousands, except per share amounts):
| 2011 | ||||||||||||||||
| Fourth Quarter |
Third Quarter |
Second Quarter |
First Quarter |
|||||||||||||
| Net sales |
$ | 32,805 | $ | 46,368 | $ | 50,696 | $ | 43,101 | ||||||||
| Gross profit |
12,780 | 20,556 | 21,684 | 19,093 | ||||||||||||
| Income from operations |
6,049 | 13,511 | 13,048 | 11,797 | ||||||||||||
| Other income (expense), net |
94 | 25 | (44 | ) | 139 | |||||||||||
| Net income |
3,589 | 9,207 | 8,702 | 8,213 | ||||||||||||
| Basic earnings per share |
$ | 0.57 | $ | 1.47 | $ | 1.41 | $ | 1.34 | ||||||||
|
|
|
|
|
|
|
|
|
|||||||||
| Diluted earnings per share |
$ | 0.56 | $ | 1.44 | $ | 1.38 | $ | 1.30 | ||||||||
|
|
|
|
|
|
|
|
|
|||||||||
| 2010 | ||||||||||||||||
| Fourth Quarter |
Third Quarter |
Second Quarter |
First Quarter |
|||||||||||||
| Net sales |
$ | 36,144 | $ | 35,292 | $ | 30,781 | $ | 26,316 | ||||||||
| Gross profit |
15,006 | 14,900 | 10,289 | 7,161 | ||||||||||||
| Income from operations |
7,442 | 7,690 | 4,240 | 1,736 | ||||||||||||
| Other income (expense), net |
(6 | ) | (103 | ) | 60 | (157 | ) | |||||||||
| Net income |
5,096 | 5,077 | 2,808 | 1,101 | ||||||||||||
| Basic earnings per share |
$ | 0.84 | $ | 0.84 | $ | 0.47 | $ | 0.18 | ||||||||
|
|
|
|
|
|
|
|
|
|||||||||
| Diluted earnings per share |
$ | 0.82 | $ | 0.81 | $ | 0.45 | $ | 0.18 | ||||||||
|
|
|
|
|
|
|
|
|
|||||||||
F-28
Table of Contents
OYO Geospace Corporation and Subsidiaries
Valuation and Qualifying Accounts
(In Thousands)
| Balance at Beginning of Period |
Charged to Costs And Expenses |
Charged to Other Assets |
(Deductions) And Additions |
Balance at End of Period |
||||||||||||||||
| Year ended September 30, 2011 |
||||||||||||||||||||
| Allowance for doubtful accounts on accounts and notes receivable |
$ | 334 | $ | 128 | $ | — | $ | (51 | ) | $ | 411 | |||||||||
| Year ended September 30, 2010 |
||||||||||||||||||||
| Allowance for doubtful accounts on accounts and notes receivable |
848 | (479 | ) | — | (35 | ) | 334 | |||||||||||||
| Year ended September 30, 2009 |
||||||||||||||||||||
| Allowance for doubtful accounts on accounts and notes receivable |
1,329 | 318 | — | (799 | ) | 848 | ||||||||||||||
F-29