Attached files
| file | filename |
|---|---|
| 8-K - SUNTRUST BANKS INC | bodyof8-kgs12062011.htm |

New York, NY December 6, 2011 Bill Rogers President & CEO Goldman Sachs U.S. Financial Services Conference

1 Important Cautionary Statement About Forward-Looking Statements The following should be read in conjunction with the financial statements, notes and other information contained in the Company’s 2010 Annual Report on Form 10-K, Quarterly Reports on Form 10-Q, and Current Reports on Form 8-K. This presentation includes non-GAAP financial measures to describe SunTrust’s performance. The reconciliations of those measures to GAAP measures are provided within or in the appendix of this presentation. In this presentation, net interest income and net interest margin are presented on a fully taxable-equivalent (“FTE”) basis, and ratios are presented on an annualized basis. The FTE basis adjusts for the tax-favored status of income from certain loans and investments. The Company believes this measure to be the preferred industry measurement of net interest income and provides relevant comparison between taxable and non-taxable amounts. This presentation contains forward-looking statements. Statements about expected expense reductions and other objectives are forward looking statements. Also, any statement that does not describe historical or current facts is a forward-looking statement. These statements often include the words “believes,” “expects,” “anticipates,” “estimates,” “intends,” “plans,” “goals,” “targets,” “objectives,” “initiatives,” “potentially,” “probably,” “projects,” “outlook” or similar expressions or future conditional verbs such as “may,” “will,” “should,” “would,” and “could.” Such statements are based upon the current beliefs and expectations of management and on information currently available to management. Such statements speak as of the date hereof, and we do not assume any obligation to update these statements or to update the reasons why actual results could differ from those contained in such statements in light of new information or future events. Forward-looking statements are subject to significant risks and uncertainties. Investors are cautioned against placing undue reliance on such statements. Actual results may differ materially from those set forth in the forward-looking statements. Factors that could cause actual results to differ materially from those described in the forward-looking statements can be found in Part I, Item 1A, “Risk Factors” in our Annual Report on Form 10-K for the year ended December 31, 2010, and in Part II, “Item 1A. Risk Factors” in our Quarterly Report on Form 10-Q for the periods ended March 31, 2011, June 30, 2011, and September 30, 2011, and also include those risks discussed in the “Management’s Discussion and Analysis of Financial Condition and Results of Operations” sections of our 10-K and 10-Qs and elsewhere in periodic reports that we file with the SEC. Those factors include: difficult market conditions have adversely affected our industry; concerns over market volatility continue; the Dodd-Frank Act makes fundamental changes in the regulation of the financial services industry, some of which may adversely affect our business; we are subject to capital adequacy and liquidity guidelines and, if we fail to meet these guidelines, our financial condition would be adversely affected; emergency measures designed to stabilize the U.S. banking system are beginning to wind down; we are subject to credit risk; our ALLL may not be adequate to cover our eventual losses; we will realize future losses if the proceeds we receive upon liquidation of nonperforming assets are less than the carrying value of such assets; weakness in the economy and in the real estate market, including specific weakness within our geographic footprint, has adversely affected us and may continue to adversely affect us; weakness in the real estate market, including the secondary residential mortgage loan markets, has adversely affected us and may continue to adversely affect us; we are subject to certain risks related to originating and selling mortgages. We may be required to repurchase mortgage loans or indemnify mortgage loan purchasers as a result of breaches of representations and warranties, borrower fraud, or certain borrower defaults, which could harm our liquidity, results of operations, and financial condition; we are subject to risks related to delays in the foreclosure process; we may continue to suffer increased losses in our loan portfolio despite enhancement of our underwriting policies; as a financial services company, adverse changes in general business or economic conditions could have a material adverse effect on our financial condition and results of operations; changes in market interest rates or capital markets could adversely affect our revenue and expense, the value of assets and obligations, and the availability and cost of capital or liquidity; the fiscal and monetary policies of the federal government and its agencies could have a material adverse effect on our earnings; depressed market values for our stock may require us to write down goodwill; clients could pursue alternatives to bank deposits, causing us to lose a relatively inexpensive source of funding; consumers may decide not to use banks to complete their financial transactions, which could affect net income; we have businesses other than banking which subject us to a variety of risks; hurricanes and other natural or man-made disasters may adversely affect loan portfolios and operations and increase the cost of doing business; negative public opinion could damage our reputation and adversely impact business and revenues; the soundness of other financial institutions could adversely affect us; we rely on other companies to provide key components of our business infrastructure; we rely on our systems, employees, and certain counterparties, and certain failures could materially adversely affect our operations; we depend on the accuracy and completeness of information about clients and counterparties; regulation by federal and state agencies could adversely affect the business, revenue, and profit margins; competition in the financial services industry is intense and could result in losing business or margin declines; maintaining or increasing market share depends on market acceptance and regulatory approval of new products and services; we might not pay dividends on your common stock; disruptions in our ability to access global capital markets may negatively affect our capital resources and liquidity; any reduction in our credit rating could increase the cost of our funding from the capital markets; we have in the past and may in the future pursue acquisitions, which could affect costs and from which we may not be able to realize anticipated benefits; we are subject to certain litigation, and our expenses related to this litigation may adversely affect our results; we depend on the expertise of key personnel, and if these individuals leave or change their roles without effective replacements, our operations may suffer; we may not be able to hire or retain additional qualified personnel and recruiting and compensation costs may increase as a result of turnover, both of which may increase costs and reduce profitability and may adversely impact our ability to implement our business strategies; our accounting policies and processes are critical to how we report our financial condition and results of operations and require management to make estimates about matters that are uncertain; changes in our accounting policies or in accounting standards could materially affect how we report our financial results and condition; our stock price can be volatile; our disclosure controls and procedures may not prevent or detect all errors or acts of fraud; our financial instruments carried at fair value expose us to certain market risks; our revenues derived from our investment securities may be volatile and subject to a variety of risks; and we may enter into transactions with off-balance sheet affiliates or our subsidiaries.

2 The SunTrust Franchise

3 A Leading Bank with an Attractive Southeastern Footprint Franchise Overview Branch Network 0.9% 1.1% 2.2% 2.9% 2.9% 3.7% 3.9% 4.7% 5.7% 5.9% 6.2% MTB PNC KEY CMA FITB COF USB RF BBT WFC STI U.S. Average: 3.9% Projected Population Growth1 Market Share2 • Top 3 Deposit Market Share Rank in 20 of our Top 25 MSAs – Top 25 MSAs represent 86% of our total MSA deposits – Our Top 25 MSA average deposit market share is 15% 1. Source: SNL Financial-five-year population growth, 2010-2015, MSA + counties not in any MSA, at 11/28/2011. 2. Source: SNL Financial, as of 6/30/2011 based on MSAs.

4 A Diverse Business Mix We Are Organized to Provide the Highest Level of Service and to Deliver the Whole Institution to Our Clients ONE TEAM CLIENT FIRST PROFITABLE GROWTH Wholesale Consumer Diversified Commercial Banking 11% Retail 42% Mortgage 10% CRE 3% Wealth & Investment Mgmt. 14% Corporate & Investment Banking 13% Note: Percentages are based on 9/30/2011 YTD Revenue and do not add to 100% because Corporate Other and Treasury is not shown (7%).

5 Journey to Improved Profitability and Shareholder Returns

6 Sales culture Intense focus on high quality service Industry- leading client loyalty Identified and corrected client pain points Changes in competitive landscape Transforming the Business—The Journey Monetization of the New Consumer Delivery Model Under- penetrated Wholesale franchises Growth in commercial loans and fees Expanded capabilities and niche businesses Differentiated model, well positioned in the market Optimization of Business Mix Improved profitability in targeted businesses High efficiency ratio On track to remove $300MM from expense base Elevated credit and mortgage costs PPG Expense Program initiated Sub 60% Efficiency Ratio While Navigating through the Credit Cycle, SunTrust Has Also Been Transforming the Business for Long-term Success Progression Our Objectives Cyclical expenses expected to normalize over time Economic / housing downturn led to high credit losses Relatively high concentration in real estate loans Increased guaranteed loans Reduced higher-risk loans Better Diversification of Loan Portfolio Growth in non- residential real estate loans

7 Momentum in Growing Consumer Market and Wallet Share Focus on Service and Loyalty is Driving Improved Performance External Recognition Growth in Key Metrics Fair Share Growth1 Service Categories per New Household3 • Industry leader for “most loyal customers” due to exceptional client service (Forrester, 3/26/10) • Two 2011 TNS Choice Awards for Outstanding Performance in Consumer Banking (3/1/11) • No. 2 customer experience, second only to credit unions (Forrester’s Customer Experience Index 2010) • Highest level of satisfaction with communication efforts and second highest level of consumer awareness for Reg. E changes (Gallup Poll) Primary Relationship Growth2 Lower-Cost Deposit Growth4 10% 4% 5% 11% 1. June 2011 vs. June 2010, based on the latest FDIC deposit market share statistics. Fair Share = (Deposit Share) / (Branch Share) in SunTrust’s footprint. Does not include Credit Unions and includes only branches <$ 700MM. Footprint defined as branches present in zip code with a SunTrust Branch; branch value adjusted taking into account age and type of branch. 2. YTD 9/30/11 (annualized) vs. 2010. Consumer relationships where the client has a primary checking account plus additional non-checking products. 3. Sept. 2011 vs. Sept. 2010. Captures new to SunTrust Personal Checking Households and looks at those households in the 4th month of the household tenure then counts number of personal services sold. 4. 9/30/11 vs. 9/30/10. Lower-cost deposits include DDA, NOW, Money Market and Savings and represent total SunTrust Consumer and Commercial deposits.

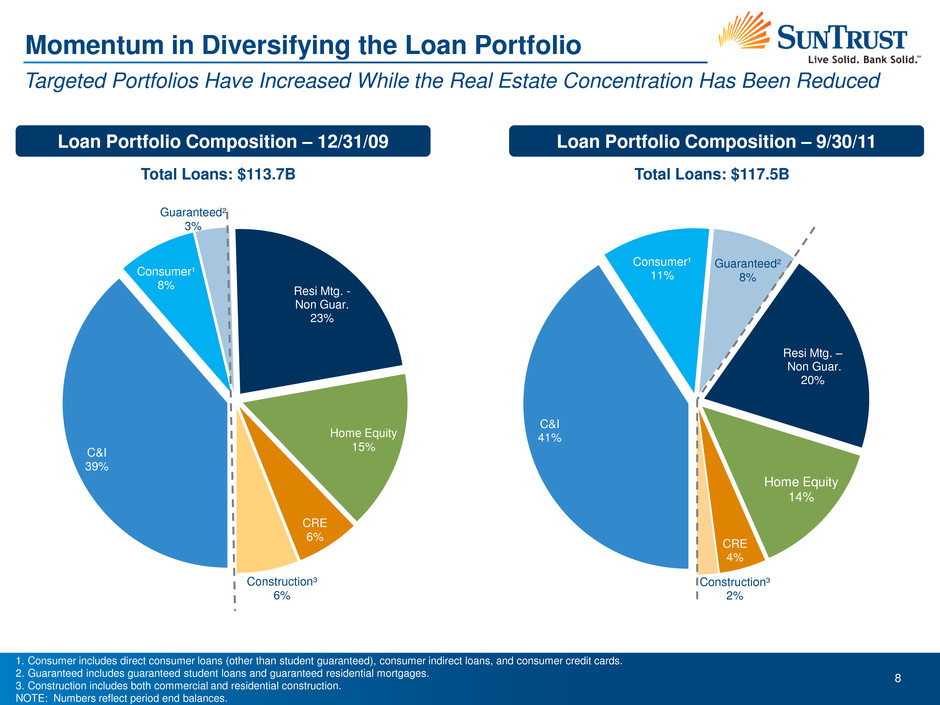
8 Momentum in Diversifying the Loan Portfolio Targeted Portfolios Have Increased While the Real Estate Concentration Has Been Reduced Loan Portfolio Composition – 9/30/11 Total Loans: $117.5B 1. Consumer includes direct consumer loans (other than student guaranteed), consumer indirect loans, and consumer credit cards. 2. Guaranteed includes guaranteed student loans and guaranteed residential mortgages. 3. Construction includes both commercial and residential construction. NOTE: Numbers reflect period end balances. C&I 41% Consumer¹ 11% Guaranteed² 8% Resi Mtg. – Non Guar. 20% Home Equity 14% CRE 4% Construction³ 2% C&I 39% Consumer¹ 8% Guaranteed² 3% Resi Mtg. - Non Guar. 23% Home Equity 15% CRE 6% Construction³ 6% Loan Portfolio Composition – 12/31/09 Total Loans: $113.7B

9 Momentum in Diversifying the Loan Portfolio Strong Balance Growth in Targeted Portfolios C&I Loans – up 8% YOY and 4% SQ Consumer Loans² – up 19% YOY and 5% SQ ($ in billions, period-end balances) Higher-risk Loans¹ Down Consistently Guaranteed Loan³ Increases Have Largely Offset Higher-risk Declines $3.7 $8.1 $8.8 $9.0 $9.1 $9.8 4Q 09 3Q 10 4Q 10 1Q 11 2Q 11 3Q 11 $44.0 $44.4 $44.8 $45.1 $45.9 $48.0 4Q 09 3Q 10 4Q 10 1Q 11 2Q 11 3Q 11 $8.7 $10.4 $11.7 $11.7 $11.9 $12.4 4Q 09 3Q 10 4Q 10 1Q 11 2Q 11 3Q 11 $5.0 $3.1 $2.6 $2.1 $1.7 $1.4 $5.7 $4.7 $4.4 $4.1 $3.9 $3.8 $7.1 $6.4 $6.1 $5.9 $5.7 $5.5 4Q 09 3Q 10 4Q 10 1Q 11 2Q 11 3Q 11 Higher-risk Home Equity Products Higher-risk Mortgage Products Commercial Construction $12.1 $11.4 $10.7 $14.1 $13.1 $17.8 1. Higher-risk Mortgage products include Prime 2nds, Residential Construction, and Alt-A. Higher-risk Home Equity includes High LTV lines (includes Florida lines > 80% LTV and other lines > 90% LTV), Brokered Home Equity, and Home Equity Loans. Higher-risk Commercial Construction represents investor owned construction loans. 2. Consumer includes direct consumer loans (other than student guaranteed), consumer indirect loans, and consumer credit cards. 3. Guaranteed includes guaranteed student loans and guaranteed residential mortgages.

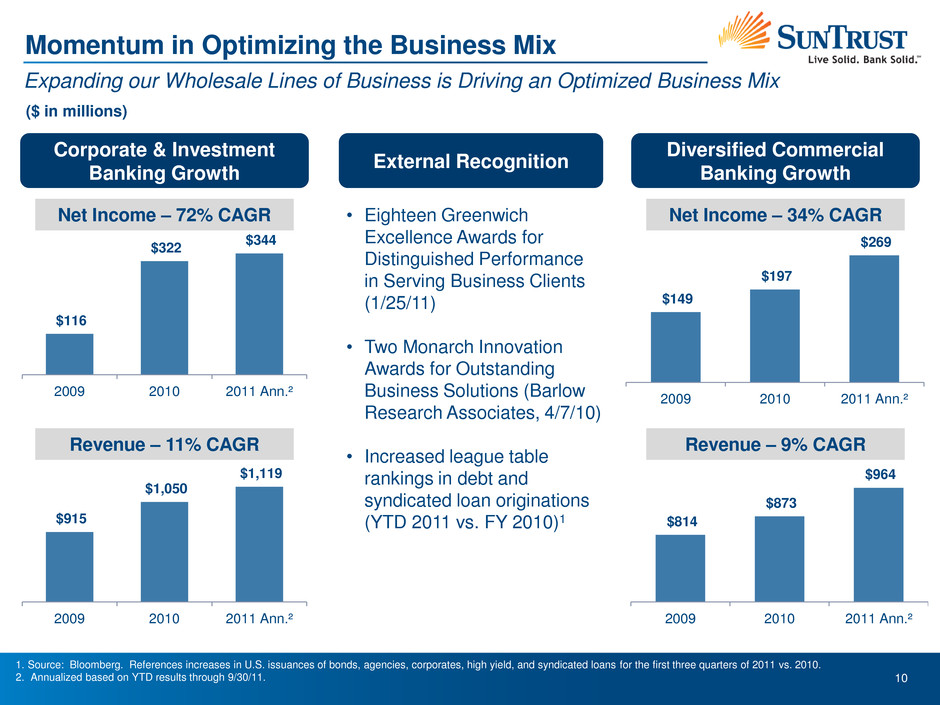
10 Momentum in Optimizing the Business Mix Expanding our Wholesale Lines of Business is Driving an Optimized Business Mix • Eighteen Greenwich Excellence Awards for Distinguished Performance in Serving Business Clients (1/25/11) • Two Monarch Innovation Awards for Outstanding Business Solutions (Barlow Research Associates, 4/7/10) • Increased league table rankings in debt and syndicated loan originations (YTD 2011 vs. FY 2010)1 External Recognition Corporate & Investment Banking Growth 1. Source: Bloomberg. References increases in U.S. issuances of bonds, agencies, corporates, high yield, and syndicated loans for the first three quarters of 2011 vs. 2010. 2. Annualized based on YTD results through 9/30/11. Net Income – 72% CAGR Revenue – 11% CAGR Diversified Commercial Banking Growth Net Income – 34% CAGR Revenue – 9% CAGR ($ in millions) $116 $322 $344 2009 2010 2011 Ann.² $915 $1,050 $1,119 2009 2010 2011 Ann.² $149 $197 $269 2009 2010 2011 Ann.² $814 $873 $964 2009 2010 2011 Ann.²

11 Improving Expense Efficiency Core Expenses Well-managed, though Efficiency Ratio is too High; PPG Expense Initiative and Abatement of Environmental Factors Expected to Reduce Efficiency Ratio 1. Appendix includes reconciliation of non-GAAP numbers and additional details on the calculation. 2. The mortgage repurchase reserve addition is booked as a contra-revenue item and, therefore, is not included in the cyclical expense adjustment in the bar chart. 3. Estimated based on annualized YTD revenue through 9/30/11. Environmental Factors Expected to Normalize 2006 2011 Credit Expenses 1.8% 8.5% Mortgage Repurchase Reserve Addition2 0.1% 2.9% Total of Environmental Factors 1.9% 11.4% Memo: Regulatory Assessments 0.3% 3.5% $300MM PPG Expenses Expected to be Eliminated N/A 3.4%³ ($ in millions) $4,685 $5,043 $182 $1,046 2006 2011 YTD, Ann. Total Exp. Excl. Adj. & Cyclical Items Adj. & Cyclical Items $4,867 $6,089 Total Noninterest Expenses1 Impact on Efficiency Ratio1 Key Components of $300MM PPG Expense Program • Strategic Supply Management • Consumer Bank Efficiencies • Operations Staff and Support

12 Navigating the Current Environment

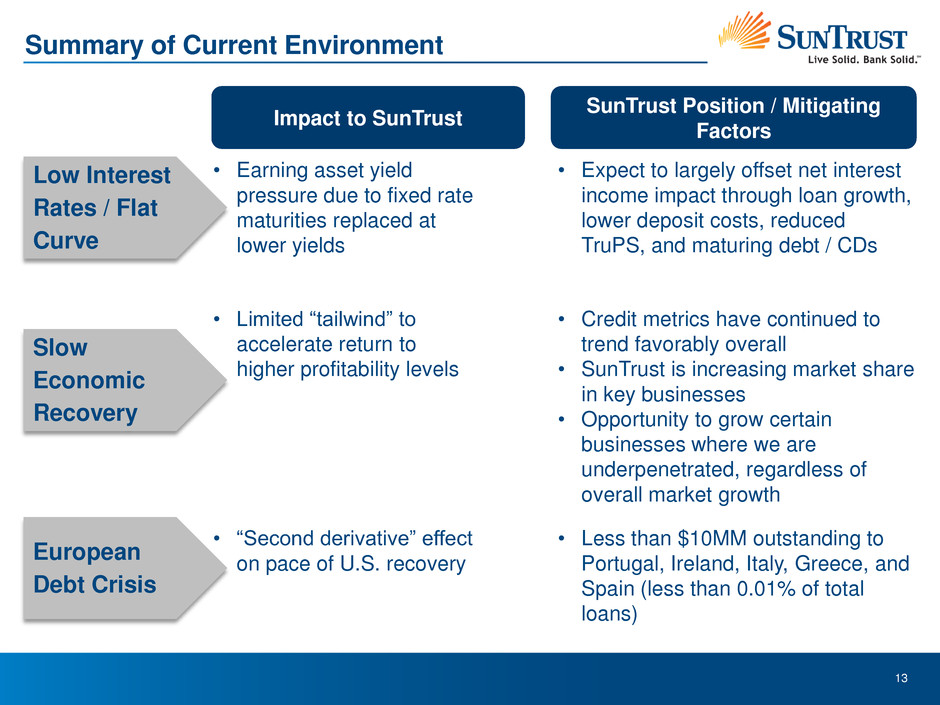
13 Low Interest Rates / Flat Curve • Earning asset yield pressure due to fixed rate maturities replaced at lower yields Summary of Current Environment • Expect to largely offset net interest income impact through loan growth, lower deposit costs, reduced TruPS, and maturing debt / CDs Slow Economic Recovery • Limited “tailwind” to accelerate return to higher profitability levels • Credit metrics have continued to trend favorably overall • SunTrust is increasing market share in key businesses • Opportunity to grow certain businesses where we are underpenetrated, regardless of overall market growth European Debt Crisis • “Second derivative” effect on pace of U.S. recovery • Less than $10MM outstanding to Portugal, Ireland, Italy, Greece, and Spain (less than 0.01% of total loans) Impact to SunTrust SunTrust Position / Mitigating Factors

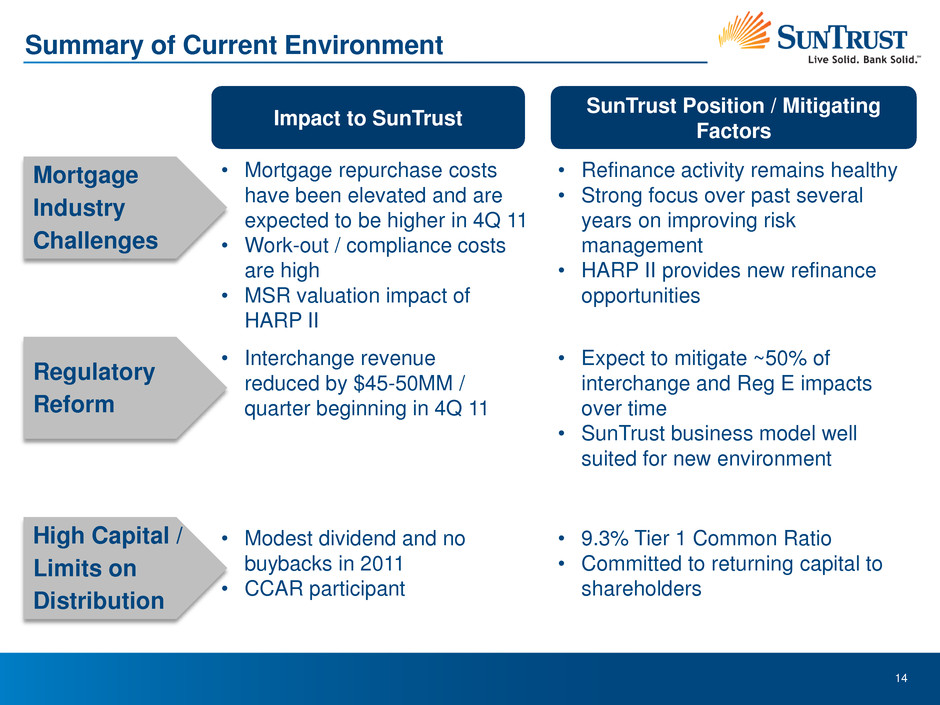
14 Mortgage Industry Challenges • Mortgage repurchase costs have been elevated and are expected to be higher in 4Q 11 • Work-out / compliance costs are high • MSR valuation impact of HARP II Summary of Current Environment • Refinance activity remains healthy • Strong focus over past several years on improving risk management • HARP II provides new refinance opportunities Regulatory Reform • Interchange revenue reduced by $45-50MM / quarter beginning in 4Q 11 • Expect to mitigate ~50% of interchange and Reg E impacts over time • SunTrust business model well suited for new environment High Capital / Limits on Distribution • Modest dividend and no buybacks in 2011 • CCAR participant • 9.3% Tier 1 Common Ratio • Committed to returning capital to shareholders Impact to SunTrust SunTrust Position / Mitigating Factors

15 $0 $200 $400 $600 $800 $1,000 4Q 09 3Q 10 4Q 10 1Q 11 2Q 11 3Q 11 $0 $1,000 $2,000 $3,000 $4,000 $5,000 $6,000 4Q 09 3Q 10 4Q 10 1Q 11 2Q 11 3Q 11 Credit Metrics Continue to Exhibit Favorable Trends Summary or Current Environment - Credit Trends Nonperforming Loans Net Charge-offs ($ in millions)

16 Attractive Footprint Diversified Franchise Loyal Clients Successful Service Value Proposition Solid Capital Position Strong Business Momentum Improving Credit Quality & Risk Profile Favorable Deposit Growth and Mix Targeted Loan Growth SunTrust is Well Positioned

New York, NY December 6, 2011 Goldman Sachs U.S. Financial Services Conference Bill Rogers President & CEO

18 Reconciliation of Non-GAAP Measures – Expenses YTD, Annualized ($ in millions) 2006 2011 CAGR Total Expenses $4,867 $6,089 $1,222 5% Adjustment Items Loss/(Gain) on Debt Extinguishment 12 (4) Expenses Excl. Adjustments 1 4,855 6,093 1,238 5% Cyclical Expense Items Regulatory Assessments 23 309 Credit-related Expenses: Credit & Collection Services 102 241 Other Real Estate - 260 Mortgage Reinsurance - 25 Operating Losses 45 215 Total Credit-related Expenses 147 741 Total Cyclical Items 170 1,050 Expenses Excl. Adjustments & Cyclical Items 2 $4,685 $5,043 $358 1% Contribution to Efficiency Ratio Total Revenue, FTE $8,217 $8,737 Credit Expenses 147 741 Mortgage Repurchase Reserve Addition (19) (383) Regulatory Assessments 23 309 Credit Expenses / Total Revenue 1.8% 8.5% Mortgage Repurch. Reserve Impact to Effic. Ratio 3 0.1% 2.9% Total 1.9% 11.4% Regulatory Assessments / Total Revenue 0.3% 3.5% PPG Expense Program N/A $300 PPG Expense Program / Total Revenue 3.4% 2011 vs. 2006 1. Adjusted expense is provided as the removal of certain items that are material and potentially non-recurring is useful to investors and management in comparing institutions and in evaluating expense trends. 2. Expenses excluding adjustments and cyclical items is provided as it removes expenses that are recurring in nature, but higher in a recessionary cycle, and is useful to investors and management in assessing the impact of the recession on non-interest expenses and earnings. It also facilitates analysis of the effectiveness of management in controlling expense growth. 3. Reflects the difference in the reported efficiency ratio and that calculated when adding back the negative impact that the mortgage repurchase reserve addition has on Total Revenue, FTE.
