Attached files
| file | filename |
|---|---|
| 8-K - FORM 8-K - OMEGA PROTEIN CORP | d264872d8k.htm |
 Investor Presentation
December 6, 2011
Exhibit 99.1 |
 The
information presented herein may contain projections, predictions, estimates and other forward-
looking statements within the meaning of Section 27A of the Securities Act of 1933
and Section 21E of the Securities Exchange Act of 1934.
Forward-looking statements will use words like “may,”
“may not,”
“believes,”
“do
not
believe,”
“expects,”
“do
not
expect,”
“anticipate,”
“does
not
anticipate,”
and
other
similar
expressions.
Although
the
Company
believes
that
its
expectations
are
based
on
reasonable
assumptions, we can give no assurance that these expectations will be realized.
Important factors that could cause actual results to differ materially from
those included in these forward looking statements include: (1) our ability
to meet our raw material requirements through our annual menhaden harvest,
which is subject to fluctuations due to natural conditions over which we have no
control, such as varying fish population, fish oil yields, adverse weather
conditions, oil spill impacts and disease; (2) the impact of laws and
regulations that may be enacted that may restrict our operations or the sale of products; (3) the
impact
of
worldwide
supply
and
demand
relationships
on
prices
for
our
products;
(4)
our
expectations
regarding demand and pricing for our products proving to be incorrect; (5)
fluctuations in the Company’s quarterly operating results due to the
seasonality of our business and our deferral of inventory sales based
on
worldwide
prices
for
competing
products;
(6)
the
effect
of
the
Deepwater
Horizon
oil
spill
on
our
business, operations and fish catch; and (7)
the business, operations, potential or prospects for our new
Cyvex Nutrition and InCon Processing subsidiaries, the dietary supplement market or
the human health and wellness segment generally.
Forward Looking Statements
2 |
 Presentation Overview
3
Investment Highlights
Favorable Supply Demand Outlook
Operational Overview
Growth Initiatives
Business Divisions Review
Financial Highlights |
 Investment Highlights
Pure play on high quality protein ingredients and omega-3 fatty acids
Benefitting from increasing demand for nutritional ingredients and
limited supply of fish meal and fish oil
Vertically integrated operations with significant barriers to entry
Strong 2010 financial performance
$168M revenue
$18M net income
Strong balance sheet
4 |
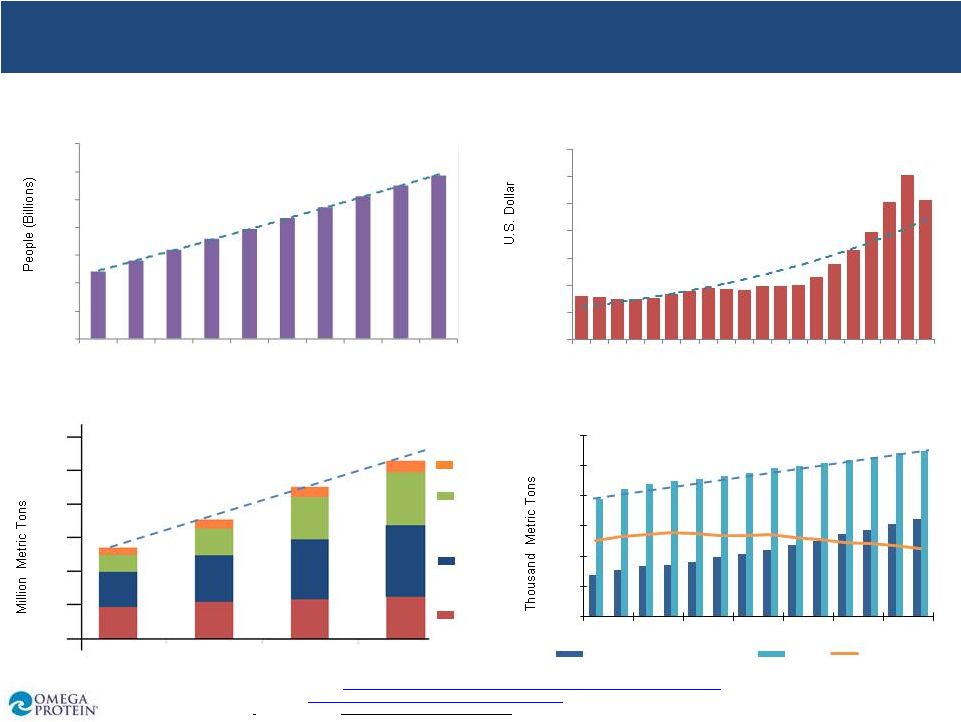 5
Global Demand for Meat
World Population
Standards of Living
Developing Countries* GDP per Capita (PPP)
* As defined by the World Bank-
2010-2011
300
250
200
150
100
50
0
+37%
+27%
+17%
1980
1990
2000
2010
Beef
Pork
Poultry
Other
Global Demand for Seafood
Growing Demand for Oil and Protein Around the World
5.60
5.80
6.00
6.20
6.40
6.60
6.80
7.00
2000
2001
2002
2003
2004
2005
2006
2007
2008
2009
$0
$1,000
$2,000
$3,000
$4,000
$5,000
$6,000
$7,000
1990
1992
1994
1996
1998
2000
2002
2004
2006
2008
0
2,000
4,000
6,000
8,000
10,000
12,000
1994
1996
1998
2000
2002
2004
2006
Global Aquaculture Consumption
Total
Wild Catch
Source: World Population-
World Bank, 2011.
http://search.worldbank.org/data?qterm=population&language=EN&format=html;
Standards
of
Living-
World
Bank,
2011
http://data.worldbank.org/indicator/NY.GDP.PCAP.CD
;
Global
Demand
for
Meat-
Hartog,
L.
“Global
Perspective
on
Integrated Pork Production”.
Presented at the London Swine Conference, England.2006 |
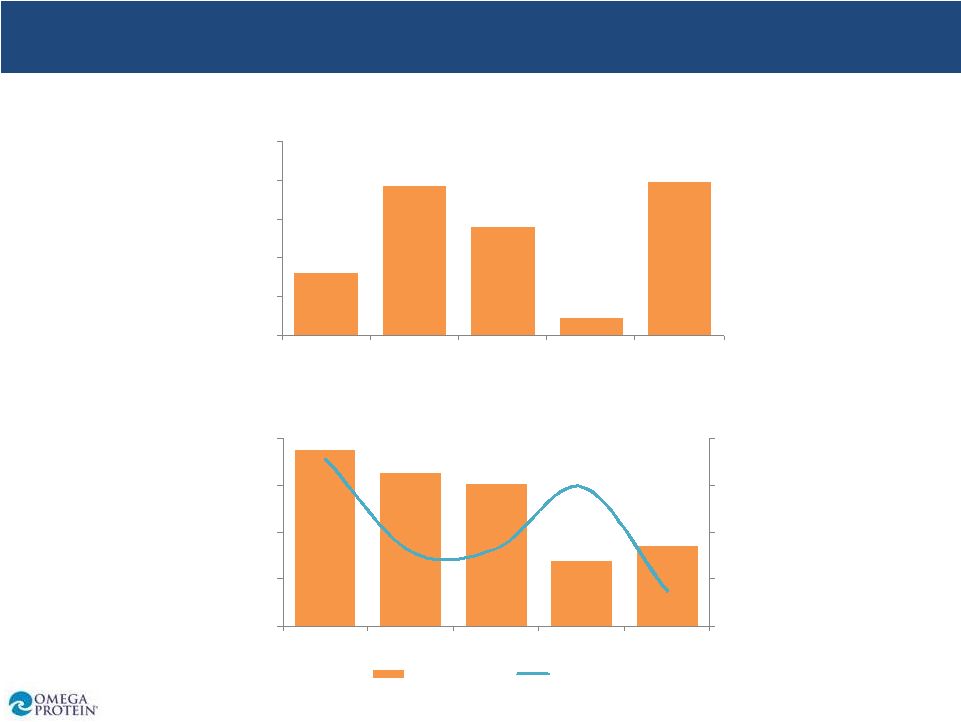
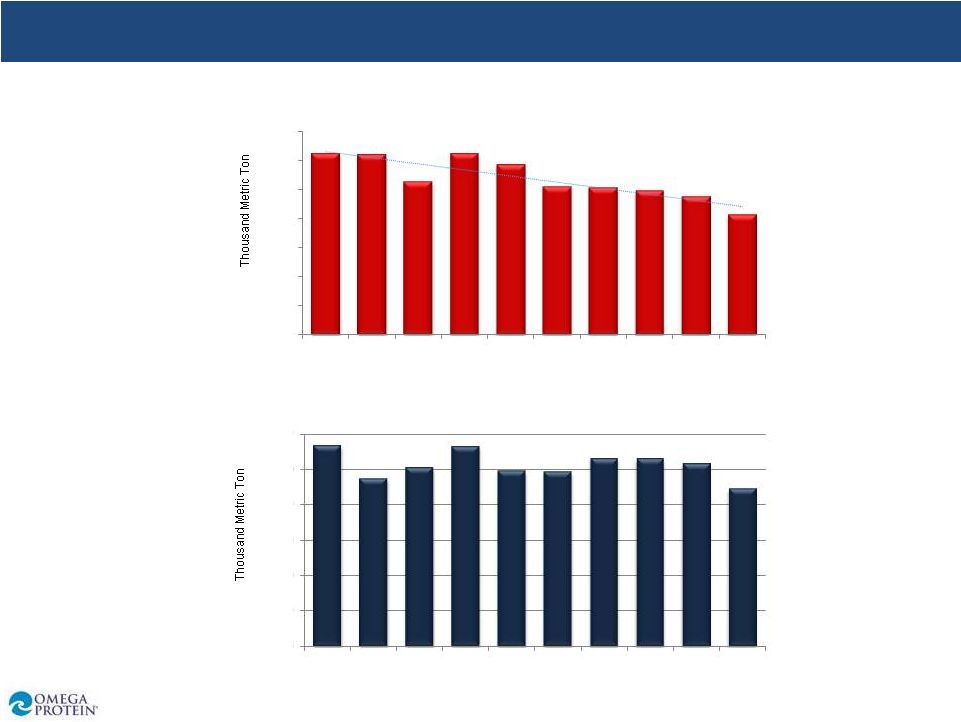 6
World Supply/Demand Imbalance
Global Fish Meal Production
Global Fish Oil Production
Source: IFFO, 2010
6,240
6,201
5,292
6,226
5,868
5,092
5,052
4,972
4,775
4,134
0
1,000
2,000
3,000
4,000
5,000
6,000
7,000
2001
2002
2003
2004
2005
2006
2007
2008
2009
2010
1,132
946
1,006
1,129
988
983
1,061
1,056
1,031
889
0
200
400
600
800
1,000
1,200
2001
2002
2003
2004
2005
2006
2007
2008
2009
2010 |
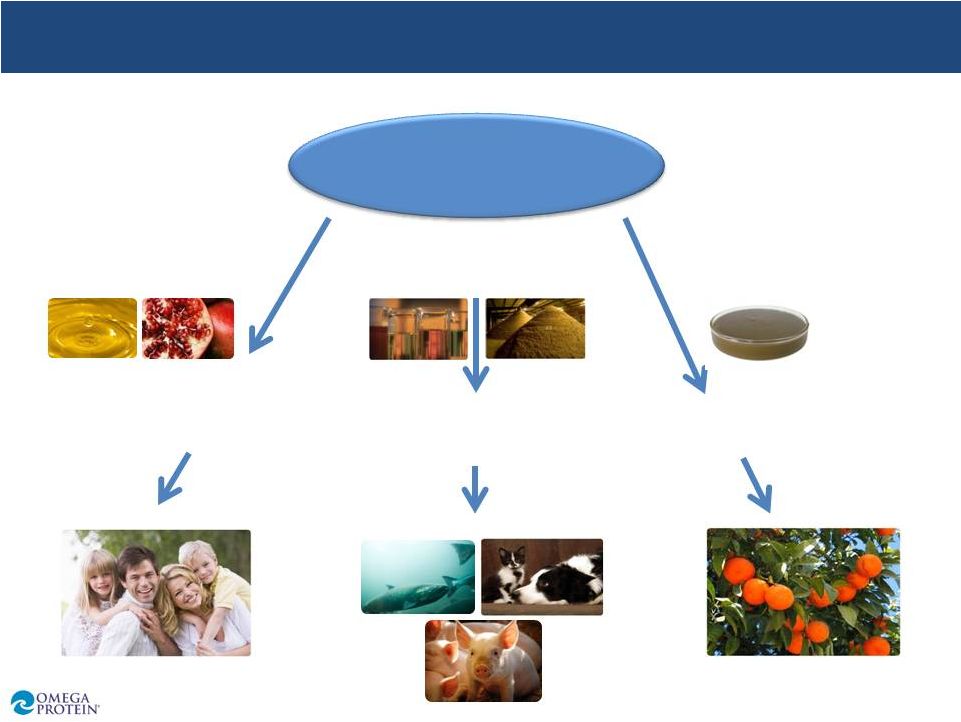 Our
Business Fuels Healthy Living 7
Omega Protein
Corporation
Human Nutrition
Ingredients
Animal Nutrition
Ingredients
Plant Nutrition
Ingredients
Nutraceuticals
Functional Foods
Aquaculture Feed
Pet Food
Livestock Feed
Organic
Fruits and Vegetables |
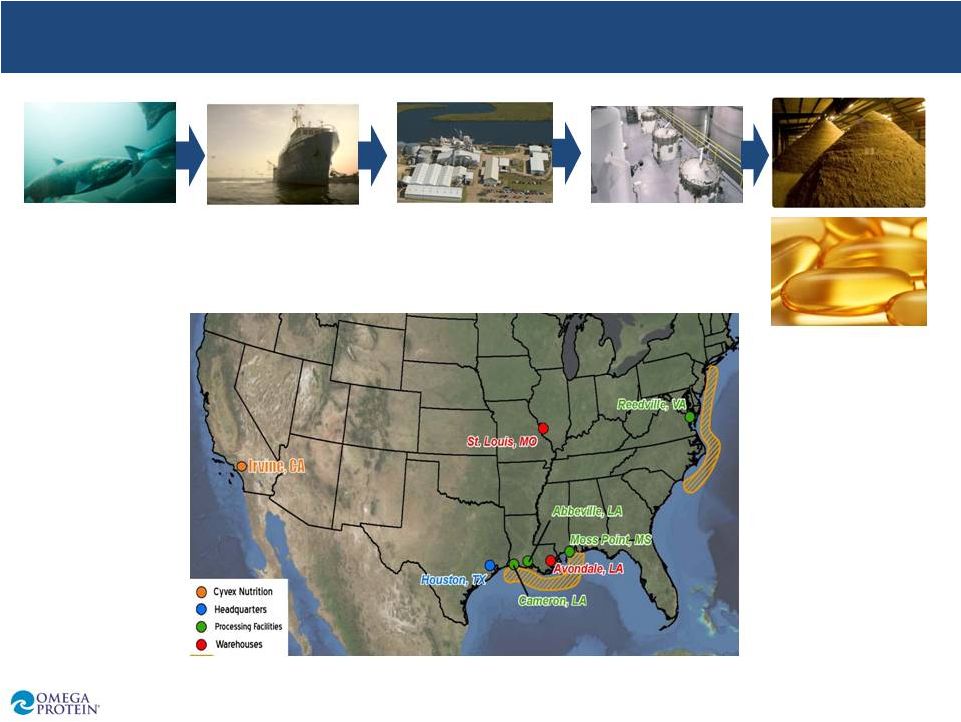 Vertically Integrated: From Catch to Market
8
A sustainable
fishery
49 vessels and
34 spotter
planes
4 meal and oil
processing
plants
Fish oil refinery
and
concentrating
capability
Sales and
distribution network
into top
manufacturers |
 9
Focus on research and development
enhance production
improve health benefits of end
products
develop novel new products
Leverage customer relationships
Allocate funds based on return on capital
Additional product lines
Increase presence in human nutrition
Access opportunities in new markets
Add new customers in existing markets
Organic Growth
Acquisitions
Growth Initiatives
Leverage existing protein and fatty acid platform to
expand line of nutritional ingredients |
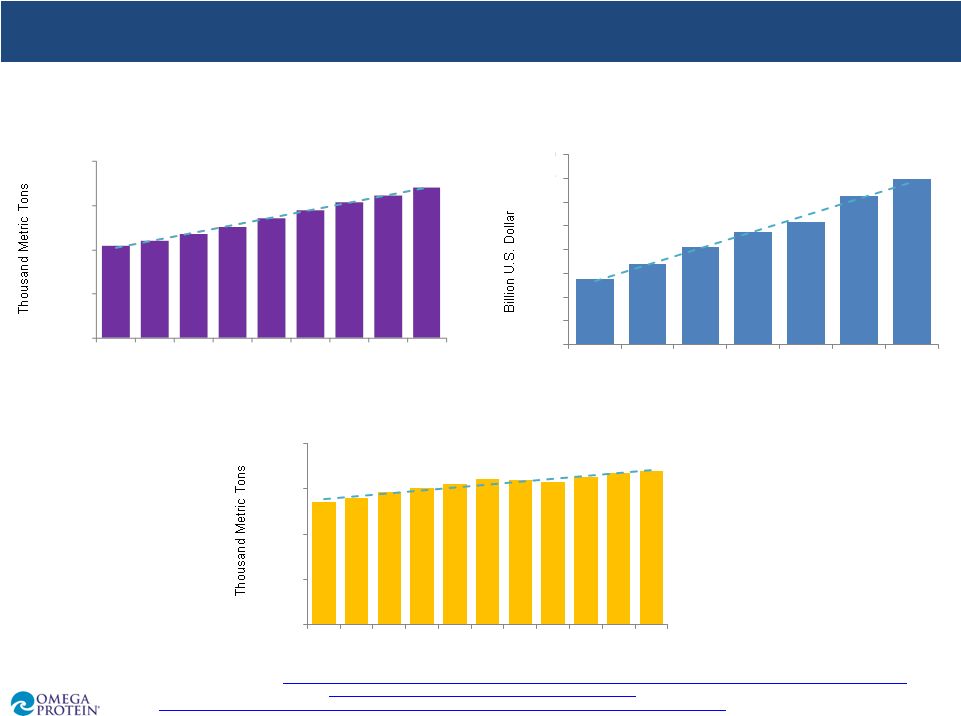 10
Animal Nutrition: Market is Growing
Global Swine Production by Volume
Global Aquaculture Production by Volume
Global Pet food Market by Retail Sales
0
20,000
40,000
60,000
80,000
2000
2001
2002
2003
2004
2005
2006
2007
2008
$44
$46
$48
$50
$52
$54
$56
$58
$60
2004
2005
2006
2007
2008
2009
2010
0
30,000
60,000
90,000
120,000
2000
2001
2002
2003
2004
2005
2006
2007
2008
2009
2010
Source: Aquaculture-
FAO, 2011.
http://www.fao.org/figis/servlet/SQServlet?file=/usr/local/tomcat/FI/5.5.23/figis/webapps/figis/temp/hqp_5836.xml&outtype=html
Swine-
USDA. Foreign Agriculture Services.
http://www.fas.usda.gov/dlp2/circular/1997/97-03/porkprod.htm
Petfood-
http://www.graintec.com/fileadmin/templates/PDF/25thPres/OUTLOOK_PET_FOOD_Euromonitor_Lee_Linthicum.pdf
|
 Nutraceutical Ingredients
•
Diverse product set of
nutritional ingredients
•
Supply to the dietary
supplement
and functional
food
markets
•
Sales today represent a
fraction of the market
Source: “Global Nutrition Industry.”
Nutrition Business Journal. March, 2010.
1995
1996 1997 1998 1999
2000 2001 2002 2003 2004 2005 2006
2007 2008
2009 2010 2011 2012 2013 2014
Global Nutrition Industry
$50,000
$0
$100,000
$150,000
$200,000
$250,000
$300,000
$350,000
$400,000
$450,000
*2009-2014 are projections
11
Human Nutrition: Greatest Growth Potential |
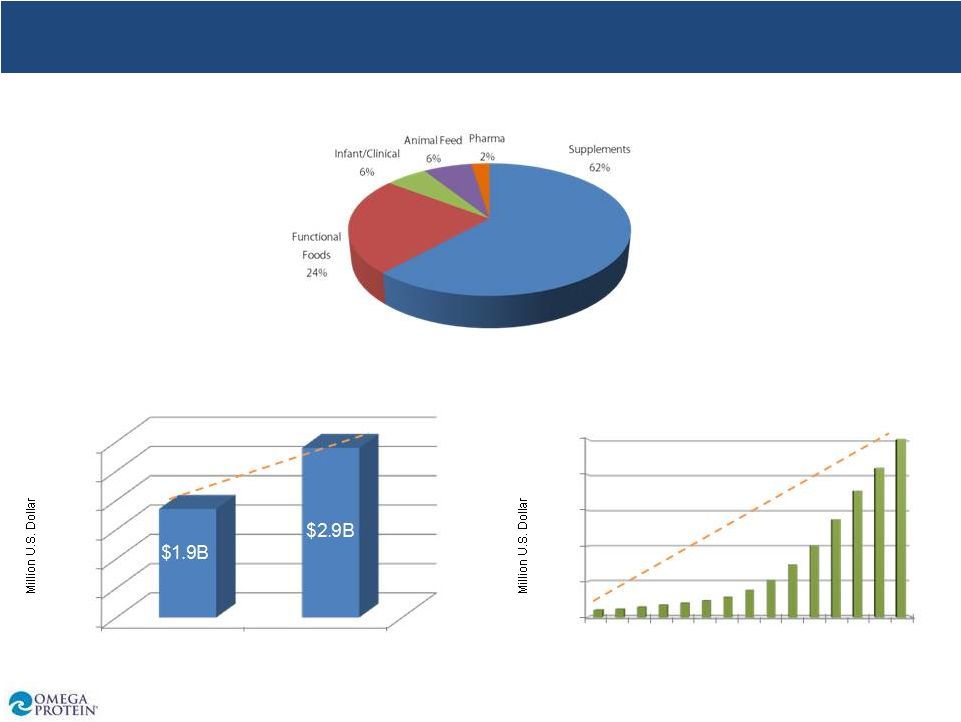 12
Source:
“Global
Omega-3
Industry
Report.”
Frost
&
Sullivan.
September
2009.;
“Top
5
Supplements”.
Consumer
Lab.com.
Survey,
2011
End Use Applications of EPA and DHA Oils (Metric Tons)
Global Omega-3 Dietary Supplement Sales
U.S. Omega-3 Dietary Supplement Sales
Human Nutrition: Booming Supplement Market
$0
$500
$1,000
$1,500
$2,000
$2,500
$3,000
2007
2009
$-
$200
$400
$600
$800
$1,000
1995
1997
1999
2001
2003
2005
2007
2009 |
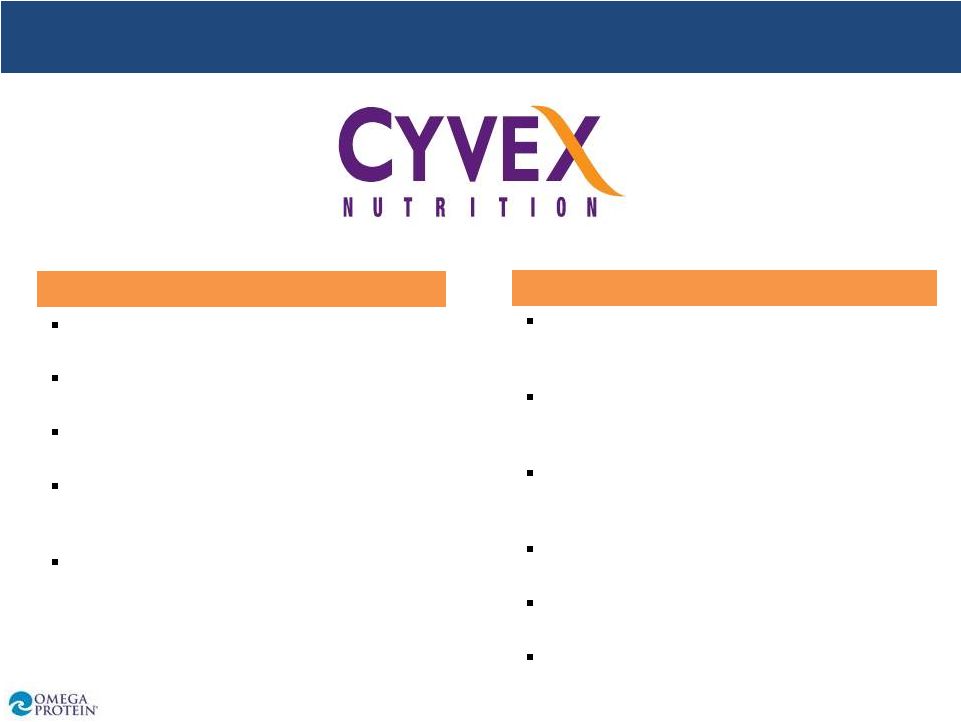 Founded in 1984
Located in Irvine, California
Selling focus: health and well-being
Strong customer relationships in the
dietary supplements industry
Focused on high-value, higher margin
products
13
Human Nutrition: Acquisitive Growth
Background
Transaction Rationale
Increase offering to the in human nutrition
industry
Provides access to the top dietary supplement
manufacturers
Adds established distribution network for
omega-3 fatty acids (fish oil)
Adds line of non-marine products
Supports shifting customer demand
B2B ingredient supplier |
 Privately held company founded in 1993
Located near Chicago
Strong technology base in molecular
distillation and purification of nutritional
compounds
Existing producer of high purity omega-3’s
Customer base includes numerous Fortune
500 companies
14
Human Nutrition: Acquisitive Growth
Transaction Rationale
Vertical Integration: Fills gap in OME’s fish oil
value chain
Proven Assets: Unique opportunity to acquire
molecular distillation capacity accompanied with
processing and product development expertise
Strengthens
Distribution
Channel:
Broadens
product offerings, expands current customer
relationships and improves access to prospective
customers
Timing: Acquisition provides immediate access;
avoids Greenfield construction delay
Background |
 15
Value Chain-Fish Oil for Human Nutrition
Refine
Process
Harvest
Market &
Sell
(Cyvex)
Retail
Concen-
trate
(InCon)
Vertical integration allows Omega Protein to capture
additional value and further differentiate our fish oil
|
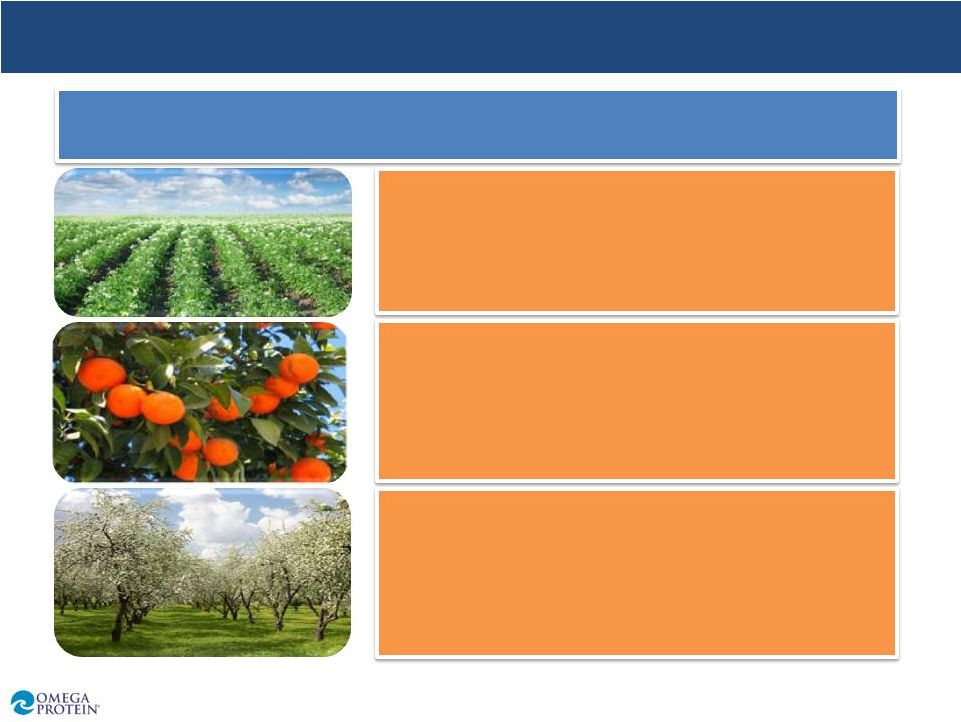 Plant Nutrition: Niche Opportunity
16
Source: Omega Protein
OmegaGrow®
Organic fertilizer produces healthier, faster
growing plants
OmegaGrow®
Plus
Provides the same benefits as OmegaGrow ®
but with 25% oil to enhance plant health and
fortification
Seacide®
Currently in process of bio-pesticide registration
Nutritive Products |
 17
Comprehensive In-House Research and Development Effort
Omega Protein Technology and Innovation Center
Supports Process Innovation
Enhances Menhaden Utilization
Provides for Novel Product Development
Benefits from Partnerships and Contracts with Universities
R&D Initiatives Support Growth
-
Analytical Laboratory
-
Pilot Plant from Oil Refinery
-
AOCS/GOED certified for the analysis of marine oils
-
Beverage and Emulsions Laboratory
-
Commercial Kitchen and Bakery Laboratory |
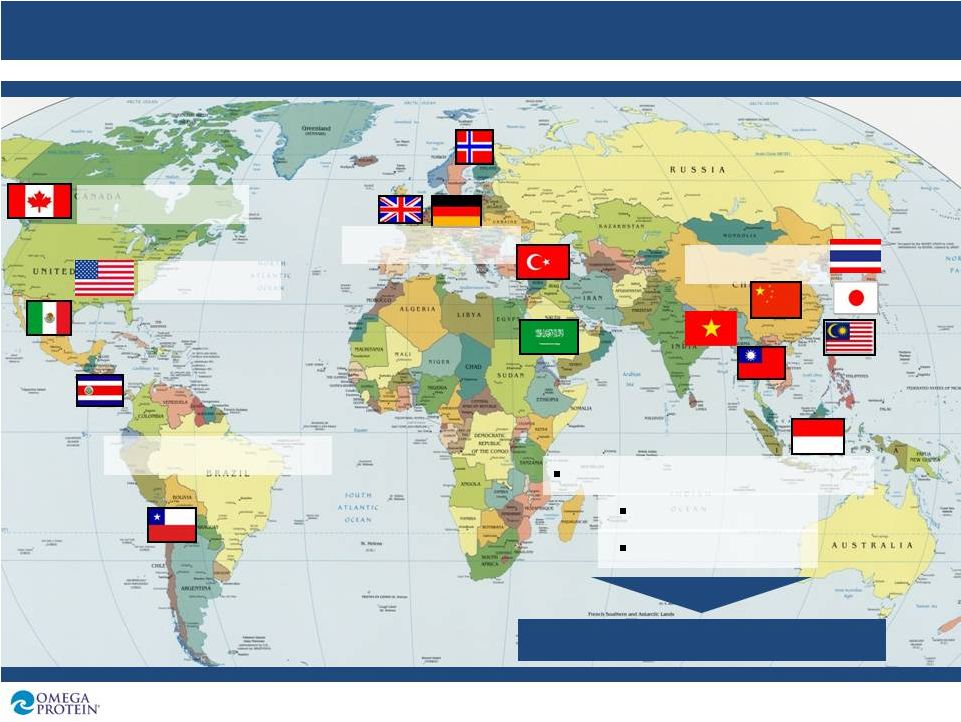 Global Distribution Network
18
Source: Omega Protein
Canada = 8.0%
U.S. = 49.5%
Latin America = 6.8%
Europe = 11.7%
Asia = 24.0%
Optimize International Sales
Maximize Pricing
Enhance Margins
2010 exports= over 50% of sales |
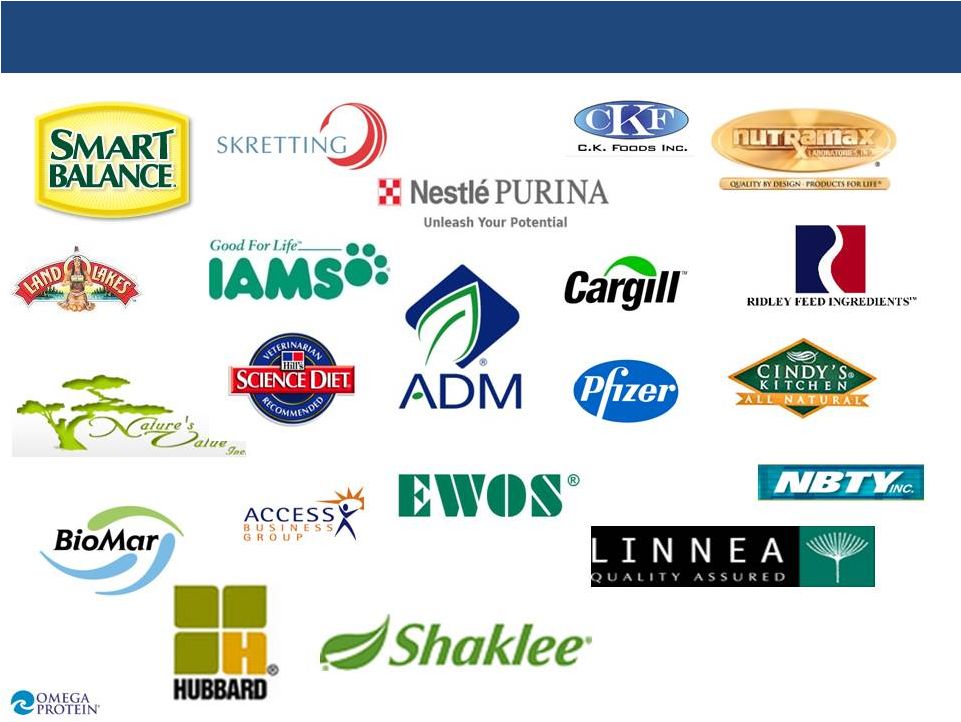 Blue Chip Customers
19 |
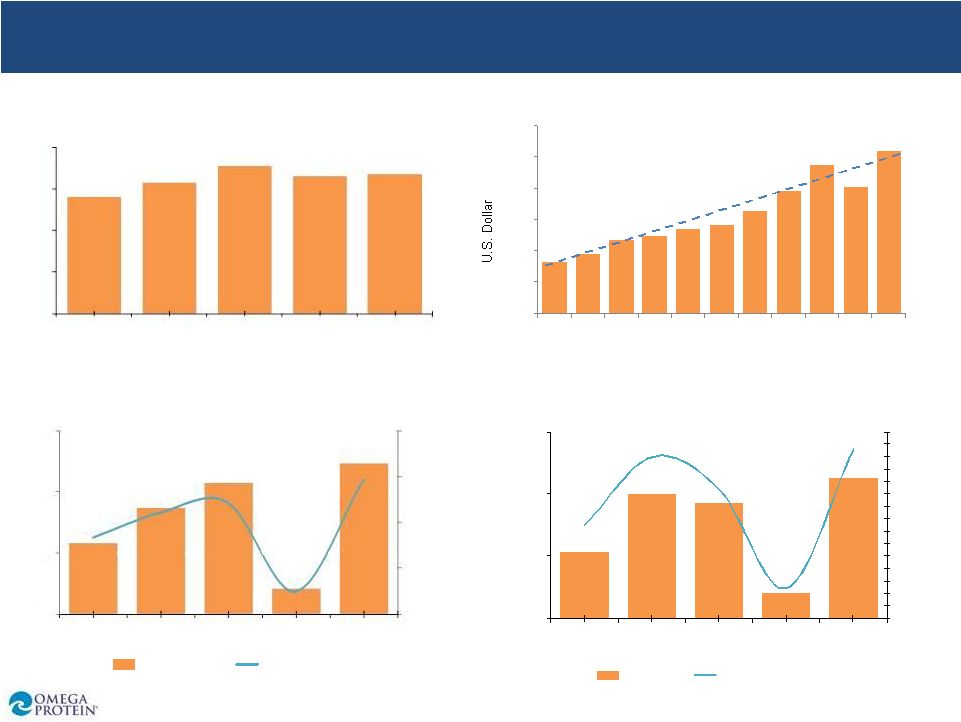 Income Statement Financial Highlights
Gross Margin 2006-2010 (Million U.S.
Dollars) Revenue 2006-2010 (Million U.S.
Dollars) 20
EBITDA 2006-2010 (Million U.S. Dollars)* $21
$40
$37
$8
$45
15%
26%
21%
5%
27%
0%
10%
20%
30%
$0
$20
$40
$60
2006
2007
2008
2009
2010
EBITDA
EBITDA Margin
Source: Omega Protein
$325
$374
$465
$489
$539
$563
$654
$784
$947
$806
$1,036
$0
$200
$400
$600
$800
$1,000
$1,200
2000
2001
2002
2003
2004
2005
2006
2007
2008
2009
2010
OME Revenue per Ton (U.S. Dollars)
*See Appendix 1 for a reconciliation for EBITDA to net income
2006
2007
2008
2009
2010
$140
$157
$177
$165
$168
$200
$150
$100
$50
$0
$23
$35
$43
$8
$49
17%
22%
24%
5%
29%
0%
10%
20%
30%
40%
$0
$20
$40
$60
2006
2007
2008
2009
2010
Gross Profit
Gross Margin |
 Balance Sheet Highlights
Cash Balance (Million U.S. Dollars)
21
Debt Balance (Million U.S. Dollars)
$8
$19
$14
$2
$20
$0
$5
$10
$15
$20
$25
2006
2007
2008
2009
2010
$75
$65
$61
$28
$35
3.6X
1.6X
1.7X
3.0X
0.8X
0.00
1.00
2.00
3.00
4.00
$0
$20
$40
$60
$80
2006
2007
2008
2009
2010
Debt
Debt/EBITDA
Source: Omega Protein |
 Investment Summary
1.
Compelling fundamentals support increased demand for
high quality oil and protein
2.
Vertically integrated operations from catch to distribution
3.
Opportunities for organic growth through new product
development
4.
Focus on acquisitions to expand product offerings and
enter new markets
5.
Strong balance sheet with focus on creating
shareholder value
22 |
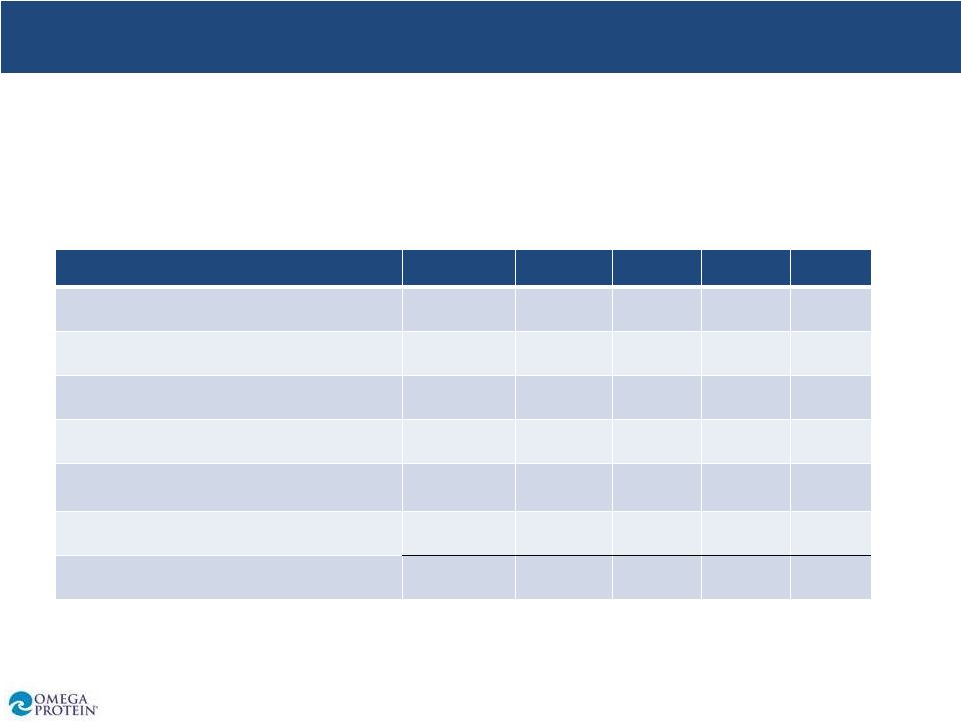 Appendix I
23
2006
2007
2008
2009
2010
Net Income (loss)
5
12
13
(6)
18
Reconciling items:
Interest expense
2
5
4
4
2
Income tax provision (benefit)
1
7
7
(3)
10
Depreciation and amortization
13
13
13
13
15
Debt refinancing costs
-
3
-
-
-
Adjusted EBITDA
21
40
37
8
45
The following table provides a reconciliation of Adjusted EBITDA*, a non-GAAP
(Generally Accepted Accounting Principles) financial measure, to net income,
the most directly comparable financial measure calculated and presented in
accordance with GAAP, for fiscal years ended December 31, 2006, 2007, 2008,
2009 and 2010: |
 Appendix I
24
*Adjusted EBITDA represents net income before interest expense, income tax,
depreciation and amortization and debt financing costs. The Company has
reported Adjusted EBITDA because it believes Adjusted EBITDA is a measure
commonly reported and widely used by investors as an indicator of a company's
operating performance. The Company believes Adjusted EBITDA assists such
investors in comparing a company's performance on a consistent basis.
Adjusted EBITDA is not a calculation based on GAAP and should not be considered an
alternative to net income in measuring our performance or used as an
exclusive measure of cash flow because it does not consider the impact of
working capital growth, capital expenditures, debt principal reductions and other
sources and uses of cash which are disclosed in our consolidated statements
of cash flows. Investors should carefully consider the specific items included
in
our
computation
of
Adjusted
EBITDA.
While
Adjusted
EBITDA
has
been
disclosed
herein
to
permit
a
more
complete
comparative analysis of our operating performance relative to other companies,
investors should be cautioned that Adjusted EBITDA as reported by us may not
be comparable in all instances to Adjusted EBITDA as reported by other
companies. Adjusted EBITDA amounts may not be fully available for management's
discretionary use, due to certain requirements to conserve funds for capital
expenditures, debt service and other commitments, and therefore
management
relies
primarily
on
our
GAAP
results.
Adjusted
EBITDA
is
not
intended
to
represent
net
income
as
defined
by GAAP and such information should not be considered as an alternative to net
income, cash flow from operations or any other measure of performance
prescribed by GAAP in the United States. |