Attached files
| file | filename |
|---|---|
| 8-K - CTWS FORM 8-K DATED DECEMBER 5, 2011 - CONNECTICUT WATER SERVICE INC / CT | ctwsform_8k.htm |

Connecticut Water Service, Inc

Forward Looking Statements
Except for the historical statements and discussions,
some statements contained in this report constitute
“forward looking statements” within the meaning of
Section 27A of the Securities Act of 1933 and Section
21E of the Securities Exchange Act of 1934. These
forward looking statements are based on current
expectations and rely on a number of assumptions
concerning future events, and are subject to a number
of uncertainties and other factors, many of which are
outside our control, that could cause actual results to
differ materially from such statements.
Connecticut Water Service, Inc.
• NASDAQ: CTWS
• Subsidiaries:
– Connecticut Water Company (Regulated)
– New England Water Utility Services, Inc. (Unregulated)
• Market Capitalization:
$237 Million
• Current Dividend and Yield:
$0.95, 3.5%

Connecticut Water Company
• Organized in 1956
• 55 Towns
• Serving 300,000 people
• 200 Employees

Connecticut PURA
Public Utilities Regulatory Authority
Public Utilities Regulatory Authority
• 6 month regulatory lag
• Active directors
• WICA
• Part of the Department of Energy and
Environmental Protection (DEEP)
Environmental Protection (DEEP)
• Regulatory strategy - engage & educate

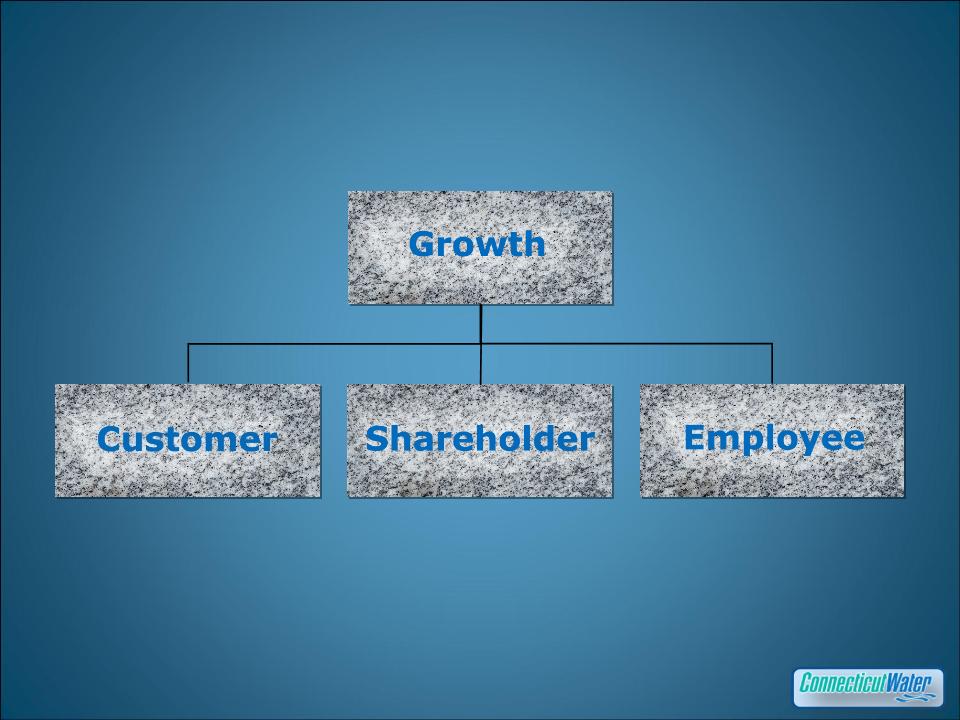
Water Touches Everything
We Care About…
We Care About…

Water Touches Everything
We Care About…
We Care About…
Our Strategy…

• Infrastructure Investment
• Acquisitions
• Utility Services

Infrastructure
Philosophy:
– Invest capital in infrastructure
– Minimize investment vs.
recovery time
recovery time
– Seek to leverage with growth
– Manage operating costs
efficiently
efficiently

Infrastructure
• Traditional Rate Cases
– $10.9 million (22%) 2006
• 2006 marked 1st case in 15
years
years
• 2006 case allowed for
re-opener
$15 million capital improvement
in 2007
in 2007
– $8 million (13%) 2010

WICA
(Water Infrastructure Conservation Adjustment)
(Water Infrastructure Conservation Adjustment)
• DSIC - type infrastructure
recovery mechanism
– 5% annual cap
– 7.5% maximum adjustment
• $13 - 15 million per year in
pipeline replacement
• Current surcharge 3.09%

Capital Expenditures
* 2011 Estimated
** 2012 Projected

• Acquire Water &
Waste Water Systems
• Connecticut
• Atlantic Coast States
• Fair Regulation
• 60 Acquisitions in 20 years

• $33.7M Rate Base
• EV = $53.5M
• Highly regarded local
management team
management team
• MPUC has approved
• Closing in Q1 2012
Utility Services
• 80 client contracts
– O&M
– Leak Detection
– Compliance Reporting
• University of Connecticut

Linebacker Plans®
Protection Programs
Protection Programs
• Service Line Protection
• Sewer/Septic Lines
• Home Plumbing
1/1/10
12/31/10
11/15/11
Enrollments in
Expanded Plans

• High Quality Water
• Responsive and Courteous Service
• Efficient & Effectively
Delivered
• Environmental Stewardship
• Customer Satisfaction!
– World Class 5+ Years

Hurricane Irene
Snow Storm Alfred
Snow Storm Alfred
• Maintained Uninterrupted Service:
– 99.5% of customers in Irene
– 100% of customers in Alfred
• Off the grid for a week:
– 100+ generators in service
– Passionate dedicated employees

Customer Service
(in the Community)
(in the Community)
• Hurricane Irene +
Snow Storm Alfred
Snow Storm Alfred
– Established water filling
stations for private well
owners
stations for private well
owners
– Well received by customers,
communities and regulators
communities and regulators
“I don't know what we would do without your water set-ups!!! We are still without
power here in Killingworth. Just our animals alone (all rescues) drink about 25
gallons of water a day. Cannot thank you enough!!!”
power here in Killingworth. Just our animals alone (all rescues) drink about 25
gallons of water a day. Cannot thank you enough!!!”
-- Facebook post from a non-customer during Irene

Employee Strategy
• Leadership is a privilege
• Trust based
• Team & service oriented
• Professionals
• “Satisfied Employees
Satisfy Customers”
• Employee Satisfaction
– Executive Compensation Metric
Shareholder Strategy
• Strong Dividend Yield
• High Earnings Quality
• Strong Balance Sheet
• Conservative Financial
Management
Management
Performance
• High Earnings Quality
– 90% of Revenues and Earnings
from regulated business
from regulated business
• Strong Balance Sheet
– LTD 5.5% Embedded Cost
– Balanced Debt-Equity ratio
– Access to Capital Doubled
– S & P Rating “A”

2011 - $58.5M
2010 - $55.4M
2010 - $8.0M
2011 - $1.10
2010 - $0.94
Revenue
Net Income
EPS

Dividend Growth

Performance
Total Return @ 12/31/10
Source: Edward Jones Water Utility Industry Summary - 9/30/11

Performance
5 Year Financial Performance
Total Return @ 9/30/11
1.4%
(1.2%)
1.4%
13.5%
CTWS & Peer data source: Edward Jones Water Utility Industry Summary - 9/30/11
