Attached files
| file | filename |
|---|---|
| 8-K - FORM 8-K - SVB FINANCIAL GROUP | d262280d8k.htm |
 J.P. Morgan SMID
Cap Conference December 1, 2011
Greg Becker, President & CEO
Exhibit 99.1 |
| The presentations
made at today’s meeting contain projections or other forward- looking statements
regarding management’s expectations about the future events or the future financial
performance of the Company, as well as future economic, market and tax conditions.
Forward-looking statements are
statements that are not historical facts.
We wish to caution you that such
statements are just predictions and actual events or results may
differ materially,
due to changes in economic, business and regulatory factors and trends.
We refer you to the documents the Company files from time to time with the
Securities and Exchange Commission, specifically the Company’s latest Annual
Report on Form 10-K for the year ended December 31, 2010, which was filed on
February 25, 2011, and our latest Quarterly Report on Form 10-Q.
These
documents contain and identify important risk factors that could
cause the
Company’s actual results to differ materially from those contained in our
projections or other forward-looking statements.
All subsequent written or oral
forward-looking
statements
attributable
to
the
Company
or
persons
acting
on
its
behalf are expressly qualified in their entirety by these cautionary statements. All
forward-looking statements included in this presentation are made only as of
today’s date and the Company undertakes no obligation to update such forward-
looking statements.
Safe Harbor Disclosure
2 |
 SVB’s
Unique Model Strong Performance
Growth Initiatives
Outlook
Overview
3 |
 A Unique
Financial Services Company Differentiated business model
•
Focus on “innovation”
markets
•
Balance sheet lender
•
Strong deposit franchise
•
Diversified revenue streams
Leader
•
Leading market share
•
More than 600 venture firm clients
•
The bank for innovation companies
Established
(1)
•
26 U.S. and seven international offices
•
12,000+ clients and 1,500+ employees
•
$19.2 billion in total assets
•
$34.8 billion in total client funds
(2)
4
(1) As of 9/30/11.
(2) Total client funds includes deposits and off-balance sheet client investment
funds. |
 An Expansive
Financial Services Platform SVB PRIVATE BANK
(Private Banking)
•
Customized loan solutions
for select clients
•
Residential mortgages
•
Deposit services
•
Global ATM access
•
Elite cards
S
ILICON
V
ALLEY
B
ANK
(Commercial Banking)
•
Lending
•
Global Treasury
Management
•
Global Finance
•
Foreign Exchange
•
Investment Solutions
•
Elite cards
SVB GLOBAL
(Global Markets)
•
Global Commercial
Banking
•
Help clients access foreign
markets and opportunities
•
UK, China, Israel and
India
SVB ANALYTICS
(Analytics/Benchmarking)
•
Private company
409A valuations
•
Corporate equity mgmt.
•
Stock option expense
solutions
•
Corporate performance
benchmarking SVB CAPITAL
(VC Funds Management)
•
$1.0B+ fund family
•
Investments in 450+ funds domestically and internationally
5 |
 Strong Q3 2011
Performance Outstanding
loan growth
Continued high
credit quality
Stable net interest
margin
Solid warrant and
VC fund gains
Robust net
interest income
growth
Strong client
transaction
volumes
Continued deposit
growth
Positive conditions
in client markets
Total client
liquidity at all-
time high *
6
•Total client liquidity includes
deposits and off-balance sheet client investment funds. |
 27% Annual Growth
in Net Interest Income in 2011 Millions
NIM
7
All-time high |
 Growth in Average
Loans of 23% Since Q308 8
Growth Drivers
•
Resilience of innovation
sector and our clients
•
Growing pervasiveness
of technology
•
Growth initiatives:
o
U.S. domestic
o
Segmentation
o
Private Bank
o
Global
•
M&A market activity
among our clients
Billions
$0.0
$1.0
$2.0
$3.0
$4.0
$5.0
$6.0
$7.0
Period-end Loans
Average Loans |
 Solid Credit
Quality Through Cycles 9
Loss experience through multiple cycles suggests diversity and resilience of
“innovation”
industries results in little “concentration risk.”
-1%
0%
1%
2%
3%
4%
5%
NPLs as % of Total Gross Loans
NCOs as % of Total Gross Loans
3.32%
0.63%
0.11%
-0.15%
-1%
0%
1%
2%
3%
4%
5%
NPLs as % of Total Gross Loans
NCOs as % of Total Gross Loans
2.28%
3.21%
0.63%
1.57% |
 Powerful Deposit
Franchise 10
Billions
$34.8
Organic Factors
•
Highly liquid clients
•
Clients performing well
•
New client acquisition
Other Factors
•
Safety of the balance
sheet (unlimited FDIC
insurance)
•
Low rate environment
$18.7
$16.1
$40
$35
$30
$25
$20
$15
$10
$5
$0
Period-End
Deposits
Period-End Client Investment Funds |
 Diversified
Growth Across the Business 11
GLOBAL MARKETS & REACH
GLOBAL PLATFORM
New Global Core
Banking System
IT Backbone
Upgrade
Enhanced Global
Payment System
Enhanced On-
line/Mobile Systems
PRODUCT LINES
Expanded Banking
Network
New Debit & Credit
Cards
New Products &
Services
Enhanced Credit
Solutions
CLIENT NEEDS
Client Experience
Corporate Finance
Segment
Growth Segment
Private Bank
UK and Europe
India
China
Israel |
 Expecting Solid
Performance in 2012 12
Business Driver
Preliminary 2012 Outlook
vs. 2011
(1)
Average loans
Mid-teens % growth
Gross loan charge-offs
40-70 bps of average total gross
loans
Net interest income
~10% growth
“Core”
(2)
fee income
Mid single digit % growth
Expenses
Mid to high single digit %
growth
(1)
Change estimates relative to expected 2011 full-year results; outlook is preliminary as of
October 20, 2011, and may change.
(2)
“Core” is defined as fees for deposit services, letters of credit, business credit
card, client investment, and foreign exchange, in aggregate. |
 |
 Appendix
1)
Financial Results
15
•
Highlights
16
•
Loans & Credit Quality
18
•
Client Liquidity
21
•
Balance Sheet
22
•
Sensitivity Charts
23
•
Capital Ratios
25
2)
Growth Initiatives
27
3)
Venture Capital Markets
31
4)
Non-GAAP Reconciliations
34 |
 Financial
Results 15
Appendix |
 Financial
Highlights: Q310 – Q311
Q3 2010
Q4 2010
Q1 2011
Q2 2011
Q3 2011
Diluted Earnings Per Share
$0.89
(3)
$0.41
$0.76
$1.50
(1)(2)
$0.86
Net Income Available to
Common Stockholders
$37.8M
(3)
$17.5M
$33.0M
$65.8M
(1)(2)
$37.6M
Average Loans
(Change)
$4.5B
(+9.4%)
$5.0B
(+11.3%)
$5.3B
(+6.1%)
$5.5B
(+4.2%)
$6.0B
(+8.6%)
Average Deposits
(Change)
$11.9B
(+0.1%)
$13.3B
(+11.6%)
$14.7B
(+10.3%)
$15.3B
(+4.1%)
$15.8B
(+3.5%)
Net Interest Margin
3.14%
2.74%
2.96%
3.13%
3.13%
Net Interest Income
$106.3M
$104.5M
$120.3M
$130.5M
$135.5M
Non-Interest Income
$86.2M
(3)
$71.9M
$90.0M
$123.7M
(1)
$95.6M
Net (Recoveries) Charge-
Offs/Total Average Gross
Loans
0.73%
0.57%
(0.19%)
(6)
0.00%
(5)
(0.15%)
(4)
Non-Interest Expense
$104.2M
$115.9M
$117.4M
$121.0M
(2)
$127.5M
(4)
Represents net recoveries of $2.3M.
(5)
Represents net charge-offs of $30K.
(6)
Represents net recoveries of $2.5M.
(1)
Includes gains of $0.51/share or $22.5M (net of tax) from sales of AFS securities.
(2)
Includes gains of $0.04/share or $1.9M (net of tax) from the early extinguishment of
debt and the termination of corresponding interest rate swaps.
(3)
Includes gains of $0.34/share or $14.2M (net of tax) from sales of AFS securities.
16
Appendix –
Financial Results (Highlights) |
 Financial
Highlights: 2007 -2010 2007
2008
2009
2010
Diluted Earnings Per Share
$3.28
$2.16
$0.66
$2.24
Net Income Available to
Common Stockholders
$120.3M
$73.6M
$22.7M
$95.0M
Average Loans
(Change)
$3.5B
(+22.2%)
$4.6B
(+31.5%)
$4.7B
(+1.4%)
$4.4B
(-5.6%)
Average Deposits
(Change)
$4.0B
(+1.0%)
$4.9B
(+23.6%)
$8.8B
(+79.6%)
$12.0B
(+36.8%)
Average AFS Securities
$1.4B
$1.3B
$2.3B
$5.3B
Net Interest Margin
7.19%
5.72%
3.73%
3.08%
Net Interest Income
$375.8M
$368.6M
$382.2M
$418.1M
Non-Interest Income
$221.0M
$152.4M
$97.7M
$247.5M
Net Charge-Offs/Total Average
Gross Loans
0.35%
0.87%
2.64%
0.77%
Non-Interest Expense
$346.5M
$312.9M
$343.9M
$422.8M
17
Appendix –
Financial Results (Highlights) |
 A
Well-Performing Loan Portfolio While strategically important, early-
stage has become a smaller portion
of our portfolio as a result of
growth in lending to larger
companies.
Our loan portfolio is focused but
well diversified
within technology
lending.
Total:
$6.3
billion
as
of
9/30/11
18
Appendix –
Financial Results (Loans)
Early-Stage
loans =
~9% of total
portfolio
(vs. ~30% in
2001) |
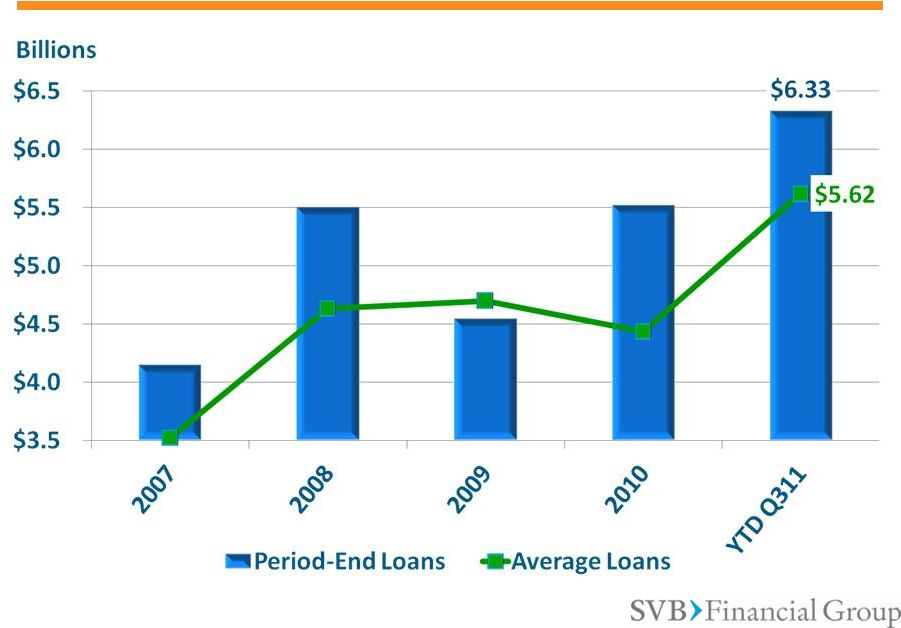 Loans Are at an
All-Time High 19
Appendix –
Financial Results (Loans) |
 Credit Quality
Has Remained Strong 20
Appendix –
Financial Results (Credit Quality) |
 Solid Franchise
With Consistent Growth 21
Billions
21
Appendix –
Financial Results (Assets)
•
Total client funds includes deposits and off-balance sheet client investment funds.
|
 We Are Highly
Liquid (1)
As of 9/30/11.
(2)
Net of non-controlling interests, non-marketable securities were $346.4 million.
Non-GAAP number. Please see non-GAAP reconciliations at end of presentation and
in our most recent financial releases for more information. Non-Marketable
Securities
(VC Investments)
(2)
22
Appendix –
Financial Results (Balance Sheet) |
 Rate Increases
Will Benefit Us Significantly We
expect
each
25
bps
increase
in
the
Fed
Funds
rate
to
contribute
approximately
$6
–
$9
million
to
Net
Interest
Income*
* Tax-effected; estimates are based on static balance sheet and assumptions as of
9/30/11 Changes in
Fed Funds
Rate (basis
points)
Changes in
Net Interest
Income (tax
effected)
Incremental
EPS Effect
Incremental
ROE Effect
Net Interest
Margin Effect
+75
+19.1M
$0.44
+0.9%
+0.18%
+100
+$26.8M
$0.62
+1.3%
+0.25%
+200
+$67.3M
$1.56
+3.2%
+0.63%
+300
+$108.3M
$2.51
+5.0%
+1.01%
23
Appendix –Financial Results (Rate Sensitivity) |
 Higher Loan
Balances Will Benefit Us * Estimates
are
based
on
static
balance
sheet
and
assumptions
as
of
9/30/11
We expect each $250 million increase in loan volume to
contribute approximately $0.23 to EPS*
Growth in
Overall Loan
Balances
($$)
Changes in
Net Interest
Income (tax
effected)
Incremental
EPS Effect
Incremental
ROE Effect
Net Interest
Margin
Effect
+250 million
+$9.7M
$0.23
+0.5%
+0.09%
+500 million
+$19.4M
$0.45
+0.9%
+0.18%
+750 million
+$29.1M
$0.68
+1.64%
+0.27%
+1 billion
+$38.8M
$0.90
+1.9%
+0.36%
24
Appendix –Financial Results (Rate Sensitivity) |
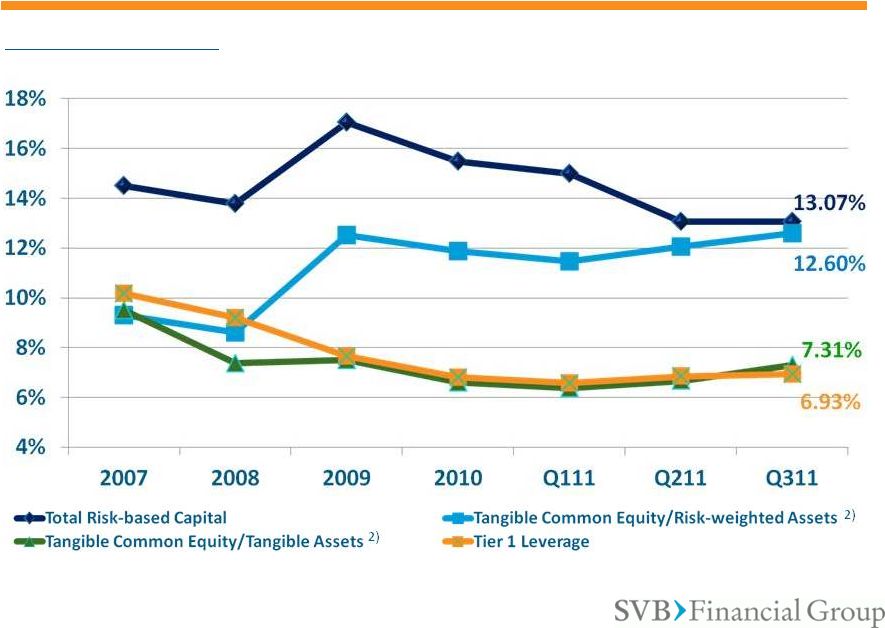
 We Are Well
Capitalized 25
Appendix –Financial Results (Capital Ratios)
•
TCE/TA and TCE/RWA are non-GAAP numbers; please refer to Non-GAAP reconciliations at end
of presentation and in our most recent financial releases for more information.
Holding Company Capital Ratios |
 We Are Well
Capitalized 2)
26
Appendix –Financial Results (Capital Ratios)
1)
All ratios, except TCE/TA and TCE/RWA are as reported in our most recent Bank Call
Reports. Bank TCE/TA and TCE/RWA ratios are as reported in our most recent financial releases.
2)
TCE/TA and TCE/RWA are non-GAAP numbers; please refer to non-GAAP reconciliations at end
of presentation and in our most recent financial releases for more information. Bank
Capital Ratios 1)
2) |
 Growth
Initiatives 27
Appendix
–
Growth
Initiatives |
 We’re
Supporting Clients At All Stages 28
Appendix
–
Growth
Initiatives
~50%
Market Share
10% –
12%
Market Share
< 10%
Market Share |
 Prior to
2011
2011 -
2012
Long Term
Financial
Impact
-
Rep office
-
Loan
production
office
Branch and
full product
set
Subsidiary bank +
Europe; expansion
and growth
0-2 years
-
Rep Office
-
Funds
JV Bank and
related
activities
Subsidiary
Branch; expansion
and growth
3-5 years
-
Rep Office
-
Loan
production
office
Expansion and
growth
0-2 years
-
NBFC
-
Fund
Develop NBFC
Branch or
subsidiary
3-5 years
We Are Extending Our Platform Globally
29
29
Appendix
–
Growth
Initiatives |
 Private
Bank •
Expanded private banking services
•
Tailored lending for influencers in the SVB
ecosystem
•
An advanced, easy-to-use, online platform
•
Support for clients’
success in all arenas:
business, family, life
30
Appendix –
Growth Initiatives |
 Venture Capital
Markets 31
Appendix –
Venture Capital Markets |
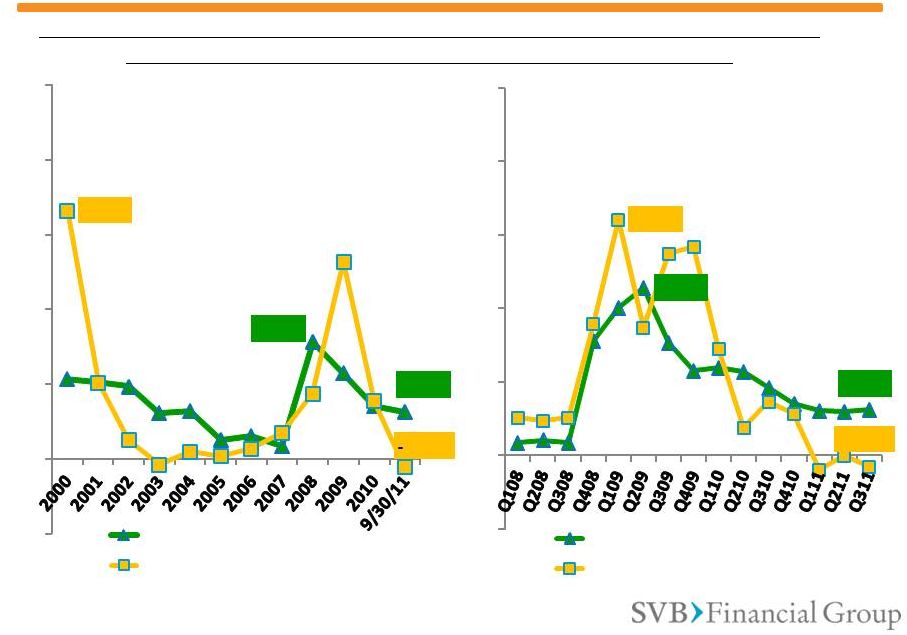
 Stabilizing VC
Markets 32
Appendix –
Venture Capital Markets
Source:
ThomsonReuters,
National
Venture
Capital
Association,
PricewaterhouseCoopers
-
MoneyTree |
 Source:
ThomsonReuters,
National
Venture
Capital
Association,
PricewaterhouseCoopers
-
MoneyTree
33
Appendix –
Venture Capital Markets
Stabilizing VC Markets
Deal
Volume |
 Non-GAAP
Reconciliations 34
Appendix –
Non-GAAP Reconciliations |
 Non-GAAP
TCE/TA and TCE/RWA Reconciliation 35
Appendix –
Non-GAAP Reconciliations
September 30,
June 30,
March 31,
December 31,
December 31,
December 31,
December 31,
2011
2011
2011
2010
2009
2008
2007
GAAP SVBFG stockholders' equity
1,536,098
$
1,436,893
$
1,313,574
$
1,274,350
$
1,128,343
$
991,356
$
676,369
$
Less: intangible assets
650
709
749
847
665
1,087
1,632
Less: goodwill
-
-
-
-
-
4,092
4,092
Less: preferred stock
-
-
-
-
-
221,185
-
Tangible common equity (TCE)
1,535,448
$
1,436,184
$
1,312,825
$
1,273,503
$
1,127,678
$
764,992
$
670,645
$
GAAP total assets
19,195,363
$
19,366,735
$
18,618,266
$
17,527,761
$
12,841,399
$
10,018,280
$
6,692,171
$
Less: intangible assets
650
709
749
847
665
1,087
1,632
Less: goodwill
-
-
-
-
-
4,092
4,092
Tangible assets (TA)
19,194,713
$
19,366,026
$
18,617,517
$
17,526,914
$
12,840,734
$
10,013,101
$
6,686,447
$
Risk-weighted assets (RWA)
10,808,233
$
10,470,533
$
10,004,948
$
9,406,677
$
7,494,498
$
8,220,447
$
6,524,021
$
Tangible common equity to tangible
assets
8.00
%
7.42
%
7.05
%
7.27
%
8.78
%
7.64
%
10.03
%
Tangible common equity to risk-
weighted assets
14.21
13.72
13.12
13.54
15.05
9.31
10.28
Non-GAAP tangible common equity and
tangible assets (dollars in thousands,
except ratios)
SVB Financial
For additional non-GAAP disclosures, please refer to our latest Forms 10-Q and 10-K,
as well as our quarterly earnings releases. |
 Non-GAAP
TCE/TA and TCE/RWA Reconciliation 36
Appendix –
Non-GAAP Reconciliations
September 30,
June 30,
March 31,
December 31,
December 31,
December 31,
December 31,
2011
2011
2011
2010
2009
2008
2007
GAAP stockholders' equity
1,317,325
$
1,216,268
$
1,107,544
$
1,074,561
$
914,068
$
695,438
$
586,949
$
Less: intangible assets
-
-
-
-
-
-
-
Tangible common equity (TCE)
1,317,325
$
1,216,268
$
1,107,544
$
1,074,561
$
914,068
$
695,438
$
586,949
$
GAAP total assets
18,016,695
$
18,227,021
$
17,397,095
$
16,268,589
$
12,186,203
$
9,419,440
$
6,164,111
$
Less: intangible assets
-
-
-
-
-
-
-
Tangible assets (TA)
18,016,695
$
18,227,021
$
17,397,095
$
16,268,589
$
12,186,203
$
9,419,440
$
6,164,111
$
Risk-weighted assets (RWA)
10,453,446
$
10,075,105
$
9,655,938
$
9,047,907
$
7,293,332
$
8,109,332
$
6,310,721
$
Tangible common equity to tangible
assets
7.31
%
6.67
%
6.37
%
6.61
%
7.50
%
7.38
%
9.52
%
Tangible common equity to risk-
weighted assets
12.60
12.07
11.47
11.88
12.53
8.58
9.30
Non-GAAP tangible common
equity and tangible assets (dollars in
thousands, except ratios)
Bank
For additional non-GAAP disclosures, please refer to our latest Forms 10-Q and 10-K,
as well as our quarterly earnings releases. |
 Non-GAAP
Non-Marketable Securities Reconciliation 37
Appendix –
Non-GAAP Reconciliations
September 30,
2011
GAAP non-marketable securities
951,963
$
Less: noncontrolling interests in non-marketable securities
605,558
Non-GAAP non-marketable securities, net of noncontrolling interests
346,405
$
Non-GAAP non-marketable securities, net of noncontrolling interests
(dollars in thousands)
For additional non-GAAP disclosures, please refer to our latest Forms 10-Q and 10-K,
as well as our quarterly earnings releases. |
 |