Attached files
| file | filename |
|---|---|
| 8-K - FORM 8-K - PEABODY ENERGY CORP | btu8k20111130.htm |
 Investor Presentation
November 2011
 Statement on Forward-Looking Information
Some of the following information contains forward-looking statements within the meaning of Section 27A of the Securities Act of 1933 and Section 21E of the Securities Exchange Act of 1934, as amended, and is intended to come within the safe-harbor protection provided by those sections.
Our forward-looking statements are based on numerous assumptions that the company believes are reasonable, but they are open to a wide range of uncertainties and business risks that may cause actual results to differ materially from expectations as of October 25, 2011. These factors are difficult to accurately predict and may be beyond the company's control. The company does not undertake to update its forward-looking statements. Factors that could affect the company's results include, but are not limited to: demand for coal in the United States and the seaborne thermal and metallurgical coal markets; price volatility and demand, particularly in higher-margin products and in our trading and brokerage businesses; impact of weather and natural disasters on demand, production and transportation; reductions and/or deferrals of purchases by major customers and ability to renew sales contracts; credit and performance risks associated with customers, suppliers, co-shippers, trading, banks and other financial counterparties; geologic, equipment, permitting and operational risks related to mining; transportation availability, performance and costs; availability, timing of delivery and costs of key supplies, capital equipment or commodities such as diesel fuel, steel, explosives and tires; successful implementation of business strategies, including our Btu Conversion and generation development initiatives; negotiation of labor contracts, employee relations and workforce availability; changes in postretirement benefit and pension obligations and funding requirements; replacement and development of coal reserves; availability, access to and the related cost of capital and financial markets; effects of changes in interest rates and currency exchange rates (primarily the Australian dollar); ability to fund, complete, and integrate Macarthur and other acquisitions; economic strength and political stability of countries in which we have operations or serve customers; legislation, regulations and court decisions or other government actions, including new environmental and mine safety requirements, changes in income tax regulations or other regulatory taxes; litigation, including claims not yet asserted; and other risks detailed in the company's reports filed with the Securities and Exchange Commission (SEC). The use of “Peabody,” “the company,” and “our” relate to Peabody, its subsidiaries and majority-owned affiliates.
EBITDA or Adjusted EBITDA is defined as income from continuing operations before deducting net interest expense, income taxes, asset retirement obligation expense, and depreciation, depletion and amortization. EBITDA, which is not calculated identically by all companies, is not a substitute for operating income, net income or cash flow as determined in accordance with United States generally accepted accounting principles. Management uses EBITDA as a key measure of operating performance and also believes it is a useful indicator of the company's ability to meet debt service and capital expenditure requirements.
2
 Peabody Energy: Expanding Global Reach to Serve Coal's Supercycle
Unmatched international growth pipeline with major Australian and Asia projects
Largest position in fastest growing U.S. regions
Significant upside with earnings growth and multiple expansion
3
 Peabody Platform Delivers Superior Margins in All Markets
Peabody Gross Margins
2009
2010
YTD 2011
Well positioned in U.S. with highly-contracted production; increasing global volumes to serve expanding Asia-Pacific economies
Leading positions in low-cost U.S. regions of ILB and PRB
Australia expansions at Wilpinjong and Metropolitan targets cost benefits
Targeting process improvements and upgrades across the platform to manage costs
YTD data as of September 30, 2011. Peer group includes ACI, ANR, CLD, CNX and PCX for all periods; MEE and ICO for 2009 and 2010 only.
4
 Peabody's Earnings Now Balanced with Australia
Peabody continues transformation to global coal company
Multiple global initiatives increase earnings leverage to stronger international markets
2003 U.S. > 99%
2007 U.S. 83% Australia 17%
YTD 2011 U.S. 51% Australia 49%
Percentages represent share of Mining EBITDA. YTD information as of Sept. 30, 2011.
5
 Global Coal Markets
 World in Early Stages of Supercycle for Coal
 Asia Represents 90% of 4.4 Billion Tonne Coal Demand Growth
Coal Demand Growth 2009 - 2035 (Tonnes in Millions):
+50
+315
+1,080
+100
+2,220
+710
Coal Demand Growth 2009 - 2035 (Tonnes in Millions)
U.S. growth presented in short tons.
Source: World Energy Outlook 2011, International Energy Agency; Annual Energy Outlook 2011, Energy Information Administration; Peabody analysis.
7
 Thermal Coal Market: Global Coal-Fueled Generation Growing Dramatically
New Coal-Fueled Generation 2011 - 2020 (GW)
China 450
India 125
Other Asia 57
Others 26
Europe 25
USA 8
~700 GW of new/ announced generation requires more than 2 billion tonnes of new annual thermal coal supply over the next decade
Nearly 300 million tonnes of new coal demand for generation expected this year alone
Asia represents 90% of expected growth in new coal generation
Australia/Indonesia Expected to Supply Majority of Seaborne Thermal Growth
Source: Platts Worldwide Power Plant Database and Peabody analysis.
8
 Metallurgical Coal Market: Use Expected to Rise >500 Million Tonnes by 2020
Approximately 50 Million Tonnes of New Supply Required Each Year
Global Met Coal Demand (Tonnes in Millions)
2010 920
2015 1,185
2020 1,440
Growth
2015 ~30%
2020 ~60%
CAGR
2015 ~5%
2020 ~5%
Australia Expected to Supply Majority of Seaborne Metallurgical Coal Growth
Source: Peabody Global Energy Analytics.
9
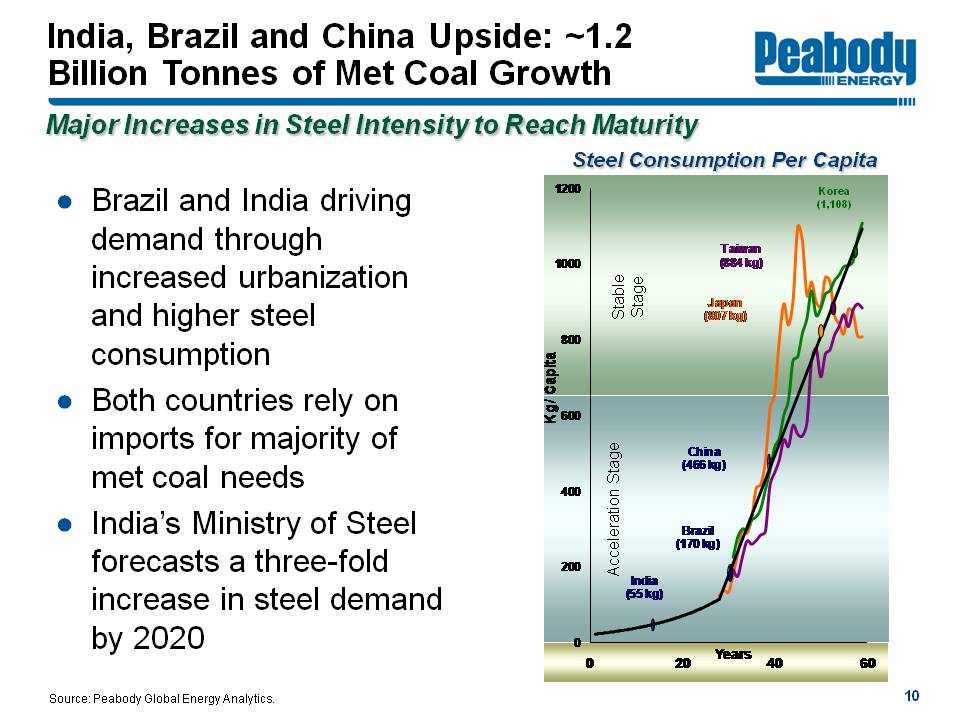
India, Brazil and China Upside: ~1.2 Billion Tonnes of Met Coal Growth
Major Increases in Steel Intensity to Reach Maturity
Brazil and India driving demand through increased urbanization and higher steel consumption
Both countries rely on imports for majority of met coal needs
India's Ministry of Steel forecasts a three-fold increase in steel demand by 2020
Steel Consumption Per Capita
Stable Stage
Japan 807kg
Taiwan 884kg
Korea 1,108
Acceleration Stage
India 55kg
Brazil170kg
China 466kg
Source: Peabody Global Energy Analytics.
10
 U.S. Market: PRB and Illinois Basin Expected to Grow as Appalachia Declines
U.S. Demand Growth Moderate, Significant Shifts in Key Basins
CAPP challenged by permitting, geology, safety and significant increases in cost structure
PRB and ILB demand growing from new plants, increasing exports and fuel switching in Eastern markets
Ultra-low sulfur PRB demand expected to increase due to new EPA regulations
Expected U.S. Coal Demand Change 2010 - 2015
(Tons in Millions)
CAPP (45-55)
Other (10-15)
NAPP (5) - 5
ILB 45-55
PRB 60-70
Estimates based on Peabody analysis and industry reports. Includes exports.
11
 Near-Term Global Coal Fundamentals Favor Peabody/Macarthur Portfolio
 Largest YTD Inventory Drawdowns Since 1993
New Air Rules Likely to Lift Value of Ultra-Low Sulfur PRB Coal
Europe Raises Coal Use on Lower Nuclear Burn and High Gas Prices
India Thermal Coal Imports Up 40% YTD
Global Steel Production Up 8% YTD
Thermal Generation Up 14% YTD; Imports Running Above Prior Year Levels
Japan Utility Coal Use Recovering as Nuclear Use Shrinks to New Lows
Tight Australian Supply, Met & Thermal Prices Above 2010 Levels
Year-to-date information as of October 2011.
Source: Industry reports and Peabody analysis.
12
 Peabody Targeting Multiple Growth Projects
Energizing the world on BTU at a time
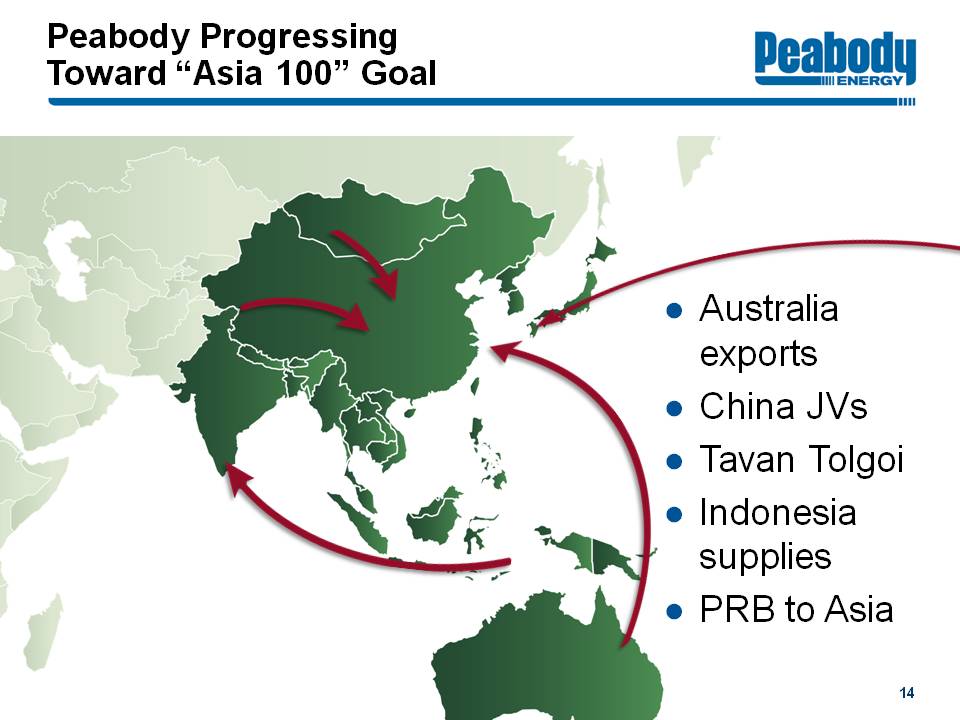 Peabody Progressing Toward “Asia 100” Goal
Australia exports
China JVs
Tavan Tolgoi
Indonesia supplies
PRB to Asia
14
 Australia Platform Expanding Through Organic Growth and Macarthur Acquisition
 Expansions are in process at Burton, Wilpinjong, Metropolitan and other operations
Expected Australia Volumes
2010
Domestic Thermal 6
Seaborne Thermal 11
Met 10
Total 27
2011
Domestic Thermal 6.5
Seaborne Thermal 12-13
Met 8.5-9.5
Total 27-29
2014-2015
Domestic Thermal ~8
Seaborne Thermal 15-17
Met 12-15
Macarthur 10
Total 45-50
Macarthur volumes based on Macarthur plans at time of acquisition; ultimate production and timing subject to future investments and other factors.
15
 Peabody Delivering on Organic Growth Projects
 Planned Expansions (Tons in Millions)
Mine
Additional MTPY
First Coal
Burton 1 - 2 HCC Late 2012
North Goonyella 1 - 2 HQHCC 2014
Millennium 1 - 2 SH/PCI Late 2011
Wilpinjong 2 - 3 T Q4 2011
Wambo ~3 T 2012 - 2013
Metropolitan 1 HCC Late 2013
Met Coal Mine
Burton
North Goonyella
Eaglefield
Millennium
Metropolitan
Thermal Coal Mine
Wilkie Creek
Wilpinjong
Wambo Underground
Wambo Open Cut
Port
Abbot Point
Dalrymple Bay
Gladstone
Brisbane
PWCS
NCIG
Port Kembla
Queensland
New South Wales
Additional volumes expected to be offset by some mine depletions.
16
 Overview of Acquisition of Macarthur Coal (ASX: MCC)
Transaction Description Purchase of 100% of the shares of Macarthur Coal
Transaction Structure Takeover under Australian securities law
Equity Purchase Price A$16.25 per share = A$4.9 billion; US$5.1 billion
Peabody Share Up to 100% (ArcelorMittal intends to sell 40% interest)
Financing Cash and debt
Status 90% relevant interest achieved; Compulsory acquisition of remaining shares under way
Sales Macarthur: 4.2 Mt in FY 2011 from two active mines Macarthur guidance of 5.5 - 5.8 Mt in FY 2012 (ending June 30)
Growth Platform Expanding mines and new growth projects Reserves of 286 MT on 100% basis (184 MT attributable basis); Resources of 2.6 BT on 100% basis (1.9 BT attributable basis)
US$ conversion assumes currency exchange of 1.03 AUD:USD; Tons shown in short tons, unless otherwise noted; Reserves and resources based on Macarthur June 30, 2011 reporting using JORC basis; FY refers to fiscal year ended June 30.
17
 Acquisition Delivers Value Via Increased Global Access, Earnings Expansion
Macarthur acquisition expands Peabody's presence with quality met product in high-growth region
Provides growth opportunities, large reserve base and significant potential synergies
Continues global buildout and earnings contribution from international assets
18
 PCI in Growing Demand from Global Steel Producers
 Global PCI Market Growing at 5% CAGR
Pulverized Coal Injection (PCI) a replacement for coke made from met coal
Steelmakers expanding use of PCI to reduce costs
Majority of high quality,
low-vol PCI supply from Australia
Low-vol PCI typically priced at 70% to 80% of
HQ Hard Coking Coal
Steel making process using LV PCI Coal
Coking Coal
Coke Oven
Coke
Iron Ore
Flux
Blast furnace
Slag
Pig Iron
Hot Air
LV PCI Coal
Steel Production
Source: Macarthur Coal
19
 Macarthur: Active Production Base With Major Growth Pipeline
Queensland
Port
Abbott Point
Dalrymple Bay
Gladstone
Wiggins Island
Peabody Met Coal Mine
Burton
North Goonyella
Eaglefield
Millennium
Macarthur Mine
Coppabella
Moorvale
Macarthur Development
Olive Downs
Codrilla
Vermont East
Middlemount
Peabody Met Coal Mine
Port
Macarthur Mine
Macarthur Development
Producing mines million short tons Coppabella Resources 100% 214 Attributable 157 Reserves 65 48 Production FY 2011 2.3 Moorvale 126 93 47 34 1.9
Announced Projects Middlemount 135 68 106 53 0 Codrilla 88 64 55 40 0
Development Projects Vermont East / Wilunga 541 466 TBD TBD 0 Olive Downs North 140 103 13 9 0 Olive Downs South 300 270 TBD TBD 0
Exploration / Concept Projects
Potential exploration projects provide additional resources of more than 1 billion tons (100% basis) or 720 million tons (attributable basis).
Macarthur data based on June 30, 2011 public filings; Resources and reserves shown on a JORC basis and converted to short tons.
20
 Transaction Significantly Strengthens Peabody's Position in Australia
Peabody Australia pro forma 2010 production of 32 million tons with Macarthur
Pro forma production of 45 - 50 million tons by 2014-15 given combined growth platforms
Australian Production
Thermal
Met
Tons in Millions
Xstrata 57
BHP/BMA 53
Proforma BTU Australia2015 45-50
Rio Tinto 34
Anglo American 32
Proforma BTU Australia2010 32
BTU Australia 27
Wesfarmers 15
New Hope 6
Macarthur 5
Vale 4
Whitehaven 4
Gloucester 3
Note: Pro forma 2010 BTU production combines Peabody and calendarized Macarthur production; Pro forma 2015 production based on current Peabody growth targets and Macarthur's growth plans at time of acquisition; ultimate production and timing subject to future investments and other factors; Production shown in millions of short tons.
21
 Macarthur Acquisition Fully Financed With Cash and Debt
Financing in place:
$1.0 billion in cash
$1.0 billion new term loan
$3.1 billion new senior notes
Aligns with Peabody's financial strategy:
Maintains leverage in comfortable range
Ensures adequate liquidity to run business
Takes advantage of historically low interest rates
Avoids refinancing risk in any given year
Peabody's Debt-to-Capital Ratio (%)
Target Zone: 40 - 60
2006* 57
2007 52
2008 47
2009 42
2010 37
9/2011 32
Post-MCC 56
Debt-to-cap calculations above assume 100% ownership in Macarthur.
*2006 ratio reflects pro forma June 30, 2006 data used at the time of the Excel Coal acquisition.
22
 Macarthur Acquisition: Next Steps
Complete acquisition and implement transition plan
Achieve synergies
Operational performance
Supply chain efficiencies
Marketing/blending potential
Improve mining plan and equipment efficiency at Coppabella Mine in coming months
Advance growth projects to build production pipeline
23
 Asia Initiatives: Pursuing Development of One of China's Largest Mines
Advancing 50 million ton-per-year thermal project in Xinjiang Province
Xinjiang likely to be world's fastest growing coal region
100 million tonnes of production in 2010
May reach 1 billion tonnes per year by ~2025
Government supportive
Committed to accelerate coal reserve allocations
China's coal production base is shifting from older, underground operations in the East to large-scale open-cut operations in the Western provinces Xinjiang development would be one of China's largest mines.
Xinjiang
Tibet
Qinghai
Gansu
Inner Mongolia
Ningxia
Sichuan
Yunnan
Heilongjiang
Jilin
Liaoning
Beijing
Shanxi
Hebei
Tianjin
Shaanxi
Shandong
Henan
Jiangsu
Anhui
Hubei
Chongqing
Guizhou
Guangxi
Hunan
Hainan
Jiangxi
Shanghai
Zhejiang
Fujian
Guangdong
Hong Kong
Taiwan
24
 Advancing Multiple Projects to Serve Growing Demand Within China
Yankuang Wucaiwan Mine
Pursuing development of
20 million ton-per-year surface mine in Xinjiang
Would include 2 GW supercritical power plant and SNG facility
Lu'an Shaxi Mine
Pursuing development of
15 million ton-per-year surface
mine in Xinjiang
GreenGen Plant
Only non-Chinese equity partner
in 650 MW IGCC plant
First phase starts up this year
CCS for enhanced oil recovery
The GreenGen coal-fueled IGCC plant near Tianjin is due to begin operations later this year
25
 Peabody Leveraging Leading PRB and Illinois Basin Presence
Peabody's North Antelope Rochelle Mine produces more than 100 million tons per year of ultra-low sulfur coal with a sulfur content 40% below the benchmark PRB product - a valuable feature in a market with rising SO2 allowance prices
Illinois Basin to…
New York, South Carolina and Florida
Europe and India through Gulf of Mexico
Powder River Basin to…
Asia via West Coast
Europe through Gulf
Eastern U.S. backfill for CAPP
Texas and other lignite regions to comply with CSAPR regs
26
 Advancing Multiple Projects in U.S.
Bear Run
Growing to ~8 MT in 2012
Gateway North
Expanding ~40% to 4.5 MT
by 2014
Powder River Basin
Adding ultra-class trucks; Modest volume growth
in 2011
Accessing NARM North reserves and loadout facilities for blending opportunities, margin enhancements and export supplies
West Coast Exports
Developing plans for PRB exports to Asia at scale
Peabody has as 24 million tonne per year throughput agreement for a deep-draft export facility being permitted in Cherry Point, Wash.
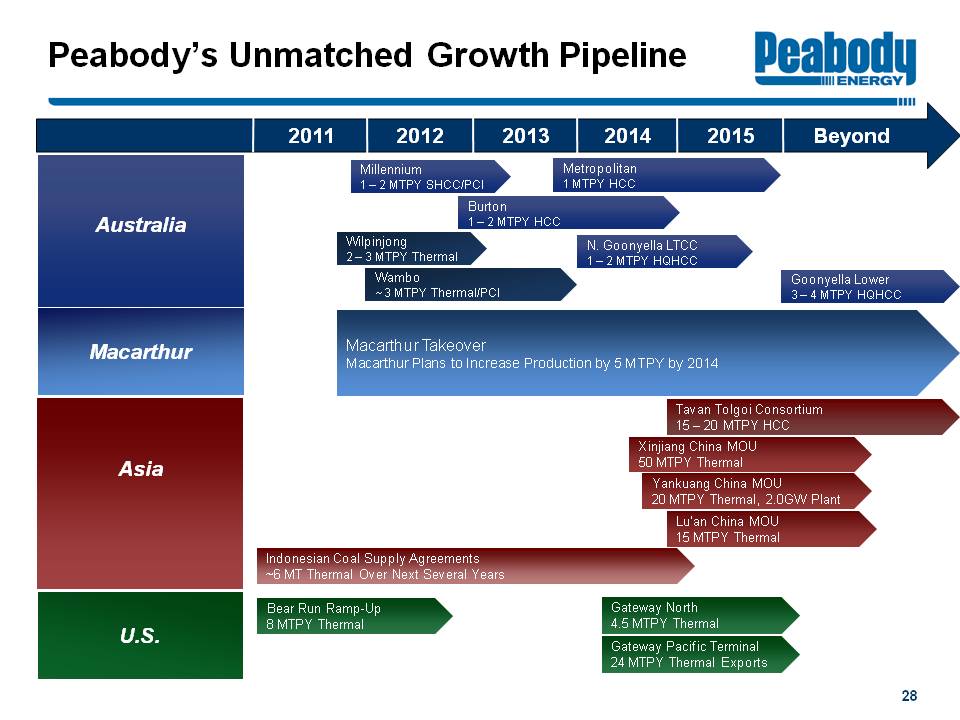 Peabody's Unmatched Growth Pipeline
2011 2012 2013 2014 2015 Beyond
Australia
Millennium 1-2 MTPY SHCC/PCI
Burton 1 - 2 MTPY HCC
Metropolitan 1 MTPY HCC
N. Goonyella LTCC 1 - 2 MTPY HQHCC
Wilpinjong 2 - 3 MTPY Thermal
Wambo ~3 MTPY Thermal/PCI
Goonyella Lower 3-4 MTPY HQHCC
Macarthur
Macarthur Takeover
Macarthur Plans to Increase Production by 5 MTPY by 2014
Asia
Tavan Tolgoi Consortium 15 - 20 MTPY HCC
Xinjiang China MOU 50 MTPY Thermal
Yankuang China MOU 20 MTPY Thermal, 2.0GW Plant
Lu'an China MOU 15 MTPY Thermal
Indonesian Coal Supply Agreements ~6 MT Thermal Over Next Several Years
U.S.
Bear Run Ramp-Up 8 MTPY Thermal
Gateway North 4.5 MTPY Thermal
Gateway Pacific Terminal 24 MTPY Thermal Exports
28
 Peabody Positioned for Significant Growth and Value Creation
Industry Leading Reserves and Production Base
Major Cash Flow Generation and Strong Balance Sheet
Expanding in Fastest Growing Global Markets
Significant Organic Growth Capability
Addition of Macarthur Coal
Multiple Expansion to Return to More Traditional Levels
BTU Drivers To Deliver Premium Valuation
29

Investor Presentation
November 2011