Attached files
| file | filename |
|---|---|
| 8-K - FORM 8-K - Approach Resources Inc | d260459d8k.htm |
 J.P. Morgan
10 th
Annual
SMid Cap Conference
December 1, 2011
Exhibit 99.1 |
 | 2 |
APPROACH RESOURCES
Forward-looking statements
Cautionary statements regarding oil and gas quantities
This
presentation
contains
forward-looking
statements
within
the
meaning
of
Section
27A
of
the
Securities
Act
of
1933
and
Section
21E
of
the
Securities
Exchange
Act
of
1934.
All
statements,
other
than
statements
of
historical
facts,
included
in
this
presentation
that
address
activities,
events
or
developments
that
the
Company
expects,
believes
or
anticipates
will
or
may
occur
in
the
future
are
forward-looking
statements.
Without
limiting
the
generality
of
the
foregoing,
forward-looking
statements
contained
in
this
presentation
specifically
include
the
expectations
of
management
regarding
plans,
strategies,
objectives,
anticipated
financial
and
operating
results
of
the
Company,
including
as
to
the
Company’s
Wolffork
shale
resource
play,
estimated
oil
and
gas
in
place
and
recoverability
of
the
oil
and
gas,
estimated
reserves
and
drilling
locations,
capital
expenditures,
typical
well
results
and
well
profiles,
and
production
and
operating
expenses
guidance
included
in
the
presentation.
These
statements
are
based
on
certain
assumptions
made
by
the
Company
based
on
management's
experience
and
technical
analyses,
current
conditions,
anticipated
future
developments
and
other
factors
believed
to
be
appropriate
and
believed
to
be
reasonable
by
management.
When
used
in
this
presentation,
the
words
“will,”
“potential,”
“believe,”
“intend,”
“expect,”
“may,”
“should,”
“anticipate,”
“could,”
“estimate,”
“plan,”
“predict,”
“project,”
“target,”
“profile,”
“model”
or
their
negatives,
other
similar
expressions
or
the
statements
that
include
those
words,
are
intended
to
identify
forward-looking
statements,
although
not
all
forward-looking
statements
contain
such
identifying
words.
Such
statements
are
subject
to
a
number
of
assumptions,
risks
and
uncertainties,
many
of
which
are
beyond
the
control
of
the
Company,
which
may
cause
actual
results
to
differ
materially
from
those
implied
or
expressed
by
the
forward-looking
statements.
In
particular,
careful
consideration
should
be
given
to
the
cautionary
statements
and
risk
factors
described
in
the
Company's
Annual
Report
on
Form
10-K
for
the
year
ended
December
31,
2010,
and
the
Company’s
Quarterly
Report
on
Form
10-Q
for
the
quarterly
period
ended
September
30,
2011.
Any
forward-looking
statement
speaks
only
as
of
the
date
on
which
such
statement
is
made
and
the
Company
undertakes
no
obligation
to
correct
or
update
any
forward-looking
statement,
whether
as
a
result
of
new
information,
future
events
or
otherwise,
except
as
required
by
applicable
law.
The
Securities
and
Exchange
Commission
(“SEC”)
permits
oil
and
gas
companies,
in
their
filings
with
the
SEC,
to
disclose
only
proved,
probable
and
possible
reserves
that
meet
the
SEC’s
definitions
for
such
terms,
and
price
and
cost
sensitivities
for
such
reserves,
and
prohibits
disclosure
of
resources
that
do
not
constitute
such
reserves.
The
Company
uses
the
terms
“estimated
ultimate
recovery”
or
“EUR,”
reserve
or
resource
“potential,”
“upside,”
“oil
and
gas
in
place”
or
“OGIP,”
“OIP”
or
“GIP,”
and
other
descriptions
of
volumes
of
reserves
potentially
recoverable
through
additional
drilling
or
recovery
techniques
that
the
SEC’s
rules
may
prohibit
the
Company
from
including
in
filings
with
the
SEC.
These
estimates
are
by
their
nature
more
speculative
than
estimates
of
proved,
probable
and
possible
reserves
and
accordingly
are
subject
to
substantially
greater
risk
of
being
actually
realized
by
the
Company.
EUR
estimates,
potential
drilling
locations,
resource
potential
and
OGIP
estimates
have
not
been
risked
by
the
Company.
Actual
locations
drilled
and
quantities
that
may
be
ultimately
recovered
from
the
Company’s
interest
may
differ
substantially
from
the
Company’s
estimates.
There
is
no
commitment
by
the
Company
to
drill
all
of
the
drilling
locations
that
have
been
attributed
these
quantities.
Factors
affecting
ultimate
recovery
include
the
scope
of
the
Company’s
ongoing
drilling
program,
which
will
be
directly
affected
by
the
availability
of
capital,
drilling
and
production
costs,
availability
of
drilling
and
completion
services
and
equipment,
drilling
results,
lease
expirations,
regulatory
approval
and
actual
drilling
results,
including
geological
and
mechanical
factors
affecting
recovery
rates.
Estimates
of
unproved
reserves,
type/decline
curves,
per
well
EUR,
OGIP
and
resource
potential
may
change
significantly
as
development
of
the
Company’s
oil
and
gas
assets
provides
additional
data.
Type/decline
curves,
estimated
EURs,
typical
well-related
oil
and
gas
in
place,
recovery
factors
andwell
costs
represent
Company
estimates
based
on
evaluation
of
petrophysical
analysis,
core
data
and
well
logs,
well
performance
from
limited
drilling
and
recompletion
results
and
seismic
data,
and
have
not
been
reviewed
by
independent
engineers.
These
are
presented
as
hypothetical
recoveries
if
assumptions
and
estimates
regarding
recoverable
hydrocarbons,
OGIP,
recovery
factors
and
costs
prove
correct.
The
Company
has
very
limited
production
experience
with
these
projects,
and
accordingly,
such
estimates
may
change
significantly
as
results
from
more
wells
are
evaluated.
Estimates
of
resource
potential,
EURs
and
OGIP
do
not
constitute
reserves,
but
constitute
estimates
of
contingent
resources
which
the
SEC
has
determined
are
too
speculative
to
include
in
SEC
filings.
Unless
otherwise
noted,
IRR
estimates
assume
NYMEX
forward-curve
oil
and
gas
pricing
and
Company-generated
EUR
and
decline
curve
estimates
based
on
Company
drilling
and
completion
cost
estimates
that
do
not
include
land,
seismic
or
G&A
costs. |
 | 3 |
APPROACH RESOURCES
Company overview
AREX overview
Asset overview
•
Enterprise value $982 MM
•
High quality reserve base
66.8 MMBoe proved reserves
97% Permian Basin
55% Oil & NGLs
•
Permian core operating area
160,600 gross (142,000 net) acres
500+ MMBoe gross, unrisked resource
potential
Extensive inventory of drilling and
recompletion opportunities
•
Strong balance sheet to execute plan
Borrowing base increased 30% to $260 MM
from $200 MM
Pro forma liquidity of $260 MM at 9/30/2011
Notes: Proved reserves and acreage as of 6/30/2011 and 9/30/2011, respectively.
All Boe and Mcfe calculations are based on a 6 to 1 conversion ratio. Enterprise
value is equal to market capitalization using the closing share price of $29.98 per share on 11/11/2011, plus net debt as of 9/30/2011. See liquidity
calculation in appendix. |
 | 4 |
APPROACH RESOURCES
Key investor highlights
•
Concentrated geographic footprint focused on West Texas Midland Basin oil/liquids-rich
play 142,000+ net, primarily contiguous acres, 100% operated
More than 575 wells drilled since 2004, with a 93%+ success rate
•
Strong growth track record at competitive costs
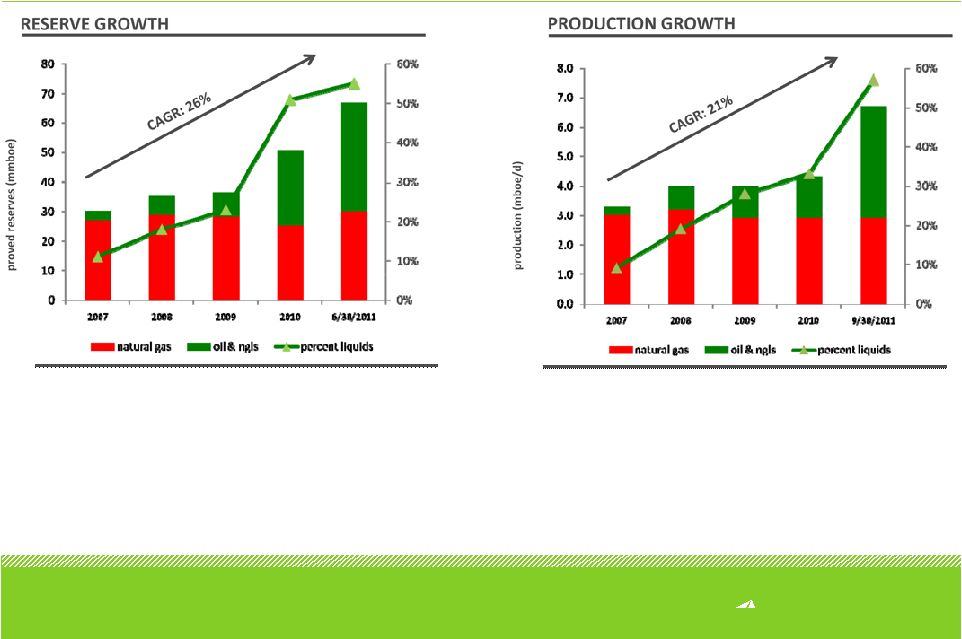
Reserve and production CAGR since 2007 of 26% and 21%, respectively
Low-cost operator with best-in-class F&D and lifting costs
•
Significant
growth
potential
from
Wolfcamp
/
Wolffork
oil
shale
drilling
inventory
2,900+ potential drilling and recompletion locations
Gross, unrisked resource potential totals more than 500+ MMBoe
•
Meaningful upside catalysts in near future
Wolffork
oil
shale
resource
play
transitioning
into
development
stage
by
Approach
and
other
operators
Pioneer, El Paso and EOG allocating more capital to the play
Strong flow of new well result data should further derisk the play
Note:
See
liquidity
calculationin
appendix. |
 | 5 |
APPROACH RESOURCES
Note:
See
“F&D
Costs
Reconciliation”
slide
in
appendix.
Strong Track Record of Reserve and Production Growth
•
MY’11 proved reserves up 32% to 66.8 MMBoe
Oil & NGL reserves up 44% to 36.9 MMBbls
•
Balanced production mix in 2011 and beyond
•
98% Permian Basin
•
Liquids content of Q3’11 production increased
148% YoY
•
Targeting 65% liquids-weighted production mix in
2012
•
Replaced 1,598% of reserves during 1H’11 at an all-in
F&D cost of $9.45/Boe
•
8.4 MMBoe proved reserves booked to Wolffork oil
shale resource play |
 | 6 |
APPROACH RESOURCES
Low-Cost Operator Across Crude-Oil Weighted Peers
Note: Oil weighted peers include BRY, CXO, KOG, NOG, OAS, SD. Data based on SEC filings
and J.S. Herold data. Lifting costs defined as lease operating expense plus taxes other
than income and gathering and transportation expense. See F&D cost reconciliation page in appendix for reconciliation of 3-year F&D costs.
|
 | 7 |
APPROACH RESOURCES
•
46.4 MMBoe proved reserves
•
4.5 MBoe/d daily production
•
98,000 net acres in Permian Basin
Then…
November 2010
Now…
2011 accomplishments
•
66.8 MMBoe proved reserves (+44% YoY)
•
6.7 MBoe/d daily production (+46% YoY)
•
142,000 net acres in Permian Basin (+45% YoY)
•
50% of proved reserves were liquids
•
34% of production were liquids
•
55% of proved reserves are liquids
•
57% of production is liquids
•
3 recompletions and 1 vertical well
commingled in Wolffork oil shale
resource play
•
11 recompletions and 10 vertical wells
completed through 10/30/11
•
7 horizontal Wolfcamp wells completed with 3
recent IPs ranging 798 –
1,044 Boe/d
•
Approach’s early view on the play has been
validated by the industry
•
$150 MM borrowing base
•
$173 MM pro forma liquidity
•
Q3 2010 EBITDAX of $12 MM
•
$260 MM borrowing base
•
$260 MM pro forma liquidity
•
Q3 2011 EBITDAX of $22 MM (+83% YoY)
Note:
See
EBITDAX
reconciliation
and
liquidity
calculation
in
appendix.
AREX Has Delivered On Its Objectives Since Last Year |
 | 8 |
APPROACH RESOURCES
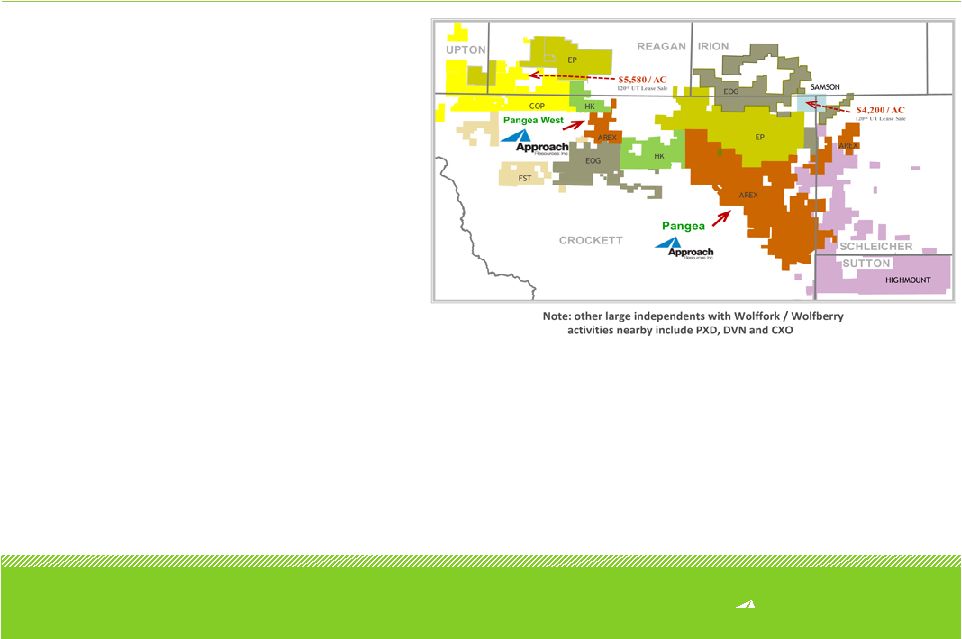
AREX Acreage Position –
Favorably Located in the Permian Basin |
 | 9 |
APPROACH RESOURCES
AREX Wolffork Oil Shale Resource Play
•
Large, primarily contiguous acreage position
160,600 gross (142,000 net) acres (~76% NRI)
Low acreage cost ~$350 per acre
•
Low-risk, long-life reserve base
64.8 MMBoe proved reserves
57% liquids (51% proved developed)
•
3 operated drilling rigs
2 vertical rigs, 1 horizontal rig
•
Vertical pilot program shifting to development
stage
152 BOEPD average IP for 9 recent Wolffork
recompletions (75% liquids)
140 BOEPD average IP for 7 recent vertical
Wolffork wells (72% liquids) |
 | 10 |
APPROACH RESOURCES
AREX Wolffork Oil Shale Resource Play –
Activity Map |
 | 11 |
APPROACH RESOURCES
Wolfcamp Shale Name Convention –
Southern Midland Basin
Wolfcamp
shale
name
conventions
are
based
on
investor
presentations
of
AREX
(10/18/2010),
EP
(5/24/2011)
and
PXD
(9/7/2011)
. |
 | 12 |
APPROACH RESOURCES
Wolffork Hydrocarbon Column –
Over 2,500’
Thick |
 | 13 |
APPROACH RESOURCES
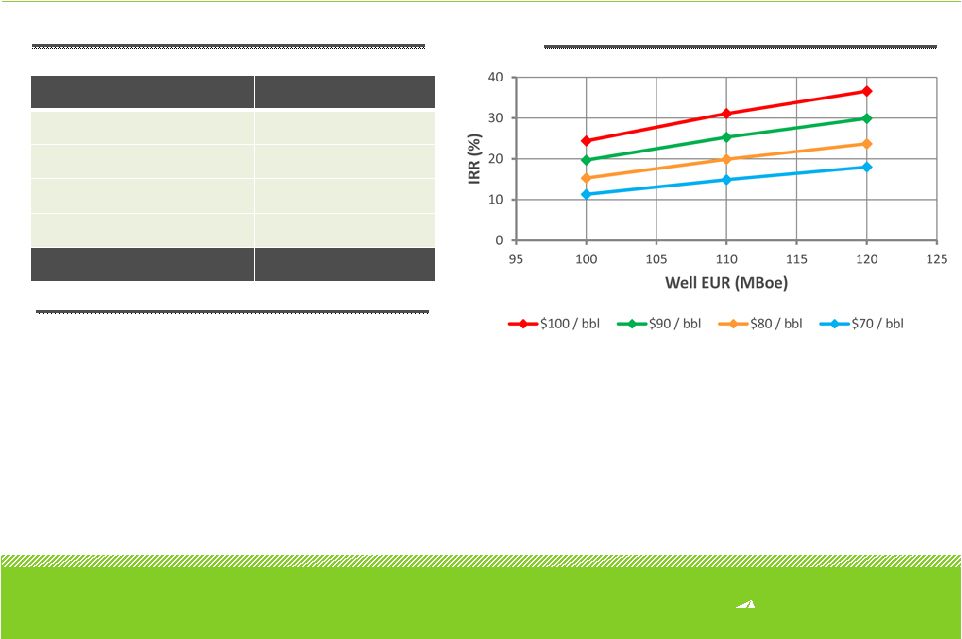
Vertical Wolffork Economics
Play Type
Wolffork
Avg. EUR
110 MBoe
Avg. Well Cost
$1.2 MM
F&D
$10.91/Boe
Potential Locations
1,825
Gross Resource Potential
200+ MMBoe
VERTICAL WOLFFORK
BTAX IRR SENSITIVITIES
•
Target Clearfork and Wolfcamp zones
•
Drilling depth < 7,000’
•
~75% of EUR comprised of oil and NGLs
•
Beginning vertical Wolffork development
program
•
1 active rig in NE Pangea
Note: Potential locations based on 20 acre spacing. Economics assume NYMEX gas
strip 7/2011 and NGL price based on 50% of oil WTI price.
|
 | 14 |
APPROACH RESOURCES
Vertical Wolffork Recompletion Economics
Play Type
Wolffork Recompletions
Avg. EUR
93 MBoe
Avg. Well Cost
$750 M
F&D
$8.06/Boe
Potential Locations
190
Gross Resource Potential
17+ MMBoe
VERTICAL WOLFFORK RECOMPLETIONS
BTAX IRR SENSITIVITIES
•
Target Clearfork and Wolfcamp zones
•
Commingle with existing production
•
~75% of EUR comprised of oil and NGLs
•
Increasing recompletions to 4 per month
beginning October 2011
Note:
Potential
locations
based
on20
to
40
acrespacing.
Economics
assume
NYMEX
gas
strip
7/2011
and
NGL
price
based
on
50%
of
oil
WTI
price. |
 | 15 |
APPROACH RESOURCES
Vertical Wolffork Well Profile |
 | 16 |
APPROACH RESOURCES
Vertical Canyon Wolffork Economics
Play Type
Canyon Wolffork
Avg. EUR
193 MBoe
Avg. Well Cost
$1.5 MM
F&D
$7.77/Boe
Potential Locations
440
Gross Resource Potential
85 MMBoe
VERTICAL CANYON WOLFFORK
BTAX IRR SENSITIVITIES
•
1 active rig in Pangea
Note: Potential locations based on 40 acre spacing. Economics assume NYMEX gas strip
7/2011 and NGL price based on 50% of oil WTI price. |
 | 17 |
APPROACH RESOURCES
Vertical Canyon Wolffork Well Profile |
 | 18 |
APPROACH RESOURCES
Vertical
Horizontal
Eagle Ford
49,500
323,813
6.5x
Niobrara
40,000
290,000
7.3x
Wolfcamp
80,000
450,000
5.6x
Well EUR (Boe)
Oil Shale Play
Potential
Uplift
Notes:
Eagle
Ford
and
Niobrara
well
EURs
from
industry
publications.
Wolfcamp
well
EUR
is
based
on
AREX
estimates.
Horizontal Wolfcamp –
Enhancing Wolfcamp Value |
 | 19 |
APPROACH RESOURCES
Horizontal Wolfcamp Economics
Play Type
Horizontal Wolfcamp
Avg. EUR
450 MBoe
Targeted Well Cost
$5.5 MM
F&D
$12.22/Boe
Potential Locations
500
Gross Resource Potential
225 MMBoe
HORIZONTAL WOLFCAMP
BTAX IRR SENSITIVITIES
•
Horizontal drilling improves recoveries and returns
•
Target Wolfcamp zone
•
7,000’+ lateral length, 20+ frac stages
•
~74% of EUR comprised of oil and NGLs
•
Recent horizontal pilot results encouraging
•
Transitioning to development program –
1 active rig
in Pangea
Note: Potential locations based on 1,000-foot spacing between each horizontal well.
Economics assume NYMEX gas strip 7/2011 and NGL price based on 50% of oil WTI price.
|
 | 20 |
APPROACH RESOURCES
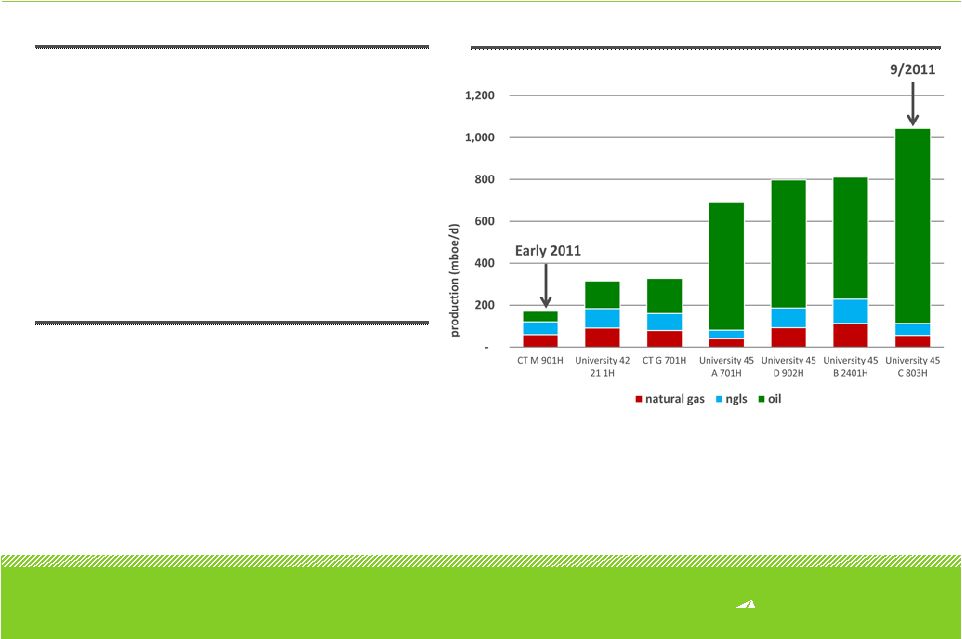
Horizontal Wolfcamp Well Performance
RECENT HORIZONTAL WOLFCAMP RESULTS
University 45 C 803H –
7,358’
lateral, 23 frac stages
Initial 24-hour flow rate 1,044 BOEPD, 95% liquids
(931 BO, 57 Bbls NGLs, 335 MCFG)
University 45 B 2401H –
7,613’
lateral, 23 frac stages
Initial
24-hour
flow
rate
811
BOEPD,
86%
liquids (582
BO, 116 Bbls NGLs, 677 MCFG)
University 45 D 902H –
7,770’
lateral, 23 frac stages
Initial 24-hour flow rate 798 BOEPD, 88% liquids (611
BO, 95 Bbls NGLs, 552 MCFG)
UPCOMING HORIZONTAL WOLFCAMP WELLS
University 42 B 1001H –
7,769’
lateral
Targeting the Wolfcamp “C”
zone
University 45 E 1101H –
7,712’
lateral
University 45 F 2301H –
7,000’+ lateral
CONSISTENTLY IMPROVING WELL RESULTS |
 | 21 |
APPROACH RESOURCES
Horizontal Wolfcamp Well Profile |
 | 22 |
APPROACH RESOURCES
Summary –
AREX Total Resource Potential
Play Type
Locations
Avg. EUR
(MBoe)
F&D
($/Boe)
Gross Resource
Potential
(MMBoe)
Horizontal Wolfcamp
500
450
12.22
225
Vertical Wolffork
1,825
110
10.91
200
Vertical Canyon Wolffork
440
193
7.77
85
Vertical Wolffork Recompletions
190
93
8.06
17
500+ MMBoe Total Gross Resource Potential |
 | 23 |
APPROACH RESOURCES
Key Investor Highlights
•
Concentrated geographic footprint focused on West Texas Midland Basin oil/liquids-rich
play 142,000+ net, primarily contiguous acres, 100% operated
More than 575 wells drilled since 2004, with a 93%+ success rate
•
Strong growth track record at competitive costs
Reserve and production CAGR since 2007 of 26% and 21%, respectively
Low-cost operator with best-in-class F&D and lifting costs
•
Significant growth potential from Wolfcamp / Wolffork oil shale drilling inventory
2,900+ potential drilling and recompletion locations
Gross, unrisked resource potential totals more than 500+ MMBoe
•
Meaningful upside catalysts in near future
Wolffork oil shale resource play transitioning into development stage by Approach and other
operators Pioneer, El Paso and EOG allocating more capital to the play
Strong flow of new well result data should further derisk the play
•
Strong balance sheet to execute development plan
$260 MM borrowing base
$260 MM pro forma liquidity at 9/30/2011
Note: See liquidity calculation in appendix. |
 APPROACH
RESOURCES Financial Framework |
 | 25 |
APPROACH RESOURCES
3Q 2011 Operating Highlights
Notes: Realized price includes commodity derivatives.
•
Production in Project Pangea running as
planned
Oil inventory build of ~29 MBbls through
3Q 2011
Inventory build reduced potential sales
volumes by ~315 Bbls/d during 3Q
2011
•
Drilled 20 wells, completed 14 wells and
recompleted 4 wells during 3Q 2011
•
Horizontal Wolfcamp and vertical Wolffork
wells results continue to improve
Horizontal Wolfcamp wells IP at 1,044
BOEPD –
798 BOEPD
Vertical Wolffork recompletions average
IP at 152 BOEPD
Vertical Wolffork wells average IP at 140
BOEPD |
 | 26 |
APPROACH RESOURCES
3Q 2011 Financial Highlights
Notes: See “Adjusted Net Income”
and “EBITDAX”
reconciliation slides in appendix for reconciliation of adjusted net income and EBITDAX,
respectively. |
 | 27 |
APPROACH RESOURCES
2011 Capital Budget
2011 PROGRAM
2 Vertical rigs
Expect to drill 58 vertical wells targeting the
Wolffork or Canyon Sands (13 ahead of
schedule)
1 Horizontal rig
Expect to drill 13 horizontal Wolfcamp wells (2
ahead of schedule)
2 to 4 recompletions per month targeting the
Wolffork oil shale
Leasing activity and working interest acquisition
expanded footprint in Wolffork oil shale play to
142,000 net acres, up
from 101,000 net acres at YE 2010
Infrastructure projects will accommodate
production in northeast Project Pangea and
Block 45
Notes:
Our
2011
capital
budget
is
subject
to
change
depending
upon
a
number
of
factors,
including
economic
and
industry
conditions
at
the
time
of
drilling,
prevailing
and
anticipated
prices
for
oil,
NGLs
and
natural
gas,
the
availability
sufficient
capital
resources
for
drilling
prospects,
our
financial
results,
the
availability
of
drilling
and
completion occ |
 | 28 |
APPROACH RESOURCES
2012 Capital Budget
2012 PROGRAM
2012 Capital budget $160 MM
2 Vertical rigs, 1 horizontal rig and 2 to 4 recompletions per month targeting the Wolffork oil
shale Substantially same rig program as 2011
Targeting 20%+ production growth
2012 production guidance 2,800 MBoe –
3,000 MBoe
Key takeaways:
Notes: Our 2012 capital budget is subject to change depending upon a number of factors,
including economic and industry conditions at the time of drilling, prevailing and
anticipated prices for oil, NGLs and natural gas, the availability sufficient capital resources
for drilling prospects, our financial results, the availability of drilling and completion
services
and
materials
on
reasonable
terms,
and
lease
extensions
and
renewals.
Additionally,
we
may
increase
our
2012
capital
budget
if
we
acquire
acreage
or
accelerate
our
drilling program.
Initial
2012
capital
program
provides
flexibility
to
develop
Wolffork
oil
shale
and
monitor
commodity
prices and
service
costs
Increase
in
liquids
production
drives
expected
increase
in
cash
flow
Increase
in
borrowing
base
strengthens
liquidity |
 | 29 |
APPROACH RESOURCES
2011 & 2012 Operating and Financial Guidance
Guidance is forward-looking information that is subject to a number of risks and
uncertainties, many of which are beyond the Company’s control. See slide 2, “Forward-looking
statements,”
for additional information. |
 | 30 |
APPROACH RESOURCES
•
Natural gas (NYMEX –
Henry Hub)
–
2011 Price swaps contracted for 230,000 MMBtu/month at $4.86/MMBtu
–
June
2011
–
December
2011
Price
swaps
contracted
for
200,000
MMBtu/month
at
$4.74/MMBtu
–
65%
of
estimated
2011
natural
gas
production
hedged
at
weighed
average
price
of
$4.82/MMBtu
(1)
•
Natural gas (WAHA –
Basis Differential)
–
2011 Basis swaps contracted for 300,000 MMBtu/month at $(0.53)/MMBtu
•
Oil (NYMEX –
West
Texas Intermediate)
–
May 2011 –
December 2011 Collars contracted for 1,000 Bbls/d
–
Floor $100.00 –
Ceiling $127.00
–
2012
Collars
contracted
for
1,200
Bbls/d
at
weighted
average
floor
$87.08
–
ceiling
$101.08
(1) Based on midpoint of 2011 production guidance.
Hedge Position
CURRENT HEDGE POSITION |
 APPROACH
RESOURCES Appendix
NON-GAAP RECONCILIATIONS |
 APPROACH
RESOURCES | 32 |
APPROACH RESOURCES
Liquidity
is
calculated
by
adding
the
net
funds
available
under
our
revolving
credit
facility
and
cash
and
cash
equivalents.
We
use
liquidity
as
an
indicator
of
the
Company’s
ability
to
fund
development
and
exploration
activities.
However,
this
measurement
has
limitations.
This
measurement
can
vary
from
year
to
year
for
the
Company
and
can
vary
among
companies
based
on
what
is
or
is
not
included
in
the
measurement
on
a
company’s
financial
statements.
This
measurement
is
provided
in
addition
to,
and
not
as
an
alternative
for,
and
should
be
read
in
conjunction
with,
the
information
contained
in
our
financial
statements
prepared
in
accordance
with
GAAP
(including
the
notes),
included
in
our
SEC
filings
and
posted
on
our
website.
The
table
below
summarizes
our
liquidity
at
September
30,
2011,
and
our
liquidity
position
at
September
30,
2011,
reflecting
the
October
2011
borrowing
base
increase
to
$260
million
from
$200
million,
and
our
liquidity
at
September
30,
2011,
as
further
adjusted
for
our
November
2011
follow-on
equity
offering
of
4,600,000
shares.
Liquidity (unaudited)
Note: Liquidity as further adjusted is based on issuance of 4,600,000 shares at $28.00
per share. |
 | 33 |
APPROACH RESOURCES
We
believe
that
providing
measures
of
finding
and
development,
or
F&D,
cost
is
useful
to
assist
an
evaluation
of
how
much
it
costs
the
Company,
on
a
per
Boe
basis,
to
add
proved
reserves.
However,
these
measures
are
provided
in
addition
to,
and
not
as
an
alternative
for,
and
should
be
read
in
conjunction
with,
the
information
contained
in
our
financial
statements
prepared
in
accordance
with
GAAP
(including
the
notes),
included
in
our
SEC
filings
and
posted
on
our
website.
Due
to
various
factors,
including
timing
differences,
F&D
costs
do
not
necessarily
reflect
precisely
the
costs
associated
with
particular
reserves.
For
example,
exploration
costs
may
be
recorded
in
periods
before
the
periods
in
which
related
increases
in
reserves
are
recorded
and
development
costs
may
be
recorded
in
periods
after
the
periods
in
which
related
increases
in
reserves
are
recorded.
In
addition,
changes
in
commodity
prices
can
affect
the
magnitude
of
recorded
increases
(or
decreases)
in
reserves
independent
of
the
related
costs
of
such
increases.
As
a
result
of
the
above
factors
and
various
factors
that
could
materially
affect
the
timing
and
amounts
of
future
increases
in
reserves
and
the
timing
and
amounts
of
future
costs,
including
factors
disclosed
in
our
filings
with
the
SEC,
we
cannot
assure
you
that
the
Company’s
future
F&D
costs
will
not
differ
materially
from
those
set
forth
above.
Further,
the
methods
we
use
to
calculate
F&D
costs
may
differ
significantly
from
methods
used
by
other
companies
to
compute
similar
measures.
As
a
result,
our
F&D
costs
may
not
be
comparable
to
similar
measures
provided
by
other
companies.
The
following
tables
reflect
the
reconciliation
of
our
estimated
finding
and
development
costs
to
the
information
required
by
paragraphs
11
and
21
of
ASC
932-235.
F&D costs reconciliation (unaudited)
Note: F&D costs exclude asset retirement obligations of $6.3 million at 6/30/2011 and $5.4
million at 12/31/2010. |
 | 34 |
APPROACH RESOURCES
The
amounts
included
in
the
calculation
of
adjusted
net
income
and
adjusted
net
income
per
diluted
share
below
were
computed
in
accordance
with
GAAP.
We
believe
adjusted
net
income
and
adjusted
net
income
per
diluted
share
are
useful
to
investors
because
they
provide
readers
with
a
more
meaningful
measure
of
our
profitability
before
recording
certain
items
whose
timing
or
amount
cannot
be
reasonably
determined.
However,
these
measures
are
provided
in
addition
to,
and
not
as
an
alternative
for,
and
should
be
read
in
conjunction
with,
the
information
contained
in
our
financial
statements
prepared
in
accordance
with
GAAP
(including
the
notes),
included
in
our
SEC
filings
and
posted
on
our
website.
Adjusted Net Income Reconciliation (Unaudited) |
 | 35 |
APPROACH RESOURCES
We
define
EBITDAX
as
net
income,
plus
(1)
exploration
expense,
(2)
depletion,
depreciation
and
amortization
expense,
(3)
share-based
compensation
expense,
(4)
unrealized
(gain)
loss
on
commodity
derivatives,
(5)
gain
on
sale
of
oil
and
gas
properties,
(6)
interest
expense,
and
(7)
income
taxes.
EBITDAX
is
not
a
measure
of
net
income
or
cash
flow
as
determined
by
GAAP.
The
amounts
included
in
the
calculation
of
EBITDAX
were
computed
in
accordance
with
GAAP.
EBITDAX
is
presented
herein
and
reconciled
to
the
GAAP
measure
of
net
income
because
of
its
wide
acceptance
by
the
investment
community
as
a
financial
indicator
of
a
company's
ability
to
internally
fund
development
and
exploration
activities.
This
measure
is
provided
in
addition
to,
and
not
as
an
alternative
for,
and
should
be
read
in
conjunction
with,
the
information
contained
in
our
financial
statements
prepared
in
accordance
with
GAAP
(including
the
notes),
included
in
our
SEC
filings
and
posted
on
our
website.
EBITDAX Reconciliation (Unaudited) |