Attached files
| file | filename |
|---|---|
| 8-K - FORM 8-K - ASHFORD HOSPITALITY TRUST INC | d263119d8k.htm |
 UBS Global Real Estate Conference
November 2011
Exhibit 99.1 |
 Safe Harbor
In
keeping
with
the
SEC’s
“Safe
Harbor”
guidelines,
certain
statements
made
during
this
presentation
could be considered forward-looking and subject to certain risks and
uncertainties that could cause results
to
differ
materially
from
those
projected.
When
we
use
the
words
“will
likely
result,”
“may,”
“anticipate,”
“estimate,”
“should,”
“expect,”
“believe,”
“intend,”
or similar expressions, we intend to
identify forward-looking statements. Such forward-looking
statements include, but are not limited to, our business and
investment strategy, our understanding of our competition, current market trends and
opportunities, projected operating results, and projected capital
expenditures. These forward-looking statements are subject to
known and unknown risks and uncertainties, which could cause actual
results to differ materially from those anticipated including, without limitation:
general volatility of the capital markets and the market price of our common
stock; changes in our business or investment strategy; availability,
terms and deployment of capital; availability of qualified personnel;
changes in our industry and the market in which we operate, interest rates or the general
economy, and the degree and nature of our competition. These and other
risk factors are more fully discussed in the Company’s filings
with the Securities and Exchange Commission. EBITDA is defined as net
income before interest, taxes, depreciation and amortization. EBITDA yield is
defined as trailing twelve month EBITDA divided by the purchase price.
EBITDA, FFO, AFFO, CAD and other terms are non-GAAP measures,
reconciliations of which have been provided in prior earnings
releases and filings with the SEC.
This overview is for informational purposes only and is not an offer to
sell, or a solicitation of an offer to buy or sell, any securities of
Ashford Hospitality Trust, Inc. and may not be relied upon in connection
with the purchase or sale of any such security.
2 |
 ASHFORD OVERVIEW
3 |
 Ashford Overview
•
Favorable macro market dynamics
•
Focused portfolio, positioned for growth
•
Proactive debt and equity capital market strategies
•
Outperformance
•
High insider ownership
4 |
 Attractive Supply/Demand Imbalance
•
Demand increase is currently expected to outpace supply increase
through 2014
5
Source: Smith Travel / PKF Research (Sep-Nov
Edition forecast)
-8.0
-6.0
-4.0
-2.0
0.0
2.0
4.0
6.0
8.0
10.0
Supply Growth
Demand Growth |
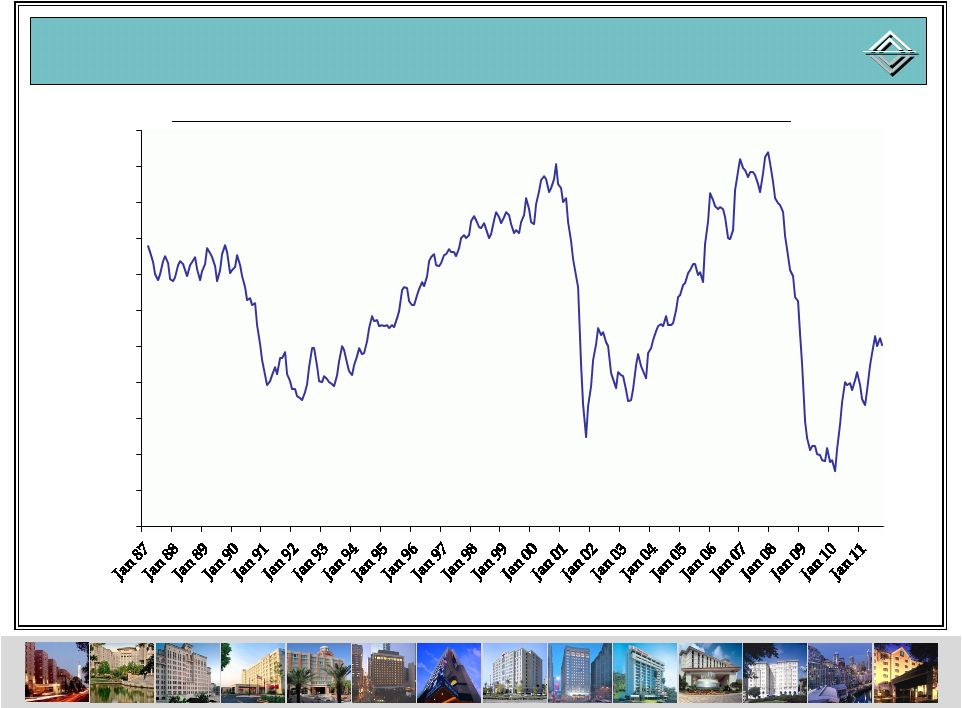 Attractive Industry Fundamentals
6
Source: Smith Travel Research (non-seasonally
adjusted nominal monthly figures)
$52.00
$54.00
$56.00
$58.00
$60.00
$62.00
$64.00
$66.00
$68.00
$70.00
$72.00
$74.00
Trailing 3-Mo Avg Seasonally-Adjusted Real RevPAR (2011
$’s) |
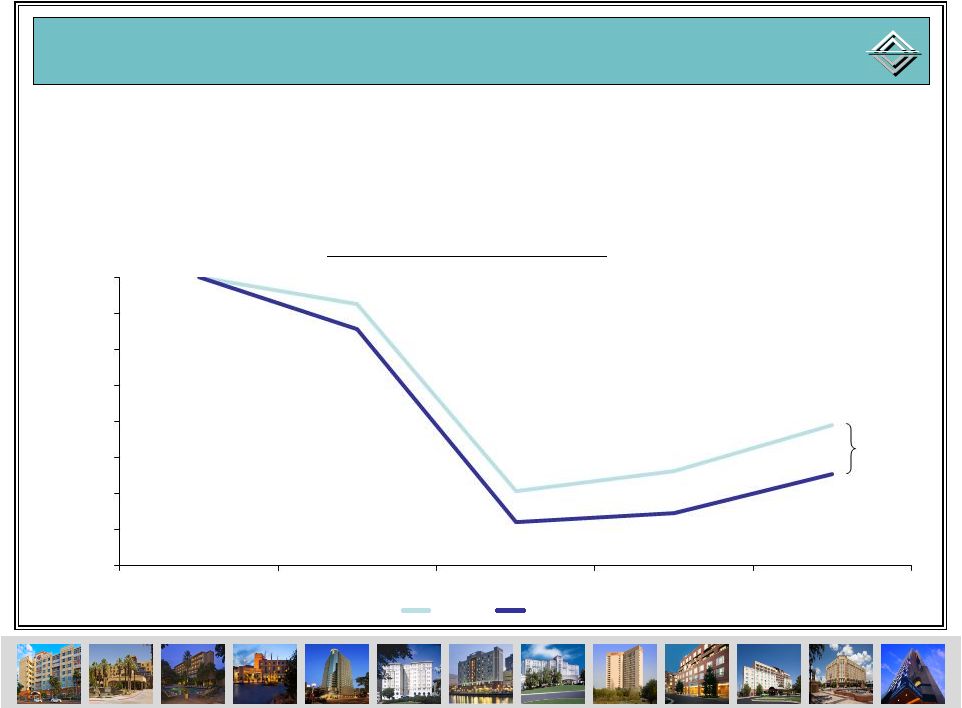
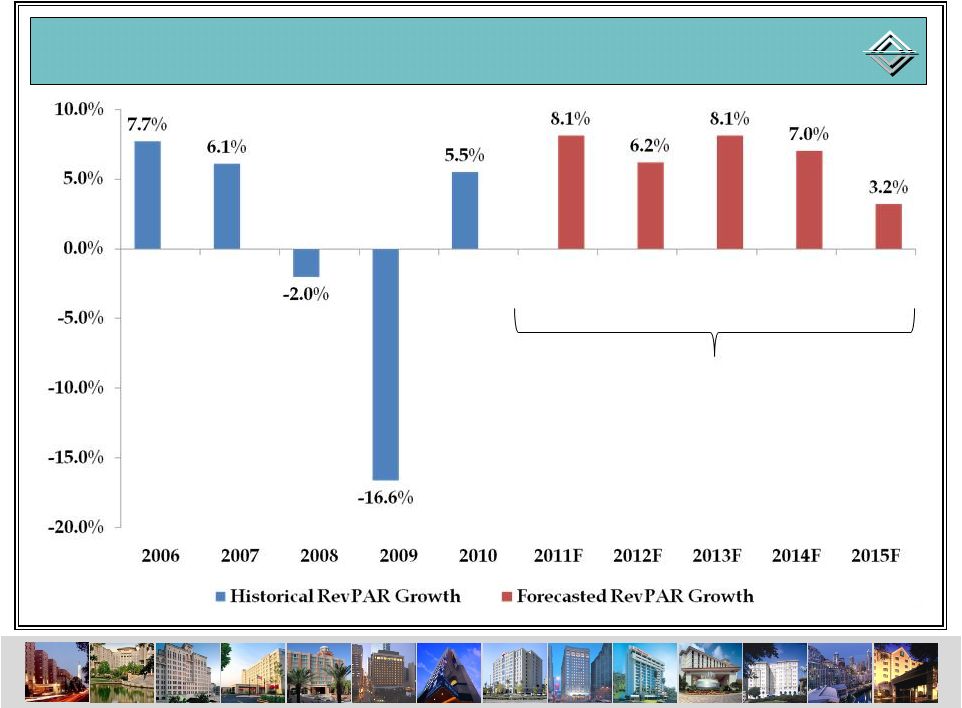 7
5-Year RevPAR Growth CAGR: 6.5%
Source: Smith Travel Research /
PKF Research (Sep-Nov Edition /
preliminary Dec forecast)
PKF’s Nominal US RevPAR Forecast
PKF’s Nominal US RevPAR Forecast |
 Ashford Snapshot
8
Portfolio Statistics*
Total Enterprise Value
$3.9 B
Total Gross Assets
$4.9 B
Peer Comparison
2
nd
Largest
# of Hotels
124
# of Owned Rooms
26,139
# of Property Managers
6
$ ADR
$131.02
$ RevPAR
$96.10
RevPAR Growth %
6.4%
Financial Statistics*
Recent Share Price
$7.51 (11/21/11)
# Fully Diluted Shares
84.3 M
Leverage Ratio
59.4%
Debt Wtd. Avg. Maturity
4.1 Years
Debt Wtd. Avg. Cost
3.20%
Quarterly Dividend
$0.10
Dividend Yield
5.3%
TTM AFFO per Share
$1.86
Cash on Hand
$180.9 M
* As of September 30, 2011 |
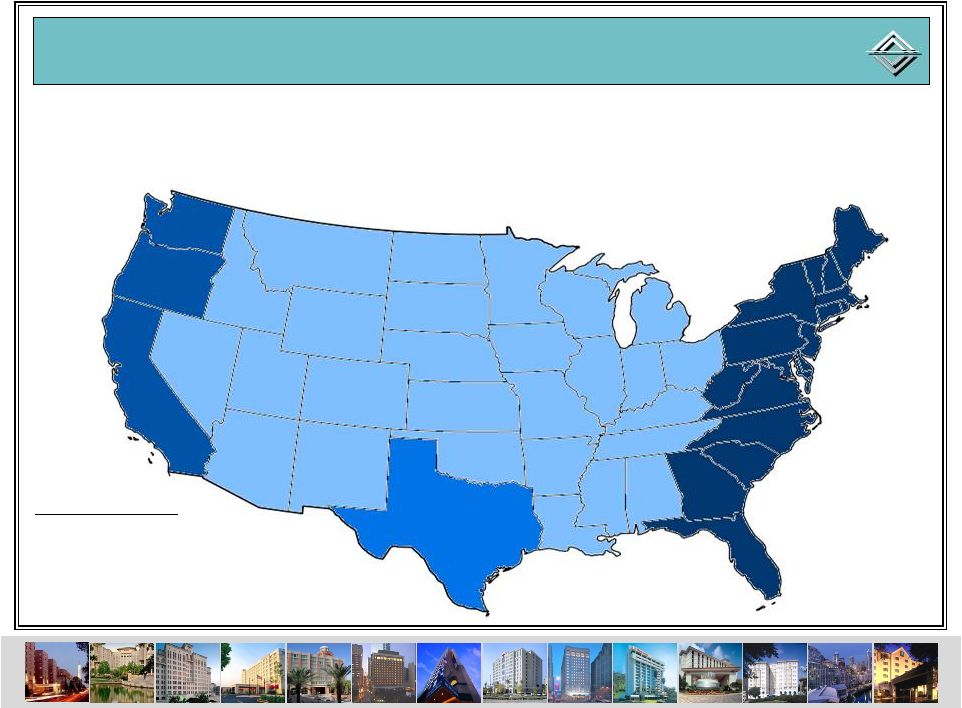 Broad Geography
9
WEST
WEST
COAST
COAST
MIDDLE
MIDDLE
AMERICA
AMERICA
TEXAS
TEXAS
EAST
EAST
COAST
COAST
West Coast
includes Alaska
EBITDA by Region
EAST COAST:
51%
WEST COAST:
22%
TEXAS:
12%
MIDDLE AMERICA:
15%
•
Ashford’s geographic footprint encompasses 29 states and
Washington DC |
 MSA
MSA
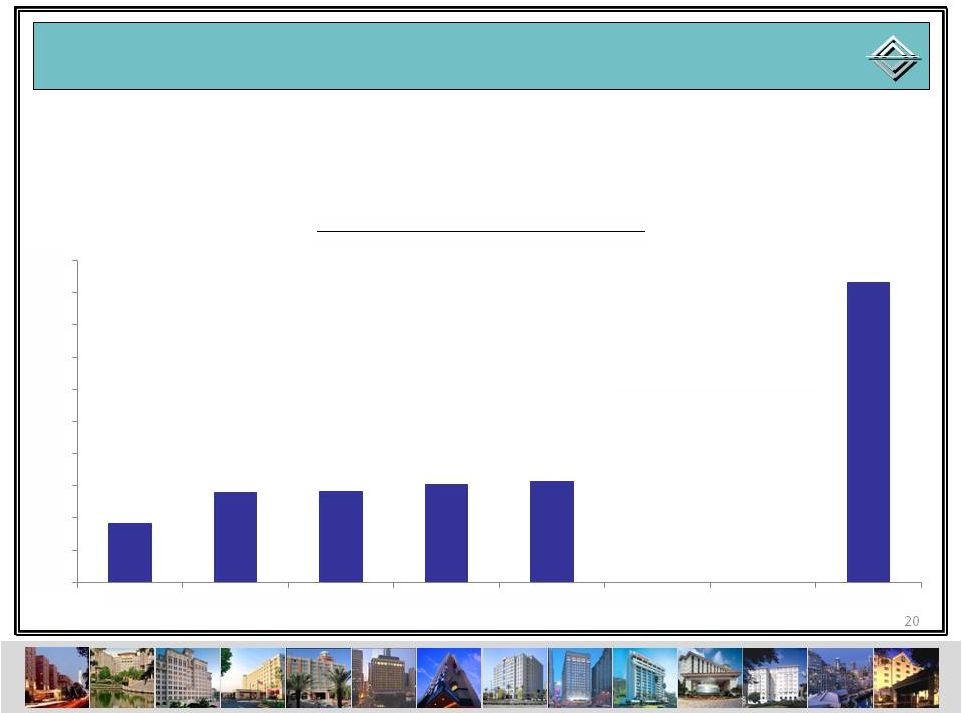
10
•
The vast majority of Ashford’s EBITDA comes from top 25
markets, with nearly 90% coming from top 50 markets
As
%
of
TTM
Q3
2011
EBITDA
16%
16%
11%
11%
73%
73%
Top 25
Top 50
Other |
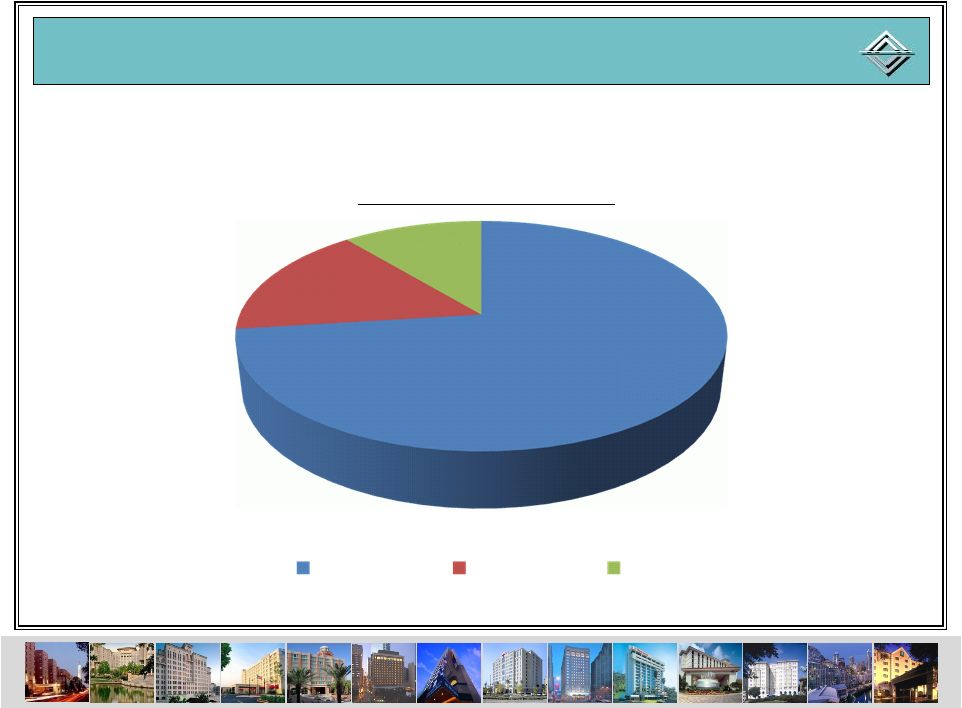
 Chain Scale
•
Approximately 96% of Ashford’s EBITDA comes from upper
upscale and upscale assets
11
As % of TTM Q3 2011 EBITDA
Luxury
Upper Upscale
Upscale
Upper Midscale |
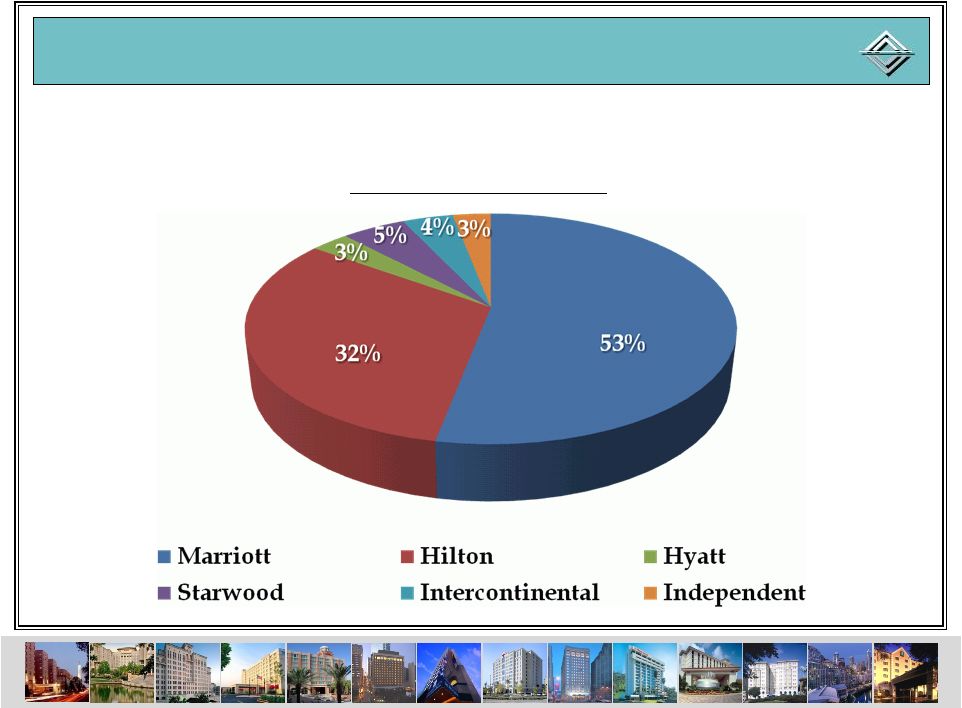 Brand Family
•
85% of Ashford’s EBITDA comes from Marriott and Hilton
branded assets
12
As
%
of
TTM
Q3
2011
EBITDA |
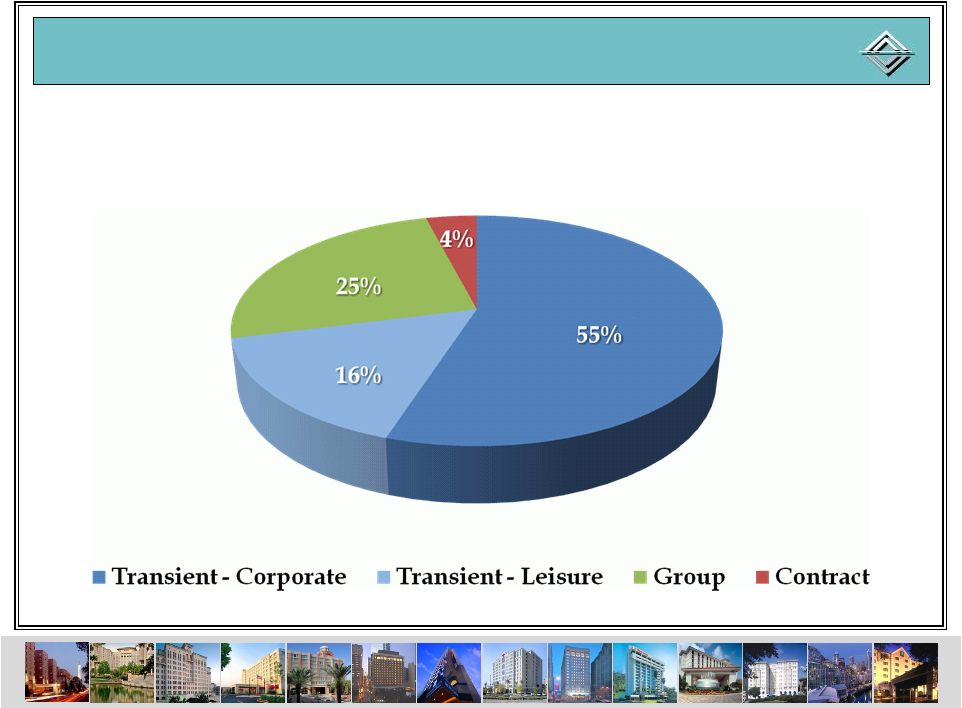 Transient vs. Group vs. Contract
•
Our customers are predominantly transient, with a strong
emphasis on corporate business
13 |
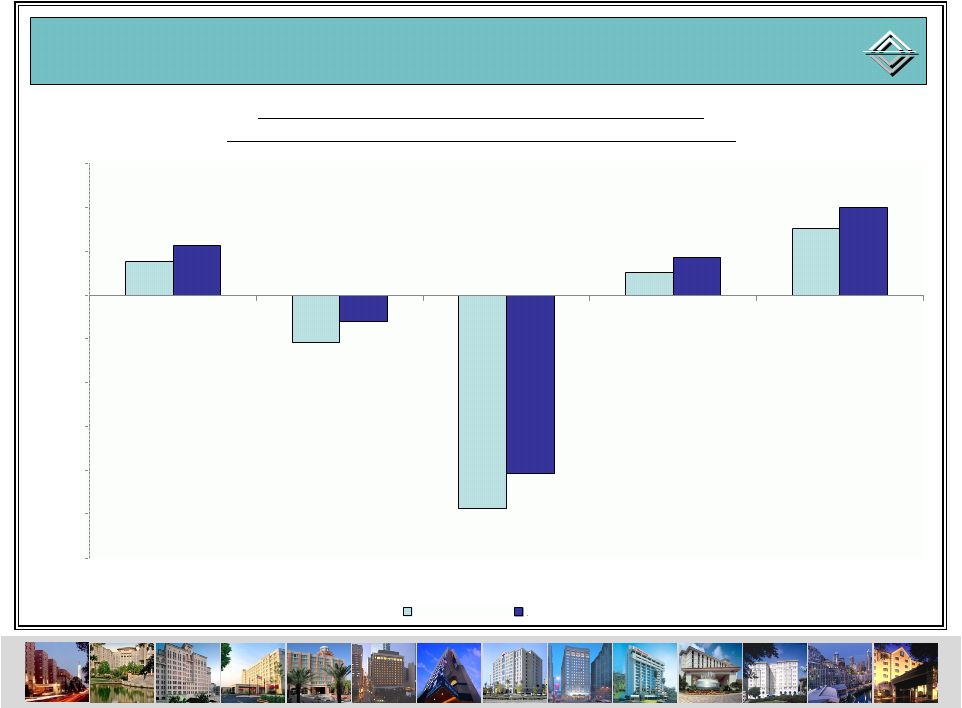 Hotel EBITDA Margin Change Comparison
14
78
(106)
(487)
53
153
114
(58)
(406)
86
201
(600)
(500)
(400)
(300)
(200)
(100)
-
100
200
300
2007
2008
2009
2010
YTD Q3 2011
HOTEL EBITDA MARGIN Y
-O-Y CHANGE (BPS)
(Peers
include:
BEE,
DRH,
FCH,
HST,
HT,
LHO,
PEB
&
SHO)
AHT
Peer Avg |
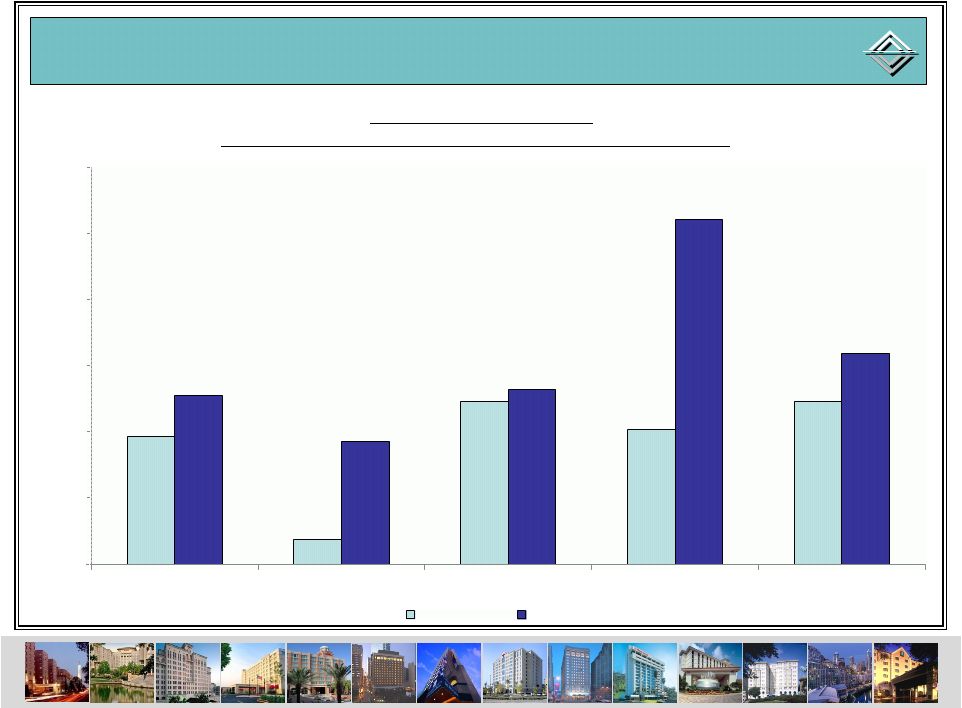 Hotel EBITDA Flows Comparison
15
39%
8%
49%
41%
49%
51%
37%
53%
104%
64%
0%
20%
40%
60%
80%
100%
120%
2007
2008
2009
2010
YTD Q3 2011
HOTEL EBITDA FLOWS
(Peers
include:
BEE,
DRH,
FCH,
HST,
HT,
LHO,
PEB
&
SHO)
AHT
Peer Avg |
 Debt Maturity Schedule
16
AHT Debt Maturity Schedule |
 Significantly Reduced Share Count
17
Source: SNL, Company Filings & Street Research.
-41%
145%
76%
98%
30%
287%
108%
82%
118%
-100.0%
-
50.0%
0.0%
50.0%
100.0%
150.0%
200.0%
250.0%
300.0%
350.0%
AHT
BEE
DRH
FCH
HST
HT
LHO
SHO
PEER AVG
%
Change
in
Fully
Diluted
Share
Count
:
6/30/07
vs.
Current |
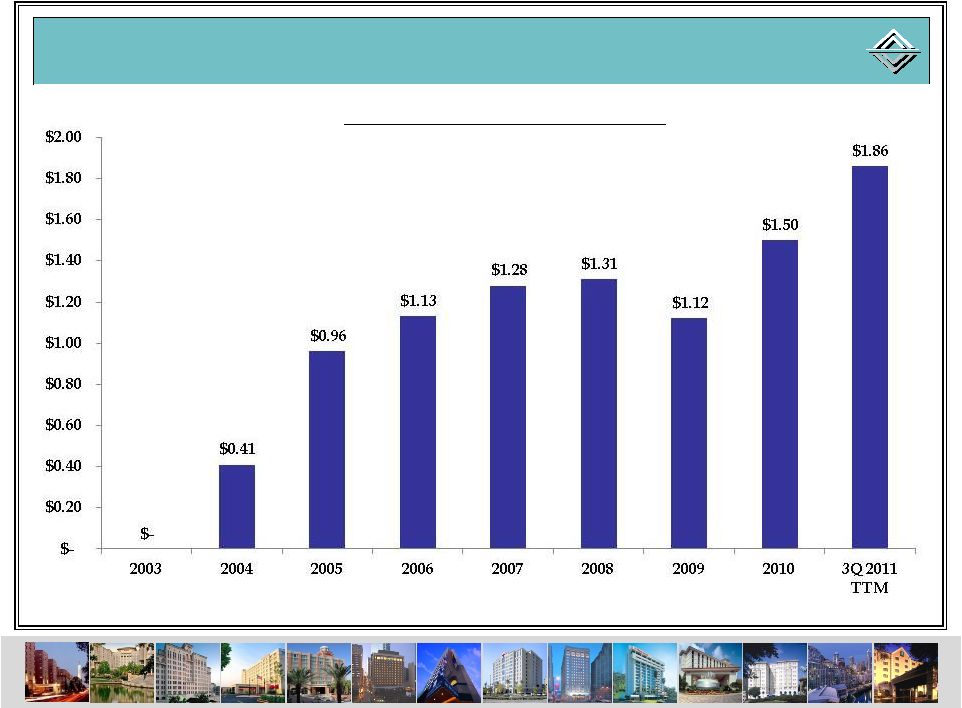 Consistent Earnings Growth
18
Ashford’s
Historical
AFFO
per
Share |
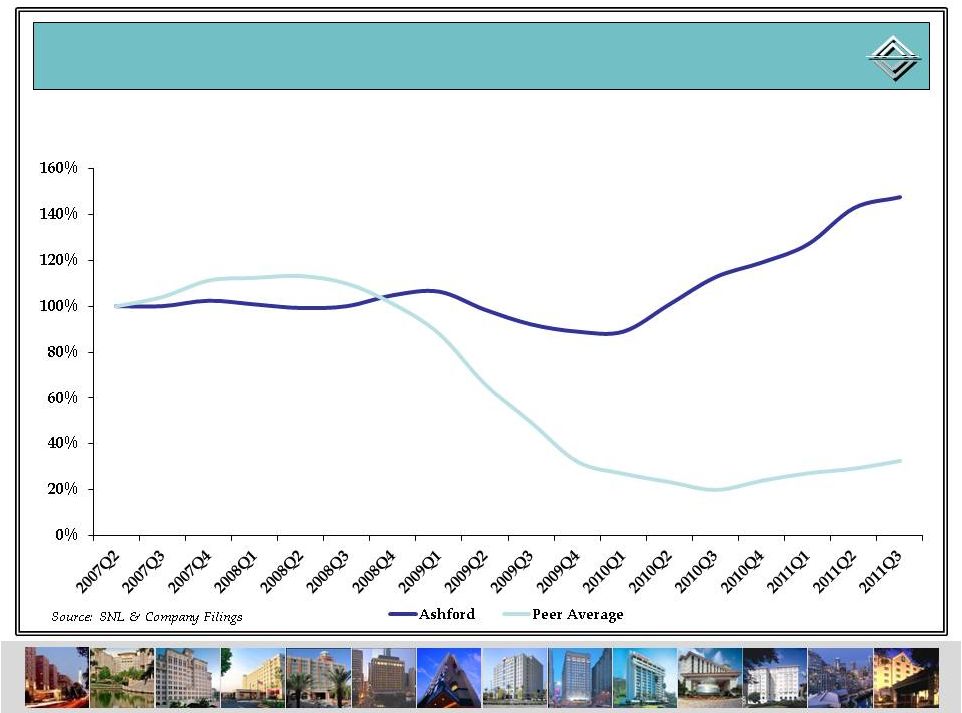 AFFO per Share Outperformance
19
+48%
-68%
TTM AFFO Per Share (2007Q2 = 100%)
Peers Include: BEE, DRH, FCH, HST, HT, LHO, SHO
|
 20
Though Ashford didn’t pay
a dividend in 2009 & 2010,
it could have covered its
peak dividend at 1.3x in
2009 & 1.8x in 2010
Reinstated Dividend w/ Growth Potential
Reinstated Dividend w/ Growth Potential
N/A
N/A
0.0x
0.5x
1.0x
1.5x
2.0x
2.5x
3.0x
3.5x
4.0x
4.5x
5.0x
0.9x
1.4x
1.4x
1.5x
1.6x
4.7x
AFFO
Per
Share
/
Dividend
Coverage
2004
2005
2006
2007
2008
2009
2010
3Q TTM
•
Given the material reduction in our common share count,
Ashford is well positioned to cover and potentially grow its
dividend |
 Most Highly-Aligned Management Team
21
Source: 2011 Proxy Filings
Insider Ownership % |
 Ashford Overview
•
Favorable macro market dynamics
•
Focused portfolio, positioned for growth
•
Proactive debt and equity capital market strategies
•
Outperformance
•
High insider ownership
22 |
 HIGHLAND TRANSACTION UPDATE
23 |
 Highland Portfolio
24
Hilton Parsippany
Renaissance Palm Springs
The
Melrose
–
Washington,
DC
Marriott DFW Airport
Hyatt Regency Wind Watch
Marriott Plaza San Antonio
Boston Back Bay Hilton
Hilton Tampa Westshore
Renaissance Nashville
Marriott Sugar Land
Hyatt Regency Savannah
Ritz-Carlton Atlanta
Westin Princeton
Renaissance Portsmouth
The Silversmith -
Chicago |
 25
Transformational 28-hotel, $1.3 billion acquisition with 8,084
rooms Transformational 28-hotel, $1.3 billion acquisition with
8,084 rooms Primarily upper-upscale and luxury full-service
assets Primarily upper-upscale and luxury full-service
assets Expands Ashford’s presence in key markets (Washington D.C
and Expands Ashford’s presence in key markets (Washington D.C
and NY/NJ) and into new markets (Boston and Nashville)
NY/NJ) and into new markets (Boston and Nashville)
Significant growth potential with affiliate manager Remington
Significant growth potential with affiliate manager Remington
taking over management of 17 hotels
taking over management of 17 hotels
2010 EBITDA flows of 18% vs. AHT’s of 104% and NOI 36% below
2010 EBITDA flows of 18% vs. AHT’s of 104% and NOI 36% below
peak
peak
Highland Transaction Summary
Highland Transaction Summary |
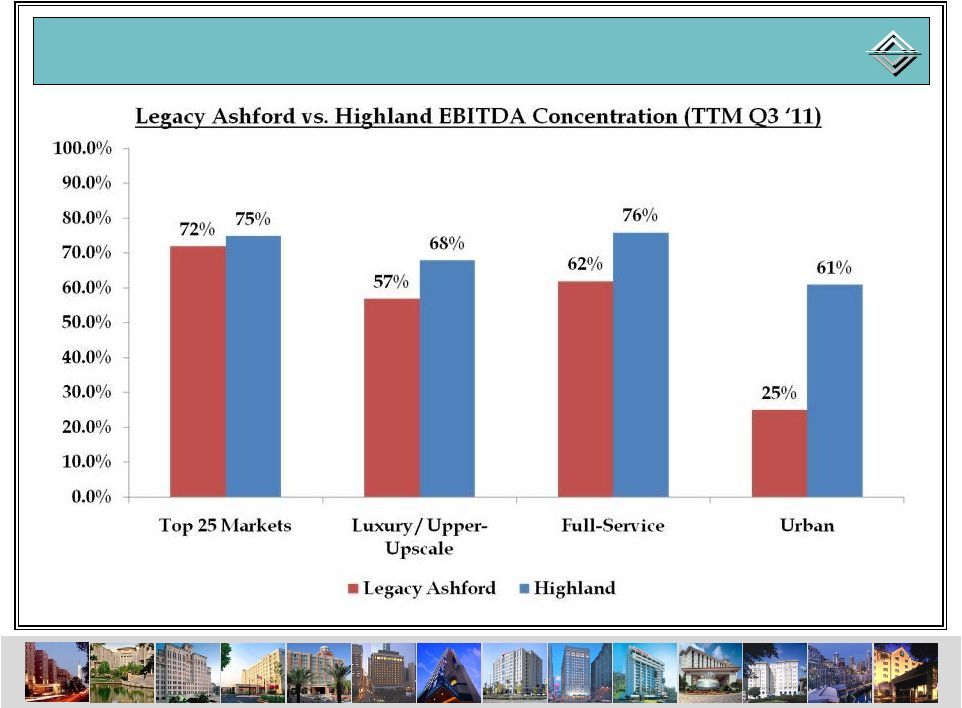 Portfolio Upgrade
26 |
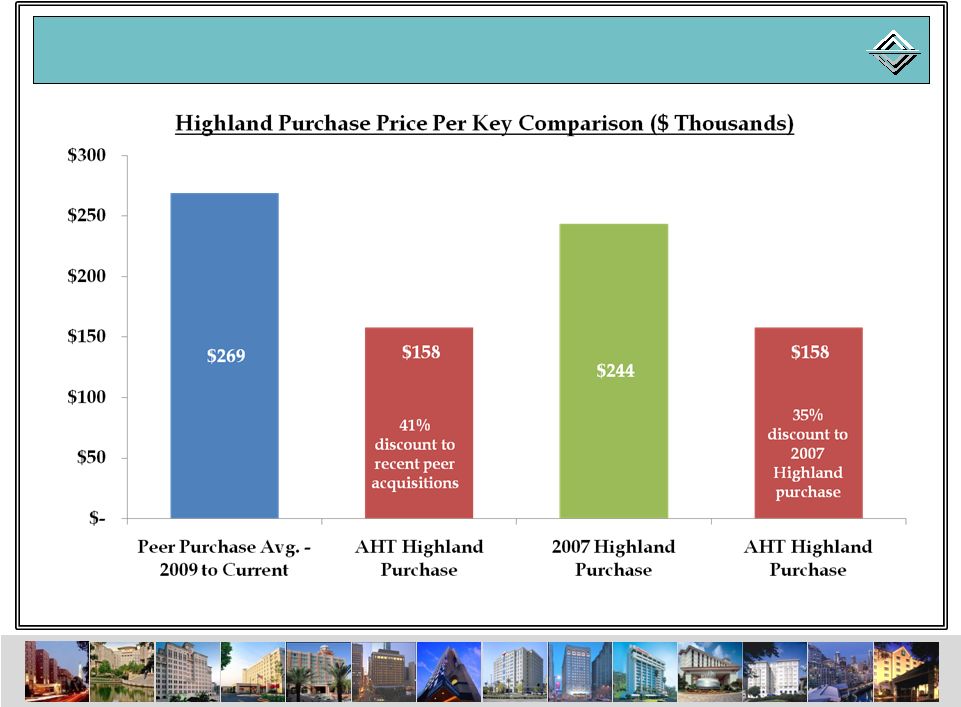 27
Price Per Key Comparison
Price Per Key Comparison
Source:
Real Capital Analytics & company filings.
|
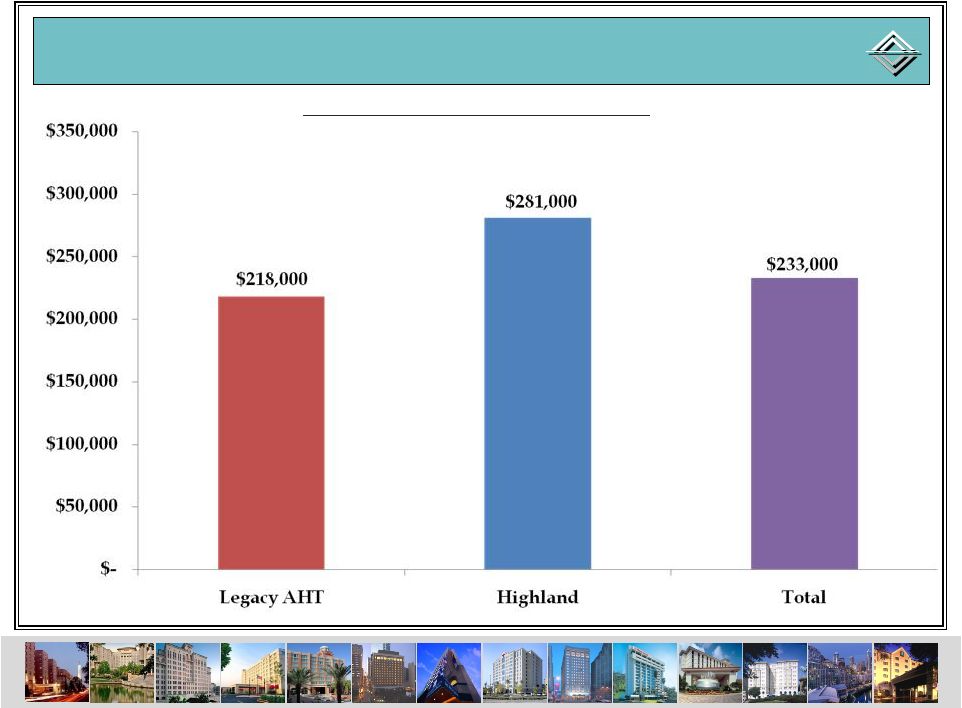 Replacement Cost per Key
Highland was purchased for
$158,000 per key -
a 44%
discount to replacement cost
28
Source: Estimated based
Source: Estimated based
on JP Morgan Research
on JP Morgan Research
Report
Report
Replacement Cost per Key Estimate |
 Highland Operational Goals
29
•
When we took over the portfolio there were two primary operational
goals: -
portfolio
was
seriously
neglected
when
we
took
over
-
felt
confident
that
the
Remington-managed
properties
were
going
to
put
in
significant
cost
cuts
-
also
wanted
to
see
significant
improvement
in
the
brand-managed
properties even though no manager change was occurring
-
sales
forces
of
the
non-brand
managed
properties
were
decimated
-
had
to
fill
nearly
2
dozen
sales
positions
across
the
portfolio
-
expectation
was
to
see
positive
RevPAR
yield
growth
sometime
in
the
4Q ‘11 or 1Q ‘12
Put cost structures in place to achieve maximum operating flow
throughs Put cost structures in place to achieve maximum operating
flow throughs Improve the non-brand managed properties RevPAR
Yield Index Improve the non-brand managed properties RevPAR Yield
Index Remington
The
Our
The
We
We |
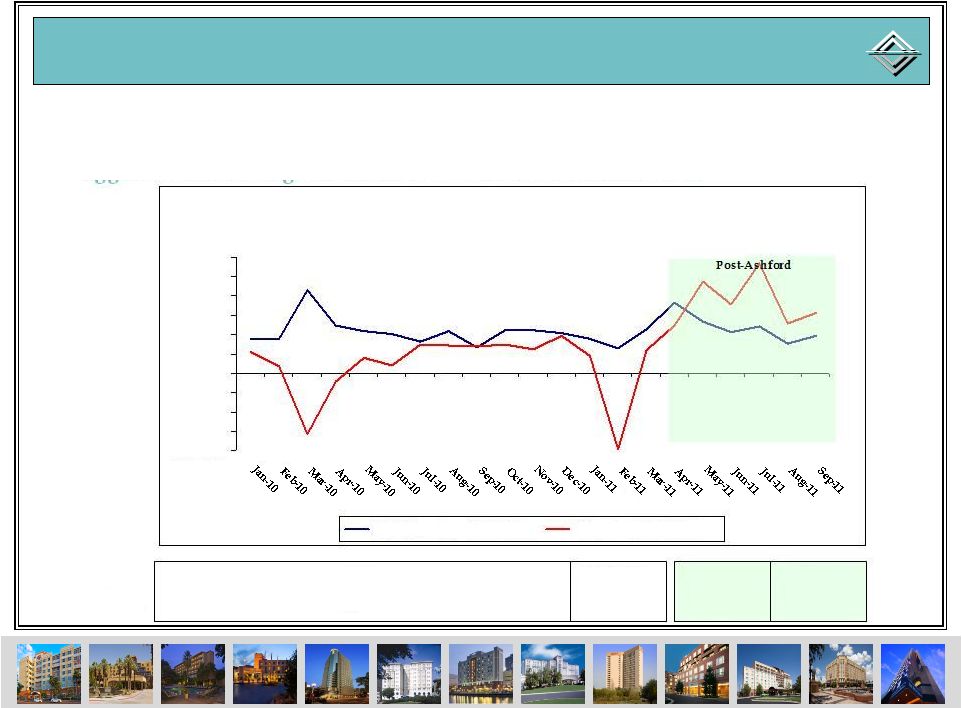 Highland Portfolio -
GOP Flow Comparison
GOP Flow Comparison
30
•
Ashford’s Asset Management and Remington’s combined expertise have
enabled our legacy portfolio to outperform while Highland
consistently lagged benchmark goals until we took over in March
2011 GOP
Flow
2010
0.2%
1
Qtr 2011
8.8%
2
nd
Qtr 2011
94.6%
3 Qtr 2011
78.6%
GOP
Flow
Comparison
-
January
2010
to
September
2011
-100.0%
-75.0%
-50.0%
-25.0%
0.0%
25.0%
50.0%
75.0%
100.0%
125.0%
150.0%
Pre-Ashford
st
AHT Legacy GOP Flow
Highland GOP Flow
rd |
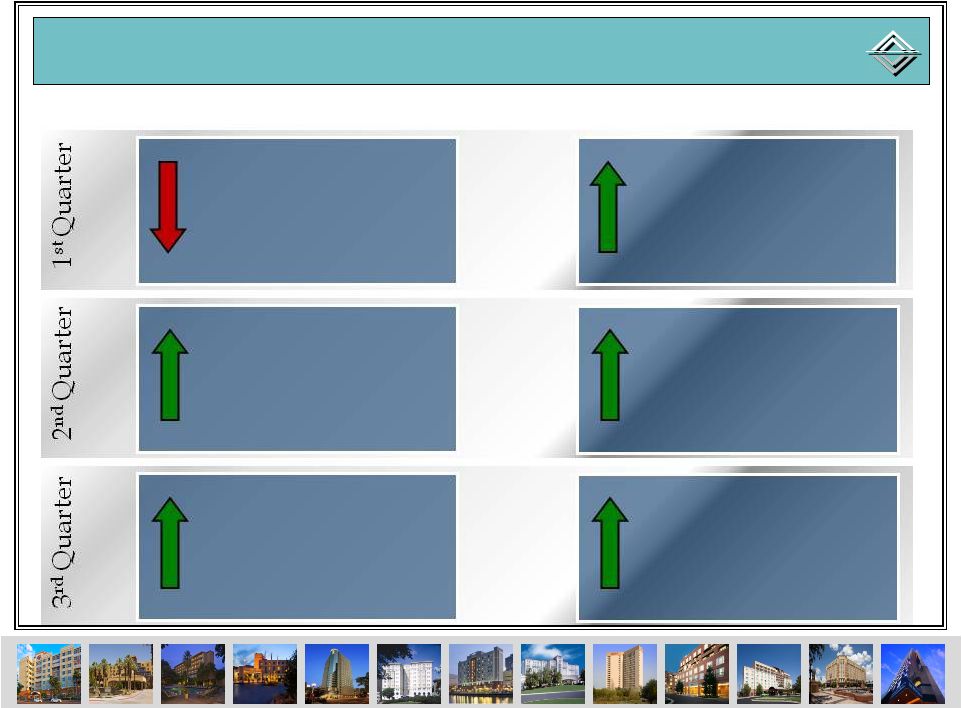 Highland Portfolio -
Year Over Year Comparisons
Year Over Year Comparisons
31
GOP Flow
GOP Flow
<95>
Pre-Ashford
218
Post-Ashford
280
Post-Ashford
8.8%
Pre-Ashford
94.6%
Post-Ashford
78.6%
Post-Ashford
GOP
GOP
Margin
Margin
Change
Change
BPS
BPS |
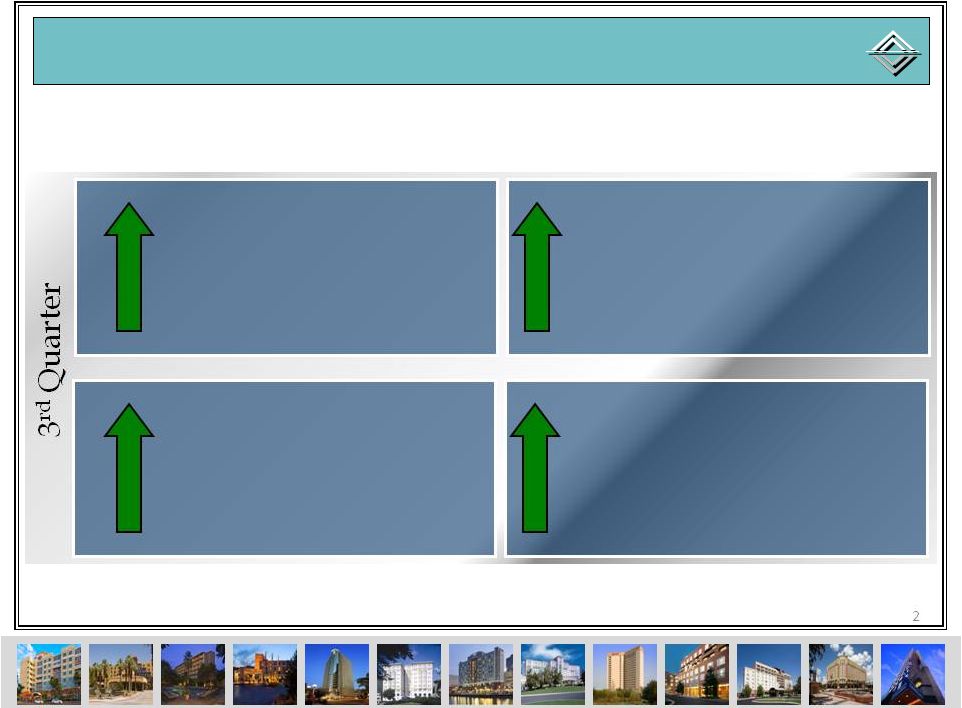 Highland Portfolio –
Performance by Manager
Performance by Manager
32
GOP Margin Change
GOP Margin Change
BPS
BPS
GOP Flow
GOP Flow
366
Remington
199
Non-Remington
93.3%
Remington
58.7%
Non-Remington |
 Highland Portfolio -
GOP Flow Comparison
GOP Flow Comparison
33
•
Brand-managed properties have also shown significant flow improvement
due to Ashford asset management expertise
Brand-Managed GOP Flows by Month |
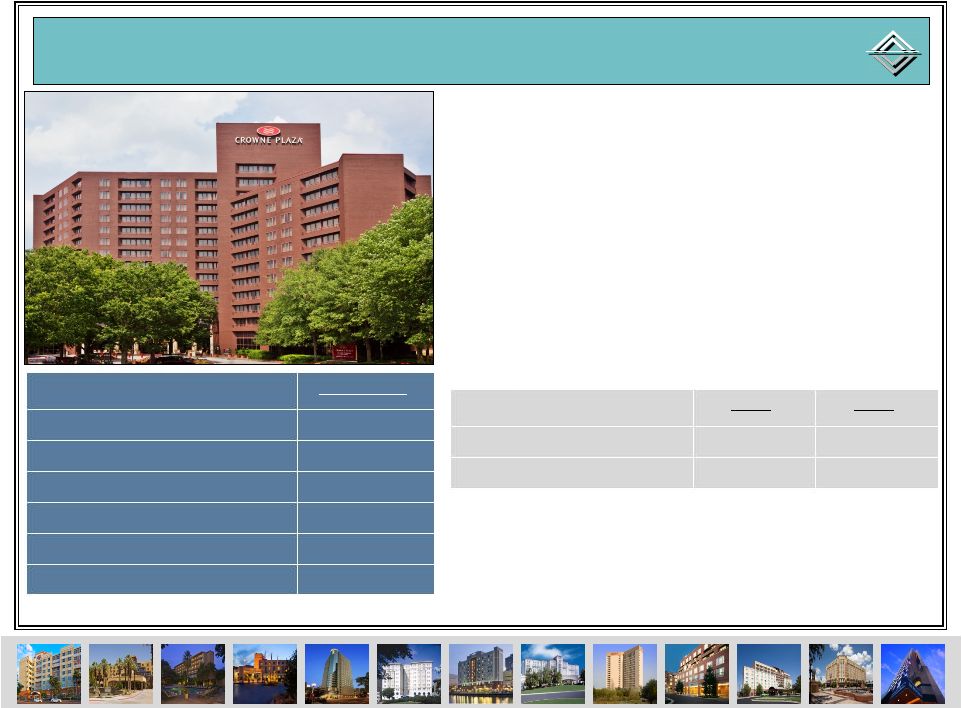 Case Study –
Crowne Plaza Ravinia
Crowne Plaza Ravinia
34
•
Eliminated 6 managerial/supervisory
positions
•
Despite RevPAR decrease, banquet and
catering sales are up significantly (~ $1.0m)
due to aggressive selling efforts
•
Since takeover, property has achieved
$567K GOP $ surplus over AHT metric
despite 1.2% RevPAR decline
Financial Statistics
TOD 2011
ADR Growth
3.1%
Occupancy Growth
-4.2%
RevPAR Growth
-1.2%
GOP Margin Improvement
775 bps
GOP Flow
238%
Comp Set Rank
5 of 8
Definite Bookings
2011
2012
At Takeover
<21%>
<28%>
As of 11/04/11
<4%>
23% |
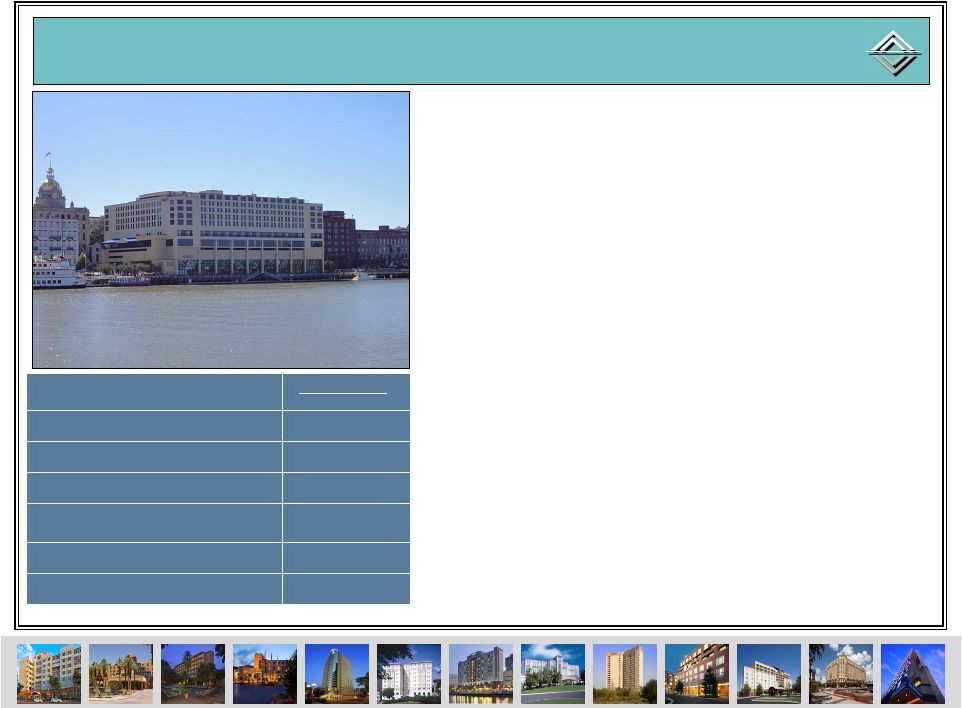 Case Study –
Hyatt Savannah
Hyatt Savannah
35
•
Since takeover, property has achieved $74K
GOP $ surplus over AHT metric despite -
2.9% revenue decline
•
Asset Management team in collaboration
with Hyatt has identified ~$375K annualized
savings
•
Eliminated 5 supervisory/management
positions since takeover
•
Increased usage of contract labor
•
For the month of October, property has
achieved 133.7% GOP flow with 745 bps
GOP margin improvement
Financial Statistics
TOD 2011
ADR Growth
-4.5%
Occupancy Growth
RevPAR Growth
-
GOP Margin Improvement
7 bps
GOP Flow
67.9%
Comp Set Rank
1 of 6
0.6%
3.9%
- |
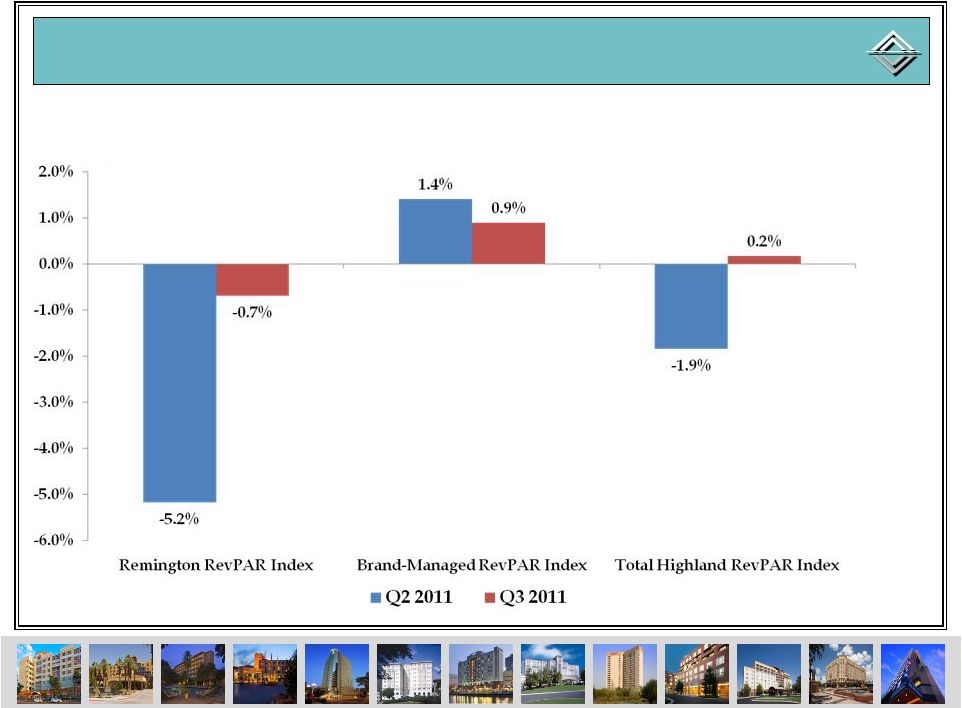 Remington RevPAR Index Improvement
36
•
RevPAR for Remington-managed properties is improving sooner than
expected and is beginning to more closely match brand-managed properties
|
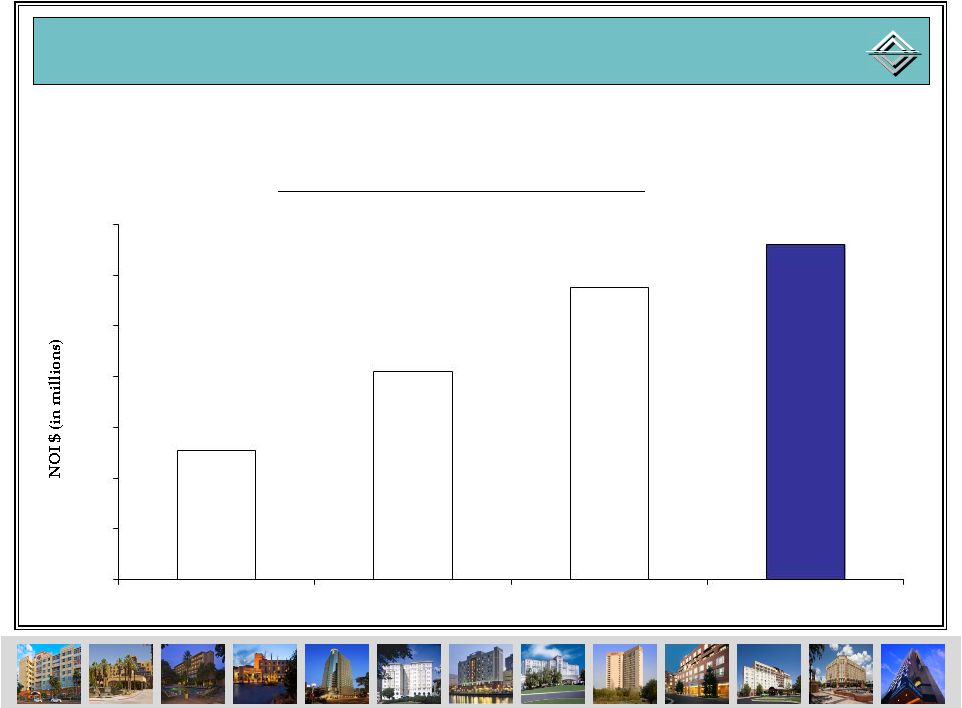 Highland Portfolio NOI
37
•
Highland NOI is exceeding expectations, currently at 88% of first 12 months
underwriting growth in only six months’
time
$74
$76
$78
$80
$82
$84
$86
$88
Mar 2011 TTM
Jun 2011 TTM
Sep 2011 TTM
Underwriting for Mar 2012 TTM
Highland Portfolio Net Operating Income
$79
$82
$86
$87 |
 Significant Operational Upside
38
•
If Highland’s EBITDA was the same % of its peak level as our legacy
portfolio, its EBITDA would be almost $10 million higher
•
This
would
equate
to
about
an
additional
$1.40
in
share
price
at
a
12x
EBITDA
multiple
60%
65%
70%
75%
80%
85%
90%
95%
100%
2007
2008
2009
2010
TTM Q3 2011
% of Peak EBITDA Comparison
Legacy
Highland
700
bps
Opportunity |
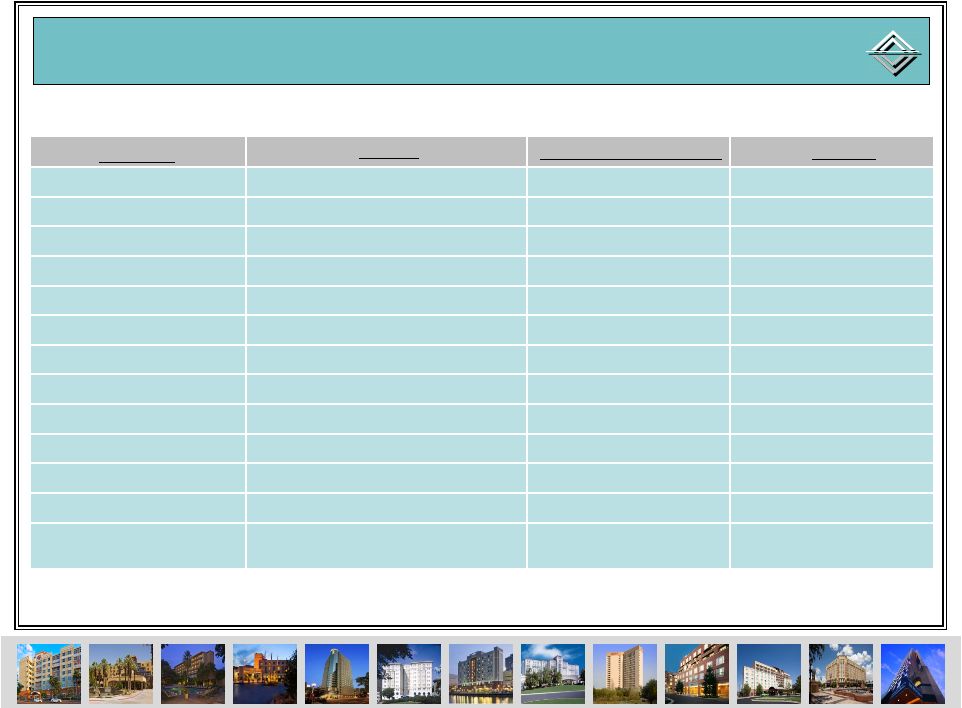 Key Capex Renovations
39
Lobby & Restaurant
Guestrooms & Public Space
Guestrooms & Bistro Lobby
Courtyard Denver
Hyatt Windwatch
Marriott Omaha
The Churchill
The Melrose
Courtyard Savannah
Marriott San Antonio
Courtyard Boston Tremont
Hilton Boston Back Bay
Ritz-Carlton Atlanta
HGI Virginia Beach
The Silversmith
Marriott DFW
Lobby Bistro
Exterior Façade
Lobby & Restaurant
Guestrooms & Corridors
HVAC
66 Guestrooms & Meeting Space
Meeting Space
Guestrooms & Public Space
Restaurant Renovation
Completed in Q2’11
In progress
Early
November
Mid-November
Late-November
Early-December
Mid-December
January-February
February
February
Q1 2012
Q2 2012
On Hold for
Repositioning
$875,000
$1,400,000
$1,350,000
$871,000
$8,050,000
$2,475,000
$3,815,000
$5,781,000
$2,160,000
$757,000
$2,000,000
$5,000,000
$750,000
Property
Project
Scheduled Start Date
Budget
Guestrooms & Corridor |
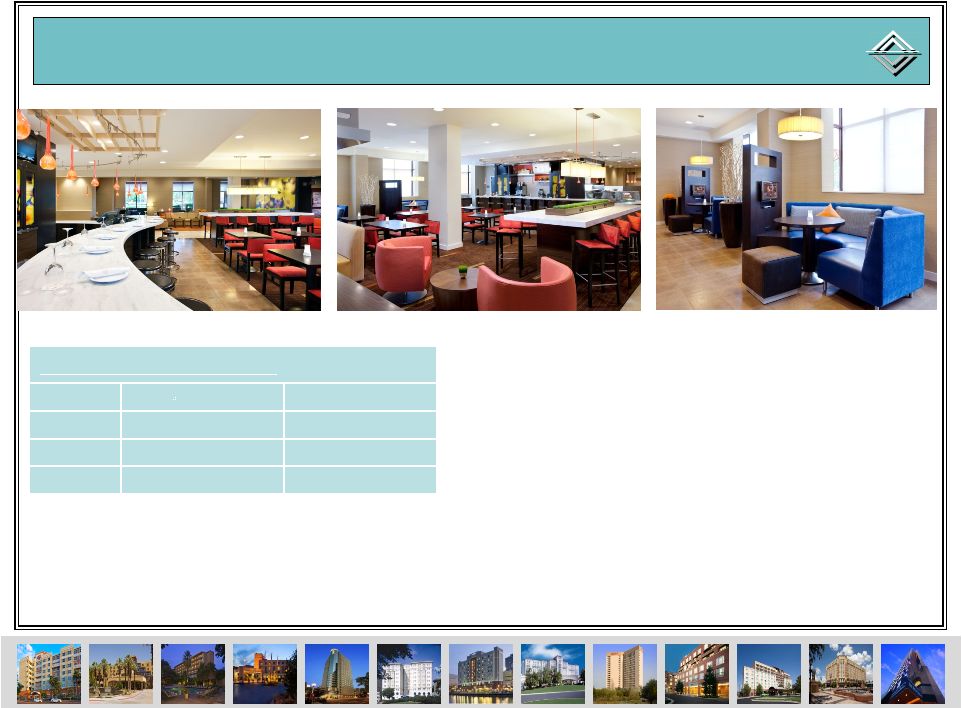 Case Study –
CY Denver Lobby Bistro
CY Denver Lobby Bistro
40
•
Courtyard Bistro Lobby renovation was
completed in Q2 2011
•
Lobby GSS scores improved greatly from
previous years
•
Q3 2011 RevPAR index was up to 108.7
from 104.5 in Q3 2010
GSS Lobby Rankings
2009
2010
1H 2011
2H 2011
Pre-Renovation
Pre-Renovation
510 out of 780
560 out of 808
During Renovation
771 out of 818
263 out of 819
Post-Renovation |
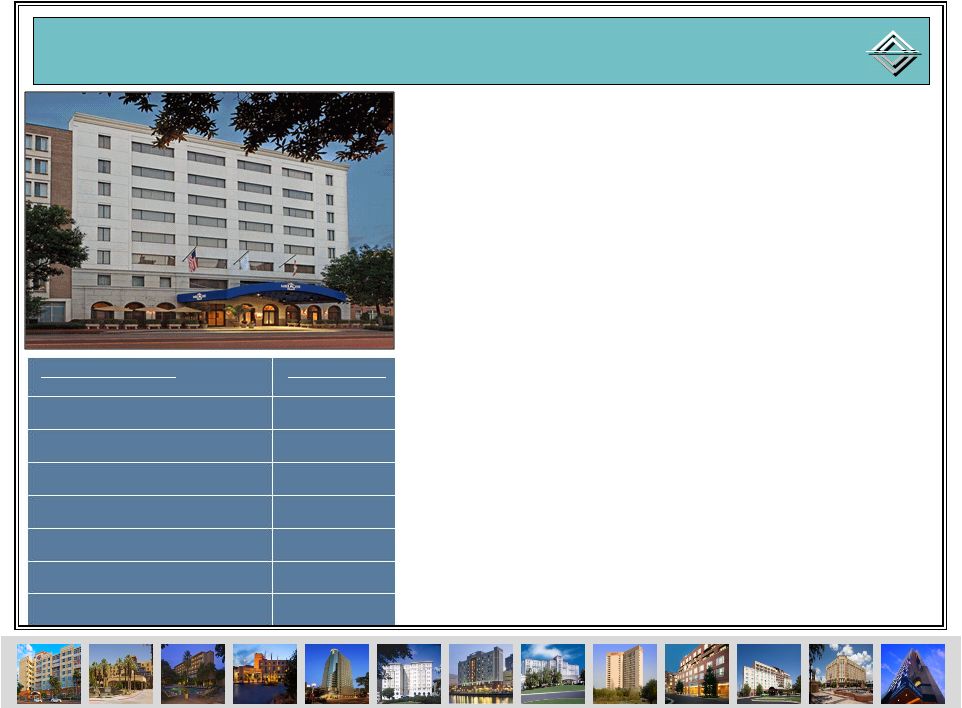 Case Study –
Melrose Hotel
Melrose Hotel
41
•
Last renovation in 2002
•
RevPAR Index dropped from 101.4% in
2007 to 83.6% YTD September 2011
•
Location on Pennsylvania Ave. adjacent
to Georgetown and 8 blocks from White
House and National Mall
•
Over sized rooms of average 425 sq. ft.
with 35 suites
•
Good curb appeal despite current
condition
•
Underutilized street-level restaurant and
bar space
•
Planned $8.1m renovation to address all
aspects of hotel
Financial Statistics
TTM Q3 2011
ADR
$161.29
Occupancy
75.9%
RevPAR
$122.45
NOI
$3.6m
Peak NOI (2007)
$6.2m
RevPAR Index
84.7%
Comp Set Rank
7 of 7 |
 Highland Transaction Conclusion
42
We
We
purchased
purchased
a
a
remarkable
remarkable
portfolio
portfolio
for
for
nearly
nearly
half
half
of
of
its
its
replacement
replacement
cost and materially below what our peers are paying for assets
cost and materially below what our peers are paying for assets
We have made significant progress in achieving operational flow
We have made significant progress in achieving operational flow
throughs and pushing RevPAR yield index
throughs and pushing RevPAR yield index
In only six months’
In only six months’
time our asset management group has managed to
time our asset management group has managed to
achieve
achieve
nearly
nearly
90%
90%
of
of
its
its
1
1
st
st
year
year
NOI
NOI
target
target
The Highland portfolio is off its peak substantially more than our
The Highland portfolio is off its peak substantially more than our
legacy portfolio, providing us with additional upside
legacy portfolio, providing us with additional upside
Our strategic capex will help realize additional upside potential
Our strategic capex will help realize additional upside potential
|
 UBS Global Real Estate Conference
November 2011 |