Attached files
| file | filename |
|---|---|
| 8-K - FORM 8-K - HEALTHCARE TRUST OF AMERICA, INC. | d260774d8k.htm |
Exhibit 99.1
1
HTA
Healthcare Trust of America, Inc.
THIRD QUARTER 2011 HIGHLIGHTS
Proactive Asset Management, Leasing and Property Management.
We have a total portfolio of 11.2 million square feet, located in 25 states. With approximately 31% of our portfolio managed in-house, we have regional offices in both Charleston, SC and Indianapolis, IN. Our regional offices manage our assets throughout the east coast and the midwest.
For the third quarter of 2011, we maintained an average occupancy rate1 of approximately 91% with approximately 96% of our portfolio, based on gross leasable area (GLA), located on or adjacent to, or anchored by, the campuses of nationally and regionally recognized healthcare systems.
Financial Strength & Balance Sheet Flexibility. In May 2011, we acquired a $575 million unsecured credit facility, led by JP Morgan, Wells Fargo and Deutsche Bank, to replace our $275 million unsecured credit facility.
With our unused unsecured credit facility and low leverage, we have the capital capacity with increased leverage to acquire over $1 billion of medical office buildings (MOBs) and healthcare-related facilities, based on the current covenant requirements at the end of the third quarter 2011.
In July 2011, we received an investment Poor’s which we believe will enhance and achieve favorable pricing.
Growth through Targeted Acquisitions. Our strategy is to acquire high quality MOBs, located on or adjacent to nationally recognized healthcare system campuses in high growth markets, with the potential for long-term value appreciation.
Since January 1, 2011, we have acquired $68.3 million in MOBs, bringing our portfolio to $2.3 billion in total assets and our total portfolio GLA to 11.2 million square feet.
Partnering with Healthcare Systems and Physicians. Through our management team’s experience strategic acquisitions, and our we have developed extensive long-term relationships with healthcare systems, physician groups, developers, lenders, brokers and other real estate professionals. We believe these strong relationships with our hospital systems and physician tenants drive demand for our MOB space, increase tenant retention rates and provide us with further investment opportunities.
Desert Ridge Medical Campus, Phoenix, Arizona Acquired October 2011
St. John Providence MOB, Novi, Michigan Under Contract
HTA Third Quarter 2011 and Recent Highlights
Closed the third quarter 2011 with a debt-to-total assets ratio of approximately 28% and cash on hand of $122.3 million.
Increased YTD funds from operations (FFO) by 50% and YTD normalized FFO by 45% compared to the nine months ended September 30, 2010.
Increased QTD FFO by 35% and QTD normalized FFO by 38% compared to the third quarter of 2010.
Improved YTD net operating income (NOI) by 43% compared to the nine months ended September 30, 2010.
Grew QTD NOI by 36% compared to the third quarter of 2010.
Completed the acquisition of the Desert Ridge Medical Campus in October 2011, comprised of two Class A
MOBs in Phoenix, AZ with 118,000 square feet of GLA and a combined occupancy of 88% for $32 million.
Entered into a purchase and sale agreement at the end of the third quarter 2011 to acquire the St. John Providence MOB in Novi, Michigan, a 98% occupied MOB with 203,000 square feet of GLA for $51.3 million.
Relocated our east coast office, effective November 1, 2011, to the historic downtown district of Charleston, SC to serve as a direct point of service to our tenants on the east coast.
•? Received overwhelming shareholder approval of key corporate initiatives with the reelection of our Board of Directors at our Annual Meeting of Shareholders on November 9, 2011.
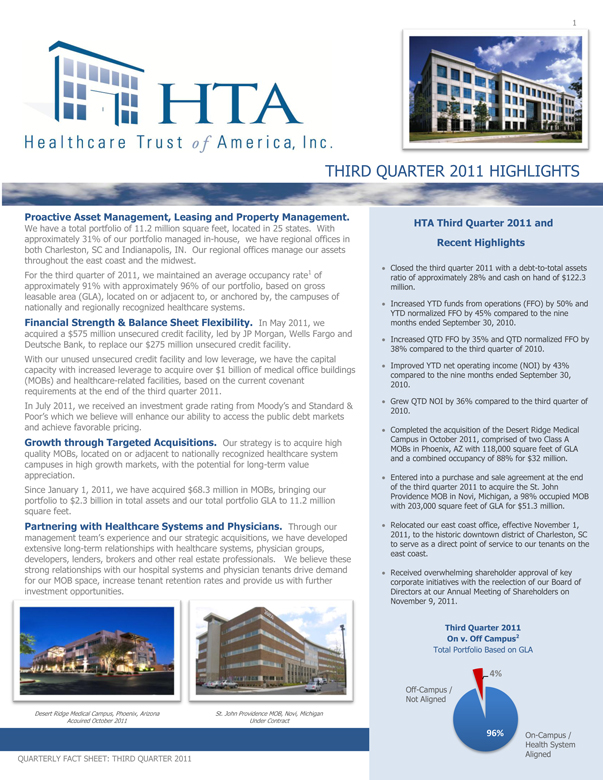
Third Quarter 2011 On v. Off Campus2
Total Portfolio Based on GLA
Off-Campus / Not Aligned
On-Campus / Health System Aligned
QUARTERLY FACT SHEET: THIRD QUARTER 2011
2
Deaconess Evansville Clinic Portfolio, Newburgh, Indiana Acquired March 2010
7900 Fannin, Houston, Texas Acquired June 2010
Florida Orthopedic ASC, Temple Terrace, Florida Acquired December 2010
Healthcare Sector Strengths & Fundamentals. Healthcare is one of the fastest growing segments of the US economy, driven by a continually expanding population and growth in the utilization of medical care as the baby boomer generation approaches retirement age. Advancements in medical technology and specialization have allowed physicians to perform lower cost procedures that have traditionally been performed in hospitals with limited space. As demand for medical services increases, physicians are moving into medical office facilities that are better suited to the needs of the profession and a shifting consumer preference for outpatient services. Medical office buildings provide stable, long-term growth within this market, and do not experience as much volatility as other healthcare asset classes during turbulent times.
Portfolio Fundamentals. As of November 2011, our portfolio of 11.2 million square feet of GLA is focused on strategically located on-campus medical office buildings in locations with high barriers to entry. With approximately 91% occupancy1 and minimal near-term rollover, our portfolio allows for a good balance of growth through increased occupancy and stability within our existing tenant base. By acquiring high quality buildings with dominant healthcare systems, we are able to enter into stable leases that generate attractive annual rental revenue.
High Quality MOB
Portfolios.
“Our attention to operating fundamentals, and the financial flexibility that our balance sheet provides, will allow HTA to continue to focus on creating enhanced shareholder value through both internal and external
Scott D. Peters Chief Executive Officer & President
Credit Rating of
Portfolio # of MOBs GLA Hospital System Affiliation Location
Hospital System
Greenville Hospital Portfolio 16 857,000 Greenville Hospital System Moody’s A1South Carolina
Indiana MOB Portfolio 24 690,000 Indiana University Health Moody’s1 A Indiana
Banner Sun City 18 642,000 Banner Health Fitch AA- Arizona
Federal North MOB & West Penn Allegheny Health
2 421,000 Moody’s B2 Pennsylvania
Allegheny HQ System
Wisconsin MOB Portfolios 6 315,000 Aurora Health Care S&P A Wisconsin
Mountain Empire 11 287,000 Wellmont Health System S&P BBB+ Tennessee & Virginia
Deaconess Evansville Clinic Portfolio 5 261,000 Deaconess Health System Fitch A+ Indiana
7900 Fannin 1 177,000 Hospital Corp of America Moody’s B1 Texas
Strategic Locations
We focus on acquiring high quality medical office buildings with stabilized occupancy in key strategic on-campus locations associated with dominant healthcare systems.
Our portfolio has a strong presence in cost of doing business, favorable regulatory climate and plentiful, educated workforce.
Diversification & Concentration
With properties in 25 states, we have significant investments in Texas, Arizona, South Carolina, Indiana, Georgia, New York and Florida.
We manage a diversified income stream with no more than 15% of total revenues and no more than 12% of total portfolio GLA focused in any one state, for the nine months ended September 30, 2011.
Health Care Sector Fundamentals
Demographic trends, including an aging population, an increase in echo boomers moving to these regions for jobs, the decentralization and specialization of healthcare services, and high state healthcare spending forecasts will continue to fuel sustainable growth in these markets.
Even during the most recent recession, the healthcare industry has continued to expand in our key markets.
QUARTERLY FACT SHEET: THIRD QUARTER 2011
HTA Key Statistics3
YTD 9/30/11 YTD 9/30/10 YTD 12/31/10
Total Assets $ 2,334,074 $ 1,996,907 $ 2,271,795
Total Invested Assets 5 $ 2,303,402 $ 1,802,226 $ 2,266,359
Cash on Hand $ 122,303 $ 221,186 $ 29,270
Mortgage Loans Payable, Net and Outstanding Balance
on Unsecured Revolving Credit Facility $ 650,111 $ 594,428 $ 706,526
Debt-to-Total Assets 27.9% 29.8% 31.1%
Weighted average interest rate on portfolio 5.05% 4.50% 4.95%
Number of Properties Owned 242 208 238
Number of MOB Properties Owned 218 189 214
Total Gross Leasable Area (sq. ft.) 11,107,000 8,943,000 10,919,000
Number of States 25 23 24
% of On/Off Campus 2 96% / 4% 95% / 5% 94% / 6%
Portfolio Occupancy Rate 1 91% 91% 91%
Total Revenues $ 208,906 $ 145,577 $ 199,879
Net Income (Loss) $ 3,586 $771 $ (7,919)
Cash Flow From Operations $ 86,260 $ 49,623 $ 58,503
Net Operating Income 4 $ 140,441 $ 97,990 $ 137,419
Funds From Operations 4 $ 84,164 $ 55,931 $ 69,449
Modified Funds From Operations 4 $ 85,991 $ 63,782 $ 89,166
Normalized Funds From Operations $ 85,737 $ 59,203 $ 83,198
Distributions Declared $ 120,890 $ 85,435 $ 120,507
Distributions Paid in Cash $ 63,001 $ 42,870 $ 60,176
Distributions Declared Per Share $ 0.53 $ 0.53 $ 0.73
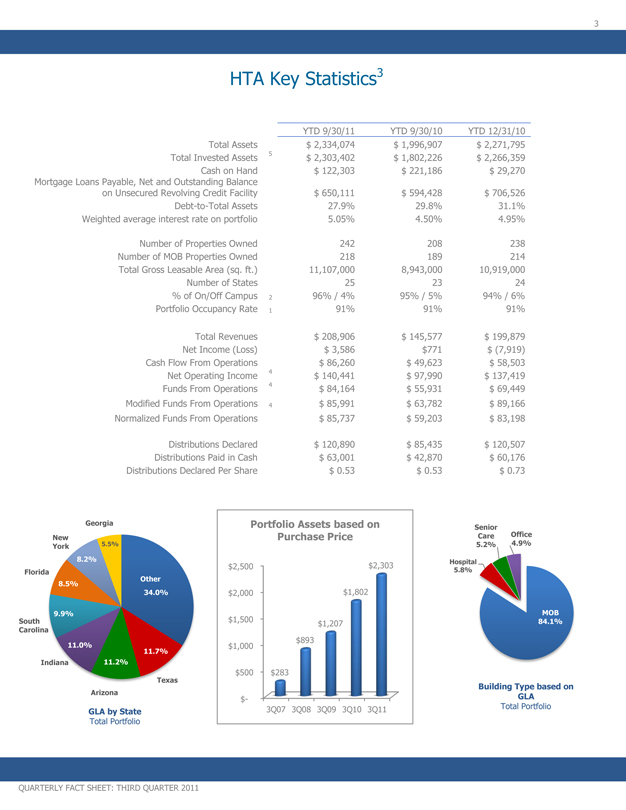
Georgia Portfolio Assets based on
Senior Office
New Purchase Price Care 4.9%
York 5.5% 5.2%
8.2% Hospital $2,500 $2,303
Florida 5.8% Other
8.5% $1,802 34.0% $2,000
9.9% MOB
South $1,500 $1,207 84.1% Carolina $893 11.0% $1,000
11.7% Indiana 11.2%
Texas $500 $283
Building Type based on Arizona GLA $- 3Q07 3Q08 3Q09 3Q10 3Q11 Total Portfolio
GLA by State
Total Portfolio
QUARTERLY FACT SHEET: THIRD QUARTER 2011
4
Lima MOB Portfolio, Lima, OH SouthCrest Medical Plaza, Stockbridge, GA Wisconsin MOB Portfolio 2, Mequon, Wisconsin
Acquired December 2007 Acquired June 2008 Acquired May 2009
Consolidated Funds from Operations, Modified Funds from Operations, Normalized Funds from Operations, Net Operating Income4 We consider FFO, MFFO, and normalized FFO as useful supplemental measures for evaluating the potential future performance of our portfolio, how our portfolio might perform after our acquisition stage is complete and the sustainability of our distributions in the future. None of FFO, MFFO, or normalized FFO should be considered as an alternative to net income (loss) or to cash flows from operating activities and are not intended to be used as a liquidity measure indicative of cash flow available to fund our cash needs, including our ability to make distributions. FFO, MFFO, and normalized FFO should be reviewed in connection with other GAAP measurements.
We believe that NOI is a widely accepted measure of comparative operating performance in the real estate community. We believe that NOI provides an accurate measure of the operating performance of our operating assets because NOI excludes certain items that are not associated with management of the properties.
Nine months ended Twelve months ended
September 30, 2011 September 30, 2010 December 31, 2010
Net income (loss) $ 3,586,000 $ 771,000 $(7,919,000)
Depreciation and amortization — consolidated properties 80,811,000 55,767,000 78,561,000
Net (income) loss attributable to noncontrolling interest of limited partners(40,000) 60,000 16,000
Depreciation and amortization related to noncontrolling interests(193,000)(667,000)(1,209,000)
FFO attributable to controlling interest 84,164,000 55,931,000 69,449,000
FFO per share –basic and diluted 0.38 0.36 0.42
Acquisition-related expenses 1,827,000 6,845,000 11,317,000
Transition-related charges—1,006,000 8,400,000
MFFO attributable to controlling interest 85,991,000 63,782,000 89,166,000
MFFO per share –basic and diluted 0.39 0.41 0.54
Termination fee revenue(1,417,000)(8,000)(14,000)
Net (gain) loss on change in fair value of derivative financial instruments 1,163,000(4,571,000)(5,954,000)
Normalized FFO attributable to controlling interest 85,737,000 59,203,000 83,198,000
Normalized FFO per share –basic and diluted 0.38 0.38 0.50
Weighted average common shares outstanding –basic 224,151,270 155,480,689 165,952,860
Weighted average common shares outstanding –diluted 224,328,657 155,679,741 165,952,860
Net income (loss) $ 3,586,000 $ 771,000 $(7,919,000)
Add: General and administrative expense 22,223,000 12,781,000 26,038,000
Acquisition-related expenses 1,827,000 6,845,000 11,317,000
Depreciation and amortization 80,811,000 55,767,000 78,561,000
Interest expense and net gain on derivative financial instruments 32,155,000 21,900,000 29,541,000
Less: Interest and dividend income(161,000)(74,000)(119,000)
Net operating income 140,441,000 97,990,000 137,419,000
The average occupancy rate on our portfolio of properties includes leases signed but not yet commenced.
On-campus includes properties located on, adjacent to, or anchored by, the campuses of nationally and regionally recognized healthcare systems.
All figures are rounded to reflect approximate amounts. Dollars in thousands, except per share amounts.
For additional information on FFO, modified FFO and NOI, see our Quarterly Report on Form 10-Q for the nine months ended September 30, 2011 and our Annual Report on Form 10-K for the twelve months ended December 31, 2010.
Total invested assets are based on purchase price.
Contact Us
Healthcare Trust of America, Inc. 16435 North Scottsdale Road, Suite 320 Scottsdale, AZ 85254 Telephone: (480) 998-3478 Fax: (480) 991-0755 Email: info@htareit.com Website: www.htareit.com