Attached files
| file | filename |
|---|---|
| 8-K - FORM 8K - DYCOM INDUSTRIES INC | form8k.htm |
| EX-99.1 - EXHIBIT 99.1 - DYCOM INDUSTRIES INC | exhibit991.htm |
Exhibit 99.2

Fiscal 2012
1st Quarter Presentation
November 22, 2011

1
Participants
|
Steven E. Nielsen
President & Chief Executive Officer Timothy R. Estes
Chief Operating Officer
H. Andrew DeFerrari
Chief Financial Officer Richard B. Vilsoet
General Counsel |

2
Forward-Looking Statements and
Non-GAAP Information
Non-GAAP Information
Forward-Looking Statements and
Non-GAAP Information
Non-GAAP Information
Fiscal 2012 first quarter results are unaudited. This presentation contains “forward-looking statements” which
are statements relating to future events, future financial performance, strategies, expectations, and competitive
environment. All statements, other than statements of historical facts, contained in this presentation, including
statements regarding our future financial position, future revenue, prospects, plans and objectives of
management, are forward-looking statements. Words such as “believe,” “expect,” “anticipate,” “estimate,”
“intend,” “forecast,” “may,” “should,” “could,” “project,” “looking ahead” and similar expressions, as well as
statements in future tense, identify forward looking statements. You should not read forward looking statements
as a guarantee of future performance or results. They will not necessarily be accurate indications of whether or
at what time such performance or results will be achieved. Forward looking statements are based on
information available at the time those statements are made and/or management’s good faith belief at that time
with respect to future events. Such statements are subject to risks and uncertainties that could cause actual
performance or results to differ materially from those expressed in or suggested by the forward looking
statements. Important factors that could cause such differences include, but are not limited to factors described
under Item 1A, “Risk Factors” of the Company’s Annual Report on Form 10-K for the year ended July 30, 2011,
and other risks outlined in the Company’s periodic filings with the Securities and Exchange Commission
(“SEC”). The forward-looking statements in this presentation are expressly qualified in their entirety by this
cautionary statement. Except as required by law, the Company may not update forward-looking statements
even though its situation may change in the future.
This presentation includes certain “Non-GAAP” financial measures as defined by SEC rules. We believe that the
presentation of certain Non-GAAP financial measures provides information that is useful to investors because it
allows for a more direct comparison of our performance for the period with our performance in the comparable
prior-year periods. As required by the SEC, we have provided a reconciliation of those measures to the most
directly comparable GAAP measures on the Regulation G slides included as slides 11 through 13 of this
presentation. We caution that Non-GAAP financial measures should be considered in addition to, but not as a
substitute for, our reported GAAP results.

3
Q1-2012 Overview
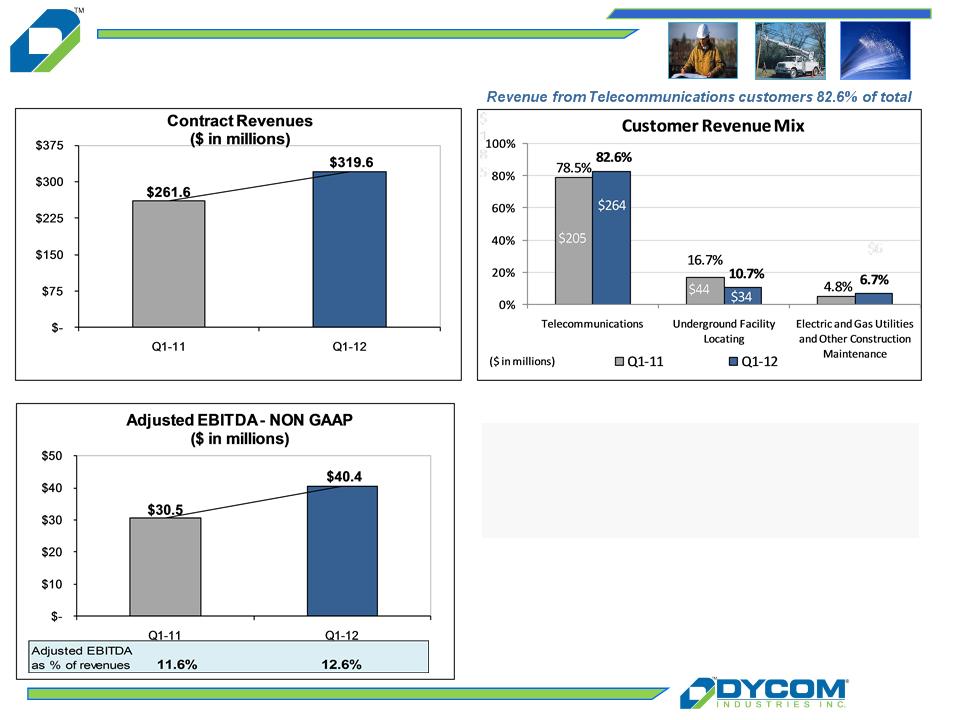
n Contract revenue of $319.6 million as compared to $261.6 million in the prior year
quarter
quarter
n Contract revenue grew organically 16.6%, the highest level of organic growth in over
7 years, and included $3.7 million of storm restoration services
7 years, and included $3.7 million of storm restoration services
n Adjusted EBITDA of $40.4 million in Q1-12 grew 32.6% compared to Q1-11
n Net income of $0.38 per share diluted compared to $0.18 per share diluted in Q1-11
n Backlog increased sequentially for the fourth consecutive quarter
Note: The organic revenue percentage of 16.6% excludes revenues from businesses acquired in fiscal 2011. See “Regulation G
Disclosure” slides 11-13 for a reconciliation of GAAP to Non-GAAP financial measures.
Disclosure” slides 11-13 for a reconciliation of GAAP to Non-GAAP financial measures.
4
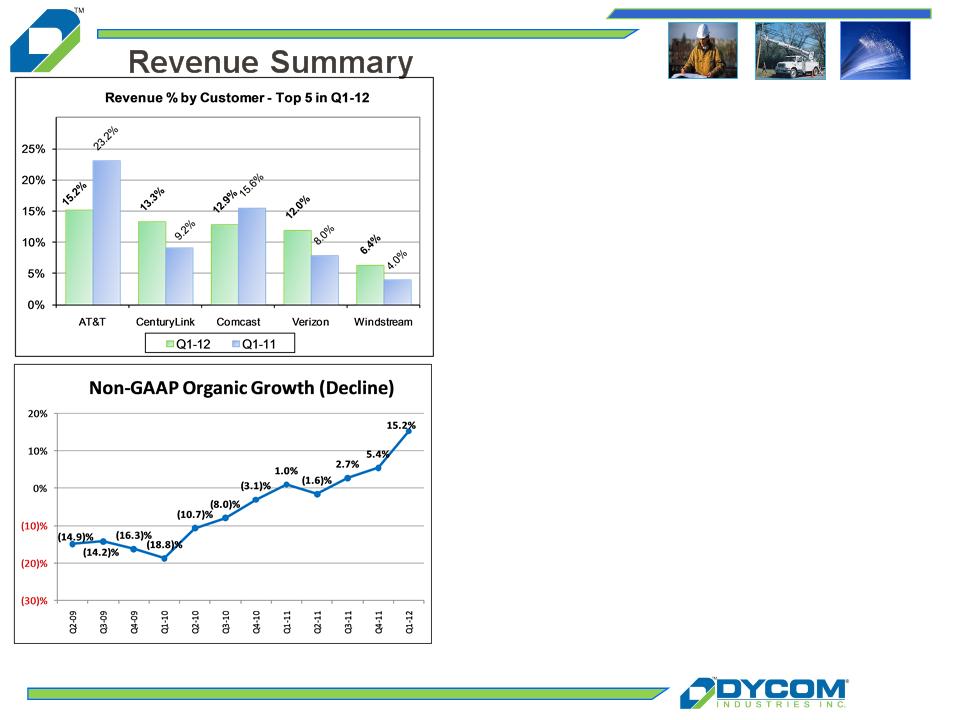
n Top 5 customers from Q1-12 represented 59.9% of
revenue in Q1-12 compared to 60.0% of revenue
in Q1-11
revenue in Q1-12 compared to 60.0% of revenue
in Q1-11
Ø CenturyLink became Dycom’s second largest
customer with over 62% organic growth
customer with over 62% organic growth
Ø Verizon’s organic growth exceeded 77% year-
over-year
over-year
Ø Windstream, Dycom’s fifth largest customer in
Q1-12, grew organically in excess 40%
Q1-12, grew organically in excess 40%
n Organic revenue growth of 15.2%, excluding revenue
from storm restoration services of $3.7 million and
businesses acquired in Q2-11 of $14.5 million:
from storm restoration services of $3.7 million and
businesses acquired in Q2-11 of $14.5 million:
Ø Revenue from Top 5 customers up 14.7%
Ø Combined revenue from other customers up
16.0%
16.0%
n Recently acquired companies, Communication
Services and NeoCom, contributed aggregate
revenues of $14.5 million during the quarter
Services and NeoCom, contributed aggregate
revenues of $14.5 million during the quarter
* For comparison purposes, CenturyLink includes combined revenues from CenturyTel, Inc. and Qwest Communications International, Inc. for each period presented. Additionally,
Windstream Corporation includes revenues from Kentucky Data Link, Inc. for each period presented.
Windstream Corporation includes revenues from Kentucky Data Link, Inc. for each period presented.
Note: See “Regulation G Disclosure” slides 11 -13 for a reconciliation of GAAP to Non-GAAP financial measures.

5
Backlog and Awards
Current Awards and Extensions
|
Customers
|
Description
|
Area
|
Approximate Term
(in years) |
|
nCharter
|
Installation Services
|
United States
|
1
|
|
nTime Warner Cable
|
Installation Services
|
New Jersey, New York,
North Carolina |
1-3
|
|
nTDS Telecommunications
|
Construction and Maintenance Services
|
Tennessee
|
3
|
|
nFrontier Communications
|
Construction and Maintenance Services
|
Tennessee
|
2
|
|
nRural Broadband Customers
|
Construction Services
|
North Carolina, Tennessee,
Kentucky, Virginia, New Mexico |
1-2
|
Currently expect to perform at least $200 million of additional broadband related stimulus projects
during the remainder of fiscal 2012 through fiscal 2014
during the remainder of fiscal 2012 through fiscal 2014
6
Summary Results
|
|
Q1-11
|
Q1-12
|
|
Net Income (in millions)
|
$ 6.7
|
$ 13.0
|
|
Fully Diluted EPS
|
$0.18
|
$0.38
|
Organic revenue growth of 15.2%
Adjusted EBITDA growth from improved operating leverage
EPS of $0.38 per common share diluted
Note: The organic revenue percentage of 15.2% excludes storm restoration
services of $3.7 million and revenues from businesses acquired in Q2-11 of
$14.5 million. See “Regulation G Disclosure” slides 11-13 for a
reconciliation of GAAP to Non-GAAP financial measures.
services of $3.7 million and revenues from businesses acquired in Q2-11 of
$14.5 million. See “Regulation G Disclosure” slides 11-13 for a
reconciliation of GAAP to Non-GAAP financial measures.

7
Selected Information
(a) Amounts may not foot due to rounding.
Q1-12
Q1-11
Change (a)
($ in millions)
Contract Revenues
$319.6
$261.6
$58.0
Cost of Earned Revenues
$255.2
79.9%
$209.3
80.0%
$45.9
(0.2)%
General & Administrative
$25.4
7.9%
$22.8
8.7%
$2.5
(0.8)%
Depreciation & Amortization
$16.0
5.0%
$15.6
6.0%
$0.3
(1.0)%
Interest expense
$4.2
1.3%
$3.7
1.4%
$0.5
(0.1)%
Other Income, net
$3.0
0.9%
$1.8
0.7%
$1.2
0.3%
Net Income
$13.0
4.1%
$6.7
2.6%
$6.2
1.5%
Adjusted EBITDA
$40.4
12.6%
$30.5
11.6%
$9.9
1.0%
Organic revenue growth of 15.2%,
excluding revenue from storm restoration services
and businesses acquired in Q2-11
excluding revenue from storm restoration services
and businesses acquired in Q2-11
nContract award activity, including
broadband stimulus projects, and
growth within existing contracts
broadband stimulus projects, and
growth within existing contracts
nImproved pricing environment
Adjusted EBITDA growth
nIncreased 100 bps year-over-year
nImproved labor efficiency and greater
leverage of general & administrative
costs
leverage of general & administrative
costs
Note: See “Regulation G Disclosure” slides 11-13 for a reconciliation of GAAP to Non-GAAP financial measures.

8
Cash Flow and Liquidity
Operating and Investing Cash Flows
support growth
support growth
n Improved operating cash flows
n Capital expenditures, net of disposals,
of $14.4 million
of $14.4 million
Balance Sheet Strength
n Ample liquidity from cash on hand and
$179.8 million of availability under
Senior Credit Agreement
$179.8 million of availability under
Senior Credit Agreement

9
Summary
n End market opportunities driving organic growth
} Industry participants aggressively extending or deploying
fiber networks to provide wireless backhaul services
fiber networks to provide wireless backhaul services
} Broadband stimulus funding meaningfully increasing network
construction for rural service providers
construction for rural service providers
} Cable operators deploying fiber to small and medium
businesses
businesses
} Wireless carriers upgrading from 3G to 4G technologies
} Telephone companies deploying FTTX to enable video
offerings
offerings
n Capital structure optimized to significantly benefit our
shareholders
shareholders

10
Looking Ahead
n Normal seasonal operating patterns and low double digit organic revenue growth
excluding fiscal 2011 revenue from storm restoration services
excluding fiscal 2011 revenue from storm restoration services
n Margins and earnings which reflect operating efficiencies at higher revenue levels
n Strong cash flows dedicated as projected returns direct towards supporting organic
growth, accretive acquisition opportunities and share repurchases as permitted by
regulatory requirements
growth, accretive acquisition opportunities and share repurchases as permitted by
regulatory requirements
n Confident that trends will continue to improve for a sustained period
Q2 - 2012:
n Organic revenue which grows mid to high-teens as a percent of revenue year-over-year
n Gross margins which improve slightly year over year and are impacted sequentially by
seasonal weather conditions
seasonal weather conditions
n General and administrative expenses which decline slightly on a sequential basis
n Depreciation and amortization sequentially in line
n Other income which decreases slightly year-over-year
n Fully diluted share count which increases modestly on a sequential basis

11
Appendix: Regulation G Disclosure
The above table presents the Non-GAAP financial measure of Adjusted EBITDA for the three months ended October 29, 2011 and October 30, 2010.
Adjusted EBITDA is a Non-GAAP financial measure within the meaning of Regulation G promulgated by the Securities and Exchange Commission.
The Company defines Adjusted EBITDA as earnings before interest, taxes, depreciation and amortization, gain on sale of fixed assets, and stock-
based compensation expense. The Company believes this Non-GAAP financial measure provides information that is useful to the Company’s
investors. The Company believes that this information is helpful in understanding period-over-period operating results separate and apart from items
that may, or could, have a disproportionate positive or negative impact on the Company’s results of operations in any particular period. Additionally,
the Company uses this Non-GAAP financial measure to evaluate its past performance and prospects for future performance. Adjusted EBITDA is not a
recognized term under GAAP and does not purport to be an alternative to net income, operating cash flows, or a measure of earnings. Because all
companies do not use identical calculations, this presentation of Non-GAAP financial measures may not be comparable to other similarly titled
measures of other companies. These tables present a reconciliation of Adjusted EBITDA to the most directly comparable GAAP measure.
12
Appendix: Regulation G Disclosure
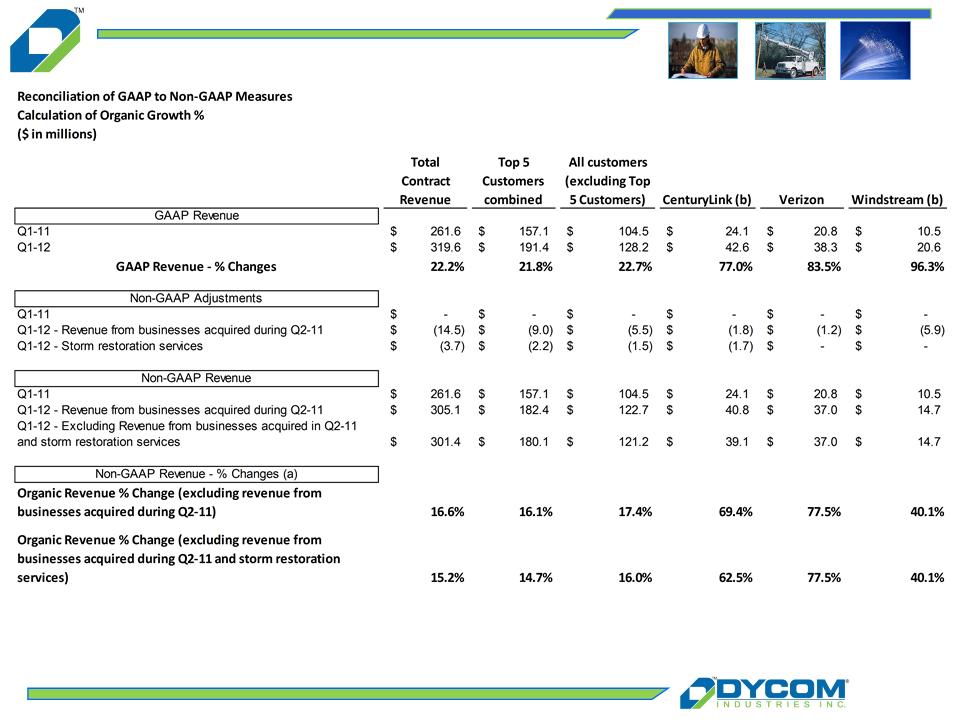
(a) Year-over-year growth percentage is calculated as follows: (i) revenues in the quarterly period less (ii) revenues in the comparative prior year quarter period; divided
by (ii) revenues in the comparative prior year quarter period.
by (ii) revenues in the comparative prior year quarter period.
(b) For comparison purposes, CenturyLink includes combined revenues from CenturyTel, Inc. and Qwest Communications International, Inc. for each period presented.
Additionally, Windstream Corporation includes revenues from Kentucky Data Link, Inc. for each period presented.
Additionally, Windstream Corporation includes revenues from Kentucky Data Link, Inc. for each period presented.
Amounts may not foot due to rounding.

13
Amounts may not foot due to rounding.
(a) Non-GAAP adjustments in Q1-12 reflect storm restoration revenues ($3.7 million) and revenues from businesses acquired during Q2-11 ($14.5 million). Non-GAAP
adjustments in Q4-11 reflect storm restoration revenues ($14.1 million) and revenues from businesses acquired during Q2-11 ($14.1 million). Non-GAAP adjustments
in Q3-11 and Q2-11 reflect revenues from businesses acquired during Q2-11. Non-GAAP adjustments in Q4-10 result from the Company’s 52/53 week fiscal year. The
Q4-10 Non-GAAP adjustments reflect the impact of the additional week in Q4-10 and are calculated by dividing contract revenues by 14 weeks. The result,
representing one week of contract revenues, is subtracted from the GAAP-contract revenues to calculate 13 weeks of revenue for Q4-10 on a Non-GAAP basis for
comparison purposes. Non-GAAP adjustments in Q3-09, Q2-09, and Q1-09 reflect storm restoration revenues recognized during those periods.
(b) Year-over-year growth (decline) percentage is calculated as follows: (i) revenues in the quarterly period less (ii) revenues in the comparative prior year quarter
period; divided by (ii) revenues in the comparative prior year quarter period.
period; divided by (ii) revenues in the comparative prior year quarter period.

Fiscal 2012
1st Quarter Presentation
November 22, 2011