Attached files
| file | filename |
|---|---|
| EX-99.1 - EXHIBIT 99.1 - ZALE CORP | a50080625ex99-1.htm |
| 8-K - ZALE CORPORATION 8-K - ZALE CORP | a50080625.htm |
Exhibit 99.2
First Quarter Fiscal 2012 Earnings Call November 21, 2011 Draft for Discussion 11-18-11
Forward-Looking Statements and Use of Non-GAAP Financial Measures This presentation contains forward-looking statements, including statements regarding our multi-year plan, future sales, expenses, margins, profitability, merchandising and marketing initiatives, the future impact of the warranty revenue recognition change and industry growth forecasts. Forward-looking statements are not guarantees of future performance and a variety of factors could cause the Company's actual results to differ materially from the results expressed in the forward-looking statements. These factors include, but are not limited to: if the general economy continues to perform poorly, discretionary spending on goods that are, or are perceived to be, “luxuries” may decrease; the concentration of a substantial portion of the Company’s sales in three, relatively brief selling seasons means that the Company’s performance is more susceptible to disruptions; most of the Company’s sales are of products that include diamonds, precious metals and other commodities, and fluctuations in the availability and pricing of commodities could impact the Company’s ability to obtain and produce products at favorable prices; the Company’s sales are dependent upon mall traffic; the Company operates in a highly competitive industry; the financing market remains difficult, and if we are unable to meet the financial commitments in our current financing arrangements it will be difficult to replace or restructure these arrangements; and changes in regulatory requirements may increase the cost or adversely affect the Company’s operations and its ability to provide consumer credit and write credit insurance. For other factors, see the Company's filings with the Securities and Exchange Commission, including its Annual Report on Form 10-K for the fiscal year ended July 31, 2011. The Company disclaims any obligation to update or revise publicly or otherwise any forward-looking statements to reflect subsequent events, new information or future circumstances, except as required by law.This presentation contains certain non-GAAP measures as defined by SEC rules. One of these non-GAAP measures is EBITDA, which is defined as earnings before interest, taxes, depreciation and amortization. A second non-GAAP measure is adjusted EBITDA, which is further adjusted to exclude charges related to store closures. We use these measurements as part of our evaluation of the performance of the Company. In addition, we believe these measures provide useful information to investors. Please refer to the appendix at the back of this presentation for a reconciliation of these non-GAAP measures to the most comparable GAAP financial measures.
Q1 FY12 – Solid Results Continued Progress Comparable Store Sales up 5.8% (1) Four consecutive quarters of positive compsTTM comparable store sales up 9.5% Significant improvement in Gross Margin Price increases Decrease in merchandise discounts Improved inventory mix Core merchandise mix at 85% (1) Comparable Store Sales exclude revenue recognized from warranties. The sales results of new stores are included beginning with the thirteenth full month of operations, and the sales results of closed stores are excluded from the calculation.
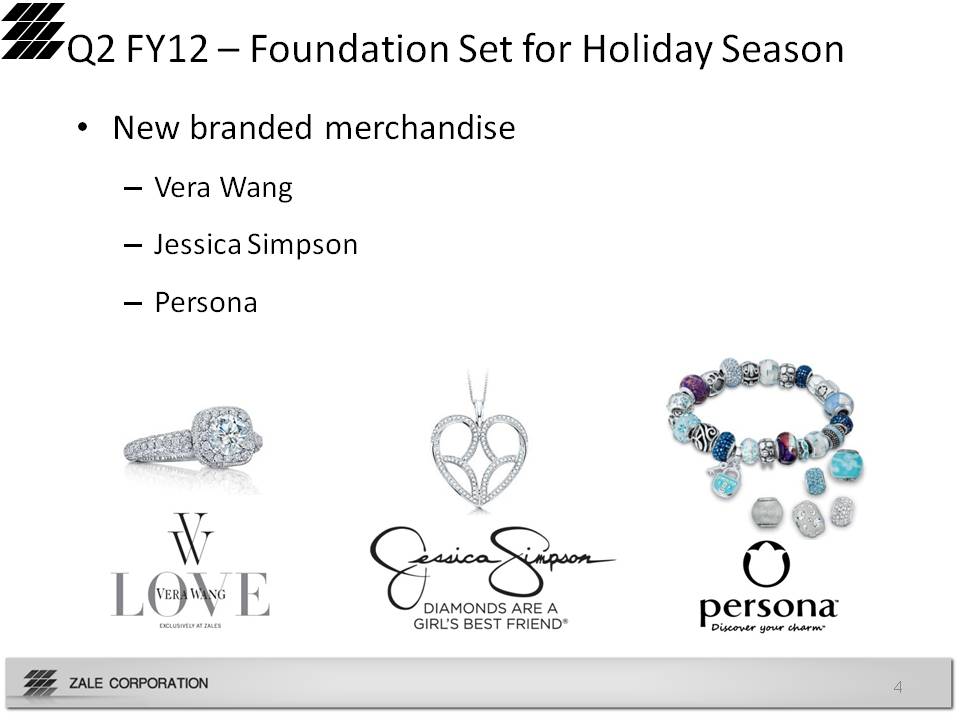
Q2 FY12 – Foundation Set for Holiday Season New branded merchandise Vera Wang Jessica Simpson Persona
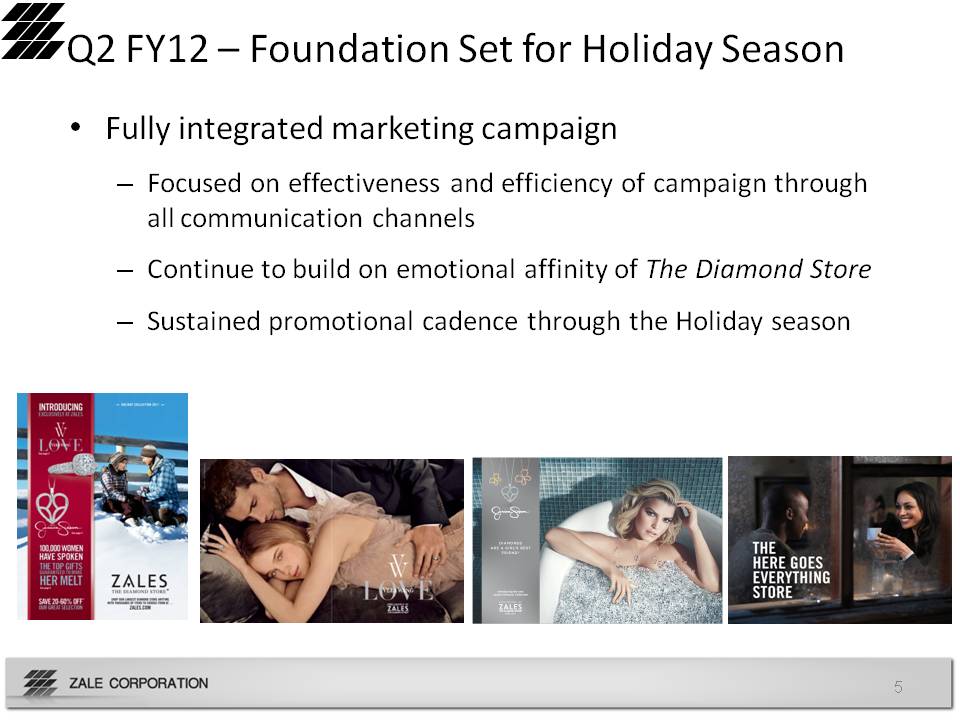
Q2 FY12 – Foundation Set for Holiday Season Fully integrated marketing campaign Focused on effectiveness and efficiency of campaign through all communication channels Continue to build on emotional affinity of The Diamond Store Sustained promotional cadence through the Holiday season
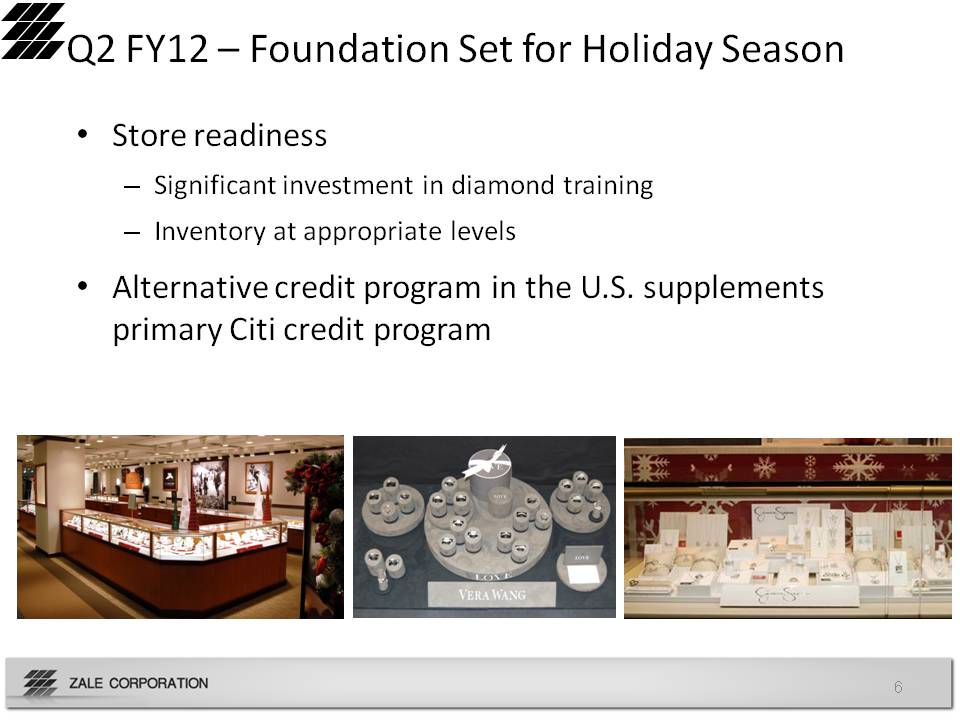
Q2 FY12 – Foundation Set for Holiday Season Store readiness Significant investment in diamond training Inventory at appropriate levels Alternative credit program in the U.S. supplements primary Citi credit program
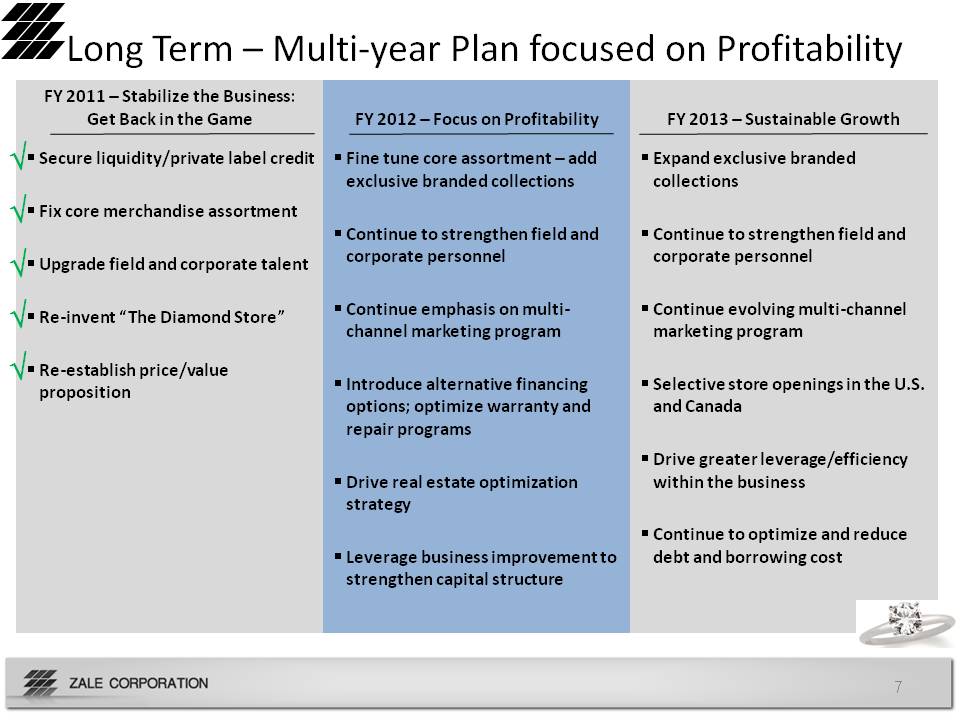
Long Term – Multi-year Plan focused on Profitability FY 2011 – Stabilize the Business: Get Back in the Game Secure liquidity/private label credit Fix core merchandise assortment Upgrade field and corporate talent Re-invent “The Diamond Store” Re-establish price/value proposition FY 2012 – Focus on Profitability Fine tune core assortment – add exclusive branded collections Continue to strengthen field and corporate personnel Continue emphasis on multi-channel marketing program Introduce alternative financing options; optimize warranty and repair programs Drive real estate optimization strategy Leverage business improvement to strengthen capital structure FY 2013 – Sustainable Growth Expand exclusive branded collections Continue to strengthen field and corporate personnel Continue evolving multi-channel marketing program Selective store openings in the U.S. and Canada Drive greater leverage/efficiency within the business Continue to optimize and reduce debt and borrowing cost
Change in Warranty Revenue Recognition Background In October 2006, we began selling lifetime warranties on fine jewelry, replacing a 2-year warranty offering ASC 605-20, Revenue Recognition – Services, requires companies to recognize warranty revenue on a straight-line basis until sufficient cost history exists On our 2-year warranties, revenue was recognized in proportion to costs incurred, but we had insufficient cost history to do so on lifetime warranties Lifetime warranty revenue was recognized on a 5-year, straight-line basis as we tracked associated costs We now have sufficient cost history and are required to recognize revenue in proportion to costs incurred on our lifetime warranties Estimated 8-year life versus prior 5-year life Costs are heavily weighted in the first two years ramp down quickly over next 6 years
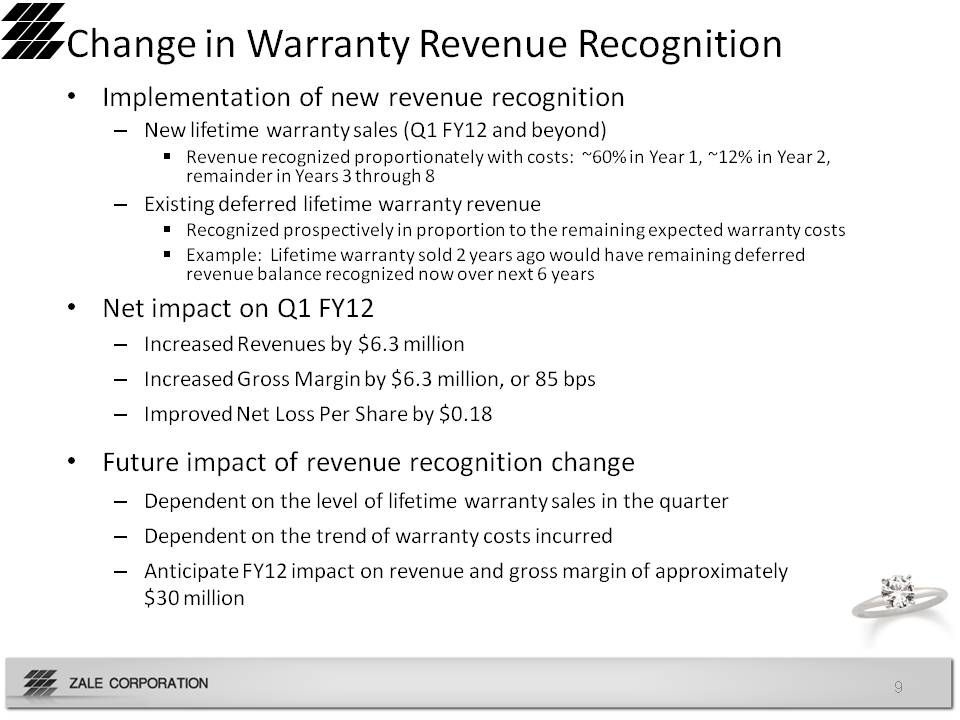
Change in Warranty Revenue Recognition Implementation of new revenue recognition New lifetime warranty sales (Q1 FY12 and beyond) Revenue recognized proportionately with costs: ~60% in Year 1, ~12% in Year 2, remainder in Years 3 through 8 Existing deferred lifetime warranty revenue Recognized prospectively in proportion to the remaining expected warranty costs Example: Lifetime warranty sold 2 years ago would have remaining deferred revenue balance recognized now over next 6 years Net impact on Q1 FY12 Increased Revenues by $6.3 million Increased Gross Margin by $6.3 million, or 85 bps Improved Net Loss Per Share by $0.18 Future impact of revenue recognition change Dependent on the level of lifetime warranty sales in the quarter Dependent on the trend of warranty costs incurred Anticipate FY12 impact on revenue and gross margin of approximately $30 million
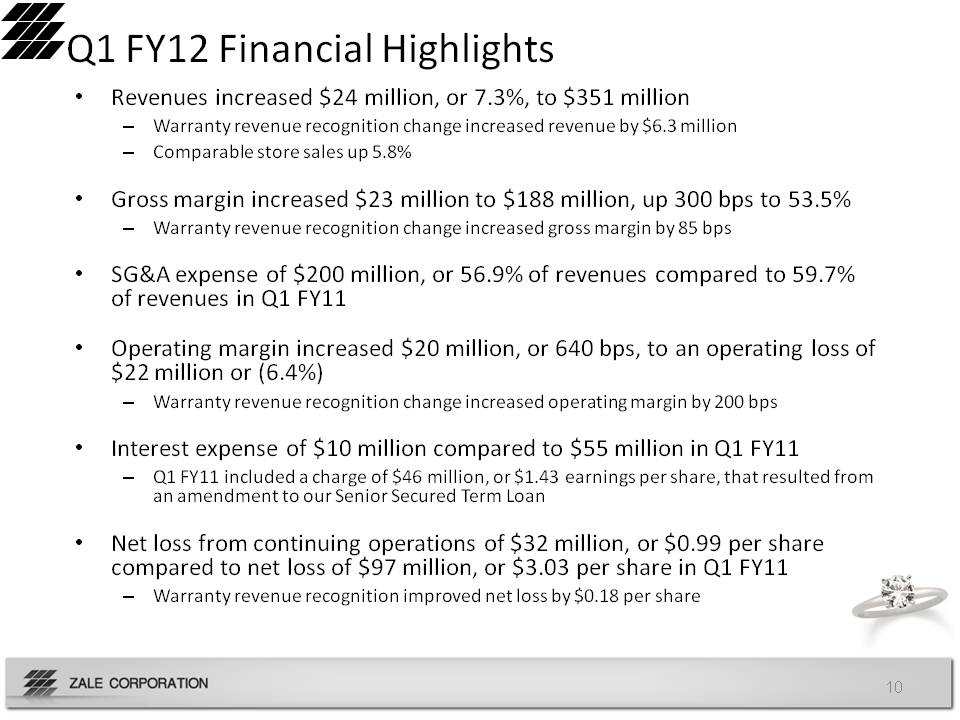
Q1 FY12 Financial Highlights Revenues increased $24 million, or 7.3%, to $351 million Warranty revenue recognition change increased revenue by $6.3 million Comparable store sales up 5.8% Gross margin increased $23 million to $188 million, up 300 bps to 53.5% Warranty revenue recognition change increased gross margin by 85 bps SG&A expense of $200 million, or 56.9% of revenues compared to 59.7% of revenues in Q1 FY11 Operating margin increased $20 million, or 640 bps, to an operating loss of $22 million or (6.4%) Warranty revenue recognition change increased operating margin by 200 bps Interest expense of $10 million compared to $55 million in Q1 FY11 Q1 FY11 included a charge of $46 million, or $1.43 earnings per share, that resulted from an amendment to our Senior Secured Term Loan Net loss from continuing operations of $32 million, or $0.99 per share compared to net loss of $97 million, or $3.03 per share in Q1 FY11 Warranty revenue recognition improved net loss by $0.18 per share
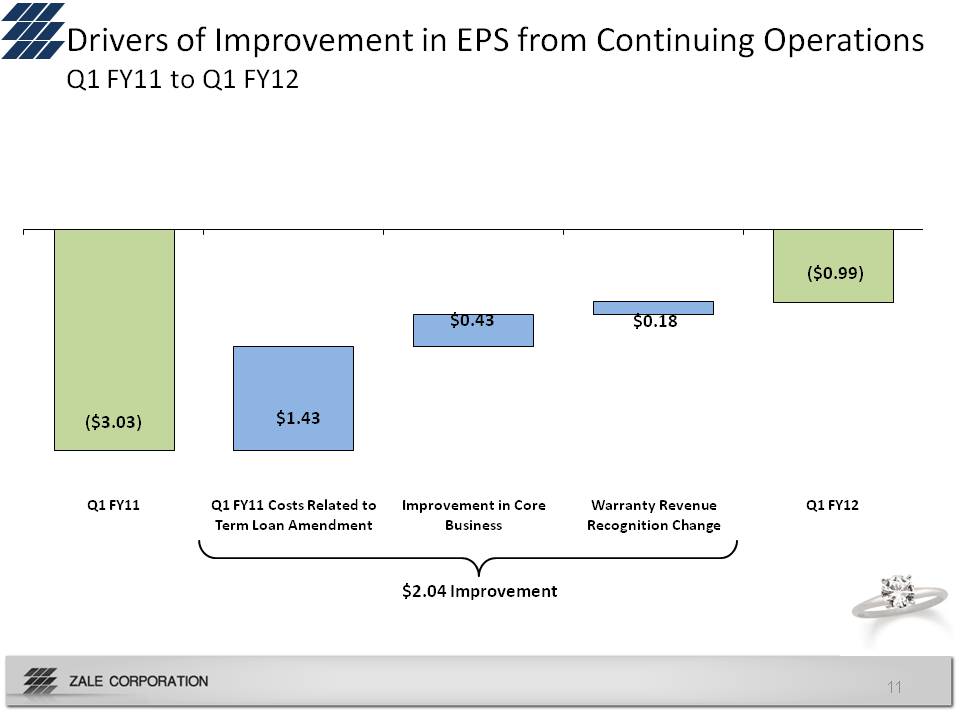
Drivers of Improvement in EPS from Continuing Operations Q1 FY11 to Q1 FY12 $2.04 Improvement ($3.03) Q1 FY11 $1.43 Q1 FY11 Costs Related to Term Loan Amendment $0.43 Improvement in Core Business $0.18 Warranty Revenue Recognition Change ($0.99) Q1 FY12
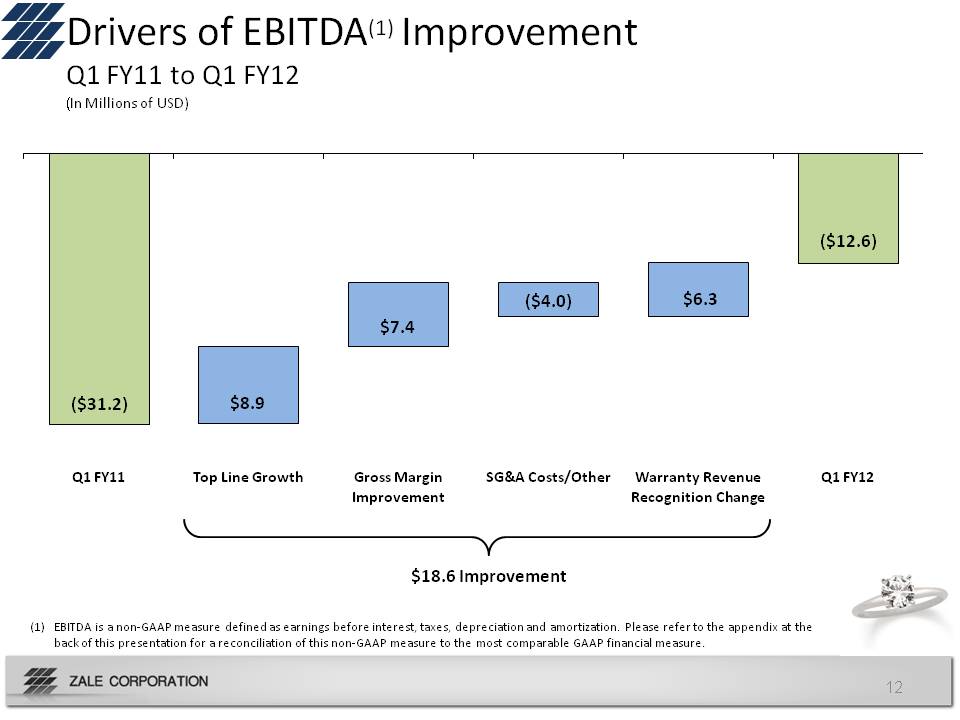
Drivers of EBITDA (1) Improvement Q1 FY11 to Q1 FY12 $18.6 Improvement (In Millions of USD) (1) EBITDA is a non-GAAP measure defined as earnings before interest, taxes, depreciation and amortization. Please refer to the appendix at the back of this presentation for a reconciliation of this non-GAAP measure to the most comparable GAAP financial measure. ($31.2) Q1 FY11 $8.9 Top Line Growth $7.4 Gross Margin Improvement ($4.0) SG&A Costs/Other $6.3 Warranty Revenue Recognition Change ($12.6) Q1 FY12
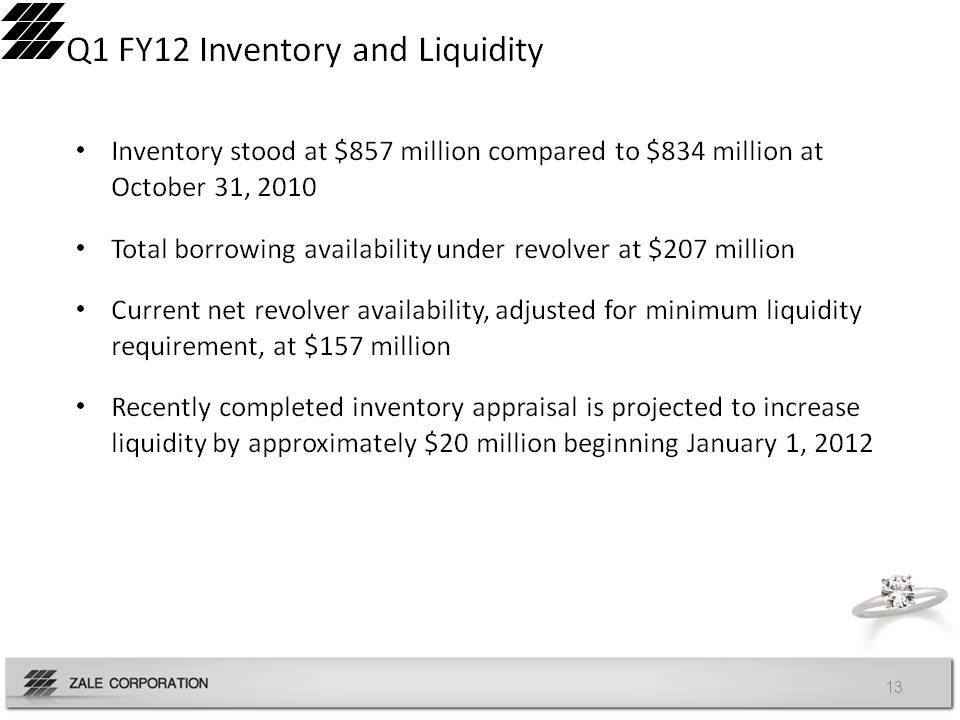
Q1 FY12 Inventory and Liquidity Inventory stood at $857 million compared to $834 million at October 31, 2010 Total borrowing availability under revolver at $207 million Current net revolver availability, adjusted for minimum liquidity requirement, at $157 million Recently completed inventory appraisal is projected to increase liquidity by approximately $20 million beginning January 1, 2012
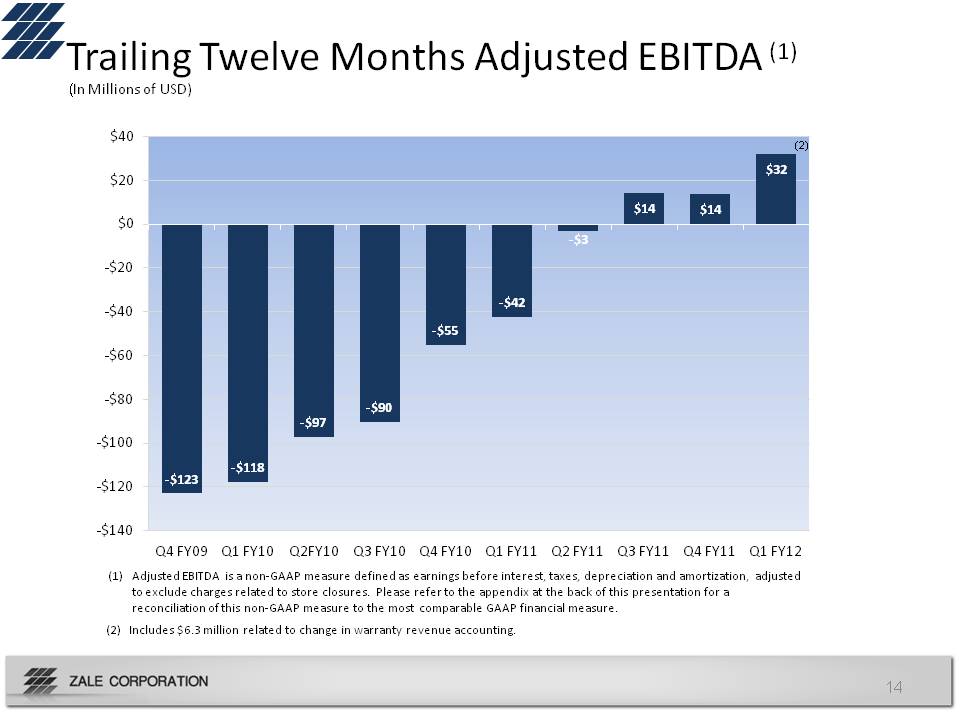
Trailing Twelve Months Adjusted EBITDA (1) Adjusted EBITDA is a non-GAAP measure defined as earnings before interest, taxes, depreciation and amortization, adjusted to exclude charges related to store closures. Please refer to the appendix at the back of this presentation for a reconciliation of this non-GAAP measure to the most comparable GAAP financial measure. (2) Includes $6.3 million related to change in warranty revenue accounting. (In Millions of USD) $40 $20 $0 -$20 -$40 -$60 -$80 -$100 -$120 -$140 Q4 FY09 Q1 FY10 Q2 Q3 FY11 FY12 -$123 -$118 -$97 -$90 -$55 -$42 -$3 $14 $32
Appendix
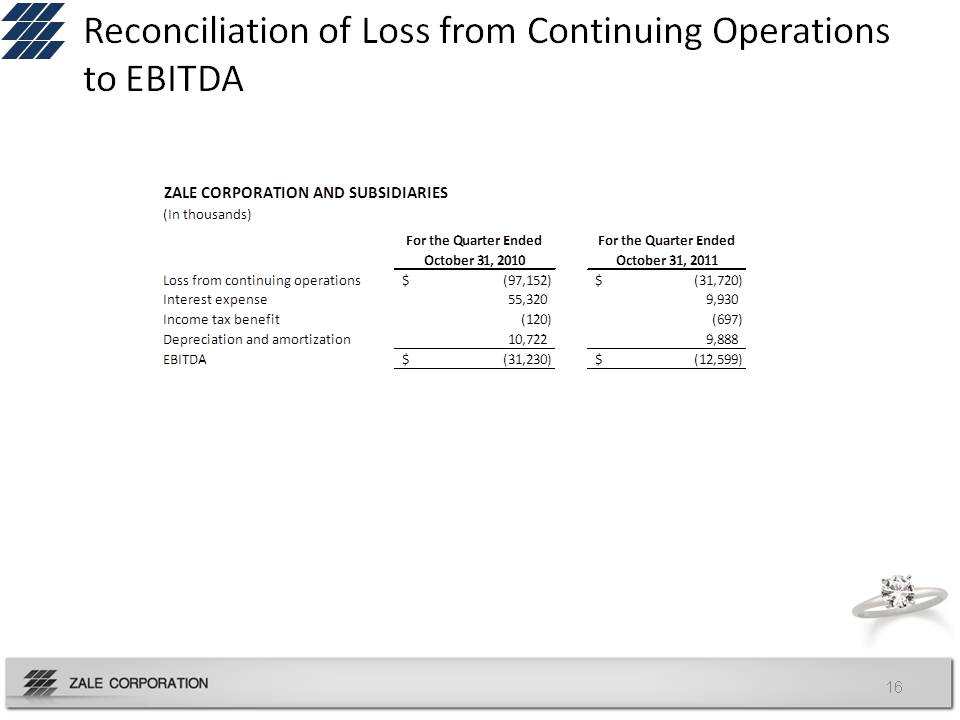
Reconciliation of Loss from Continuing Operations to EBITDA Zale Corporation and subsidiaries (in thousands) for the quarter ended October 31, 2010 2011 loss from continuing operations $ (97,152) (31,720) interest expense 55,320 9,930 income tax benefit (120) (697) depreciation and amortization 10,722 9,888 (31,230) (12,599)
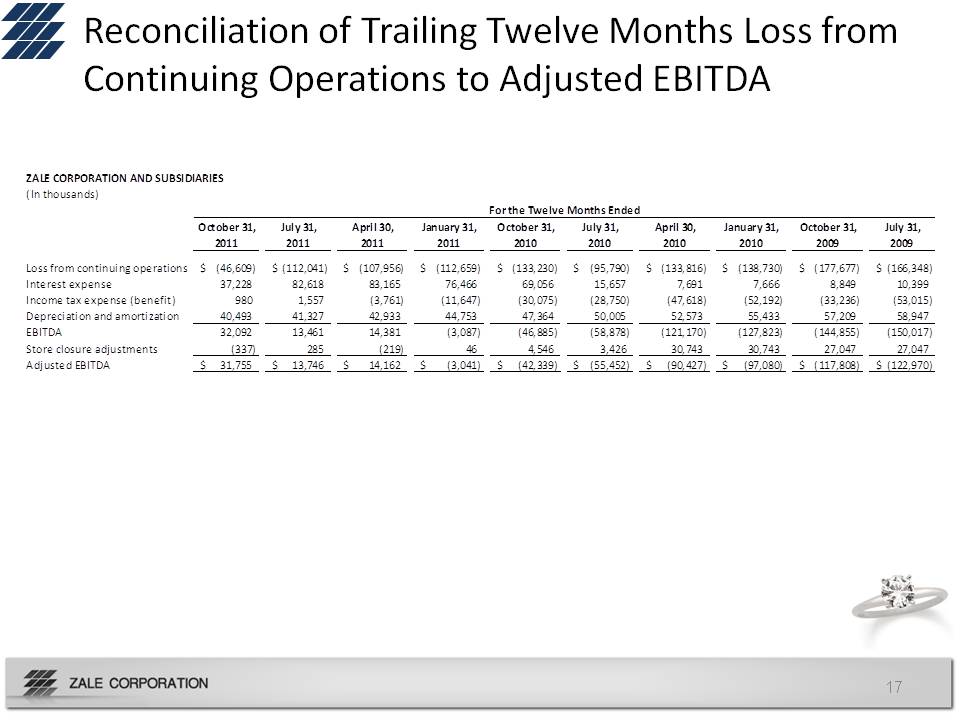
Reconciliation of Trailing Twelve Months Loss from Continuing Operations to Adjusted EBITDA Zale Corporation and subsidiaries (in thousands) for the twelve months ended October 31, 2011 july 31, 2011 april 30, 2011 january 31, 2011 2010 2009 loss from continuing operations interest expense income tax benefit depreciation and amortization store closure adjustments
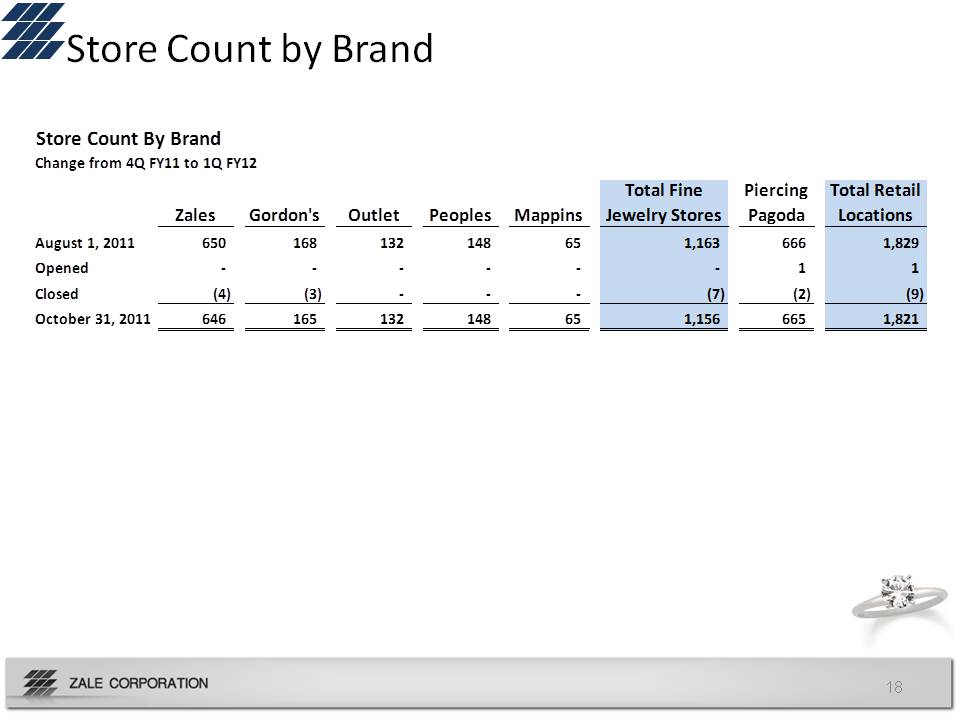
Store Count by Brand August 1, 2011 opened closed October 31, 2011 zales 650 – (4) 646 Gordon’s 168 (3) 165 Outlet 132 Peoples 148 Mappins 65 Total Fine Jewelry Stores 1,163 (7) 1,156 Piercing Pagoda 666 1 (2) 665 Total Retail Locations 1,829 1 (9) 1,821