Attached files
| file | filename |
|---|---|
| 8-K - FORM 8-K - Argo Group International Holdings, Ltd. | d256821d8k.htm |
 Investor Presentation
November 2011
Exhibit 99.1
Jay S. Bullock, CFO |
 2.
Forward-Looking Statements
This presentation contains “forward-looking statements” which are made pursuant to the
safe harbor provisions of the Private Securities Litigation Reform Act of 1995. The
forward-looking statements are based on the Company's current expectations and beliefs
concerning future developments and their potential effects on the Company. There can be no
assurance that actual developments will be those anticipated by the Company. Actual results may
differ materially from those projected as a result of significant risks and uncertainties,
including non-receipt of the expected payments, changes in interest rates, effect of the
performance of financial markets on investment income and fair values of investments,
development of claims and the effect on loss reserves, accuracy in projecting loss reserves the
impact of competition and pricing environments, changes in the demand for the Company's products,
the effect of general economic conditions, adverse state and federal legislation, regulations and
regulatory investigations into industry practices, developments relating to existing
agreements, heightened competition, changes in pricing environments, and changes in asset
valuations. The Company undertakes no obligation to publicly update any forward-looking
statements as a result of events or developments subsequent to the presentation. |
 Argo
Group – About Us
International Specialty Underwriter of P&C Insurance
and Reinsurance Risks
•
Business
platform
is
comprised
of
four
distinct
businesses;
Each
fully
accountable
•
International platform supports corporate objectives of growth, profitability
and diversification.
First and Foremost an Underwriting Company
•
Five-year (2006-10) average combined ratio of 98.7% vs. 99.4%
(industry) Solid Financial Strength (Balance Sheet)
•
Rated ‘A’
(Excellent) by A.M. Best (Class Size XII)¹
•
Conservatively capitalized/modest use of financial leverage
1
Argo P/C Insurance & reinsurance operations
3. |
 Argo
Group - A Compelling Valuation
Current stock price doesn’t reflect strength of balance sheet
•
AGII’s stock price trading at approximately 60% of book value
(11/15/11) Balance sheet characteristics:
•
Adequately reserved
•
Excellent asset quality
•
Average rating of fixed maturity portfolio is ‘AA’.
•
Exposure to questionable sovereigns is immaterial
•
Average rating of reinsurance recoverable balances is ‘A’
•
Intangibles and goodwill less than 4% of total assets.
•
Use of financial leverage is modest at 20.5% (9/30/11)
Management an active buyer of the stock
4. |
 Our
Strategy •
Become a recognized worldwide leader of custom insurance and
reinsurance solutions for our clients
•
Create a competitive advantage through superior customer service,
product innovation and underwriting knowledge
•
Achieve profitable growth organically and/or through opportunistic
acquisitions throughout the cycle
•
Manage capital and risk appropriately / maintain strong ratings
•
Hire top tier talent to support our strategy
5.
Maximize shareholder value through growth in book value per share
|
 BVPS Growth Since 2002
Our Track Record:
6.
$23.40
$27.22
$30.36
$33.52
$39.08
$45.15
$44.18
$52.36
$58.41
$54.85
2002
2003
2004
2005
2006
2007
2008
2009
2010
2011-
Q3
*Book value
per
common
share
-
outstanding,
includes
the
impact
of
the
Series
A
Mandatory
Convertible
Preferred
Stock
on
an
as
if
converted
basis. Preferred stock had fully converted into common shares as of Dec. 31,
2007. 10.2%
CAGR
Maximizing Shareholder Value |
 Commercial Specialty Segment
Pre-Tax Operating
Income and Combined Ratio
7.
About Us
•
Designs customized commercial insurance
programs for grocers, fabricare, restaurants
and other specialty retail clients
•
2
nd
largest provider of commercial insurance
to small and midsize U.S. public entities
•
2
nd
largest provider of commercial insurance
to the coal mine industry
•
Distributes products direct, through
wholesalers and independent agents
NWP by Business Unit
$10.8
$12.7
$19.3
$35.9
$50.4
$61.3
$43.0
$45.8
$29.0
$17.7
($8.1)
104.0%
98.4%
96.8%
92.5%
89.4%
88.6%
96.5%
95.6%
99.0%
100.9%
111.0%
80.0%
90.0%
100.0%
110.0%
120.0%
($10.0)
$10.0
$30.0
$50.0
$70.0
2002
2003
2004
2005
2006
2007
2008
2009
2010
9 Months
2010
9 Months
2011
Argo Insurance US
Retail
27%
Alteris
41%
Rockwood
20%
Argo Surety
5%
Commercial Programs
5%
Involuntary
2%
($mm) |
 NWP
By Business Unit About Us
Excess & Surplus Lines Segment
8.
Pre-Tax Operating
Income and Combined Ratio
•
A leader in the U.S. Excess & Surplus lines
market
•
Strong relationships with national,
local and regional wholesale brokers
•
Target market is non-standard
(hard-to-place) risks
•
U/W expertise is a competitive advantage
$18.5
$41.1
$36.9
$57.7
$101.4
$112.7
$98.3
$64.7
$62.7
$43.5
$40.8
94.7%
91.1%
94.8%
92.6%
88.9%
89.3%
93.3%
99.6%
97.8%
98.7%
98.6%
80.0%
90.0%
100.0%
110.0%
120.0%
$0.0
$20.0
$40.0
$60.0
$80.0
$100.0
$120.0
2002
2003
2004
2005
2006
2007
2008
2009
2010
9 Months
2010
9 Months
2011
Casualty
26%
Transportation
21%
Property
4%
Contract
28%
Environmental
3%
Allied Medical
6%
E&O
4%
Professinoal
7%
($mm) |
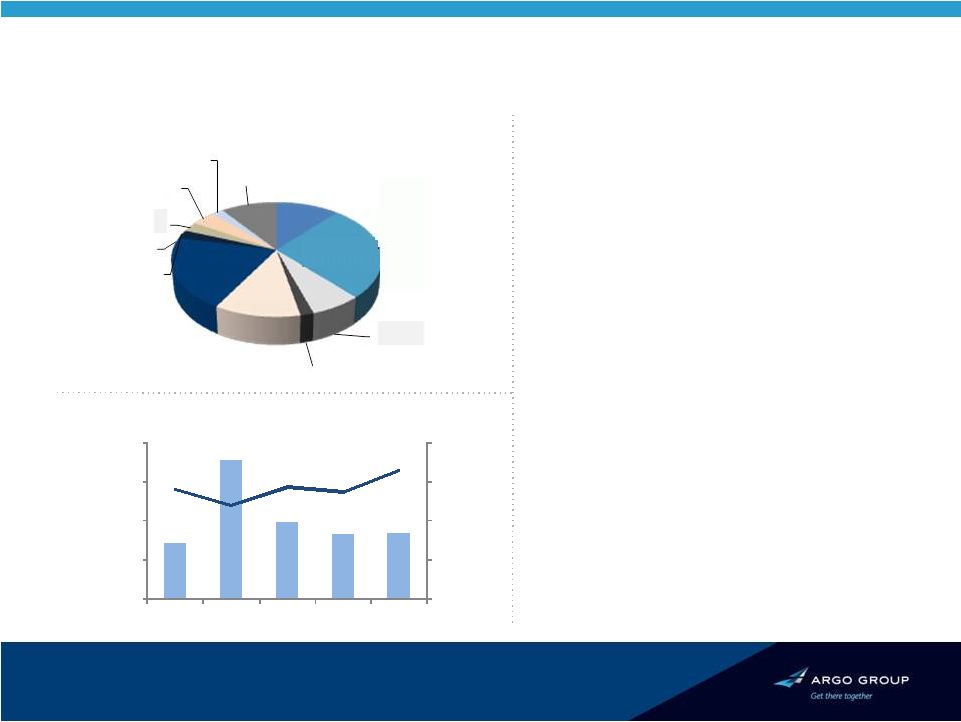 Syndicate 1200
About Us
9.
NWP by Line of Business
Established multi-class platform at
Lloyds of London
Primary classes of business include:
•
Property (Facultative, Binders)
•
Specialty (Energy, Yachts & Hull)
•
Liability (Professional Indemnity, GL)
•
Aerospace (Aviation, Space)
Lloyd’s market ratings:
•
‘A’
(Excellent) by A.M. Best
•
‘A+’
(Strong) by S&P
GWP
($mm)
and
Combined
Ratio
Energy, 11.4%
Prop FAC, 27.0%
GL, 6.8%
D&O, 1.8%
PA, 11.3%
Property Binders,
18.0%
REO & MI, 2.3%
Transportation, 2.4%
Marine Cargo, 2.8%
Int'l Prop Treaty,
4.2%
Aerospace, 2.0%
Other Liability,
10.1%
$282.9
$706.0
$389.9
$329.6
$335.7
112.3%
95.8%
115.3%
109.5%
132.0%
0.0%
40.0%
80.0%
120.0%
160.0%
$0.0
$200.0
$400.0
$600.0
$800.0
2008
2009
2010
9 Months 9 Months
2010
2011 |
 International Specialty
About Us
Gross Written Premium ($mm)
10.
NWP by Line of Business
Operating
Income
($mm)
and
Combined
Ratio
•
Underwrites property CAT, property per
risk and proportional property treaty
reinsurance worldwide & excess casualty
•
A platform for international expansion:
•
Established regional office in Dubai
•
Establishing operations in Brazil
•
Establishing operations in Euro zone
•
Distributes through brokers
Property CAT
68%
Property XOL
22%
Casualty
7%
Professional
3%
$0.8
$8.1
$23.6
$50.3
$32.0
$23.0
($64.6)
82.1%
86.1%
77.9%
52.3%
72.8%
74.1%
192.6%
0.0%
50.0%
100.0%
150.0%
200.0%
250.0%
($80.0)
($60.0)
($40.0)
($20.0)
$0.0
$20.0
$40.0
$60.0
2006
2007
2008
2009
2010
9
Months Months
2010
9
2011
$11.1
$34.3
$126.4
$162.9
$188.9
$168.0
$176.0
$0.0
$50.0
$100.0
$150.0
$200.0
2006
2007
2008
2009
2010
9
Months
2010
9
Months
2011 |
 Argo Group Q3 2011 Financial Highlights
CONSOLIDATED GAAP VIEW
Gross written premium up 12.6% in the quarter
•
Reflects new product initiatives at our Lloyds (Syndicate 1200) platform
•
Pushing hard for rate increases with mixed results; market still
competitive
Modest pre-tax loss of $6.1 million in the quarter; Reflects
•
CATS, net of reinstatement premium of $26.7 million
•
Losses on aggregate reinsurance covers of approximately $10 million
•
A&E reserves were strengthened by $9.7 million
Repurchased $17 million of AGII shares in the quarter.
•
Year-to-date share repurchase activity was $36.9 million
•
Year to date, paid $10 million of dividends to shareholders
11. |
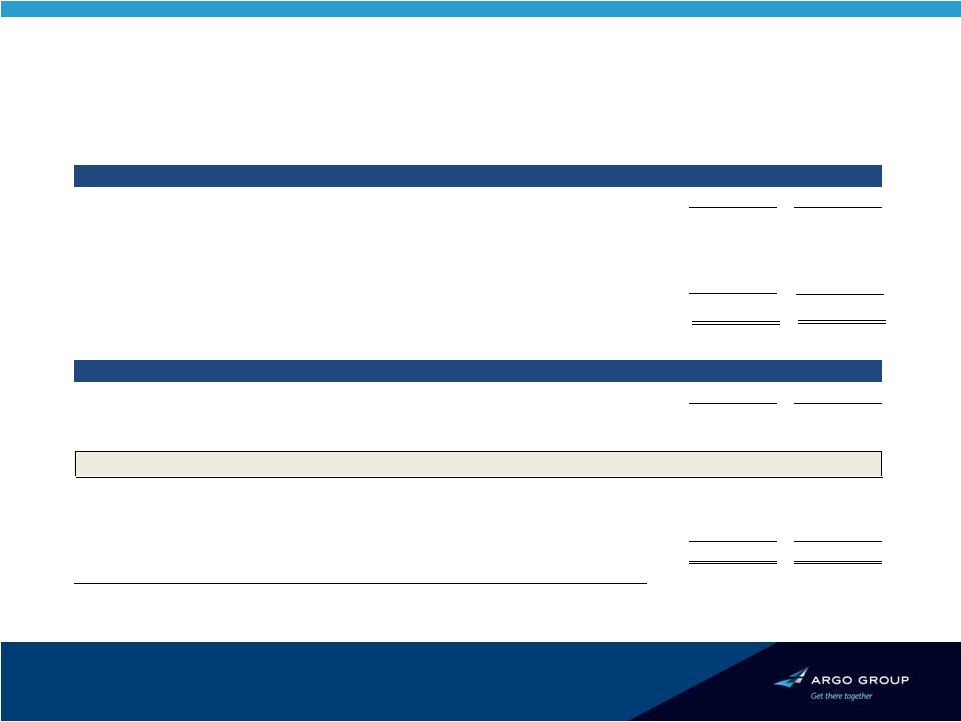
 Q3’2011 Financial Highlights
CONSOLIDATED GAAP VIEW
12.
($ in millions)
Operating Income
Q3'11
Q3'10
Adjusted Operating Income Before Taxes
1,2
$20.2
$35.5
-
CATs, Net of Estimated Reinstatement Premium
(26.7)
(12.8)
(10.0)
0.0
-
Prior Year Reserve Development Favorable / (Unfavorable)
4.6
3.0
Operating Income (Loss) Before Taxes
²
($11.9)
$25.7
Combined Ratio
Q3'11
Q3'10
Adjusted Loss Ratio
¹
62.5%
57.8%
Expense Ratio
39.6%
40.1%
Adjusted Combined Ratio
¹
102.1%
97.9%
-
CATs, Net of Estimated Reinstatement Premium
10.0%
4.4%
3.7%
0.0%
-
Prior Year Reserve Development (Favorable) / Unfavorable
-1.7%
(1.0%)
Total Combined Ratio
114.1%
101.3%
1
Results presented before CATs, losses on aggregate reinsurance covers and prior
year development. 2
Excludes realized capital gains/losses and foreign exchange gains/losses.
-
Estimated Losses on Aggregate Reinsurance Covers
-
Estimated Losses on Aggregate Reinsurance Covers |
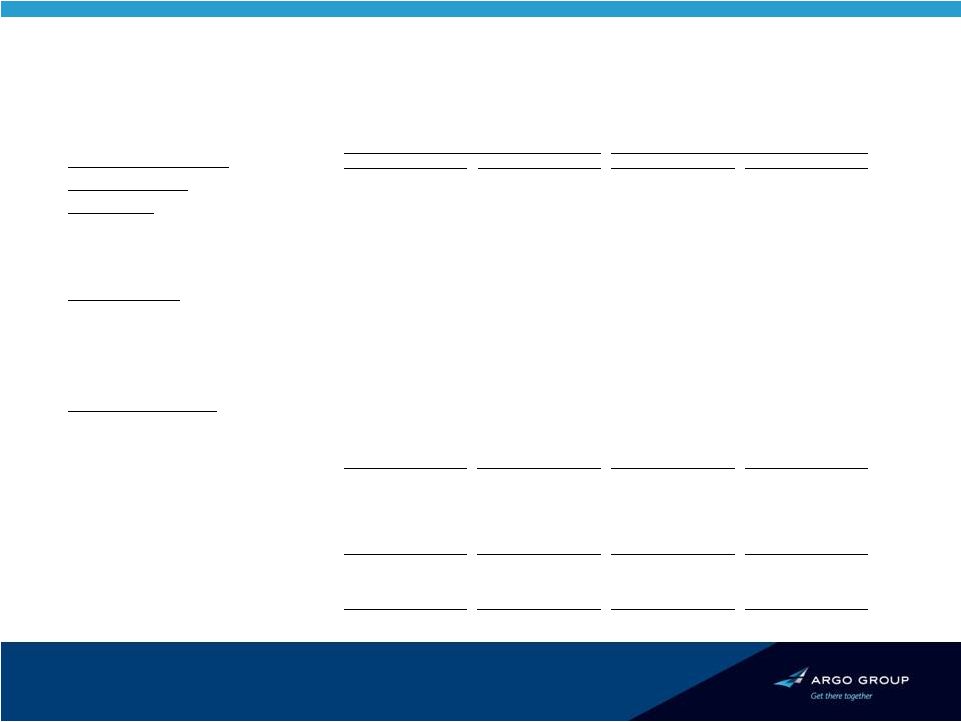
 YTD’2011 Financial Highlights
CONSOLIDATED GAAP VIEW
13.
($ in millions)
Operating Income
YTD Q3'11
YTD Q3'10
Adjusted Operating Income Before Taxes
1,2
$82.9
$86.8
-
CATs, Net of Estimated Reinstatement Premium
(171.6)
(56.6)
-
Estimated Losses on Aggregate Reinsurance Covers
(10.0)
0.0
-
Prior Year Reserve Development Favorable / (Unfavorable)
0.9
26.3
Operating Income (Loss) Before Taxes
($97.8)
$56.5
Combined Ratio
YTD Q3'11
YTD Q3'10
Adjusted Loss Ratio
1
60.4%
61.2%
Expense Ratio
39.4%
38.5%
Adjusted Combined Ratio
1
99.8%
99.7%
-
CATs, Net of Estimated Reinstatement Premium
21.4%
6.2%
-
Estimated Losses on Aggregate Reinsurance Covers
1.3%
0.0%
-
Prior Year Reserve Development (Favorable) / Unfavorable
(0.1%)
(2.8%)
Total Combined Ratio
122.4%
103.1%
1
2
Excludes realized capital gains/losses and foreign exchange gains/losses.
2
Results presented before CATs, losses on aggregate reinsurance covers and prior year development. |
  Balance Sheet
CONSOLIDATED GAAP VIEW
14.
($ millions)
September 30,
December 31,
%
2011
2010
Variance
(unaudited)
Total investments
4,180.3
$
4,215.4
$
-0.8%
Cash and cash equivalents
119.8
83.5
43.5%
Accrued investment income
31.5
33.5
(6.0%)
Receivables
1,450.9
1,505.7
(3.6%)
Goodwill and intangible assets
246.1
249.1
(1.2%)
Deferred acquisition costs
136.2
139.7
(2.5%)
Ceded unearned
premiums
227.7
164.0
38.8%
Other assets
110.2
97.6
12.9%
6,502.7
$
6,488.5
$
0.2%
Reserves for losses and loss adjustment expenses
3,349.6
$
3,152.2
$
6.3%
Unearned premiums
723.4
654.1
10.6%
Ceded reinsurance payable
429.6
524.3
(18.1%)
Debt
66.9
65.0
2.9%
Junior subordinated
debentures
311.5
311.5
0.0%
Other liabilities
155.4
155.3
0.1%
5,036.4
4,862.4
3.6%
Total shareholders' equity
1,466.3
1,626.1
(9.8%)
6,502.7
$
6,488.5
$
0.2%
Book value per common share
54.85
$
58.41
$
(6.1%)
Assets
Total assets
Liabilities and Shareholders' Equity
Total liabilities
Total liabilities and shareholders' equity |
 Investment Portfolio
CONSOLIDATED GAAP VIEW
15.
($ millions)
Sep. 30, 2011
Jun. 30, 2011
Total cash and investments
Fair Value
% of Total
Fair Value
% of Total
USD DENOMINATED:
Fixed maturities
U.S. Governments
$516.9
12.0%
$440.7
10.2%
Non-U.S. Governments
43.2
1.0%
35.9
0.8%
Obligations of states and political subdivisions
625.3
14.5%
617.4
14.4%
Corporate securities
980.2
22.8%
1,031.8
24.0%
Structured securities
CMO/MBS-agency
558.7
13.0%
562.4
13.1%
CMO/MBS-non agency
20.7
0.5%
34.7
0.8%
CMBS
113.4
2.6%
184.1
4.3%
ABS-residential
14.5
0.3%
15.5
0.4%
ABS-non residential
71.4
1.7%
81.7
1.9%
FOREIGN DENOMINATED:
Governments
220.4
5.1%
208.0
4.8%
Credit
94.3
2.2%
100.7
2.3%
Total Fixed maturities
$3,259.0
75.8%
$3,312.9
77.0%
Equity securities
$353.1
8.2%
$375.9
8.7%
Other investments
214.1
5.0%
226.1
5.3%
Short-term investments
354.1
8.2%
384.0
8.9%
Total investments
$4,180.3
97.2%
$4,298.9
100.0%
Cash and cash equivalents
119.8
2.8%
49.0
1.1%
Total cash and investments
$4,300.1
100.0%
$4,347.9
101.1% |
 Argo Group -
Recap of Major Highlights
•
International platform supports diversification & future growth strategy
•
Underwriting focus & talent are key competitive advantages
Management committed to maximizing shareholder value
•
Achieved double digit book value per share growth since 2002
•
Quality of capital and balance sheet is excellent
•
Will continue to repatriate capital as appropriate
16.
•
U.S. and international platforms well-positioned to take advantage of a
Argo is an established carrier in the international
specialty insurance and reinsurance markets.
hardening market |
 |