Attached files
| file | filename |
|---|---|
| EXCEL - IDEA: XBRL DOCUMENT - China Premium Lifestyle Enterprise, Inc. | Financial_Report.xls |
| EX-31.1 - EXHIBIT 31.1 - China Premium Lifestyle Enterprise, Inc. | v237374_ex31-1.htm |
| EX-31.2 - EXHIBIT 31.2 - China Premium Lifestyle Enterprise, Inc. | v237374_ex31-2.htm |
| EX-32.1 - EXHIBIT 32.1 - China Premium Lifestyle Enterprise, Inc. | v237374_ex32-1.htm |
UNITED STATES
SECURITIES AND EXCHANGE COMMISSION
Washington, D.C. 20549
FORM 10-Q
|
x
|
QUARTERLY REPORT PURSUANT TO SECTION 13 OR 15(d) OF THE SECURITIES EXCHANGE ACT OF 1934
|
For the quarterly period ended: September 30, 2011
or
|
¨
|
TRANSITION REPORT PURSUANT TO SECTION 13 OR 15(d) OF THE SECURITIES EXCHANGE ACT OF 1934
|
For the transition period from ______________ to ______________
Commission File No. 333-120807
CHINA PREMIUM LIFESTYLE ENTERPRISE, INC.
(Exact name of Registrant as specified in its charter)
|
Nevada
|
11-3718650
|
|
|
(State or other jurisdiction of incorporation or organization)
|
(IRS Employer Identification No.)
|
28/F, King Palace Plaza
No. 52A Sha Tsui Road
Tsuen Wan, N.T. Hong Kong
(Address of principal executive offices)
(+852) 2954-2469
(Registrant’s telephone number, including area code)
Indicate by check mark whether the registrant (1) has filed all reports required to be filed by Section 13 or 15(d) of the Securities Exchange Act of 1934 during the preceding 12 months (or for such shorter period that the registrant was required to file such reports) and (2) has been subject to such filing requirements for the past 90 days.
Yes x No ¨
Indicate by check mark whether the registrant has submitted electronically and posted on its corporate Web site, if any, every Interactive Data File required to be submitted and posted pursuant to Rule 405 of Regulation S-T (§232.405 of this chapter) during the preceding 12 months (or for such shorter period that the registrant was required to submit and post such files). Yes x No ¨
Indicate by check mark whether the registrant is a large accelerated filer, an accelerated filer, or a non-accelerated filer. (See the definitions of “accelerated filer” and “large accelerated filer” in Rule 12b-2 of the Exchange Act):
|
Accelerated Filer ¨
|
Non-Accelerated Filer ¨
|
Smaller Reporting Company x
|
|
|
(Do not check if a smaller reporting company)
|
Indicate by check mark whether the registrant is a shell company (as defined in Rule 12b-2 of the Exchange Act).
Yes ¨ No x
The number of shares of Common Stock, $0.005 par value, outstanding as of the close of business on November 4, 2011 was 24,534,492.
FORM 10-Q
FOR THE QUARTERLY PERIOD ENDED SEPTEMBER 30, 2011
TABLE OF CONTENTS
|
Page
|
||
|
PART I: FINANCIAL INFORMATION
|
||
|
Item 1.
|
Financial Statements
|
4
|
|
Item 2.
|
Management’s Discussion and Analysis of Financial Condition and Results of Operations
|
21
|
|
Item 3.
|
Quantitative and Qualitative Disclosures about Market Risk
|
33
|
|
Item 4.
|
Controls and Procedures
|
34
|
|
PART II: OTHER INFORMATION
|
||
|
Item 1.
|
Legal Proceedings
|
35
|
|
Item 1A.
|
Risk Factors
|
35
|
|
Item 2.
|
Unregistered Sales of Equity Securities and Use of Proceeds
|
36
|
|
Item 3.
|
Defaults Upon Senior Securities
|
36
|
|
Item 4.
|
(Removed and Reserved)
|
36
|
|
Item 5.
|
Other information
|
36
|
|
Item 6.
|
Exhibits
|
37
|
|
SIGNATURES
|
38 | |
2
Explanatory Note
Pursuant to Item 10(f) of Regulation S-K promulgated under the Securities Act of 1933, as amended, except as otherwise indicated, we have elected to comply throughout this Quarterly Report on Form 10-Q with the scaled disclosure requirements applicable to “smaller reporting companies”. In this Quarterly Report, unless otherwise stated or the context otherwise requires, the terms “we”, “us”, “our” and “the Company” refer to China Premium Lifestyle Enterprise, Inc. and our consolidated subsidiaries taken together as a whole.
3
Item 1. Financial Statements
|
CONDENSED CONSOLIDATED BALANCE SHEETS (UNAUDITED)
|
|
September 30, 2011
(unaudited)
|
December 31,
2010 |
|||||||
|
ASSETS
|
||||||||
|
Current assets:
|
||||||||
|
Cash and cash equivalents
|
$ | 650,214 | $ | 8,109,615 | ||||
|
Restricted cash
|
8,378,435 | 4,385,194 | ||||||
|
Trade receivables, net of provision
|
6,052,890 | 9,225,164 | ||||||
|
Inventory, net
|
25,138,626 | 16,404,070 | ||||||
|
Prepayments
|
579,522 | 956,252 | ||||||
|
Other current assets
|
5,877,089 | 4,014,367 | ||||||
|
Amounts due from affiliates
|
11,550,881 | 16,619,177 | ||||||
|
Total current assets
|
58,227,657 | 59,713,839 | ||||||
|
Property and equipment, net
|
6,121,191 | 6,047,164 | ||||||
|
Goodwill
|
39,511 | 39,562 | ||||||
|
TOTAL ASSETS
|
$ | 64,388,359 | $ | 65,800,565 | ||||
|
LIABILITIES AND STOCKHOLDERS’ EQUITY
|
||||||||
|
Current liabilities:
|
||||||||
|
Short-term borrowings
|
$ | 21,324,028 | $ | 13,330,946 | ||||
|
Bills payable
|
- | 428,416 | ||||||
|
Trade payables
|
4,813,192 | 9,783,248 | ||||||
|
Deposits received
|
24,910,839 | 23,832,490 | ||||||
|
Other current liabilities
|
3,302,396 | 5,257,169 | ||||||
|
Amounts due to affiliates
|
3,884,620 | 7,752,111 | ||||||
|
Total current liabilities
|
58,235,075 | 60,384,380 | ||||||
|
Long-term borrowing
|
- | 409,449 | ||||||
|
TOTAL LIABILITIES
|
58,235,075 | 60,793,829 | ||||||
|
Commitments and Contingencies
|
||||||||
|
Stockholders' equity
|
||||||||
|
Common stock
|
||||||||
|
Authorized: 100,000,000 common stock, par value $0.005
|
||||||||
|
Issued and outstanding: 24,534,492 shares as at September 30, 2011; (24,534,491 shares as at December 31, 2010)
|
122,672 | 122,672 | ||||||
|
Additional paid-in-capital
|
4,113,055 | 4,113,055 | ||||||
|
Accumulated other comprehensive income
|
397,415 | 335,139 | ||||||
|
Accumulated deficit
|
(6,095,788 | ) | (6,414,586 | ) | ||||
|
TOTAL CHINA PREMIUM LIFESTYLE ENTERPRISE, INC. STOCKHOLDERS’ DEFICIT
|
(1,462,646 | ) | (1,843,720 | ) | ||||
|
Noncontrolling interests
|
7,615,930 | 6,850,456 | ||||||
|
TOTAL EQUITY
|
6,153,284 | 5,006,736 | ||||||
|
TOTAL LIABILITIES AND STOCKHOLDERS’ EQUITY
|
$ | 64,388,359 | $ | 65,800,565 | ||||
The accompanying notes are an integral part of these condensed consolidated financial statements (unaudited).
4
CHINA PREMIUM LIFESTYLE ENTERPRISE, INC. AND SUBSIDIARIES
CONDENSED CONSOLIDATED STATEMENTS OF OPERATIONS (UNAUDITED)
|
Three months ended
September 30,
|
Nine months ended
September 30,
|
|||||||||||||||
|
2011
|
2010
|
2011
|
2010
|
|||||||||||||
|
Sales:
|
||||||||||||||||
|
New and used vehicles
|
$ | 43,167,423 | $ | 34,494,909 | $ | 124,985,763 | $ | 89,457,083 | ||||||||
|
Parts and services and others
|
3,410,320 | 2,885,791 | 11,563,748 | 8,334,175 | ||||||||||||
|
Fashion apparel and accessories
|
- | - | - | 98 | ||||||||||||
|
Net sales
|
46,577,743 | 37,380,700 | 136,549,511 | 97,791,356 | ||||||||||||
|
Cost of sales:
|
||||||||||||||||
|
New and used vehicles
|
(39,393,254 | ) | (30,847,952 | ) | (112,990,412 | ) | (80,890,643 | ) | ||||||||
|
Parts and services and others
|
(1,320,063 | ) | (1,031,327 | ) | (4,425,931 | ) | (3,269,769 | ) | ||||||||
|
Fashion apparel and accessories
|
- | - | - | (582 | ) | |||||||||||
|
Total cost of sales
|
(40,713,317 | ) | (31,879,279 | ) | (117,416,343 | ) | (84,160,994 | ) | ||||||||
|
Gross profit:
|
||||||||||||||||
|
New and used vehicles
|
3,774,169 | 3,646,957 | 11,995,351 | 8,566,440 | ||||||||||||
|
Parts and services and others
|
2,090,257 | 1,854,464 | 7,137,817 | 5,064,406 | ||||||||||||
|
Fashion apparel and accessories
|
- | - | - | (484 | ) | |||||||||||
|
Total gross profit
|
5,864,426 | 5,501,421 | 19,133,168 | 13,630,362 | ||||||||||||
|
Selling, general and administrative expenses
|
(6,994,878 | ) | (5,210,646 | ) | (17,702,803 | ) | (14,285,184 | ) | ||||||||
|
Operating (loss) / earnings
|
(1,130,452 | ) | 290,775 | 1,430,365 | (654,822 | ) | ||||||||||
|
Other income (expenses)
|
||||||||||||||||
|
Interest expenses and other finance costs
|
(373,318 | ) | (243,879 | ) | (1,090,097 | ) | (625,355 | ) | ||||||||
|
Other (expenses) / income
|
335,995 | 235,366 | 792,684 | 1,330,442 | ||||||||||||
|
Total other income / (expenses)
|
(37,323 | ) | (8,513 | ) | (297,413 | ) | 705,087 | |||||||||
|
Earnings (loss) before income taxes
|
(1,167,775 | ) | 282,262 | 1,132,952 | 50,265 | |||||||||||
|
Provision for income taxes
|
43,622 | 1,777 | (102,586 | ) | 9,542 | |||||||||||
|
Net (loss) earnings including noncontrolling interests
|
$ | (1,124,153 | ) | $ | 284,039 | $ | 1,030,366 | $ | 59,807 | |||||||
|
Net earnings / (loss) attributable to:
|
||||||||||||||||
|
China Premium Lifestyle Enterprise, Inc.
common stockholders |
(617,884 | ) | (464 | ) | 318,798 | (604,226 | ) | |||||||||
|
Noncontrolling interests
|
(506,269 | ) | 284,503 | 711,568 | 664,033 | |||||||||||
| $ | (1,124,153 | ) | $ | 284,039 | $ | 1,030,366 | $ | 59,807 | ||||||||
|
Earnings / (loss) per common stock attributable to China Premium Lifestyle Enterprise, Inc. common stockholders
|
||||||||||||||||
|
Basic
|
$ | (0.02518 | ) | $ | (0.00002 | ) | $ | 0.01299 | $ | (0.02463 | ) | |||||
|
Diluted
|
$ | (0.02518 | ) | $ | (0.00002 | ) | $ | 0.01299 | $ | (0.02463 | ) | |||||
|
Weighted average number of common stock outstanding
|
||||||||||||||||
|
Basic
|
24,534,492 | 24,534,491 | 24,534,492 | 24,534,491 | ||||||||||||
|
Diluted
|
24,534,492 | 24,534,491 | 24,534,492 | 24,534,491 | ||||||||||||
The accompanying notes are an integral part of these condensed consolidated financial statements (unaudited).
5
CHINA PREMIUM LIFESTYLE ENTERPRISE, INC. AND SUBSIDIARIES
CONDENSED CONSOLIDATED STATEMENTS OF CASH FLOWS (UNAUDITED)
|
Nine months ended
September 30,
|
||||||||
|
2011
|
2010
|
|||||||
|
Operating activities:
|
||||||||
|
Net earnings including noncontrolling interests
|
$ | 1,030,366 | $ | 59,807 | ||||
|
Adjustments to reconcile net earnings to net cash (used in) / provided by operating activities
|
||||||||
|
Depreciation and amortization
|
1,480,581 | 1,161,756 | ||||||
|
Disposal of property and equipment
|
(92,348 | ) | 9,971 | |||||
|
Provision for bad debts written back
|
7,127 | - | ||||||
|
Provision for inventory
|
142,032 | 467,373 | ||||||
|
Other non-cash items
|
124,217 | 55,345 | ||||||
|
Changes in operating assets and liabilities:
|
||||||||
|
Trade receivables
|
3,165,147 | 2,170,921 | ||||||
|
Other current assets and prepayments
|
(1,485,992 | ) | (2,461,797 | ) | ||||
|
Inventory
|
(8,876,588 | ) | (2,136,689 | ) | ||||
|
Trade payables
|
(4,970,056 | ) | 1,608,435 | |||||
|
Other current liabilities and deposits received
|
(876,424 | ) | 442,890 | |||||
|
Net cash (used in) / provided by operating activities
|
(10,351,938 | ) | 1,378,012 | |||||
|
Investing activities:
|
||||||||
|
Purchases of property and equipment
|
(2,380,938 | ) | (2,525,527 | ) | ||||
|
Proceeds from disposal of property and equipment
|
910,694 | 1,834 | ||||||
|
(Increase) /decrease in restricted cash
|
(3,993,241 | ) | 312 | |||||
|
Net cash used in investing activities
|
(5,463,485 | ) | (2,523,381 | ) | ||||
|
Financing activities:
|
||||||||
|
Advances from affiliates
|
1,200,805 | 2,388,066 | ||||||
|
Increase / (decrease) in borrowings and bills payable
|
7,155,217 | (1,794,682 | ) | |||||
|
Net cash provided by financing activities
|
8,356,022 | 593,384 | ||||||
|
Decrease in cash and cash equivalents
|
(7,459,401 | ) | (551,985 | ) | ||||
|
Cash and cash equivalents at beginning of the period
|
8,109,615 | 3,982,214 | ||||||
|
Cash and cash equivalents at end of the period
|
$ | 650,214 | $ | 3,430,229 | ||||
|
Supplemental disclosure of cash flows information:
|
||||||||
|
Cash paid for:
|
||||||||
|
Interest
|
$ | 1,090,097 | $ | 625,355 | ||||
|
Income taxes
|
102,586 | (9,542 | ) | |||||
The accompanying notes are an integral part of these condensed consolidated financial statements (unaudited).
6
CHINA PREMIUM LIFESTYLE ENTERPRISE, INC. AND SUBSIDIARIES
NOTES TO CONDENSED CONSOLIDATED FINANCIAL STATEMENTS
NOTE 1. SUMMARY OF PRINCIPAL ACCOUNTING POLICIES
Basis of presentation
The condensed consolidated financial statements include the accounts of China Premium Lifestyle Enterprise, Inc. (the “Company”) and its subsidiaries. The condensed consolidated financial statements have been prepared in accordance with accounting principles generally accepted in the United States of America. The condensed consolidated financial statements include the accounts of the Company and all of its subsidiaries in which a controlling interest is maintained. Controlling interest is determined by the ownership of the majority voting interest or by the power to control. For those consolidated subsidiaries where our ownership is less than 100%, the other shareholders’ interests are shown as non-controlling. All significant intercompany transactions and balances have been eliminated.
The condensed consolidated financial statements are unaudited and, in our opinion, include all adjustments, consisting of normal recurring adjustments and accruals necessary for a fair representation of our condensed consolidated balance sheets, operating results, and cash flows for the periods presented. Operating results for the periods presented are not necessarily indicative of the results that may be expected for 2011. Certain information and footnote disclosures normally included in financial statements prepared in accordance with accounting principles generally accepted in the United States of America have been condensed or omitted in accordance with the rules and regulations of the Securities and Exchange Commission (the “SEC”). The condensed consolidated financial statements should be read in conjunction with the audited consolidated financial statements and accompanying notes included in the Company’s Annual Report on Form 10-K for the fiscal year ended December 31, 2010.
Use of estimates
The preparation of the condensed consolidated financial statements requires management to make estimates and assumptions that affect the reported amounts of assets and liabilities, the disclosure of contingent assets and liabilities at the date of the condensed consolidated financial statements, and the reported amounts of revenue and expenses during the reporting periods. Management makes its best estimate of the outcome for these items based on historical trends and other information available when the condensed consolidated financial statements are prepared. Changes in estimates are recognized in accordance with the accounting principles for the estimate, which is typically in the period when new information becomes available to management. Management believes the most significant estimates affecting the condensed consolidated financial statements include provision for bad debts, provision for inventory write-off, and accounting for income taxes. Actual results could differ from those estimates.
Earnings (loss) per share
Basic earnings (loss) per share is computed by dividing net operating results for the reporting period attributable to common stockholders by the weighted average number of shares of common stock outstanding during the period. Diluted earnings per share is calculated by dividing net operating results for the reporting period attributable to common stockholders by the weighted average number of shares of common stock outstanding and the dilutive effect of common stock equivalents. The computation of diluted loss per share does not assume the dilutive effect of common stock equivalents as the effect of the common stock equivalents is antidilutive.
7
Segment reporting
The Company determines and classifies its operating segments in accordance with Accounting Standard Codification (“ASC”) 280 Segment Reporting (“ASC 280”). The Company identifies and classifies its operating segments based on the nature of the products and services with similar economic characteristics. The Company’s reportable segments are: (i) motor vehicles retailing, which includes sales of new and used vehicles and provision of vehicle maintenance and repair services and sales of vehicle parts; and (ii) fashion apparel retailing, which includes sales of fashion apparel and accessories.
Fair value of financial instruments
The carrying amounts of the Company’s financial instruments including cash and cash equivalents approximate fair value due to their high liquidity in actively quoted trading markets and their short maturities. The Company’s trade receivables, trade payables and accrued liabilities approximate fair value due to their short maturities. The carrying amount of the short-term borrowings approximate fair value as this facility bears interest at a variable rate tied to the current market and has terms similar to other borrowing arrangements available to the Company.
ASC 820 Fair Value Measurements and Disclosures (“ASC 820”) defines fair value as the price that would be received from selling an asset or paid to transfer a liability in an orderly transaction between market participants at the measurement date. When determining the fair value measurements for assets and liabilities required to be recorded at fair value, the Company considers the principal or most advantageous market in which the Company would transact and consider assumptions that market participants would use when pricing the asset or liability, such as inherent risk, transfer restrictions, and risk of nonperformance. ASC 820 establishes a valuation hierarchy for disclosure of the inputs to valuation used to measure fair value. This hierarchy prioritizes the inputs into three broad levels as follows:
|
|
·
|
Level 1: quoted prices (unadjusted) in active markets for identical assets or liabilities;
|
|
|
·
|
Level 2:
|
inputs other than quoted prices included within Level 1 that are either directly or indirectly observable; and
|
|
|
·
|
Level 3:
|
unobservable inputs in which little or no market activity exists, therefore requiring an entity to develop its own assumptions about the assumptions that market participants would use in pricing.
|
The classification of a financial asset or liability within the hierarchy is determined based on the lowest level input that is significant to the fair value measurement. The carrying amounts of the Company’s financial instruments, including cash and cash equivalents, approximate fair value due to their high liquidity in actively quoted trading markets and their short maturities.
Reclassifications
Certain financial statement line items have been reclassified to conform to the current period presentation and have no impact on the previously reported consolidated net sales, operating results, or net financial position.
8
NOTE 2. CONCENTRATION OF RISK
Concentration of supplier risk
The Company relies on supplies from numerous vendors. For the nine months ended September 30, 2011 and 2010, the Company had two vendors that each accounted for more than 10% of total supply purchases. If any of the vendors terminate their relationships with the Company or if the Company’s supply from the vendors is interrupted or terminated for any reason, we may not have sufficient time to replace the supply of products from the remaining vendors. Any such interruption would negatively impact our ability to sell and distribute our products. However, the suppliers’ concentration of credit risk does not pose any effect to the concentration of credit risk with respect to trade payables as the Company made the purchases through facilities provided by banks and financial institutions.
Concentration of risk due to geographic location
The Company’s business, assets and operations are currently focused on the sales of new and used vehicles, provision of vehicle maintenance and repair services, and sales of vehicle parts in Hong Kong and Mainland China, and accordingly, are affected to a significant degree by any economic, political and legal developments in Hong Kong and Mainland China.
NOTE 3. RECENT ACCOUNTING PRONOUNCEMENTS
In April 2011, the FASB issued Accounting Standards Update (“ASU”) 2011-02 – Receivables (Topic 310): A Creditor’s Determination of Whether a Restructuring Is a Troubled Debt Restructuring. This update to Receivables (Topic 310) clarifies the guidance for a creditor’s evaluation of whether a restructuring constitutes a troubled debt restructuring. This update clarifies, when evaluating a restructuring as a troubled debt restructuring, whether a creditor has granted a concession to a debtor and whether the debtor is experiencing financial difficulties. The objective of this amendment is to promote greater consistency in the application of US GAAP for debt restructurings from the creditor’s perspective. The effective date of this update is for the first interim period beginning after June 15, 2011, and should be applied retrospectively to the beginning of the current year. The adoption of ASU 2011-02 does not have a material impact on the Company’s consolidated results of operations or financial condition.
Other recent accounting pronouncements issued by the FASB (including its Emerging Issues Task Force (“EITF”)), the American Institute of Certified Public Accountants (“AICPA”), and the SEC did not or are not believed by management to have a material impact on the Company’s present or future financial statements.
In June 2011, the FASB issued Accounting Standards Update (“ASU”) 2011-05, which is an update to Topic 220, “Comprehensive Income”. This update eliminates the option of presenting the components of other comprehensive income as part of the statement of changes in stockholders’ equity, requires consecutive presentation of the statement of net income and other comprehensive income and requires reclassification adjustments from other comprehensive income to net income to be shown on the financial statements. ASU 2011-05 is effective for all interim and annual reporting periods beginning after December 15, 2011. ASU 2011-05 is not expected to have a material impact on the Company’s financial position or results of operation.
9
In September 2011, the FASB issued ASU No. 2011-08, Intangibles – Goodwill and Other (Topic 350): Testing Goodwill for Impairment. The guidance in ASU 2011-08 is intended to reduce complexity and costs by allowing an entity the option to make a qualitative evaluation about the likelihood of goodwill impairment to determine whether it should calculate the fair value of a reporting unit. The amendments also improve previous guidance by expanding upon the examples of events and circumstances that an entity should consider between annual impairment tests in determining whether it is more likely than not that the fair value of a reporting unit is less than its carrying amount. Also, the amendments improve the examples of events and circumstances that an entity having a reporting unit with a zero or negative carrying amount should consider in determining whether to measure an impairment loss, if any, under the second step of the goodwill impairment test. The amendments in this ASU are effective for annual and interim goodwill impairment tests performed for fiscal years beginning after December 15, 2011. Early adoption is permitted, including for annual and interim goodwill impairment tests performed as of a date before September 15, 2011, if an entity's financial statements for the most recent annual or interim period have not yet been issued. The adoption of this guidance is not expected to have a material impact on the Company's financial position or results of operations.
NOTE 4. LOSS PER SHARE
The computation of basic and diluted loss per share is as follows for the three months and nine months ended September 30:
|
Three months ended
September, 30
|
Nine months ended
September, 30
|
|||||||||||||||
|
2011
|
2010
|
2011
|
2010
|
|||||||||||||
|
Numerator:
|
||||||||||||||||
|
Net (loss) /earnings attributable to China Premium Lifestyle Enterprise, Inc. common stockholders
|
$ | (617,884 | ) | $ | (464 | ) | $ | 318,798 | $ | (604,226 | ) | |||||
|
Denominator:
|
||||||||||||||||
|
Weighted average common stock
|
24,534,492 | 24,534,491 | 24,534,492 | 24,534,491 | ||||||||||||
|
Basic net (loss) / earnings per share
|
$ | (0.02518 | ) | $ | (0.00002 | ) | $ | 0.01299 | $ | (0.02463 | ) | |||||
|
Diluted net (loss) /earnings per share
|
$ | (0.02518 | ) | $ | (0.00002 | ) | $ | 0.01299 | $ | (0.02463 | ) | |||||
NOTE 5. INVENTORY, NET
Inventory by major categories is summarized as follows:
|
September 30,
|
December 31,
|
|||||||
|
2011
|
2010
|
|||||||
|
New vehicles
|
$ | 18,232,523 | $ | 9,485,313 | ||||
|
Used vehicles
|
3,667,478 | 4,307,065 | ||||||
|
Parts, accessories and others
|
3,238,625 | 2,611,692 | ||||||
| $ | 25,138,626 | $ | 16,404,070 | |||||
Vehicles included in inventory of approximately $10,194,956 and $6,326,005 were pledged to secure the stocking loan and other loans outstanding as of September 30, 2011 and December 31, 2010, respectively (See Note 6).
10
NOTE 6. BORROWINGS
The Company's borrowings are summarized as follows:
|
September 30,
|
December 31,
|
|||||||
|
2011
|
2010
|
|||||||
|
Bank borrowings
|
$ | 8,475,896 | $ | 6,120,980 | ||||
|
Stocking loans provided by banks
|
12,306,583 | 6,689,543 | ||||||
|
Unsecured bank borrowings
|
541,549 | 929,872 | ||||||
| 21,324,028 | 13,740,395 | |||||||
|
Borrowings due after one year – unsecured bank borrowings
|
- | (409,449 | ) | |||||
|
Short-term borrowings
|
$ | 21,324,028 | $ | 13,330,946 | ||||
Vehicles included in inventory of approximately $10,194,956 and $6,326,005 were pledged to secure the stocking loan and other loan outstanding as of September 30, 2011 and December 31, 2010, respectively.
NOTE 7. OTHER CURRENT LIABILITIES
Other current liabilities by major categories are summarized as follows:
|
September 30,
|
December 31,
|
|||||||
|
2011
|
2010
|
|||||||
|
Accruals
|
$ | 2,103,776 | $ | 1,146,914 | ||||
|
Other payables
|
1,198,620 | 4,110,255 | ||||||
| $ | 3,302,396 | $ | 5,257,169 | |||||
Other payables mainly consist of first registration tax on motor vehicles sold. First registration tax is applicable to new motor vehicles sold in Hong Kong and is computed on a progressive rate based on the gross selling price of the new motor vehicles.
NOTE 8. STOCKHOLDERS’ EQUITY
General
The Company’s total authorized capital at September 30, 2011, is 100,000,000 shares of common stock, par value $0.005. At September 30, 2011, 24,534,492 shares of common stock were issued and outstanding.
Background
In September 2006, the Company closed the transactions contemplated by that certain Share Exchange Agreement, dated July 15, 2006, by and among the Company, Fred De Luca, Corich Enterprises, Inc., a British Virgin Islands corporation, Herbert Adamczyk and Technorient Limited, a Hong Kong corporation (the “Share Exchange Agreement”). Pursuant to the terms of the Share Exchange Agreement, the Company issued an aggregate of 972,728 shares (the “Exchange Shares”) of Series A Convertible Preferred Stock in exchange for shares of the capital stock of Technorient.
11
In connection with the Share Exchange Agreement and prior to its closing, the Company entered into a consulting agreement dated July 15, 2006 with Happy Emerald Ltd. (“HEL”) pursuant to which the Company issued to HEL 561,245 shares (the “HEL Shares”) of Series A Convertible Preferred Stock in exchange for certain future services to be performed by HEL after the closing of the Share Exchange Agreement.
In December 2006, the Company authorized the delivery of 65,454 shares (the “Bern Noble Shares”) of the HEL Shares to Bern Noble, Ltd. (“Bern Noble”) for consulting services rendered by Bern Noble to us in connection with the Share Exchange Agreement. In March 2007, Bern Noble converted the Bern Noble Shares into 1,210,631 shares of common stock.
The following actions were also taken:
|
·
|
on April 7, 2006, prior management filed an amendment to the Company’s Articles of Incorporation purporting to create a class of 100,000,000 shares of “blank check” preferred stock (the “Preferred Stock Amendment”);
|
|
·
|
on August 16, 2006, prior management filed an amendment to the Company’s Articles of Incorporation purporting to designate 2,000,000 shares of the “blank check” preferred stock as “Series A Convertible Preferred Stock” (the “Certificate of Designation”); and
|
|
·
|
on December 18, 2006, an amendment to the Company’s Articles of Incorporation was filed by the Company purporting to increase the number of shares of authorized common stock from 100,000,000 shares to 400,000,000 shares (the “Common Stock Amendment”).
|
On December 19, 2008, the Company filed an action in the United States District Court for the Central District of California (the “Federal Court Action”), for fraud, breach of fiduciary duty, breach of contract and conversion against HEL, certain members of prior management, including Fred De Luca, Charles Miseroy, Robert G. Pautsch and Federico Cabo, and certain other defendants. In the Federal Court Action, the Company alleged that:
|
·
|
HEL had never performed any services under the consulting agreement; and
|
|
·
|
the defendants, including the members of prior management, had (1) fraudulently obtained certificates for 495,596 shares of the Series A Convertible Preferred Stock, (2) improperly attempted to transfer the shares among themselves and their affiliates, (3) improperly converted 247,798 of the shares into 4,569,619 shares of common stock, and (4) sought to have the restrictive legend removed from the resulting shares of common stock.
|
During the pendency of the Federal Court Action, the Company’s legal advisors discovered and advised the Company that the Preferred Stock Amendment, the Certificate of Designation and the Common Stock Amendment had not been properly authorized. Specifically:
|
·
|
each of the Preferred Stock Amendment and the Common Stock Amendment was approved by the written consent of a majority of the Company’s then-stockholders, whereas the Company’s By-Laws require stockholder actions by written consent to be approved unanimously; and
|
|
·
|
at the time of the filing of the Certificate of Designation with the Nevada Secretary of State, the Articles of Incorporation did not authorize the Board of Directors to designate the rights, preferences and privileges of any “blank check” preferred stock.
|
12
The Company was advised that the Preferred Stock Amendment, the Certificate of Designation and the Common Stock Amendment were invalid and of no force or effect. Further, the Company was advised that it had never been authorized to issue any shares of any class or series of preferred stock, including the Exchange Shares, the Bern Noble Shares and the HEL Shares, and that any shares of common stock underlying such shares would also not have been authorized. In addition, the Company was advised that it was never authorized to issue any shares of common stock in excess of 100,000,000 shares.
Upon learning of the invalidity of the Preferred Stock Amendment, the Certificate of Designation and the Common Stock Amendment:
|
·
|
current management took action to correct any potential defect in the transactions contemplated to acquire the shares of Technorient under the Share Exchange Agreement. On May 5, 2009, the Company entered into a reformation (“Reformation”) of the Share Exchange Agreement pursuant to which 17,937,977 shares of common stock (on a post-Reverse Stock Split basis) underlying the Exchange Shares were agreed to have been issued in lieu of the Exchange Shares themselves. Pursuant to the Reformation, an aggregate of 14,400,000 shares of the Company’s common stock were deemed to have been issued on the closing date of the Share Exchange Agreement, and upon the effectiveness of and giving effect to the Reverse Stock Split on December 7, 2007, an aggregate of 3,537,977 additional shares of common stock were deemed to have been issued; and
|
|
·
|
the Company amended its complaint in the Federal Court Action to allege that all of the disputed shares (the HEL Shares and, derivatively, the Bern Noble Shares), were void and subject to cancellation. Because of the uncertainty of the outcome of the Federal Court Action, however, the Company determined not to make any changes with respect to such shares on its financial statements until the pending litigation was finally resolved through a judgment in or settlement of the Federal Court Action.
|
On March 1, 2010, the Company settled the Federal Court Action. Under the terms of the settlement, the defendants returned to the Company for cancellation certificates representing all of the disputed shares, including 247,798 shares of the Series A Convertible Preferred Stock and 4,569,619 shares of common stock.
Further, in connection with the settlement, Bern Noble agreed to return to us for cancellation the 1,210,631 shares of common stock that had originally been derived from the HEL Shares. We also agreed to replace the Bern Noble Shares with an equal number of new shares of common stock in consideration of services rendered to the Company in 2006 in connection with the closing of the Share Exchange Agreement. The Company has delivered all shares due in connection with the settlement.
NOTE 9. COMMITMENTS AND CONTINGENT LIABILITIES
Litigation, Claims and Assessments
This Note should be read in conjunction with Note 8.
Settlement of Federal Court Action
On December 19, 2008, the Company filed an action, styled China Premium Lifestyle Enterprise, Inc. v. Happy Emerald Limited, et al., in the United States District Court, Central District of California, Case No. SACV08-1439 (the “Federal Court Action”), asserting claims for Securities Fraud, Breach of Contract, Fraud, Conversion, Unjust Enrichment, Constructive Trust, Breach of Fiduciary Duty and Declaratory Relief. The Company named Happy Emerald Ltd., a purported British Virgin Islands corporate entity (“HEL”), Global Premium Brands Co., Inc., a defunct California corporation, Global Premium Brands Co., Inc., a Nevada corporation, Fred De Luca, Charles Miseroy, Delia Rodriguez, Robert G. Pautsch, Richard Cabo, Federico Cabo, Bern Noble Ltd., a Nevada corporation and C&H Capital, Inc., a Georgia corporation, as defendants (collectively, the “Defendants”).
13
Effective March 1, 2010, the Company settled the Federal Court Action. Under the terms of the settlement: (1) certain Defendants returned to the Company for cancellation 247,798 shares of purported preferred stock and 4,569,619 shares of common stock; (2) Mr. De Luca, a member of the Company’s board of directors and a defendant in the action, resigned from the board of directors effective March 1, 2010; (3) the parties executed a mutual release; and (4) the Company dismissed the action with prejudice.
In December 2006, the Company had delivered 65,454 shares of purported preferred stock to Bern Noble, for consulting services rendered in connection with the Exchange. In March 2007, Bern Noble converted such shares into 1,210,631 shares of common stock. As previously disclosed in the Company’s Current Report on Form 8-K, filed on May 11, 2009, the Company later determined that it was never authorized to issue any shares of preferred stock.
In the settlement, Bern Noble agreed to return to us for cancellation the 1,210,631 shares of common stock (which were derived from unauthorized shares of preferred stock), and the Company agreed to issue Bern Noble an equal number of new shares of common stock in consideration of the services previously rendered to the Company in 2006. The Company delivered the new shares in nine monthly installments, commencing on March 15, 2010.
Addison-Davis Litigation
On or about December 1, 2009, we were made aware that the Company had been named as a co-defendant in a state court action, Addison-Davis Diagnostics, Inc. v. Edward W. Withrow, III, et al., California Superior Court, Ventura County, Case No. 56-2009-00361702-CU-FR-VTA. Formal service was effected on April 28, 2010. In the action, the plaintiff, which is the former parent company of China Premium, alleges that the plaintiff’s former chief executive officer, with the assistance of certain other third parties, engaged in multiple fraudulent transactions involving the plaintiff and the plaintiff’s securities between 2004 and 2006. As a result of such alleged conduct, the plaintiff alleges that the plaintiff’s former chief executive officer was able to fraudulently obtain shares of the plaintiff’s common stock and certain of the plaintiff’s assets. The plaintiff alleges that as a result of such alleged conduct, the plaintiff was forced to seek bankruptcy protection in September, 2006. In a hearing held May 14, 2010, the court ruled that certain parties’ motions to dismiss the plaintiff’s complaint were granted with leave to the plaintiff to amend its complaint within 30 days. The plaintiff filed a first amended complaint in June 2010, to which the Company brought a demurrer, which was sustained by the court with leave to amend. The plaintiff then filed a second amended complaint on November 15, 2010. In the second amended complaint, the plaintiff named the Company as a co-defendant in seven of the thirteen causes of action, including claims for fraud, negligent misrepresentation, conversion (two claims), constructive trust, unjust enrichment and an accounting. The Company filed a demurrer challenging all claims asserted against it in the second amended complaint. Pursuant to an order dated February 7, 2011, the court sustained the Company’s demurrer to the plaintiff’s second amended complaint on all counts, without leave to amend. A judgment of dismissal was entered by the court on March 9, 2011. On March 10, 2011, a notice of entry of judgment was served on all parties to the action. Plaintiff had 60 days following service of the notice of entry of judgment to file a notice of appeal with the court. That deadline passed without the Company being served with a timely notice of appeal. As such, as to the Company, this action has been fully resolved in the Company’s favor.
14
From time to time the Company may be involved in various disputes and litigation matters arising in the normal course of business. It is the Company's belief that the resolution of these matters will not have a material adverse effect on its financial position or results of operations, however, management cannot provide assurance that damages that result in a material adverse effect on its financial position or results of operations will not be imposed in these matters. The Company accounts for contingent liabilities when it is probable that future expenditures will be made and such expenditures can be reasonably estimated.
Operating Lease Commitments
The Company leases its dealership facilities, service center facilities and office space under non-cancellable operating leases in Hong Kong and Mainland China. Minimum future rental payments required under non-cancellable operating leases in effect as of September 30, 2011 are as follows:
|
2011
|
$ | 1,317,446 | ||
|
2012
|
4,533,520 | |||
|
2013
|
3,094,223 | |||
|
2014
|
2,709,516 | |||
|
2015
|
2,709,516 | |||
|
Later years
|
4,846,979 | |||
| $ | 19,211,200 |
Rent expense for the three months and nine months ended September 30, 2011 and 2010 was $1,286,808 and $966,058, 3,420,133 and $2,603,076 respectively.
Employment Agreements
The Company maintains employment agreements with its executives which extend through 2011. The agreements provide for a base salary, annual bonus to be determined by the Board of Directors, termination payments, and other terms and conditions of employment. In addition, the Company maintains employment agreements with other key employees with similar terms and conditions. As of September 30, 2011, committed compensation to the executives and other key employees totalling approximately $25,535 (December 31, 2010: $222,523) remain in effect.
NOTE 10. COMPREHENSIVE INCOME INFORMATION
(a) The Company’s comprehensive income is comprised of net operating results and translation adjustments. Comprehensive income for the nine months ended September 30 is as follows:
|
China Premium Lifestyle Enterprise, Inc.
common stockholders
|
||||||||||||||||
|
Accumulated deficit
|
Accumulated other
comprehensive income
|
Noncontrolling
interests
|
Total
|
|||||||||||||
|
At January 1, 2011
|
$ | (6,414,586 | ) | $ | 335,139 | $ | 6,850,456 | $ | 771,009 | |||||||
|
Net earnings
|
411,921 | - | 533,295 | 945,216 | ||||||||||||
|
Translation adjustments
|
- | 18,013 | 12,744 | 30,757 | ||||||||||||
|
At March 31, 2011
|
$ | (6,002,665 | ) | $ | 353,152 | $ | 7,396,495 | $ | 1,746,982 | |||||||
|
Net earnings
|
524,761 | - | 684,542 | 1,209,303 | ||||||||||||
|
Translation adjustments
|
- | 21,463 | 28,749 | 50,212 | ||||||||||||
|
At June 30, 2011
|
$ | (5,477,904 | ) | $ | 374,615 | $ | 8,109,786 | $ | 3,006,497 | |||||||
|
Net loss
|
(617,884 | ) | - | (506,269 | ) | (1,124,153 | ) | |||||||||
|
Translation adjustments
|
- | 22,800 | 12,413 | 35,213 | ||||||||||||
|
At September 30, 2011
|
$ | (6,095,788 | ) | $ | 397,415 | $ | 7,615,930 | $ | 1,917,557 | |||||||
15
|
China Premium Lifestyle Enterprise, Inc.
common stockholders
|
||||||||||||||||
|
Accumulated deficit
|
Accumulated other
comprehensive income
|
Noncontrolling
interests
|
Total
|
|||||||||||||
|
At January 1, 2010
|
$ | (6,428,091 | ) | $ | 244,371 | $ | 4,863,414 | $ | (1,320,306 | ) | ||||||
|
Net earnings / (loss)
|
(55,320 | ) | - | 226,418 | 171,098 | |||||||||||
|
Translation adjustments
|
- | 3,771 | 6,455 | 10,226 | ||||||||||||
|
At March 31, 2010
|
$ | (6,483,411 | ) | $ | 248,142 | $ | 5,096,287 | $ | (1,138,982 | ) | ||||||
|
Net earnings / (loss)
|
(548,442 | ) | - | 153,112 | (395,330 | ) | ||||||||||
|
Translation adjustments
|
- | 27,041 | 2,728 | 29,769 | ||||||||||||
|
At June 30, 2010
|
$ | (7,031,853 | ) | $ | 275,183 | $ | 5,252,127 | $ | (1,504,543 | ) | ||||||
|
Net earnings / (loss)
|
(464 | ) | - | 284,503 | 284,039 | |||||||||||
|
Translation adjustments
|
- | 10,144 | 47,728 | 57,872 | ||||||||||||
|
At September 30, 2010
|
$ | (7,032,317 | ) | $ | 285,327 | $ | 5,584,358 | $ | (1,162,632 | ) | ||||||
(b) Condensed consolidated statement of comprehensive income (loss)
|
Three months ended
September 30,
|
Nine months ended
September 30,
|
|||||||||||||||
|
2011
|
2010
|
2011
|
2010
|
|||||||||||||
|
Net (loss)/income including noncontrolling interest
|
$ | (1,124,153 | ) | $ | 284,039 | $ | 1,030,366 | $ | 59,807 | |||||||
|
Other comprehensive income, net of tax:
|
||||||||||||||||
|
Translation adjustments
|
35,213 | 57,872 | 116,182 | 97,867 | ||||||||||||
|
Comprehensive income/(loss) including noncontrolling interest
|
(1,088,940 | ) | 341,911 | 1,146,548 | 157,674 | |||||||||||
|
Comprehensive (income)/loss attributable to noncontrolling interest:
|
||||||||||||||||
|
Net income
|
506,269 | (284,503 | ) | (711,568 | ) | (664,033 | ) | |||||||||
|
Translation adjustments
|
(12,413 | ) | (47,728 | ) | (53,906 | ) | (56,911 | ) | ||||||||
|
Comprehensive income / (loss) attributable to China Premium Lifestyle Enterprise, Inc. common stockholders
|
$ | (595,084 | ) | $ | 9,680 | $ | 381,074 | $ | (563,270 | ) | ||||||
NOTE 11. BUSINESS SEGMENTS AND GEOGRAPHICAL INFORMATION
Business Segments
The Company operates in two business segments: Vehicles and Fashion Apparel. The Company’s reporting segments are strategic business units that offer different products and services. They are managed separately based on the fundamental differences in their operations.
The Vehicles segment consists primarily of the group of companies doing business as Auto Italia Limited, Nanjing Auto Italia Car Trading Co., Limited and Dalian Auto Italia Car Trading Co., Limited. The Vehicles segment includes sales of new and used vehicles, provision of vehicle maintenance and repair services, and sales of vehicle parts.
16
The Fashion Apparel segment consists primarily of CPMM (Asia) Limited. The Fashion Apparel segment provides wholesale and retailing of fashion apparel.
Information by industry segment is set forth below for the three months and nine months ended September 30:
|
Three months ended September 30,
2011 |
Vehicles
|
Fashion
Apparel
|
Corporate
|
Elimination
|
Consolidated
|
|||||||||||||||
|
Sales
|
||||||||||||||||||||
|
External sales
|
$ | 46,577,743 | $ | - | $ | - | $ | - | $ | 46,577,743 | ||||||||||
|
Inter-segment sales
|
- | - | - | - | - | |||||||||||||||
|
Net sales
|
46,577,743 | $ | - | $ | - | $ | - | 46,577,743 | ||||||||||||
|
Results
|
||||||||||||||||||||
|
Operating loss
|
(998,983 | ) | - | (131,469 | ) | - | (1,130,452 | ) | ||||||||||||
|
Interest revenue
|
13,453 | - | - | - | 13,453 | |||||||||||||||
|
Interest expense
|
(373,318 | ) | - | - | - | (373,318 | ) | |||||||||||||
|
Other income
|
322,542 | - | - | - | 322,542 | |||||||||||||||
|
Profit before income taxes
|
(1,167,775 | ) | ||||||||||||||||||
|
Provision for income tax
|
43,622 | - | - | 43,622 | ||||||||||||||||
|
Net earnings
|
(1,124,153 | ) | ||||||||||||||||||
17
|
Nine months ended September 30,
2011
|
Vehicles
|
Fashion
Apparel
|
Corporate
|
Elimination
|
Consolidated
|
|||||||||||||||
|
|
||||||||||||||||||||
|
Sales
|
||||||||||||||||||||
|
External sales
|
$ | 136,549,511 | $ | - | $ | - | $ | - | $ | 136,549,511 | ||||||||||
|
Inter-segment sales
|
- | - | - | - | - | |||||||||||||||
|
Net sales
|
136,549,511 | $ | - | $ | - | $ | - | 136,549,511 | ||||||||||||
|
Results
|
||||||||||||||||||||
|
Operating earnings / (loss)
|
1,795,230 | - | (364,865 | ) | - | 1,430,365 | ||||||||||||||
|
Interest revenue
|
32,633 | - | - | - | 32,633 | |||||||||||||||
|
Interest expense
|
(1,090,097 | ) | - | - | - | (1,090,097 | ) | |||||||||||||
|
Other income
|
760,051 | - | - | - | 760,051 | |||||||||||||||
|
Profit before income taxes
|
1,132,952 | |||||||||||||||||||
|
Provision for income tax
|
(102,586 | ) | - | - | - | (102,586 | ) | |||||||||||||
|
Net earnings
|
1,030,366 | |||||||||||||||||||
|
Three months ended September 30,
2010
|
Vehicles
|
Fashion
Apparel
|
Corporate
|
Elimination
|
Consolidated
|
|||||||||||||||
|
Sales
|
||||||||||||||||||||
|
External sales
|
$ | 37,380,700 | $ | - | $ | - | $ | - | $ | 37,380,700 | ||||||||||
|
Inter-segment sales
|
- | - | - | - | - | |||||||||||||||
|
Net sales
|
37,380,700 | $ | - | $ | - | $ | - | 37,380,700 | ||||||||||||
|
Results
|
||||||||||||||||||||
|
Operating earnings / (loss)
|
564,595 | - | (273,820 | ) | - | 290,775 | ||||||||||||||
|
Interest revenue
|
2,801 | - | - | - | 2,801 | |||||||||||||||
|
Interest expense
|
(243,879 | ) | - | - | - | (243,879 | ) | |||||||||||||
|
Other income
|
232,565 | - | - | - | 232,565 | |||||||||||||||
|
Profit before income taxes
|
282,262 | |||||||||||||||||||
|
Provision for income tax
|
1,777 | - | - | - | 1,777 | |||||||||||||||
|
Net earnings
|
284,039 | |||||||||||||||||||
18
|
Nine months ended September 30,
2010
|
Vehicles
|
Fashion
Apparel
|
Corporate
|
Elimination
|
Consolidated
|
|||||||||||||||
|
Sales
|
||||||||||||||||||||
|
External sales
|
$ | 97,791,258 | $ | 98 | $ | - | $ | - | $ | 97,791,356 | ||||||||||
|
Inter-segment sales
|
- | - | - | - | - | |||||||||||||||
|
Net sales
|
97,791,258 | $ | 98 | $ | - | $ | - | 97,791,356 | ||||||||||||
|
Results
|
||||||||||||||||||||
|
Operating earnings / (loss)
|
589,226 | (15,867 | ) | (1,228,181 | ) | - | (654,822 | ) | ||||||||||||
|
Interest revenue
|
8,679 | - | - | - | 8,679 | |||||||||||||||
|
Interest expense
|
(625,355 | ) | - | - | - | (625,355 | ) | |||||||||||||
|
Other income
|
1,321,763 | - | - | - | 1,321,763 | |||||||||||||||
|
Profit before income taxes
|
50,265 | |||||||||||||||||||
|
Provision for income tax
|
9,542 | - | - | - | 9,542 | |||||||||||||||
|
Net earnings
|
59,807 | |||||||||||||||||||
|
Vehicles
|
Fashion
Apparel
|
Corporate
|
Consolidated
|
|||||||||||||
|
2011
|
||||||||||||||||
|
Total assets
|
$ | 64,387,753 | $ | 456 | $ | 150 | $ | 64,388,359 | ||||||||
|
Depreciation and amortization
|
1,480,581 | - | - | 1,480,581 | ||||||||||||
|
Net capital expenditures
|
2,380,938 | - | - | 2,380,938 | ||||||||||||
|
2010
|
||||||||||||||||
|
Total assets
|
$ | 52,845,828 | $ | 2,584,767 | $ | 10,518 | $ | 55,441,113 | ||||||||
|
Depreciation and amortization
|
1,161,756 | - | - | 1,161,756 | ||||||||||||
|
Net capital expenditures
|
2,525,527 | - | - | 2,525,527 | ||||||||||||
Geographic Information
No segment information is provided as the Company only has one geographical segment. The Company’s reportable business segments are Vehicle and Fashion Apparel, which operations are located in the People’s Republic of China (including Mainland China, Hong Kong and Macau). Sales were predominately made to customers located in the People’s Republic of China (including Mainland China, Hong Kong and Macau).
19
NOTE 12. RELATED PARTY TRANSACTIONS
The following is a summary of significant transactions among certain related parties and the Company during the three months and nine months ended September 30:
|
Three months ended
September 30,
|
Nine months ended
September 30,
|
||||||||||||||||
|
Notes
|
2011
|
2010
|
2011
|
2010
|
|||||||||||||
|
Sales to:
|
|||||||||||||||||
|
- Affiliates
|
(a)
|
$ | 6,070 | $ | 2,456 | $ | 9,205 | $ | 11,774 | ||||||||
|
Purchases from:
|
|||||||||||||||||
|
- Affiliates
|
(a)
|
78,563 | 784 | 156,734 | 784 | ||||||||||||
|
Management fee paid to:
|
|||||||||||||||||
|
- Affiliates
|
(b)
|
127,644 | 89,268 | 383,148 | 268,982 | ||||||||||||
Notes:
|
(a)
|
The transactions were carried out at market price or, where no market price was available, at cost plus a percentage profit mark-up.
|
|
(b)
|
The transactions were carried out at terms agreed between both parties.
|
NOTE 13. SUBSEQUENT EVENTS
We have performed an evaluation of subsequent events and transactions through the date of this filing, which is the date the financial statements were issued. During this period the Company did not have any material subsequent events that impacted our condensed consolidated financial statements.
[End of condensed consolidated financial statements.]
20
Item 2. Management’s Discussion and Analysis of Financial Condition and Results of Operations.
FORWARD-LOOKING STATEMENTS
The Private Securities Litigation Reform Act of 1995 provides a safe harbor for forward-looking statements made by us or on our behalf. We may from time to time make written or oral statements that are “forward-looking” within the meaning of Section 27A of the Securities Act of 1933, as amended (the “Securities Act”), and Section 21E of the Securities and Exchange Act of 1934, as amended, including statements contained in this report and other filings with the SEC and other reports and public statements. These statements may, for example, express expectations or projections about future actions or results that we may anticipate but, due to developments beyond our control, do not materialize. Actual results could differ materially because of issues and uncertainties such as those listed herein, which, among others, should be considered in evaluating our financial outlook. The principal factors that could cause our actual performance and future events and actions to differ materially from such forward-looking statements include, but are not limited to, (a) general economic conditions in the Hong Kong Special Administrative Region (“Hong Kong”), the Macau Special Administrative Region (“Macau”) and Mainland China; (b) regulatory factors in Hong Kong, Macau and Mainland China that may lead to additional costs or otherwise negatively affect our business; (c) whether we are able to manage our planned growth efficiently, including whether our management will be able to: (i) identify, hire, train, retain, motivate and manage required personnel or (ii) successfully manage and exploit existing and potential market opportunities; (d) whether we are able to generate sufficient revenues or obtain financing to sustain and grow our operations; (e) our exposure to foreign currency fluctuations, (f) whether we are able to successfully fulfill our primary cash requirements which are explained below under “Financial Condition, Liquidity and Capital Resources;” (g) whether worldwide economic conditions or political instability will negatively affect the automobile retail industry in Hong Kong, Macau and Mainland China and other factors or conditions described in Item 1A – Risk Factors in Part I of our 2010 Annual Report on Form 10-K. We assume no obligation to update publicly any forward-looking statements.
Our financial statements are prepared in accordance with accounting principles generally accepted in the United States (“GAAP”). These accounting principles require us to make certain estimates, judgments and assumptions. We believe that the estimates, judgments and assumptions upon which we rely are reasonable based upon information available to us at the time that these estimates, judgments and assumptions are made. These estimates, judgments and assumptions can affect the reported amounts of assets and liabilities as of the date of the financial statements as well as the reported amounts of revenues and expenses during the periods presented. Our financial statements would be affected to the extent there are material differences between these estimates and actual results. In many cases, the accounting treatment of a particular transaction is specifically dictated by GAAP and does not require management’s judgment in its application. There are also areas in which management’s judgment in selecting any available alternative would not produce a materially different result.
Management’s Discussion and Analysis of Financial Condition and Results of Operations should be read in conjunction with the accompanying unaudited Condensed Consolidated Financial Statements and notes thereto and with the audited Condensed Consolidated Financial Statements, notes thereto, and Management’s Discussion and Analysis of Financial Condition and Results of Operations included in our 2010 Annual Report on Form 10-K.
21
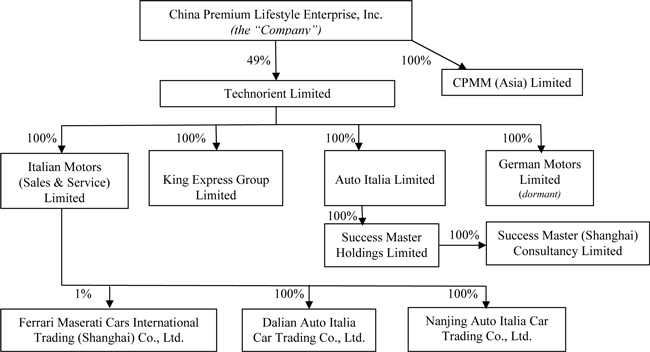
COMPANY OVERVIEW
The main business of the Company is its 49% ownership interest in Technorient Limited, a Hong Kong corporation (“Technorient”). The business of Technorient and its subsidiaries consists of the importation, distribution and after-sales service of Italian “Ferrari” and “Maserati” branded automobiles and spare parts in Hong Kong, Macau and Mainland China. We have five automobile sales and service locations in Hong Kong and three in Mainland China (Dalian (two locations) and Nanjing).
Technorient is the parent company of Auto Italia Limited (“Auto Italia”) (and Auto Italia’s wholly-owned subsidiary shown on the chart below), German Motors Limited (“German Motors”), Italian Motors (Sales & Service) Limited (“IML”) (and IML’s subsidiaries shown on the chart below) and King Express Group Limited (“King Express”). We refer to Auto Italia and IML (and their respective subsidiaries) and German Motors and King Express, collectively, as the “Technorient Group.”
In addition to its interest in the Technorient Group, the Company’s wholly-owned subsidiary, CPMM (Asia) Limited (f/k/a Leader Mount Limited), a Hong Kong corporation (“CPMM Asia”), implemented a plan in 2008 to import, distribute and sell premium brand apparel in Hong Kong, Macau, Mainland China and Taiwan. The sale and distribution of premium brand apparel was wound down in 2009 due to lack of sales, which was primarily attributable to the downturn in the global economy and the tightening of consumer spending in Mainland China.
The diagram below illustrates the organizational structure of the Company, including the Technorient Group.
For the nine months ended September 30, 2010 and 2011, our new vehicles sales increased approximately $33 million or 45.1% from approximately $73 million to approximately $106 million, while the number of new vehicles sold increased 27.2% for the same period. Used vehicles sales increased approximately $2.5 million or 15.1% from approximately $16.5 million for the nine months ended September 30, 2010 to approximately $19 million over the same period of 2011. The number of used vehicles sold decreased by 4.3% over the same period in 2010.
22
In addition, for the nine months ended September 30, 2010 and 2011, we had gross revenues from maintenance repair services and the sale of automobile parts of $8.3 million and $11.6 million, respectively.
Our current operations and the growth of our business depend upon the execution of our sales and service business strategy. We receive factory allocations of vehicles annually from both Ferrari and Maserati, which vary from year to year. There is no obligation on our part to purchase any specific year’s allocation. The allocation plan is solely for business planning purposes. The allocation plan is subject to unilateral amendment by each manufacturer. There is no legal consequence to us if we fail to utilize the number of vehicles allocated to us under the allocation plan. If we are unable to utilize our entire allocation, each manufacturer may reallocate the un-utilized portion of our allocation to other dealers.
We believe that we have a strong brand mix of attractive automobiles to sell. Given the exclusive nature and extremely limited production of Ferrari and Maserati automobiles, our customers are willing to place material deposits in advance in order to secure their new cars. As of September 30, 2011, we had received customer deposits of approximately $24,911,000. We sell all of our automobiles for the purchase price contracted for with the customer and do not finance any of the purchase price. We retain no credit risk. Luxury vehicle sales have historically fluctuated with local and national economic conditions, including consumer confidence, available consumer credit and product availability. The primary risk in our business is the availability of customers with the financial capability to purchase the luxury vehicles we sell.
Our gross profit margin varies with our revenue mix. The sale of used vehicles generally results in lower gross profit margins than new vehicle sales and sales of parts and service. Due to the current demand for new vehicles we expect our overall gross profit margin to increase. We continue to focus on expense controls, although, should sales volume decline or gross margins come under pressure, such efforts on our part may not keep pace with lower gross profits. Operating results are generally subject to changes in the economic environment and seasonal variations. We tend to generate more revenue and operating income in the second half of the calendar year than the first half. Generally, seasonal variations in sales are caused by factors related to manufacturer production schedules, model changeovers and consumer buying patterns, among other things. For the nine months ended September 30, 2011 our sales and revenue have increased as a reflection of the improvement in the economy in our markets. As a result of the improved economy in our markets, our used vehicles and parts and service business have also grown substantially.
Our sales outlook for the balance of 2011 is optimistic inasmuch as we have significant orders on hand for new Ferrari and Maserati automobiles. No assurance can be given, however, that such sales will be completed. We do not rely upon special incentives in the sale of new or used vehicles, but depend upon the unique and exclusive nature of Ferrari and Maserati automobiles and their appeal to high-income consumers.
RESULTS OF OPERATIONS
Nine Months Ended September 30
Results of operations - comparison of nine months ended September 30, 2011 to nine months ended September 30, 2010:
23
SALES
|
Nine months ended
September 30, 2011
|
Nine months ended
September 30, 2010
|
|||||||||||||||
|
Total
Sales
|
% of
Total Sales
|
Total
Sales
|
% of
Total Sales
|
|||||||||||||
|
Sales:
|
||||||||||||||||
|
New vehicles
|
$ | 106M | 77.7 | % | $ | 73M | 74.6 | % | ||||||||
|
Used vehicles
|
$ | 19M | 13.9 | % | $ | 16.5M | 16.9 | % | ||||||||
|
Parts and services and others
|
$ | 11.5M | 8.4 | % | $ | 8.3M | 8.5 | % | ||||||||
|
Total
|
$ | 136.5M | 100 | % | $ | 97.8M | 100 | % | ||||||||
Sales mainly consist of sales of new and used vehicles, and sales of parts and services for vehicle maintenance and repair.
Net sales for the nine months ended September 30, 2011 increased by approximately $38.7 million or 40% to approximately $136.5 million, compared with approximately $97.8 million over the same period of 2010. The increase was primarily attributable to increased sales of new and used vehicles.
New vehicles sales increased approximately $33 or 45.2% from approximately $73 million in the first nine months of 2010 to approximately $106 million in the same period of 2011, while the number of new vehicles sold increased 27.2% for the same period. Used vehicles sales increased approximately $2.5 million or 15.2% from approximately $16.5 million in first nine month of 2010 to approximately $19 million for the same period in 2011, while the quantity of used vehicles sold decreased 4.3% for the same period.
Parts and services sales for the first nine month of 2011 increased by approximately $3.2 million, or 38.6%, to approximately $11.5 million compared with approximately $8.3 million for the same period of 2010. The increase in parts and service sales was mainly attributable to the increase of delivery of Ferrari and Maserati cars to customers during the last few years, for which our parts and services were used to carry out maintenance and repairs.
COST OF SALES
Cost of sales for the nine months ended September 30, 2011 increased to approximately $117.4 million from approximately $84.2 million for the same period of 2010, an increase of $33.2 million or 39.4%, which was relatively consistent with the increase in Company’s revenues during the same period.
GROSS PROFIT
Gross profit margin for the nine months ended September 30, 2011 increased by 0.1% to 14% from 13.9% in the same period of 2010. Gross profit increased by approximately $5.5 million from approximately $13.6 million in the 2010 period to approximately $19.1 million for the nine months ended September 30, 2011.
Gross profit margin on sales of new vehicles for the nine months ended September 30, 2011 increased by 0.2% to 10.8% from 10.6% for the same period of 2010. Gross profit on sales of new vehicles increased by approximately $3.7 million, or 48.2%, from approximately $7.7 million in the same period of 2010 to approximately $11.4 million for the nine months ended September 30, 2011.
24
Gross profit margin on sales of used vehicles for the nine months ended September 30, 2011 decreased by 2.1% to 3% from 5.1% for the same period of 2010. Gross profit on sales of used vehicles decreased by approximately $288,000 from approximately $856,000 for the same period of 2010 to approximately $568,000 for the nine months ended September 30, 2011.
The increase in gross profit was mainly attributable to increased sales of new and parts and services which were positively impacted by the improvement in the economy in our markets and improvements in our capacity to service vehicles efficiently.
SELLING, GENERAL AND ADMINISTRATIVE EXPENSES
Selling, general and administrative expenses or “SG&A” expenses includes salaries and related staffing expenses, facilities rent, rates and building management fees, legal, accounting and professional services fees, general corporate expenses and marketing expenses.
SG&A for the nine months ended September 30, 2011 was approximately $17.7 million, compared to approximately $14.3 million for the same period of 2010. The approximate $3.4 million increase in SG&A expenses was primarily due to increased marketing expenses and rental expenses.
Our marketing expenses increased from approximately $1.2 million for the nine months ended September 30, 2010 to $3 million for the same period of 2011. This was mainly due to expenditures relating to an event held in Hong Kong during June 2011 for the launch of a new Ferrari model “FF” along with several other promotion events held in the second quarter of 2011 in both Hong Kong and PRC, including the Ferrari California test drive days. Our rent, rates and building management fees increased from approximately $2.8 million for the nine months ended September 30, 2010 to $3.5 million for the same period of 2011.
OTHER EXPENSES, NET
Other expenses for the nine months ended September 30, 2011 increased to approximately $297,000 compared to other income of approximately $705,000 for the same period of 2010, a total increase of $1,002,000. The increase was primarily due to a decrease in other operating income and an increase in interest expenses and other finance costs. Other operating income was comprised of commission income, exchange gain and forfeitures of sales deposits. Such income decreased from $1,330,000 for the nine months ended September 30, 2010 to $793,000 for the same period of 2011 and was mainly due to decreased commission income, subsidies from supplier and forfeitures of sale deposits of $1,159,000 for the nine months ended September 30, 2010 to approximately $503,000 for the same period of 2011. Interest expenses and other finance costs increased from approximately $625,000 for the nine months ended September 30, 2010 to approximately $1,090,000 for the same period of 2011. This was mainly due to the expansion of the new vehicles trading business especially in the two PRC dealerships.
Three Months Ended September 30
Results of operations - comparison of three months ended September 30, 2011 to three months ended September 30, 2010:
25
SALES
|
Three months ended
September 30, 2011
|
Three months ended
September 30, 2010
|
|||||||||||||||
|
Total
Sales
|
% of
Total Sales
|
Total
Sales
|
% of
Total Sales
|
|||||||||||||
|
Sales:
|
||||||||||||||||
|
New vehicles
|
$ | 38.5M | 82.6 | % | $ | 28.8M | 77 | % | ||||||||
|
Used vehicles
|
$ | 4.7M | 10.1 | % | $ | 5.7M | 15.2 | % | ||||||||
|
Parts and services and others
|
$ | 3.4M | 7.3 | % | $ | 2.9M | 7.8 | % | ||||||||
|
Total
|
$ | 46.6M | 100 | % | $ | 37.4M | 100 | % | ||||||||
Sales mainly consist of sales of new and used vehicles, and sales of parts and services for vehicle maintenance and repair.
Net sales for the three months ended September 30, 2011 increased by approximately $9.2 million or 24.6% to approximately $46.6 million, compared with approximately $37.4 million over the same period of 2010. The increase was primarily attributable to increased sales of new vehicles.
New vehicles sales increased approximately $9.7 or 33.7% from approximately $28.8 million in the third quarter of 2010 to approximately $38.5 million in the same period of 2011, while the number of new vehicles sold increased 17% for the same period. Used vehicles sales decreased approximately $1 million or 17.5% from approximately $5.7 million in third quarter of 2010 to approximately $4.7 million for the same period in 2011, while the quantity of used vehicles sold decreased 29.4% for the same period.
Parts and services sales for the third quarter of 2011 increased by approximately $0.5 million, or 17.2%, to approximately $3.4 million compared with approximately $2.9 million for the same period of 2010. The increase in parts and service sales was mainly attributable to the increase of delivery of Ferrari and Maserati cars to customers during the last few years, for which our parts and services were used to carry out maintenance and repairs.
COST OF SALES
Cost of sales for the three months ended September 30, 2011 increased to approximately $40.7 million from approximately $31.9 million for the same period of 2010, an $8.8 million or 27.6% increase, which was relatively consistent with the increase in the Company’s revenues during the same period.
GROSS PROFIT
Gross profit margin for the three months ended September 30, 2011 decreased by 2.1% to 12.6% from 14.7% in the same period of 2010. Gross profit increased by approximately $0.4 million from approximately $5.5 million in the 2010 period to approximately $5.9 million for the three months ended September 30, 2011.
Gross profit margin on sales of new vehicles for the three months ended September 30, 2011 decreased by 1.9% to 9.9% from 11.8% for the same period of 2010. Gross profit on sales of new vehicles increased by approximately $0.4 million, or 11.3%, from approximately $3.4 million in the same period of 2010 to approximately $3.8 million for the three months ended September 30, 2011.
26
Gross profit margin on sales of used vehicles for the three months ended September 30, 2011 decreased by 4.7% to negative 0.6% from 4.1% for the same period of 2010. Gross profit on sales of used vehicles decreased by approximately $260,000 from approximately $234,000 for the same period of 2010 to approximately negative $26,000 for the three months ended September 30, 2011.
The increase in gross profit was mainly attributable to increased sales of new and parts and services which were positively impacted by the improvement in the economy in our markets and improvements in our capacity to service vehicles efficiently.
SELLING, GENERAL AND ADMINISTRATIVE EXPENSES
Selling, general and administrative expenses or “SG&A” expenses includes salaries and related staffing expenses, facilities rent, rates and building management fees, legal, accounting and professional services fees, general corporate expenses and marketing expenses.
SG&A for the three months ended September 30, 2011 was approximately $7 million, compared to approximately $5.2 million for the same period of 2010. The approximate $1.8 million increase in SG&A expenses was primarily due to increased marketing expenses and rental expenses.
Our marketing expenses increased from approximately $0.6 million for the three months ended September 30, 2010 to $1.6 million for the same period of 2011. This was mainly due to several promotion events held in the third quarter of 2011 in both Hong Kong and PRC. Our rent, rates and building management fees increased from approximately $1 million for the three months ended September 30, 2010 to $1.4 million for the same period of 2011.
OTHER EXPENSES, NET
Other expenses for the three months ended September 30, 2011 increased to approximately $37,000 compared to approximately $9,000 for the same period of 2010, a total increase of $28,000. The increase was primarily due to an increase in interest expenses and other finance costs. Interest expenses and other finance costs increased from approximately $244,000 for the three months ended September 30, 2010 to approximately $373,000 for the same period of 2011. This was mainly due to the expansion of the new vehicles trading business especially in the two PRC dealerships. Other operating income was comprised of commission income, exchange gain and forfeitures of sales deposits. Such income increased from $235,000 for the three months ended September 30, 2010 to $336,000 for the same period of 2011.
NONCONTROLLING INTERESTS
Noncontrolling interests for the periods presented represent outside ownership interests in subsidiaries that are consolidated with the parent for financial reporting purposes.
INCOME TAX
Income tax expenses increased to approximately $103,000 in the first nine months of 2011 from a tax credit of approximately $10,000 in the same period of 2010. The increase in tax expenses in 2011 was due to the improved result from the motor business.
27
FINANCIAL CONDITION, LIQUIDITY AND CAPITAL RESOURCES
As indicated in the table below, at December 31, 2010 and September 30, 2011, we had approximately $12.5 million and $9 million of cash and cash equivalents, restricted cash respectively, and approximately $13.7 million and $21.3 million of debt, respectively. Debt at September 30, 2011 was approximately $21.3 million of short-term debt, comprised of approximately $8.5 million of bank borrowings, approximately $12.3 million in stocking loans and approximately $0.5 million of unsecured bank borrowings. All of our stocking loans are provided by banks. The increases in short-term debt have been used for general working capital purposes.
|
2011
|
2010
|
|||||||
|
September 30
|
December 31
|
|||||||
|
Total Debt
|
$ | 21,324,028 | $ | 13,740,395 | ||||
|
Less: Cash and cash Equivalents, Restricted cash
|
9,028,649 | 12,494,809 | ||||||
|
Net Debt
|
$ | 12,295,379 | $ | 1,245,586 | ||||
Cash and cash equivalents, restricted cash at September 30, 2011 totaled approximately $9 million, with cash flows from financing activities of approximately $8.4 million. At December 31, 2010, cash and cash equivalents, restricted cash totaled approximately $12.5 million, with cash flows from financing activities of approximately $75,000. Cash balances were lower due to the cash flow used in the operating activities of approximately $3.5 million. We have sufficient liquidity to meet currently anticipated needs, including capital expenditures and working capital requirements.
Included in our current liabilities at September 30, 2011 of approximately $24.9 million were non-refundable customer deposits. Our long term liquidity needs are met through funds generated from our normal course of operations, including the deposits placed in advance by our customers in order to secure their new car orders. These deposits are recorded as income upon delivery of the car to and acceptance of the car by the customer.
Several of our assets and liabilities, including cash and short-term debt, can fluctuate significantly from month to month depending on short-term liquidity needs. Working capital (defined as current assets minus liabilities) totaled $7,000 of current liabilities in excess of current assets at September 30, 2011 and $0.6 million of current liabilities in excess of current assets at December 31, 2010. The increase in working capital was due to our increased sales.
CASH FLOWS FROM OPERATING ACTIVITIES
Our operations utilizing cash resources of approximately $10,352,000 for the nine months ended September 30, 2011, compared to generating cash resources of approximately $1,378,000 for the same period in 2010, primarily as a net result of the following:
|
|
(i)
|
For the nine months ended September 30, 2011, cash flow provided by sales net of operating expenses increased by approximately $998,000 to approximately $2,692,000. The increase was primarily a result of the increase in sales of new and used vehicles.
|
28
|
|
(ii)
|
For the nine months ended September 30, 2011, accounts receivable decreased by approximately $3,165,000, primarily due to the collection of receivables relating to the sales recognized in previous quarter.
|
|
|
(iii)
|
For the nine months ended September 30, 2011, our inventory increased by approximately $8,877,000. The increase was consistent with increased delivery from the manufacturers of new vehicles which is consistent with our business growth.
|
|
(iv)
|
For the nine months ended September 30, 2011, the increase or decrease of various current operating assets and liabilities included in the aforementioned items resulted in an aggregate increase of cash outflow from operations of approximately $13,044,000.
|
CASH FLOWS FROM INVESTING ACTIVITIES
For the nine months ended September 30, 2011, we expended net cash of approximately $5,464,000 in investing activities mainly for the acquisition of property and equipment to support the growth of our business and the increase in restricted cash. For the nine months ended September 30, 2010, we utilized approximately $2,523,000 for investing activities, mainly for acquisition of property and equipment to support the development of our vehicle sales business.
CASH FLOWS FROM FINANCING ACTIVITIES
For the nine months ended September 30, 2011, we made new net drawdowns in borrowings amounting to approximately $7,155,000 and received approximately $1,201,000 in net advances from affiliates. For the nine months ended September 30, 2010, we repaid approximately $1,795,000 of our obligations owed on outstanding debt and received approximately $2,388,000 in net advances from affiliates. The advances from/to affiliates were made from/to entities that are under common management, where Mr. Richard Man Fai Lee, the Company’s Chairman, Chief Executive Officer and President, is the common director of the Company and the affiliates. These advances are non-interest-bearing.
WORKING CAPITAL REQUIREMENTS
Current liabilities exceeded current assets at September 30, 2011 by approximately $7,000 and $0.6 million of current liabilities in excess of current assets at December 31, 2011. The ratio of our current assets to our current liabilities was 0.999 to 1 at September 30, 2011 and 0.989 to 1 at December 31, 2010. At September 30, 2011, our current assets of approximately $58,228,000 included approximately $25,139,000 in inventory that was funded by our operating cash flow and trade finance facilities, all of which are provided by banks and may include letters of credit, invoice financing, trust receipt loans and stocking loans. Our current liabilities of approximately $58,235,000 include non-refundable customer deposits. Given the exclusive nature and extremely limited production of Ferrari and Maserati cars, our customers are willing to place material deposits in advance in order to secure their new car orders. This resulted in customer deposits of approximately $24,911,000.
SEASONALITY
Our business is modestly seasonal. Our operations generally experience higher volumes of vehicle sales in the fourth quarter of each year, due in part to manufacturers’ production and delivery patterns.
29
CURRENCY CONVERSION AND FLUCTUATION IN FOREIGN EXCHANGE RATES
The value of Renminbi (“RMB”), the Hong Kong Dollar and the Macau Pataca against the U.S. dollar and other currencies may fluctuate and is affected by, among other things, changes in political and economic conditions. Since 1994, the conversion of RMB into foreign currencies, including Hong Kong and U.S. dollars, has been based on rates set by the People’s Bank of China, or PBOC, which are set daily based on the previous day’s PRC interbank foreign exchange market rate and current exchange rates on the world financial markets. Since 1994, the official exchange rate for the conversion of RMB to U.S. dollars has generally been stable.
On July 21, 2005, however, PBOC announced a reform of its exchange rate system. Under the reform, RMB is no longer effectively linked to US dollars but instead is allowed to trade in a tight band against a basket of foreign currencies. On June 19, 2010, PBOC announced that it would allow a more flexible exchange rate for RMB without mentioning specific policy changes, although it ruled out any large-scale appreciation. It is difficult to predict how long the current situation may last and when and how RMB exchange rates may change going forward. The reporting and functional currency of the Company is the U.S. dollar. However, the functional currency of our operating subsidiaries is the RMB and the Hong Kong dollar and substantially all their revenues and expenses are denominated in those currencies. Substantially all of our sales contracts are denominated in RMB or Hong Kong dollars and substantially all of our costs and expenses are denominated in Euros, Hong Kong dollars and RMB.
If the RMB were to increase in value against the U.S. dollar, mainland Chinese consumers would experience a reduction in the relative prices of goods and services, which may translate into a positive increase in sales. On the other hand, a decrease in the value of the RMB against the dollar would have the opposite effect and may adversely affect our results of operations. Any significant revaluation of RMB may materially and adversely affect our cash flows, revenues, earnings and financial position. For example, an appreciation of RMB against the U.S. or Hong Kong dollars would make any new RMB-denominated investments or expenditures more costly to us, to the extent that we need to convert U.S. dollars or Hong Kong dollars into RMB for such purposes. In addition, a strengthening of the U.S. dollar against the Hong Kong dollar or the Macau pataca, if it occurred, would adversely affect the value of our common stock.
We have engaged in limited hedging to reduce our exposure to exchange rate fluctuations. While we may decide to enter into hedging transactions in the future, the availability and effectiveness of these hedges may be limited and we may not be able to adequately hedge our exposure or at all.
OFF-BALANCE SHEET ARRANGEMENTS
We do not have any off-balance sheet arrangements that have or are reasonably likely to have a material current or future effect on our financial condition, changes in financial condition, revenues or expenses, results of operations, liquidity, capital expenditures or capital resources.
30
CRITICAL ACCOUNTING POLICIES
In preparing our financial statements, we make estimates, assumptions and judgments that can have a significant effect on our revenues, income or loss from operations, and net income or net loss, as well as on the value of certain assets on our balance sheet. We believe that there are several accounting policies that are critical to an understanding of our historical and future performance as these policies affect the reported amounts of revenues, expenses, and significant estimates and judgments applied by management. While there are a number of accounting policies, methods and estimates affecting our financial statements, the following policies are considered critical. In addition, you should refer to our accompanying condensed consolidated balance sheet as of September 30, 2011 and the condensed consolidated statements of operations for the six months ended September 30, 2011 and 2010, and the related notes thereto, for further discussion of our accounting policies.
Trade receivables and provision for bad debts
Trade receivables, net of provision for bad debts, are concentrated with the receivables from customers. We periodically record a provision for bad debts based on our evaluation of the collectability of trade receivables by assessing, among other factors, our customer’s willingness or ability to pay, repayment history, general economic conditions, and the ongoing relationship with our customers. The total amount of this provision is determined by first identifying the receivables of customers that are considered to be a higher credit risk based on their current overdue accounts, difficulties in collecting from these customers in the past, and their overall financial condition to the extent such information is available. For each of these customers, we estimate the extent to which the customer will be able to meet its financial obligation and record a provision that reduces our trade receivables for that customer to the amount that we reasonably believe will be collected. Additional provisions may be required in the future if the financial condition of our customers or general economic conditions deteriorate, thereby reducing net earnings. The uncertainties associated with these methods, assumptions and estimates, including the estimated provisions, have not had and are not expected to have a material impact on the financial condition and operating performance of the Company or on the comparability of the reported information for the periods presented, as historically our provisions for bad debts have been sufficient to cover actual credit losses, and we believe that the provisions recorded at the balance sheet dates are sufficient. The allowance for doubtful accounts at September 30, 2011 was $13,078. Provision for bad debts, if any, resulting from the abovementioned assessment, would be reflected in loss before non-controlling interest and income taxes in our Consolidated Statement of Operations.
Inventory, net
Inventory consists primarily of new and used vehicles held for sale, and vehicle parts and accessories, and are stated at the lower of cost or market. The new and used vehicles are valued using the specific identification method and the costs include acquisition and transportation expenses. The value of the parts and accessories are valued at the first-in, first-out method and are stated at the lower of cost or market. Fashion apparel inventory is valued at the first-in, first-out method and is stated at the lower of cost or market. Write-down of potentially obsolete or slow-moving inventory is recorded based on our analysis of inventory levels and assessment of estimated obsolescence based upon assumptions about future demand and market conditions. Historically our actual physical inventory count results have shown our estimates of write-down of potentially obsolete or slow-moving inventory to be reliable. However, additional provisions may be required in the future if general economic conditions deteriorate, thereby reducing net earnings. Provision, if any, would be reflected in loss before non-controlling interest and income taxes in our Consolidated Statement of Operations.
The uncertainties associated with these methods, assumptions and estimates with regard to the Company’s reported inventory, including the estimated provisions, have not had and are not expected to have a material impact on the financial condition and operating performance of the Company or on the comparability of the reported information for the periods presented, as historically the actual results have not differed materially from the estimates. The likelihood of any material changes in inventory losses or markdowns is dependent on customer demand or new product introductions that vary from current expectations. The Company believes that any changes in these factors are not reasonably likely to occur and hence not reasonably likely to have a material impact on the Company’s financial results.
31
Share-based compensation
We have adopted ASC 718 “Compensation-Stock Compensation” for our share-based compensation. We utilized the modified prospective method approach, pursuant to which we record compensation for all share-based awards granted based on their fair value. The estimate of the fair value of the share-based compensation requires the input of subjective assumptions. Changes in the subjective assumptions could materially affect the estimate of fair value of share-based compensation; however, based on an analysis using changes in certain assumptions that could be reasonably possible in the near term, we believe the effect on the share-based compensation recognized would not have been material.
Share-based compensation expense is based on awards that are ultimately expected to vest. We evaluate the assumptions used to value our awards and if factors change, we employ different assumptions. If there are any modifications or cancellations of the underlying unvested securities, we may be required to accelerate, increase or cancel any remaining unearned share-based compensation expense. Future share-based compensation expense and unearned share-based compensation will increase to the extent that we grant additional equity awards to employees. Share-based compensation expense, if any, would be reflected in loss before non-controlling interest and income taxes in our Consolidated Statement of Operations.
Revenue recognition
Revenue consists of sales of new and used vehicles, vehicle maintenance and repair services, and sales of vehicle parts and sales of fashion apparel. Revenues from the following components are recognized as follows:
|
|
(i)
|
Sales of new and used vehicles are recognized when the vehicle’s title has passed to the customer.
|
|
|
(ii)
|
Sales of fashion apparel and accessories are recognized when the products have been delivered to and title has passed to the customer.
|
|
|
(iii)
|
Sales of vehicle parts are recognized when the parts have been delivered to the customer and title has passed.
|
|
(iv)
|
Vehicle maintenance and repair income is recognized when services are fully rendered.
|
Impairment of long-lived assets
We evaluate long-lived assets, including property and equipment, for impairment when events and circumstances exist that indicate that the carrying amount of these assets may not be recoverable. Recoverability of assets is measured by comparing the carrying amount of an asset to the estimated undiscounted future cash flows expected to be generated by the use of the asset. The undiscounted cash flows are subject to estimations and assumptions made by us. If the estimated undiscounted cash flows change in the future, we may be required to reduce the carrying amount of an asset. Impairment of assets, if any, as a result of the impairment testing, would be reflected in loss before non-controlling interest and income taxes in our Consolidated Statement of Operations.
32
Income taxes
We are required to estimate income tax provisions and amounts ultimately payable or recoverable in numerous jurisdictions, including Hong Kong. We account for income taxes under the provision of ASC 740 “Income Taxes”, resulting in two components of income tax expenses: current and deferred. Current income tax expense approximates taxes to be paid or refunded for the relevant periods. Deferred income tax expense results from changes in deferred tax assets and liabilities between periods. Deferred income tax assets and liabilities are computed for differences between the financial statements carrying amounts and the tax bases of existing assets and liabilities that will result in taxable or deductible amounts in the future, as well as from net operating loss and tax credit carryforwards, and are measured in accordance with the enacted tax laws and at the rates applicable in the years in which the differences are expected to be recovered or settled. A deferred tax asset is recognized if it is more likely than not that a benefit will be realized. Otherwise, we will record a valuation allowance when the utilization of the deferred tax asset is uncertain. Additional timing differences, future earnings trends and/or tax strategies could warrant a need for establishing an additional valuation allowance or a reserve. If the Company’s estimate of tax liabilities proves to be less than the ultimate assessment, an additional charge to expense would result. If payment of these amounts proves to be less than the recorded amounts, the reversal of the liabilities would result in tax benefits being recognized in the period when the Company determines the liabilities are no longer necessary.
Contingencies
From time to time, we are involved in disputes, litigation and other legal proceedings. We record a charge equal to at least the minimum estimated liability for a loss contingency when both of the following conditions are met: (i) information available prior to issuance of the financial statements indicates that it is probable that an asset had been impaired or a liability had been incurred at the date of the financial statements, and (ii) the range of loss can be reasonably estimated. The estimates affecting the Company’s loss contingency reserves can be affected by new claims filed after the balance sheet date with respect to events occurring prior to the balance sheet date and developments in pending litigation that may affect the outcome of the litigation. As such, the Company is unable to make a reasonable estimate of the sensitivity to change of estimates affecting its litigation reserves. As additional information becomes available, the Company assesses the potential liability related to the pending litigation and revises its estimates as appropriate. While the Company believes the recorded liabilities are adequate, there are inherent limitations in the estimation process whereby actual losses may exceed estimated losses. Currently, we have no outstanding legal proceedings or claims that require a loss contingency.
Item 3. Quantitative and Qualitative Disclosures about Market Risk.
Not applicable to smaller reporting companies.
33
Controls and Procedures
As of September 30, 2011, we carried out an evaluation, under the supervision and with the participation of our management, including our chief executive officer and chief financial officer, of the effectiveness of the design and operation of our “disclosure controls and procedures,” as such term is defined under Exchange Act Rules 13a-15(e) and 15d-15(e).
Based on this evaluation, our chief executive officer and chief financial officer concluded that, as of September 30, 2011, such disclosure controls and procedures were effective to ensure that information required to be disclosed by us in the reports we file or submit under the Exchange Act is recorded, processed, summarized and reported within the time periods specified in the rules and forms of the SEC, and accumulated and communicated to our management, including our chief executive officer and chief financial officer, as appropriate to allow timely decisions regarding required disclosure.
In designing and evaluating the disclosure controls and procedures, our management recognized that any controls and procedures, no matter how well designed and operated, can provide only reasonable assurance of achieving the desired control objectives, and in reaching a reasonable level of assurance our management necessarily was required to apply its judgment in evaluating the cost-benefit relationship of possible controls and procedures.
Changes in Internal Control Over Financial Reporting
There were no changes in our internal controls over financial reporting during the quarter ended September 30, 2011 that materially affected, or are reasonably likely to materially affect, our internal controls over financial reporting.
34
PART II - OTHER INFORMATION
This Item should be read in conjunction with Notes 8 and 9 to our Condensed Consolidated Financial Statements (Unaudited) as of September 30, 2011.
Addison-Davis Litigation
On or about December 1, 2009, we were made aware that the Company had been named as a co-defendant in a state court action, Addison-Davis Diagnostics, Inc. v. Edward W. Withrow, III, et al., California Superior Court, Ventura County, Case No. 56-2009-00361702-CU-FR-VTA. Formal service was effected on April 28, 2010. In the action, the plaintiff, which is the former parent company of China Premium, alleges that the plaintiff’s former chief executive officer, with the assistance of certain other third parties, engaged in multiple fraudulent transactions involving the plaintiff and the plaintiff’s securities between 2004 and 2006. As a result of such alleged conduct, the plaintiff alleges that the plaintiff’s former chief executive officer was able to fraudulently obtain shares of the plaintiff’s common stock and certain of the plaintiff’s assets. The plaintiff alleges that as a result of such alleged conduct, the plaintiff was forced to seek bankruptcy protection in September, 2006. In a hearing held May 14, 2010, the court ruled that certain parties’ motions to dismiss the plaintiff’s complaint were granted with leave to the plaintiff to amend its complaint within 30 days. The plaintiff filed a first amended complaint in June 2010, to which the Company brought a demurrer, which was sustained by the court with leave to amend. The plaintiff then filed a second amended complaint on November 15, 2010. In the second amended complaint, the plaintiff named the Company as a co-defendant in seven of the thirteen causes of action, including claims for fraud, negligent misrepresentation, conversion (two claims), constructive trust, unjust enrichment and an accounting. The Company filed a demurrer challenging all claims asserted against it in the second amended complaint. Pursuant to an order dated February 7, 2011, the court sustained the Company’s demurrer to the plaintiff’s second amended complaint on all counts, without leave to amend. A judgment of dismissal was entered by the court on March 9, 2011. On March 10, 2011, a notice of entry of judgment was served on all parties to the action. Plaintiff had 60 days following service of the notice of entry of judgment to file a notice of appeal with the court. That deadline passed without the Company being served with a timely notice of appeal. As such, as to the Company, this action has been fully resolved in the Company’s favor.
In the ordinary course of its business, and other than as set forth above or as described in the notes to our consolidated financial statements, we and our subsidiaries may be involved from time to time in various pending or threatened legal proceedings, arising from the conduct of business. After consultation with legal counsel and a review of available facts, it is management’s opinion that these proceedings, after consideration of any reserves and rights to indemnification, ultimately will be resolved without materially affecting our consolidated financial position. However given the indeterminate amounts that may be sought in these proceedings and the inherent difficulty in predicting the outcome of such legal proceedings, including the proceeding described above, it is possible that an adverse outcome in certain matters could be material to our operating results for any particular reporting period.
Item 1A. Risk Factors.
Not applicable to smaller reporting companies.
35
Item 2. Unregistered Sales of Equity Securities and Use of Proceeds.
This Item should be read in conjunction with Notes 8 and 9 to the consolidated financial statements included in this Report.
As previously disclosed in our Current Report on Form 8-K filed with the SEC on March 5, 2010, on March 1, 2010, in connection with the settlement of the Federal Court Action, Bern Noble agreed to return to us for cancellation 1,210,631 shares of common stock. We also agreed to replace the shares with an equal number of new shares of common stock in consideration of services rendered to us in 2006 in connection with the closing of the Amended Share Exchange Agreement. We delivered the replacement shares in nine monthly installments. The shares were issued in reliance on an exemption from registration pursuant to Section 4(2) of the Securities Act of 1933, as amended, and Rule 506 of Regulation D thereunder.
Item 3. Defaults Upon Senior Securities.
Item 4. (Removed and Reserved).
Item 5. Other Information.
Not applicable.
36
Item 6. Exhibits.
|
Exhibit
No.
|
Description
|
|
|
31.1
|
Certification of Chief Executive Officer pursuant to Rule 15D-15 of the Securities Exchange Act of 1934, as adopted pursuant to Section 302 of the Sarbanes-Oxley Act of 2002, filed herewith.
|
|
|
31.2
|
Certification of the Chief Financial Officer pursuant to Rule 15D-15 of the Securities Exchange Act of 1934, as adopted pursuant to Section 302 of the Sarbanes-Oxley Act of 2002, filed herewith.
|
|
|
32.1
|
Certification of Chief Executive Officer and Chief Financial Officer Pursuant to 18 U.S.C. Section 1350 (Section 906 of the Sarbanes-Oxley Act of 2002), filed herewith.
|
|
|
101+(**)
|
|
The following materials from the Company’s Quarterly Report on Form 10-Q for the quarter ended September 30, 2011, filed on November 14, 2011 formatted in Extensible Business Reporting Language (XBRL):
(i) Condensed Consolidated Balance Sheets (Unaudited)
(ii) Condensed Consolidated Statements of Operations (Unaudited)
(iii) Condensed Consolidated Statements of Cash Flows (Unaudited)
(iv) Notes to Condensed Consolidated Financial Statements
|
(**) Furnished with this Quarterly Report on Form 10-Q and included in Exhibit 101 to this Report are the following documents formatted in XBRL (Extensible Business Reporting Language): (i) the Condensed Consolidated Balance Sheets as of September 30, 2011 and December 31, 2010, (ii) Condensed Consolidated Statements of Operations for the three months and nine months ended September 30, 2011 and 2010 and (iii) the Condensed Consolidated Statements of Cash Flows for the nine months ended September 30, 2011 and 2010. Users of the XBRL data are advised that pursuant to Rule 406T of Regulation S-T, this interactive data file is deemed not filed or part of a registration statement or prospectus for purposes of sections 11 or 12 of the Securities Act of 1933, is deemed not filed for purposes of section 18 of the Securities and Exchange Act of 1934, and therefore is not subject to liability under those sections.
37
SIGNATURES
Pursuant to the requirements of the Securities Exchange Act of 1934, the registrant has duly caused this report to be signed on its behalf by the undersigned thereunto duly authorized.
|
CHINA PREMIUM LIFESTYLE ENTERPRISE, INC.,
|
|||
|
a Nevada corporation
|
|||
|
Date: November 15, 2011
|
By:
|
/s/ Richard Man Fai LEE
|
|
|
Richard Man Fai LEE
|
|||
|
Chief Executive Officer
|
|||
|
Date: November 15, 2011
|
By:
|
/s/ Joseph Tik Tung WONG
|
|
|
Joseph Tik Tung WONG
|
|||
|
Chief Financial Officer, Treasurer and Secretary
|
|||
38