Attached files
| file | filename |
|---|---|
| 8-K - RAMCO-GERSHENSON PROPERTIES TRUST 8-K - RPT Realty | a50067682.htm |
Exhibit 99.1
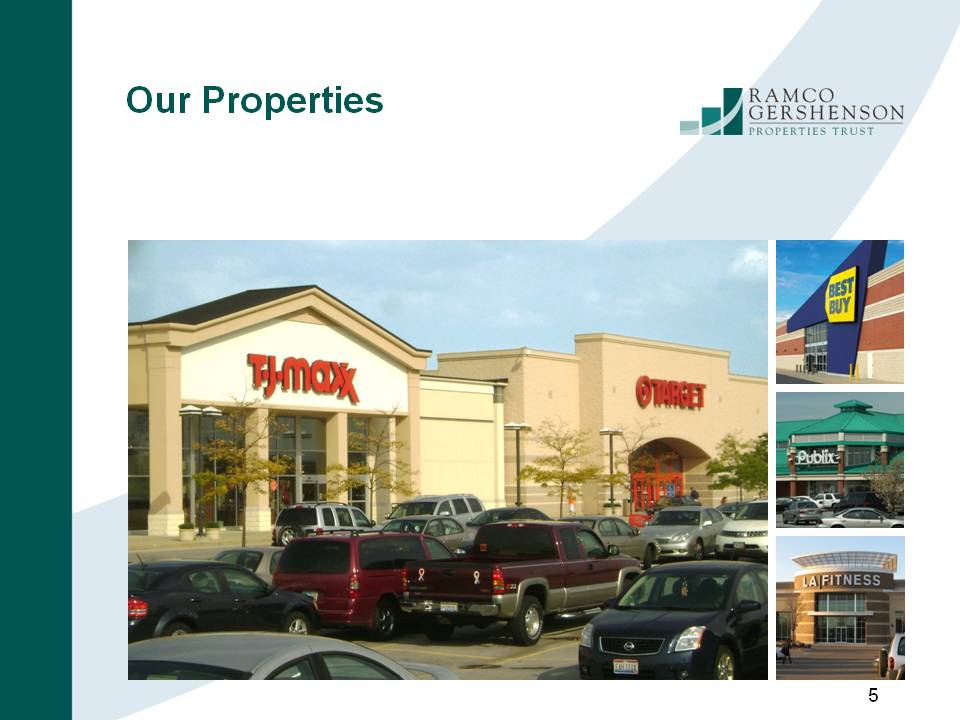
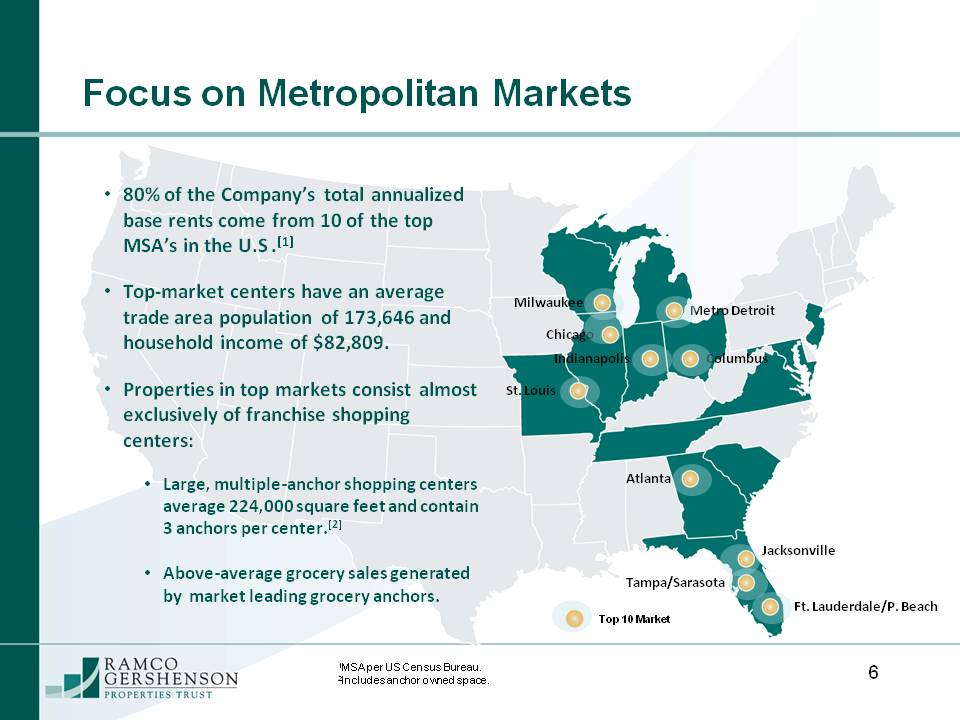
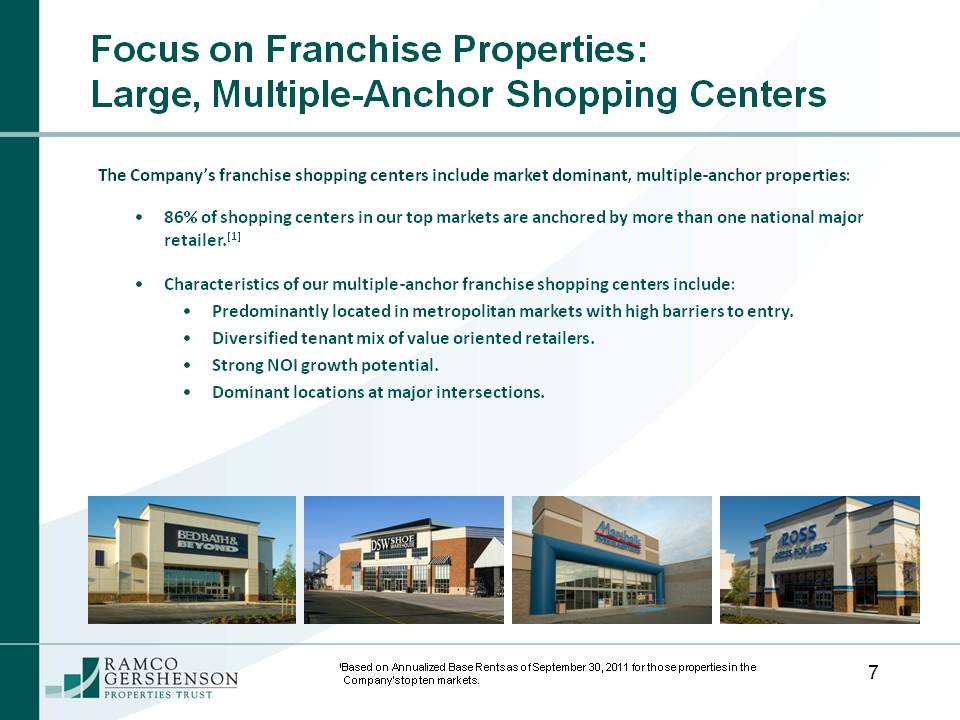
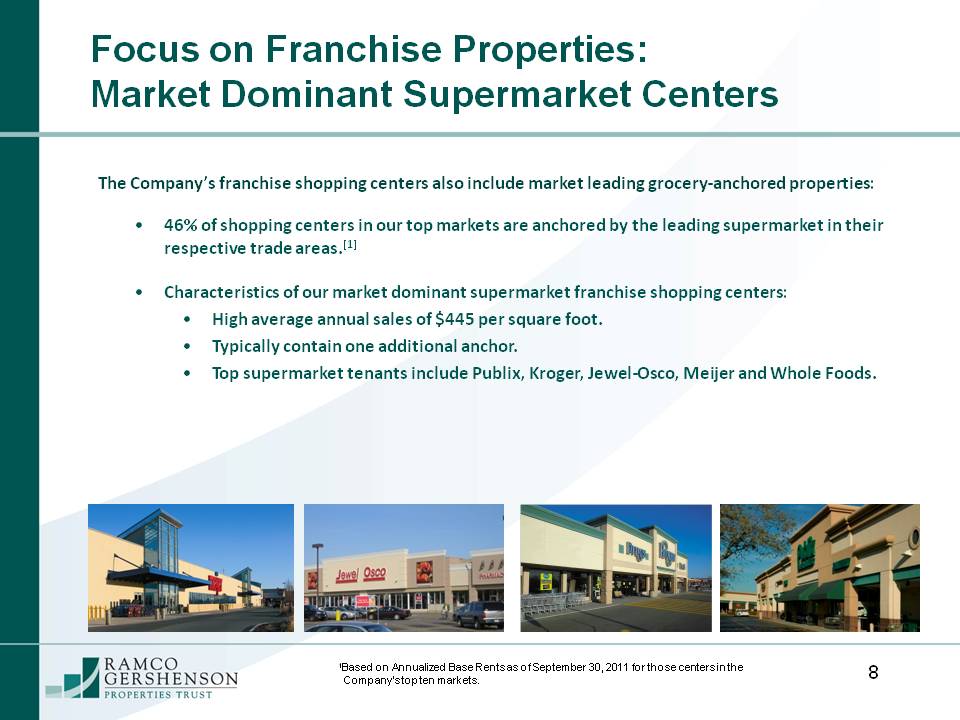
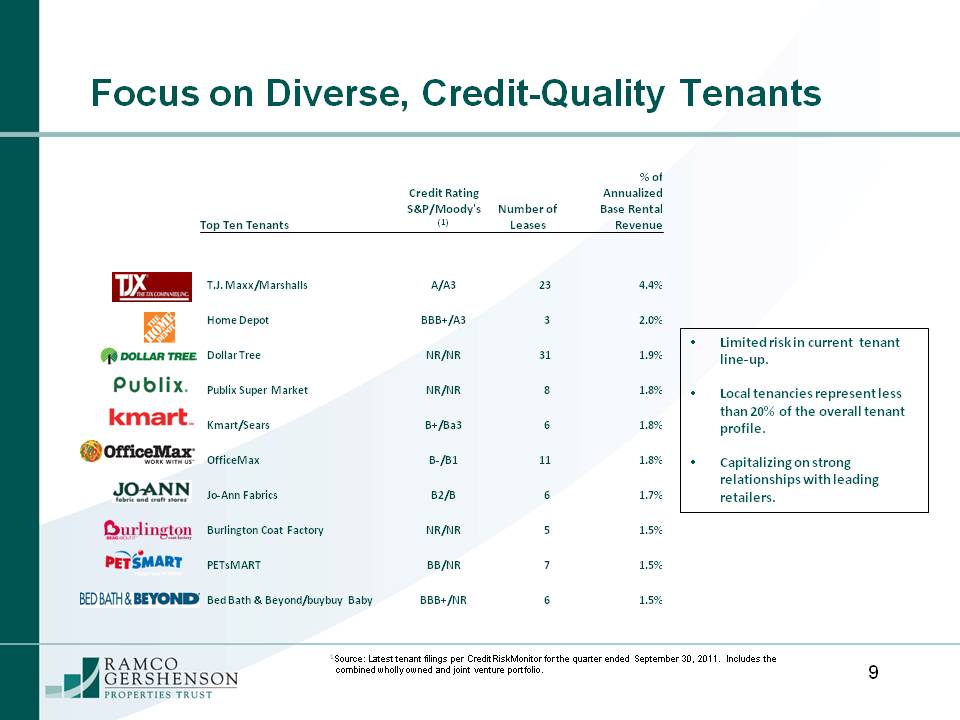
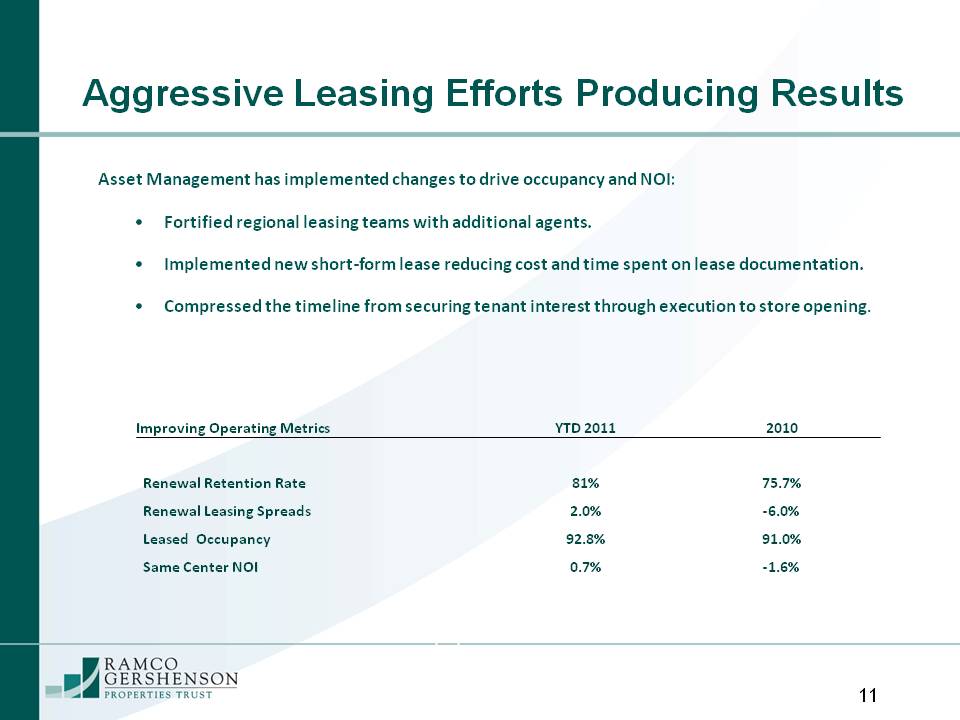
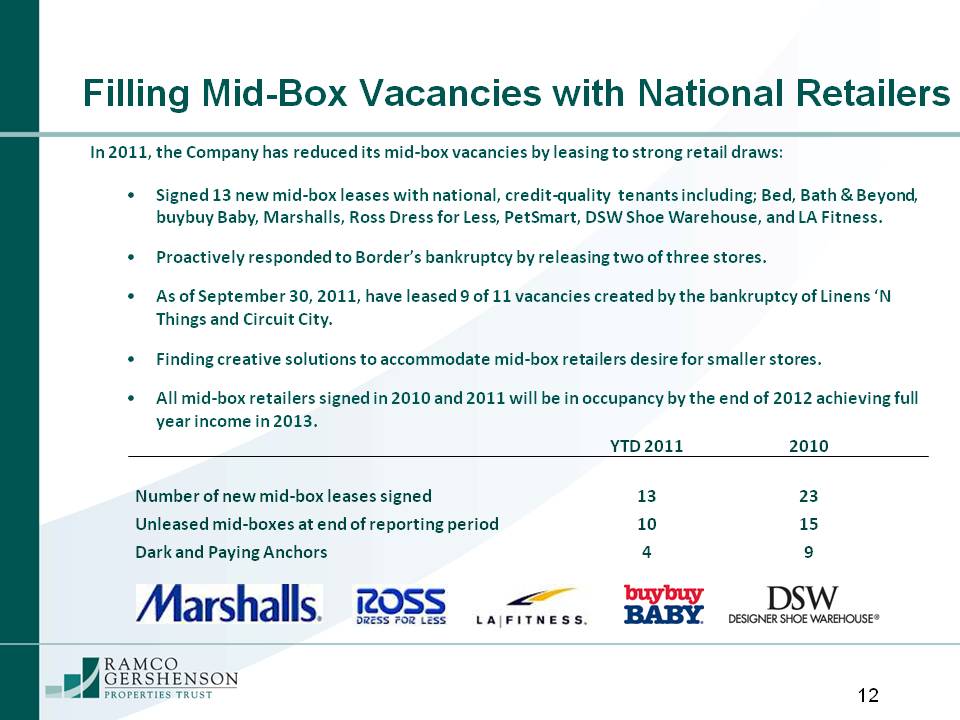
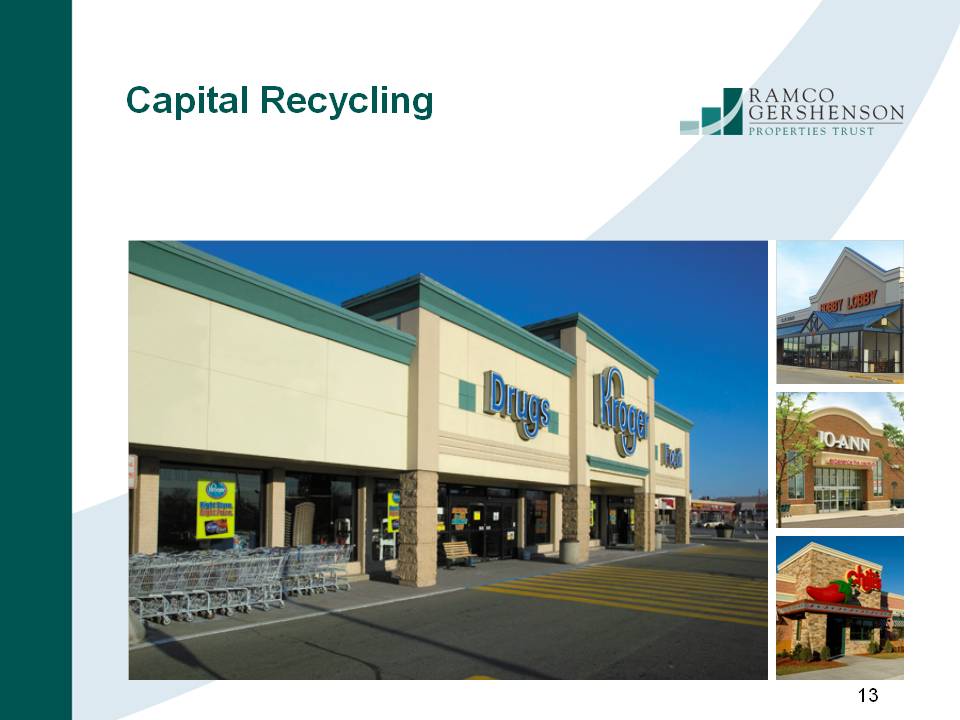
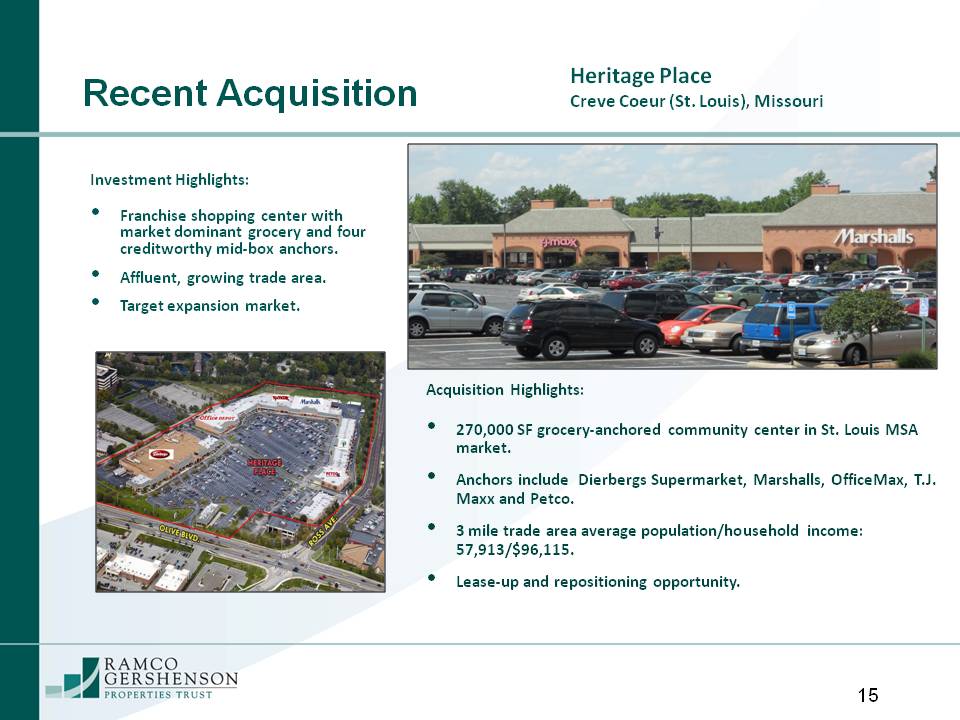
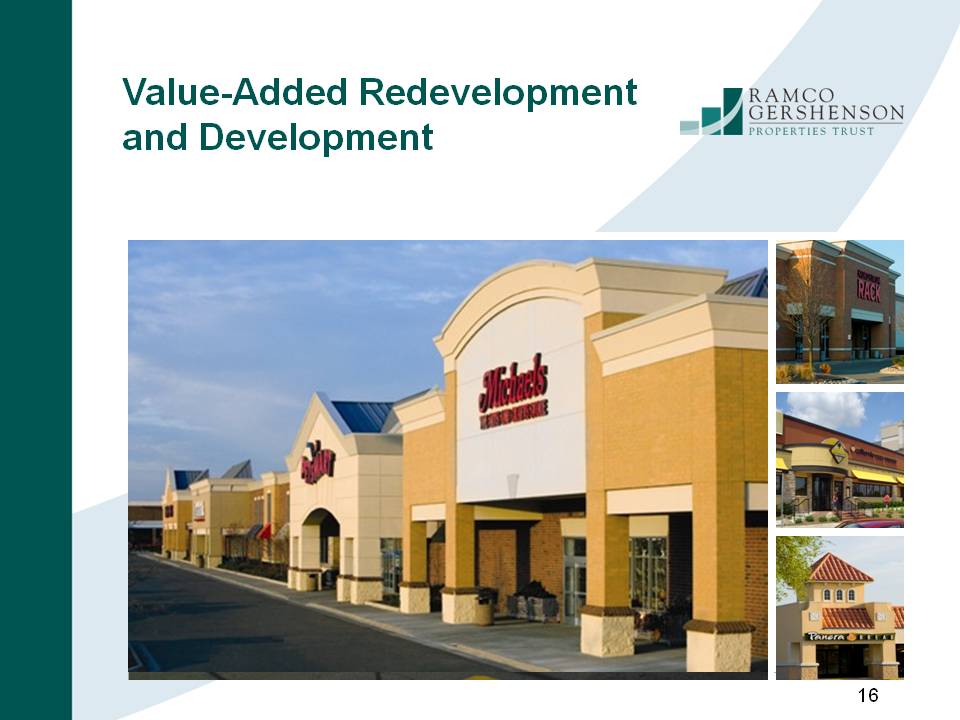
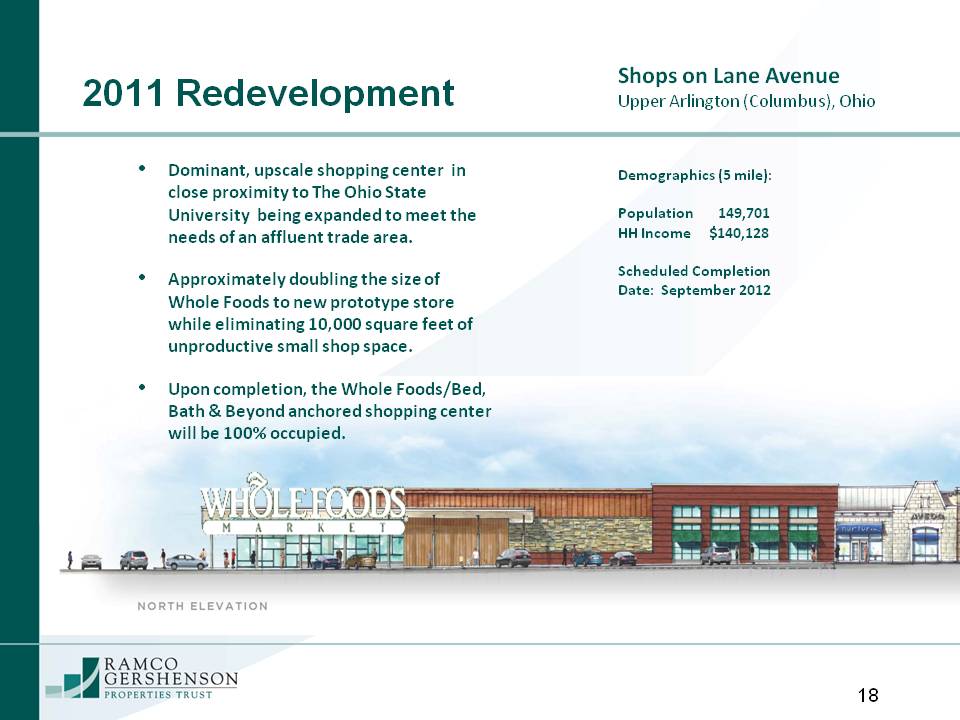
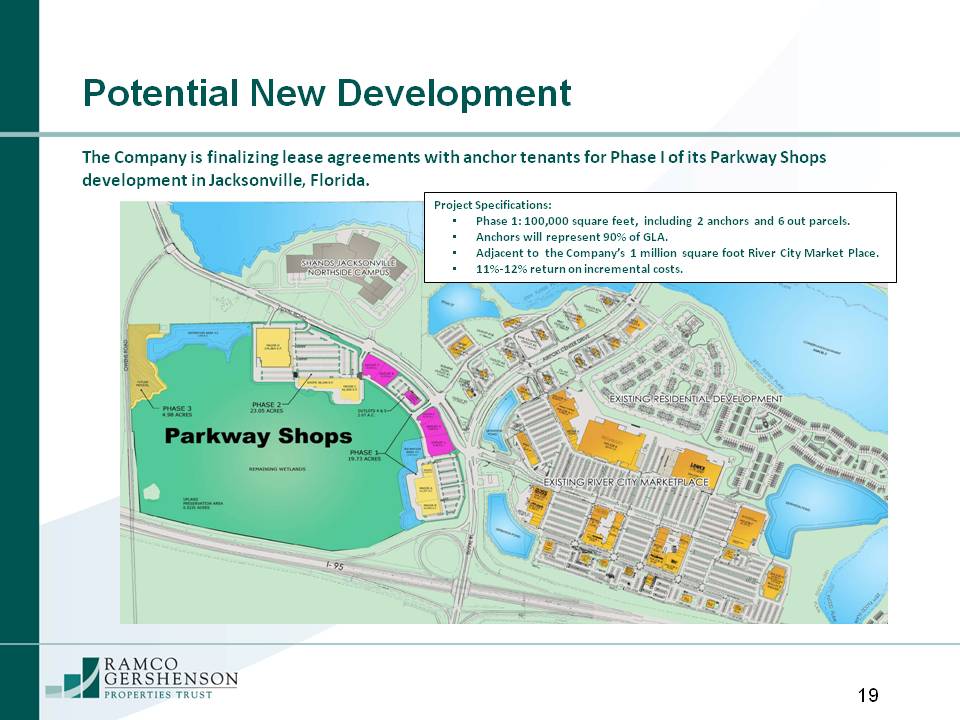
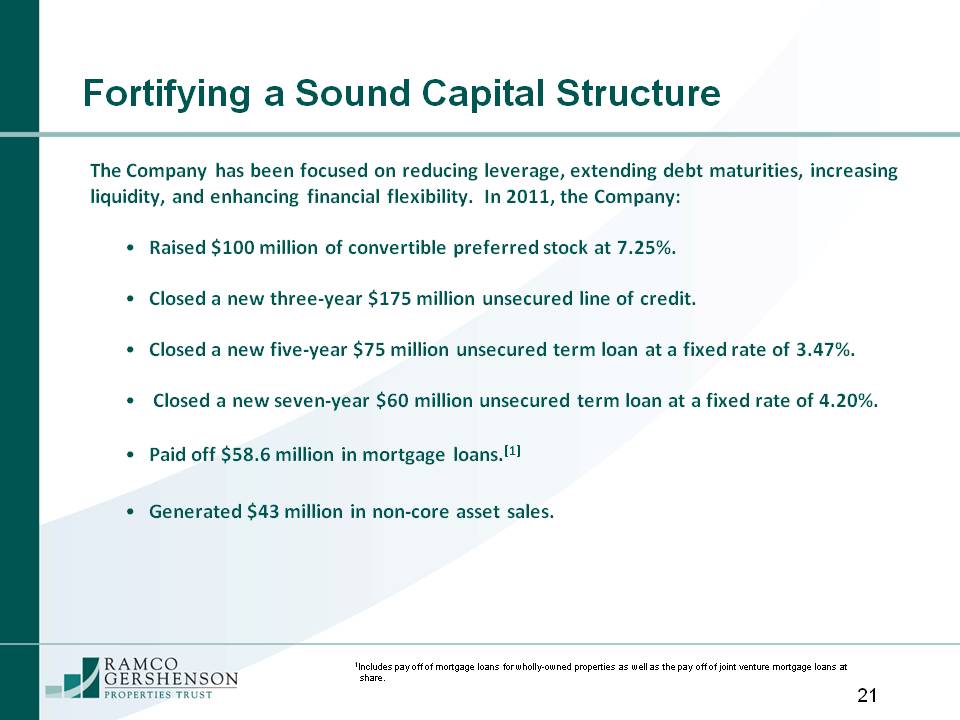
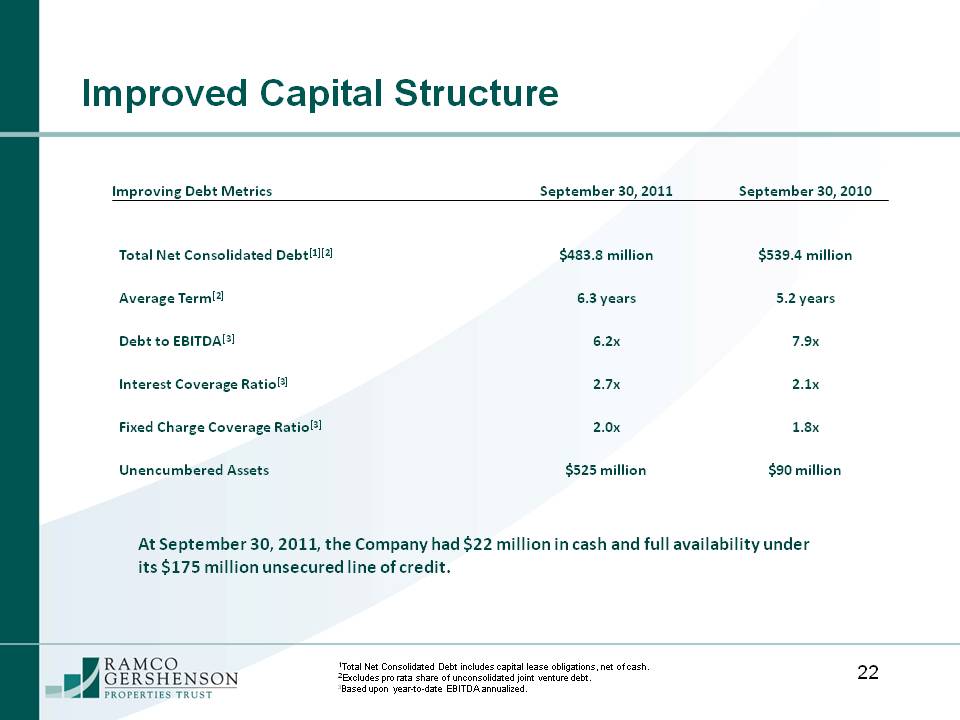
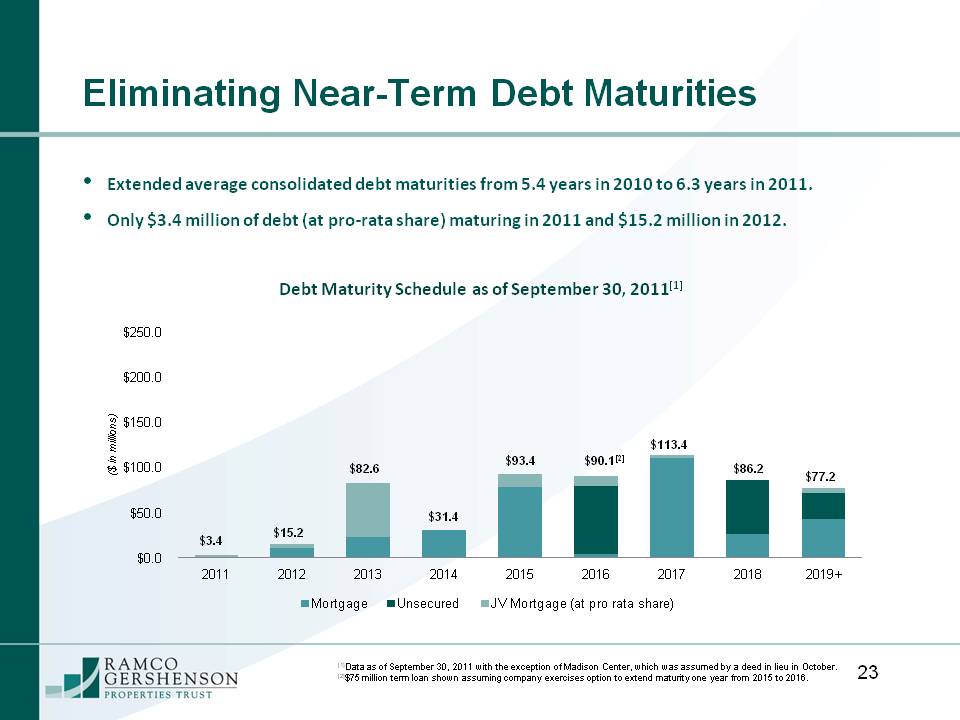
Investor Presentation November 2011 Corporate Mission Ramco-Gershenson is positioning itself to be a leading owner of high-quality "franchise shopping centers” in major metropolitan markets, consisting of both large, national credit, multiple-anchor assets and properties anchored by the leading supermarket in their trade areas. Near-Term Strategic Objectives Drive occupancy and NOI growth through aggressive leasing and asset management initiatives generating substantial increases in per share earnings and net asset value. Execute on our capital recycling program by acquiring additional high-quality, franchise shopping centers in targeted markets utilizing the proceeds generated from sales of non-core properties. Leverage redevelopment and development opportunities to drive additional value and growth. Maintain a strong balance sheet and improve financial flexibility with the objective of reaching investment grade status. Operating Successes Year-to-Date Core Portfolio: Increased core portfolio leased occupancy to 92.8%, compared to 91.0% in 2010. Posted positive same center NOI growth of 0.7%, at the top end of our guidance range. Renewed over 81% of expiring leases, exceeding our historical average of 75%, while achieving a 2.0% increase over prior rental rates. Signed 13 mid-box leases for openings in 2011 and 2012. Capital Recycling: Sold three Florida shopping centers and a CVS out parcel at a blended cap rate of 6.9%. Acquired Heritage Place, a franchise shopping center in St. Louis, at a cap rate of 7.6%. Balance Sheet: Closed a three-year unsecured $175 million credit facility and a five-year $75 million term loan. Closed a $100 million convertible perpetual preferred offering and a $60 million seven-year term loan. Improved net debt to EBITDA to 6.2x, compared to 7.9x for the same period in 2010. Redevelopment/Development: Completed the value-add redevelopment of two shopping centers at a blended return on incremental costs of 11.6%. Commenced the redevelopment of the Shops on Lane Avenue replacing an undersized Whole Foods with their new prototype store in 35,000 square feet. Our Properties Focus on Metropolitan Markets 80% of the Company’s total annualized base rents come from 10 of the top MSA’s in the U.S .[1] Top-market centers have an average trade area population of 173,646 and household income of $82,809. Properties in top markets consist almost exclusively of franchise shopping centers: Large, multiple-anchor shopping centers average 224,000 square feet and contain 3 anchors per center.[2] Above-average grocery sales generated by market leading grocery anchors. Indianapolis Columbus Ft. Lauderdale/P. Beach Milwaukee Jacksonville Atlanta Chicago St. Louis Focus on Franchise Properties: Large, Multiple-Anchor Shopping Centers Property 85301 Main The Company’s franchise shopping centers include market dominant, multiple-anchor properties: 86% of shopping centers in our top markets are anchored by more than one national major retailer.[1] Characteristics of our multiple-anchor franchise shopping centers include: Predominantly located in metropolitan markets with high barriers to entry. Diversified tenant mix of value oriented retailers. Strong NOI growth potential. Dominant locations at major intersections. Focus on Franchise Properties: Market Dominant Supermarket Centers Property 54501 MainRolling Meadows Shopping Center Main The Company’s franchise shopping centers also include market leading grocery-anchored properties: 46% of shopping centers in our top markets are anchored by the leading supermarket in their respective trade areas.[1] Characteristics of our market dominant supermarket franchise shopping centers: High average annual sales of $445 per square foot. Typically contain one additional anchor. Top supermarket tenants include Publix, Kroger, Jewel-Osco, Meijer and Whole Foods. Focus on Diverse, Credit-Quality Tenants Limited risk in current tenant line-up. Local tenancies represent less than 20% of the overall tenant profile. Capitalizing on strong relationships with leading retailers. Top Ten Tenants Credit Rating S&P/Moody's (1) Number of Leases % of Annualized Base Rental Revenue T.J. Maxx/Marshalls A/A3 23 4.4% Home Depot BBB+/A3 3 2.0% Dollar Tree NR/NR 31 1.9% Publix Super Market NR/NR 8 1.8% Kmart/Sears B+/Ba3 6 1.8% OfficeMax B-/B1 11 1.8% Jo-Ann Fabrics B2/B 6 1.7% Burlington Coat Factory NR/NR 5 1.5% PETsMART BB/NR 7 1.5% Bed Bath & Beyond/buybuy Baby BBB+/NR 6 1.5% Aggressive Leasing Efforts Producing Results Asset Management has implemented changes to drive occupancy and NOI: Fortified regional leasing teams with additional agents. Implemented new short-form lease reducing cost and time spent on lease documentation. Compressed the timeline from securing tenant interest through execution to store opening. Improving Operating Metrics YTD 2011 2010 Renewal Retention Rate 81% 75.7% Renewal Leasing Spreads 2.0% -6.0% Leased Occupancy 92.8% 91.0% Same Center NOI 0.7% -1.6% Filling Mid-Box Vacancies with National Retailers In 2011, the Company has reduced its mid-box vacancies by leasing to strong retail draws: Signed 13 new mid-box leases with national, credit-quality tenants including; Bed, Bath & Beyond, buybuy Baby, Marshalls, Ross Dress for Less, PetSmart, DSW Shoe Warehouse, and LA Fitness. Proactively responded to Border’s bankruptcy by releasing two of three stores. As of September 30, 2011, have leased 9 of 11 vacancies created by the bankruptcy of Linens ‘N Things and Circuit City. Finding creative solutions to accommodate mid-box retailers desire for smaller stores. All mid-box retailers signed in 2010 and 2011 will be in occupancy by the end of 2012 achieving full year income in 2013. YTD 2011 2010 Number of new mid-box leases signed 13 23 Unleased mid-boxes at end of reporting period 10 15 Dark and Paying Anchors 4 9 Creating Value through Capital Recycling Non-core Dispositions: Identified disposition properties that are non-franchise shopping centers. Sales will generate capital for investment in franchise shopping centers. Recycling program goals include improving portfolio quality and diversifying markets. Strategic Acquisitions: Purchase high-quality, franchise shopping centers in target markets. Improve trade area demographic profile portfolio wide. Opportunities to drive additional income and value. Recent Acquisition Heritage Place Creve Coeur (St. Louis), Missouri Acquisition Highlights: 270,000 SF grocery-anchored community center in St. Louis MSA market. Anchors include Dierbergs Supermarket, Marshalls, OfficeMax, T.J. Maxx and Petco. 3 mile trade area average population/household income: 57,913/$96,115. Lease-up and repositioning opportunity. Investment Highlights: Franchise shopping center with market dominant grocery and four creditworthy mid-box anchors. Affluent, growing trade area. Target expansion market. RamcoLogoflatValue-Added Redevelopment and Development Property 85501 MainProperty 85401 MainHunter's Square Photo 2 Redevelopment and Development Opportunities The Company has identified a number of future value-add redevelopments designed to diversify the tenant mix, reposition the asset into a franchise shopping center and strengthen the center’s draw within its respective trade area. The Company’s past redevelopments have produced an average return on incremental costs of over 10% while improving the credit quality of the center’s income stream. The Company’s existing pipeline of potential development opportunities will be pursued in response to retailer demand and to produce superior returns on incremental costs. 2011 Redevelopment Dominant, upscale shopping center in close proximity to The Ohio State University being expanded to meet the needs of an affluent trade area. Approximately doubling the size of Whole Foods to new prototype store while eliminating 10,000 square feet of unproductive small shop space. Upon completion, the Whole Foods/Bed, Bath & Beyond anchored shopping center will be 100% occupied. Demographics (5 mile): Population 149,701 HH Income $140,128 Scheduled Completion Date: September 2012 Shops on Lane Avenue Upper Arlington (Columbus), Ohio Whole Foods Market Potential New Development The Company is finalizing lease agreements with anchor tenants for Phase I of its Parkway Shops development in Jacksonville, Florida. Parkway Shops Board Review Project Specifications: Phase 1: 100,000 square feet, including 2 anchors and 6 out parcels. Anchors will represent 90% of GLA. Adjacent to the Company’s 1 million square foot River City Market Place. 11%-12% return on incremental costs. RamcoLogoflatBuilding and Maintaining a Strong Balance Sheet Fortifying a Sound Capital Structure The Company has been focused on reducing leverage, extending debt maturities, increasing liquidity, and enhancing financial flexibility. In 2011, the Company: Raised $100 million of convertible preferred stock at 7.25%. Closed a new three-year $175 million unsecured line of credit. Closed a new five-year $75 million unsecured term loan at a fixed rate of 3.47%. Closed a new seven-year $60 million unsecured term loan at a fixed rate of 4.20%. Paid off $58.6 million in mortgage loans.[1] Generated $43 million in non-core asset sales. 1Includes pay off of mortgage loans for wholly-owned properties as well as the pay of joint venture mortgage loans at share. Improved Capital Structure Improving Debt Metrics September 30, 2011 September 30, 2010 Total Net Consolidated Debt[1][2] $483.8 million $539.4 million Average Term[2] 6.3 years 5.2 years Debt to EBITDA[3] 6.2x 7.9x Interest Coverage Ratio[3] 2.7x 2.1x Fixed Charge Coverage Ratio[3] 2.0x 1.8x Unencumbered Assets $525 million $90 million At September 30, 2011, the Company had $22 million in cash and full availability under its $175 million unsecured line of credit. Eliminating Near-Term Debt Maturities Extended average consolidated debt maturities from 5.4 years in 2010 to 6.3 years in 2011. Only $3.4 million of debt (at pro-rata share) maturing in 2011 and $15.2 million in 2012. $0.0 $50.0 $100.0 $150.0 $200.0 $250.0 2011 2012 2013 2014 2015 2016 2017 2018 2019+ ($ in millions) Mortgage Unsecured JV Mortgage (at pro rata share) $15.2 $82.6 $31.4 $93.4 $77.2 Debt Maturity Schedule as of September 30, 2011[1] $90.1[2] $3.4 $113.4 $86.2 Positioned for Growth Significant embedded growth potential is being realized in the Company’s portfolio of high-quality franchise shopping centers driven by aggressive leasing and asset management initiatives. Improving the character of the trade areas demographic profile and upgrading the caliber of the Company’s income stream through capital recycling will promote a more secure asset base and higher quality earnings while generating the opportunity to add value. Pursuing redevelopments that generate above-average returns on investment and increase net asset value; as well as ramping up the Company’s development program in response to tenant demand will generate significant risk adjusted returns over the next several years. Maintaining a strong balance sheet with financial flexibility will protect the Company against the consequences of future complications in the financial markets and enable us to seize growth opportunities as they arise. Safe Harbor Statement Information included herein contains forward-looking statements within the meaning of Section 27A of the Securities Act of 1933, as amended, or the “Securities Act”, and Section 21E of the Securities Exchange Act of 1934, as amended, or the “Exchange Act.” You can identify these forward-looking statements by our use of the words “believe,” “anticipate,” “plan,” “expect,” “may,” “might,” “should,” “will,” “intend,” “estimate,” “predict” and similar expressions, whether in the negative or affirmative. These forward-looking statements represent our expectations or beliefs concerning future events, including: statements regarding future developments and joint ventures, rents, returns, and earnings; statements regarding the continuation of trends; and any statements regarding the sufficiency of our cash balances and cash generated from operating, investing, and financing activities for our future liquidity and capital resource needs. We caution that although forward-looking statements reflect our good faith beliefs and reasonable judgment based upon current information, these statements are not guarantees of future performance and are qualified by important factors that could cause actual results to differ materially from those in the forward-looking statements, because of risks, uncertainties, and factors including, but not limited to: the final size of the offering; our success or failure in implementing our business strategy; economic conditions generally and in the commercial real estate and finance markets specifically; our cost of capital, which depends in part on our asset quality, our relationships with lenders and other capital providers; our business prospects and outlook; changes in governmental regulations, tax rates and similar matters; and our continuing to qualify as a REIT. Further, we have included important factors under the heading “Risk Factors” and elsewhere in our Annual Report on Form 10-K for the year ended December 31, 2010, and other periodic reports, that we believe could cause our actual results to differ materially from the forward-looking statements that we make. All forward-looking statements are made as of the date hereof or the date specified herein, based on information available to us as of such date. Except as required by law, we do not undertake any obligation to update our forward-looking statements or the risk factors contained herein to reflect new information or future events or otherwise. You are cautioned not to place undue reliance on forward-looking statements. Ramco Investor Presentation November 2011